Island Park, ID Map & Demographics
Island Park Map
Island Park Overview
$50,215
PER CAPITA INCOME
$88,000
AVG FAMILY INCOME
$68,333
AVG HOUSEHOLD INCOME
40.0%
WAGE / INCOME GAP [ % ]
60.0¢/ $1
WAGE / INCOME GAP [ $ ]
0.50
INEQUALITY / GINI INDEX
144
TOTAL POPULATION
79
MALE POPULATION
65
FEMALE POPULATION
121.54
MALES / 100 FEMALES
82.28
FEMALES / 100 MALES
64.5
MEDIAN AGE
2.4
AVG FAMILY SIZE
2.1
AVG HOUSEHOLD SIZE
60
LABOR FORCE [ PEOPLE ]
43.2%
PERCENT IN LABOR FORCE
Island Park Zip Codes
Island Park Area Codes
Income in Island Park
Income Overview in Island Park
Per Capita Income in Island Park is $50,215, while median incomes of families and households are $88,000 and $68,333 respectively.
| Characteristic | Number | Measure |
| Per Capita Income | 144 | $50,215 |
| Median Family Income | 46 | $88,000 |
| Mean Family Income | 46 | $124,622 |
| Median Household Income | 70 | $68,333 |
| Mean Household Income | 70 | $93,526 |
| Income Deficit | 46 | $0 |
| Wage / Income Gap (%) | 144 | 40.04% |
| Wage / Income Gap ($) | 144 | 59.96¢ per $1 |
| Gini / Inequality Index | 144 | 0.50 |
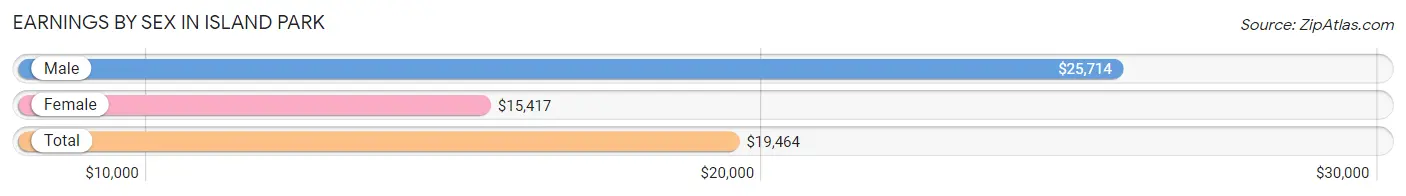
Earnings by Sex in Island Park
Average Earnings in Island Park are $19,464, $25,714 for men and $15,417 for women, a difference of 40.0%.
| Sex | Number | Average Earnings |
| Male | 38 (55.1%) | $25,714 |
| Female | 31 (44.9%) | $15,417 |
| Total | 69 (100.0%) | $19,464 |
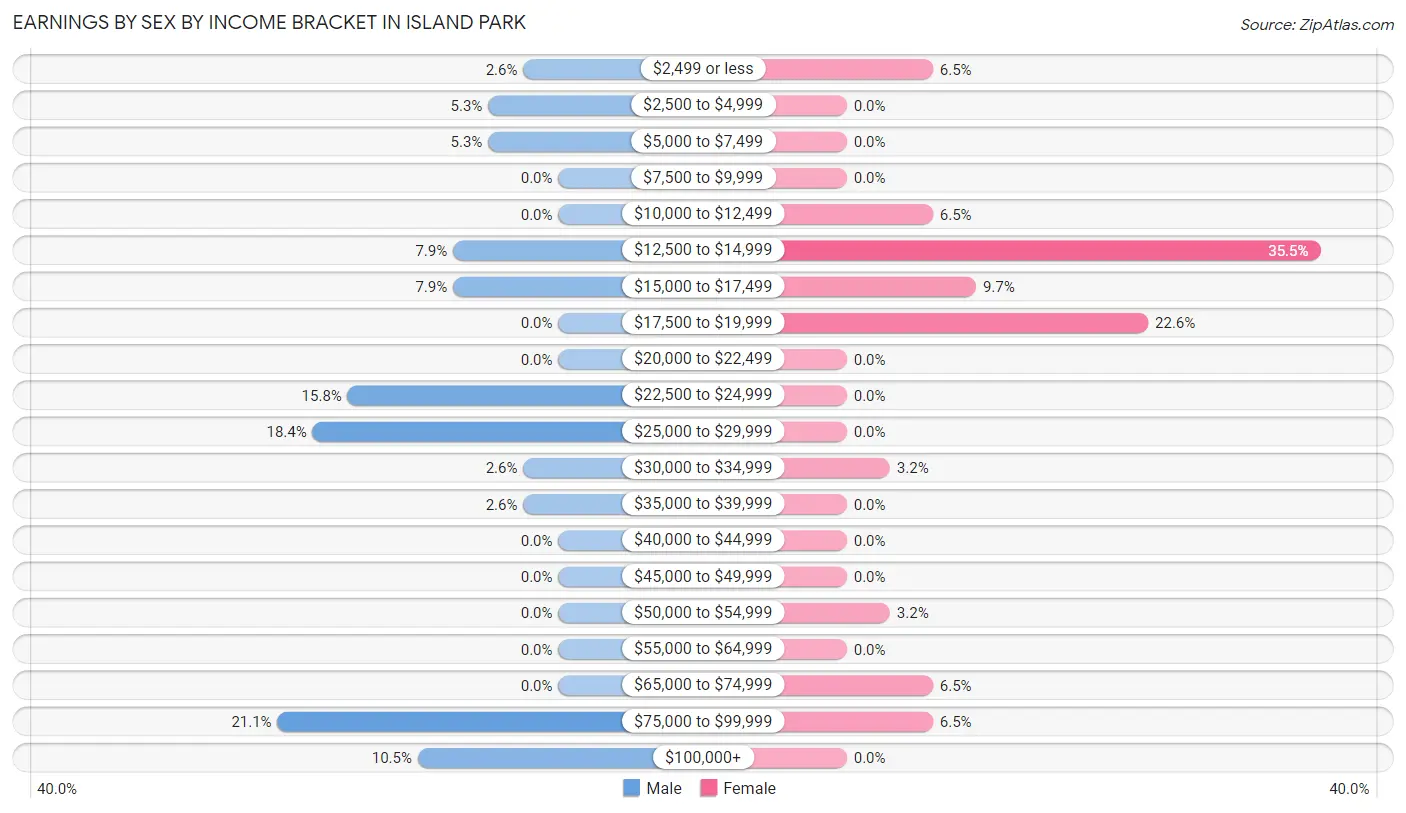
Earnings by Sex by Income Bracket in Island Park
The most common earnings brackets in Island Park are $75,000 to $99,999 for men (8 | 21.0%) and $12,500 to $14,999 for women (11 | 35.5%).
| Income | Male | Female |
| $2,499 or less | 1 (2.6%) | 2 (6.5%) |
| $2,500 to $4,999 | 2 (5.3%) | 0 (0.0%) |
| $5,000 to $7,499 | 2 (5.3%) | 0 (0.0%) |
| $7,500 to $9,999 | 0 (0.0%) | 0 (0.0%) |
| $10,000 to $12,499 | 0 (0.0%) | 2 (6.5%) |
| $12,500 to $14,999 | 3 (7.9%) | 11 (35.5%) |
| $15,000 to $17,499 | 3 (7.9%) | 3 (9.7%) |
| $17,500 to $19,999 | 0 (0.0%) | 7 (22.6%) |
| $20,000 to $22,499 | 0 (0.0%) | 0 (0.0%) |
| $22,500 to $24,999 | 6 (15.8%) | 0 (0.0%) |
| $25,000 to $29,999 | 7 (18.4%) | 0 (0.0%) |
| $30,000 to $34,999 | 1 (2.6%) | 1 (3.2%) |
| $35,000 to $39,999 | 1 (2.6%) | 0 (0.0%) |
| $40,000 to $44,999 | 0 (0.0%) | 0 (0.0%) |
| $45,000 to $49,999 | 0 (0.0%) | 0 (0.0%) |
| $50,000 to $54,999 | 0 (0.0%) | 1 (3.2%) |
| $55,000 to $64,999 | 0 (0.0%) | 0 (0.0%) |
| $65,000 to $74,999 | 0 (0.0%) | 2 (6.5%) |
| $75,000 to $99,999 | 8 (21.0%) | 2 (6.5%) |
| $100,000+ | 4 (10.5%) | 0 (0.0%) |
| Total | 38 (100.0%) | 31 (100.0%) |
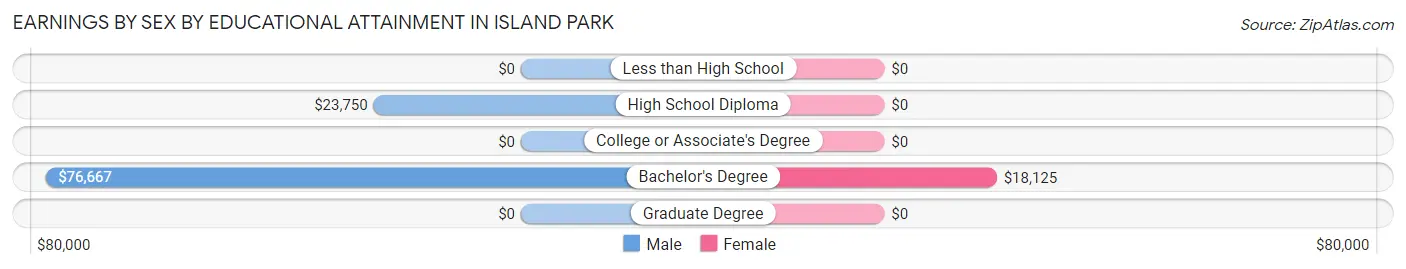
Earnings by Sex by Educational Attainment in Island Park
Average earnings in Island Park are $26,250 for men and $17,500 for women, a difference of 33.3%. Men with an educational attainment of bachelor's degree enjoy the highest average annual earnings of $76,667, while those with high school diploma education earn the least with $23,750. Women with an educational attainment of bachelor's degree earn the most with the average annual earnings of $18,125, while those with bachelor's degree education have the smallest earnings of $18,125.
| Educational Attainment | Male Income | Female Income |
| Less than High School | - | - |
| High School Diploma | $23,750 | $0 |
| College or Associate's Degree | - | - |
| Bachelor's Degree | $76,667 | $18,125 |
| Graduate Degree | - | - |
| Total | $26,250 | $17,500 |
Family Income in Island Park
Family Income Brackets in Island Park
According to the Island Park family income data, there are 15 families falling into the $75,000 to $99,999 income range, which is the most common income bracket and makes up 32.6% of all families.
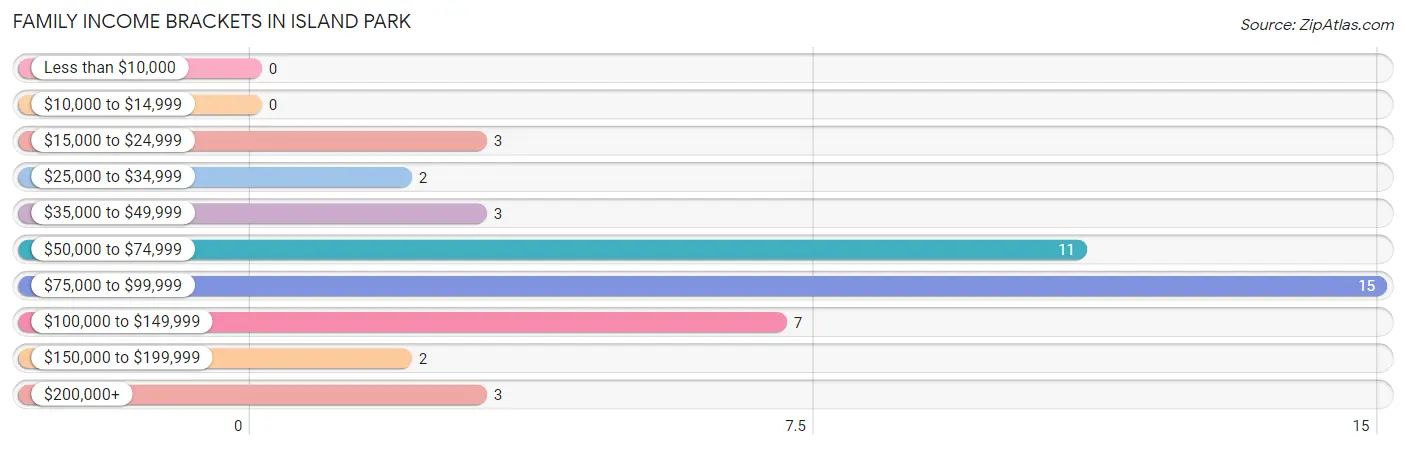
| Income Bracket | # Families | % Families |
| Less than $10,000 | 0 | 0.0% |
| $10,000 to $14,999 | 0 | 0.0% |
| $15,000 to $24,999 | 3 | 6.5% |
| $25,000 to $34,999 | 2 | 4.3% |
| $35,000 to $49,999 | 3 | 6.5% |
| $50,000 to $74,999 | 11 | 23.9% |
| $75,000 to $99,999 | 15 | 32.6% |
| $100,000 to $149,999 | 7 | 15.2% |
| $150,000 to $199,999 | 2 | 4.3% |
| $200,000+ | 3 | 6.5% |
Family Income by Famaliy Size in Island Park
3-person families (8 | 17.4%) account for the highest median family income in Island Park with $94,167 per family, while 2-person families (29 | 63.0%) have the highest median income of $44,625 per family member.
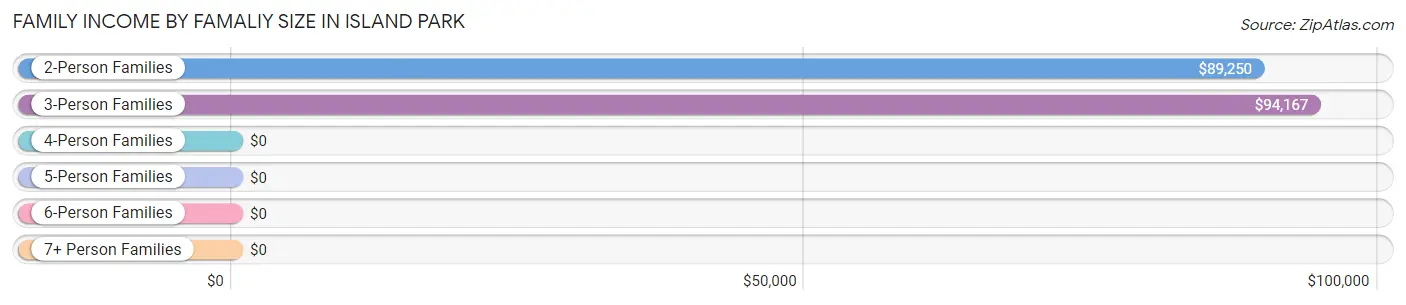
| Income Bracket | # Families | Median Income |
| 2-Person Families | 29 (63.0%) | $89,250 |
| 3-Person Families | 8 (17.4%) | $94,167 |
| 4-Person Families | 9 (19.6%) | $0 |
| 5-Person Families | 0 (0.0%) | $0 |
| 6-Person Families | 0 (0.0%) | $0 |
| 7+ Person Families | 0 (0.0%) | $0 |
| Total | 46 (100.0%) | $88,000 |
Family Income by Number of Earners in Island Park
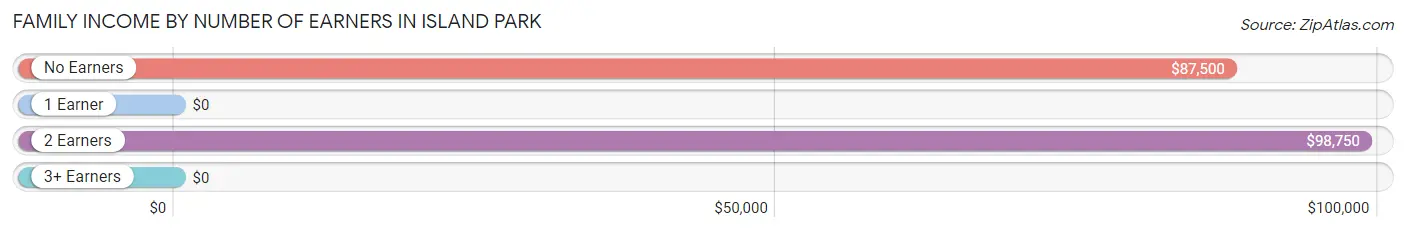
| Number of Earners | # Families | Median Income |
| No Earners | 18 (39.1%) | $87,500 |
| 1 Earner | 8 (17.4%) | $0 |
| 2 Earners | 14 (30.4%) | $98,750 |
| 3+ Earners | 6 (13.0%) | $0 |
| Total | 46 (100.0%) | $88,000 |
Household Income in Island Park
Household Income Brackets in Island Park
With 21 households falling in the category, the $25,000 to $34,999 income range is the most frequent in Island Park, accounting for 30.0% of all households.
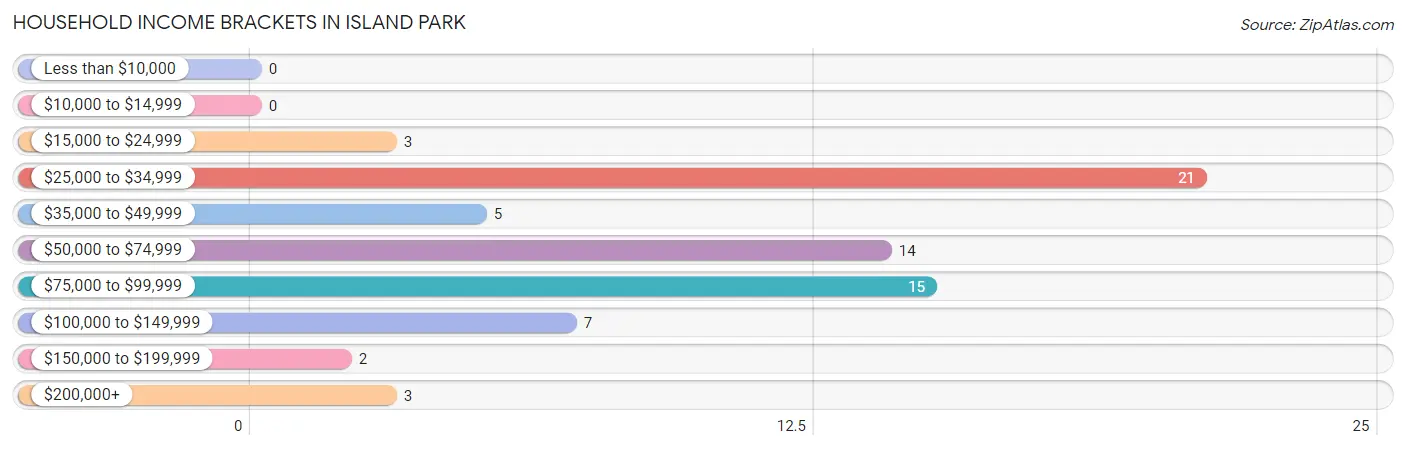
| Income Bracket | # Households | % Households |
| Less than $10,000 | 0 | 0.0% |
| $10,000 to $14,999 | 0 | 0.0% |
| $15,000 to $24,999 | 3 | 4.3% |
| $25,000 to $34,999 | 21 | 30.0% |
| $35,000 to $49,999 | 5 | 7.1% |
| $50,000 to $74,999 | 14 | 20.0% |
| $75,000 to $99,999 | 15 | 21.4% |
| $100,000 to $149,999 | 7 | 10.0% |
| $150,000 to $199,999 | 2 | 2.9% |
| $200,000+ | 3 | 4.3% |
Household Income by Householder Age in Island Park
The median household income in Island Park is $68,333, with the highest median household income of $68,542 found in the 45 to 64 years age bracket for the primary householder. A total of 29 households (41.4%) fall into this category.
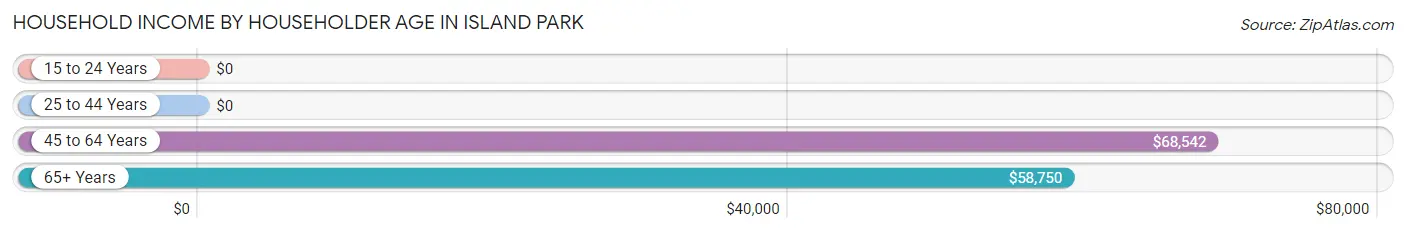
| Income Bracket | # Households | Median Income |
| 15 to 24 Years | 0 (0.0%) | $0 |
| 25 to 44 Years | 1 (1.4%) | $0 |
| 45 to 64 Years | 29 (41.4%) | $68,542 |
| 65+ Years | 40 (57.1%) | $58,750 |
| Total | 70 (100.0%) | $68,333 |
Poverty in Island Park
Income Below Poverty by Sex and Age in Island Park
With 7.6% poverty level for males and 20.0% for females among the residents of Island Park, under 5 year old males and 6 to 11 year old females are the most vulnerable to poverty, with 1 males (100.0%) and 2 females (100.0%) in their respective age groups living below the poverty level.
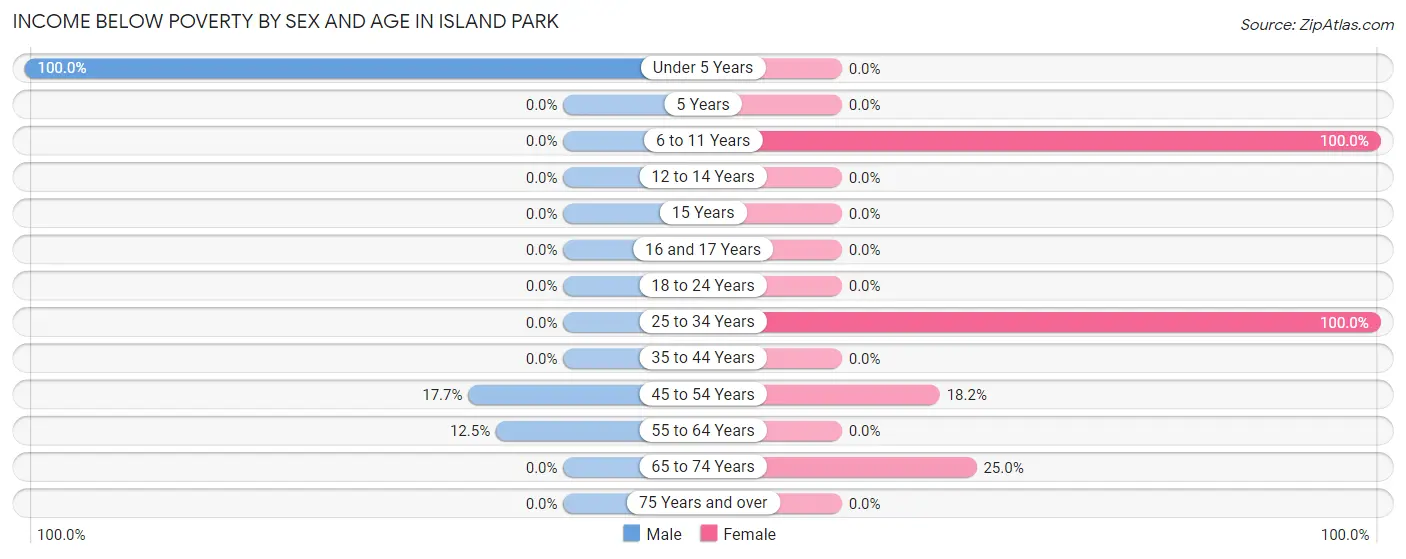
| Age Bracket | Male | Female |
| Under 5 Years | 1 (100.0%) | 0 (0.0%) |
| 5 Years | 0 (0.0%) | 0 (0.0%) |
| 6 to 11 Years | 0 (0.0%) | 2 (100.0%) |
| 12 to 14 Years | 0 (0.0%) | 0 (0.0%) |
| 15 Years | 0 (0.0%) | 0 (0.0%) |
| 16 and 17 Years | 0 (0.0%) | 0 (0.0%) |
| 18 to 24 Years | 0 (0.0%) | 0 (0.0%) |
| 25 to 34 Years | 0 (0.0%) | 2 (100.0%) |
| 35 to 44 Years | 0 (0.0%) | 0 (0.0%) |
| 45 to 54 Years | 3 (17.6%) | 2 (18.2%) |
| 55 to 64 Years | 2 (12.5%) | 0 (0.0%) |
| 65 to 74 Years | 0 (0.0%) | 7 (25.0%) |
| 75 Years and over | 0 (0.0%) | 0 (0.0%) |
| Total | 6 (7.6%) | 13 (20.0%) |
Income Above Poverty by Sex and Age in Island Park
According to the poverty statistics in Island Park, males aged 6 to 11 years and females aged 16 and 17 years are the age groups that are most secure financially, with 100.0% of males and 100.0% of females in these age groups living above the poverty line.
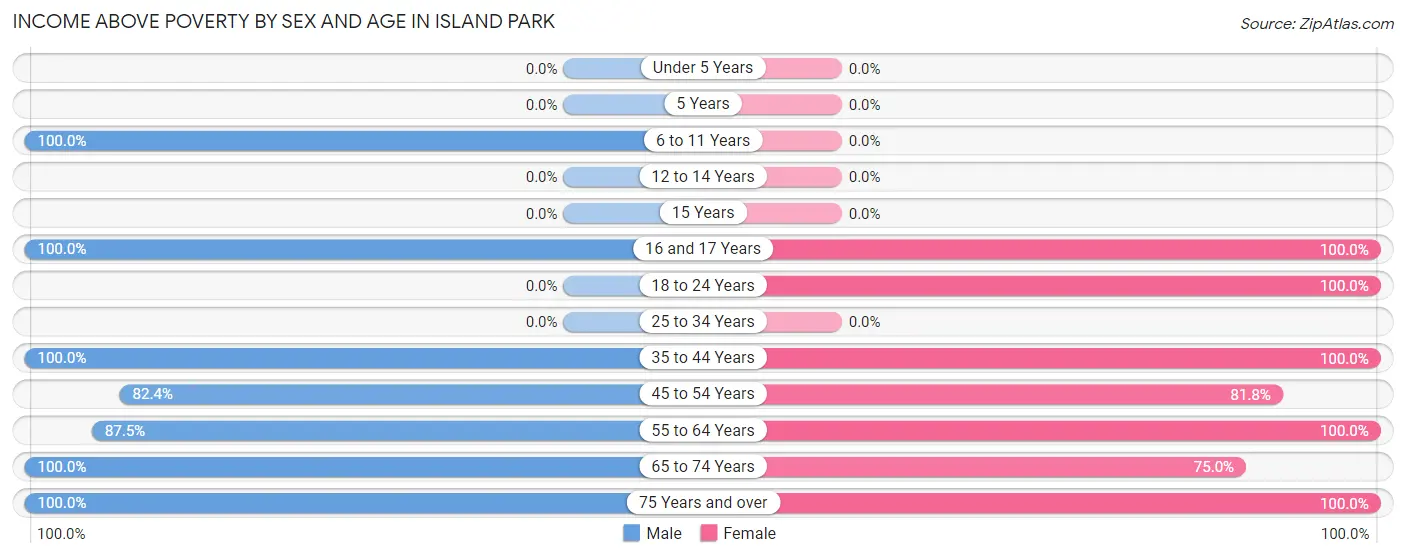
| Age Bracket | Male | Female |
| Under 5 Years | 0 (0.0%) | 0 (0.0%) |
| 5 Years | 0 (0.0%) | 0 (0.0%) |
| 6 to 11 Years | 2 (100.0%) | 0 (0.0%) |
| 12 to 14 Years | 0 (0.0%) | 0 (0.0%) |
| 15 Years | 0 (0.0%) | 0 (0.0%) |
| 16 and 17 Years | 3 (100.0%) | 1 (100.0%) |
| 18 to 24 Years | 0 (0.0%) | 5 (100.0%) |
| 25 to 34 Years | 0 (0.0%) | 0 (0.0%) |
| 35 to 44 Years | 2 (100.0%) | 3 (100.0%) |
| 45 to 54 Years | 14 (82.4%) | 9 (81.8%) |
| 55 to 64 Years | 14 (87.5%) | 10 (100.0%) |
| 65 to 74 Years | 32 (100.0%) | 21 (75.0%) |
| 75 Years and over | 6 (100.0%) | 3 (100.0%) |
| Total | 73 (92.4%) | 52 (80.0%) |
Income Below Poverty Among Married-Couple Families in Island Park
The poverty statistics for married-couple families in Island Park show that 6.5% or 3 of the total 46 families live below the poverty line. Families with 1 or 2 children have the highest poverty rate of 20.0%, comprising of 3 families. On the other hand, families with no children have the lowest poverty rate of 0.0%, which includes 0 families.
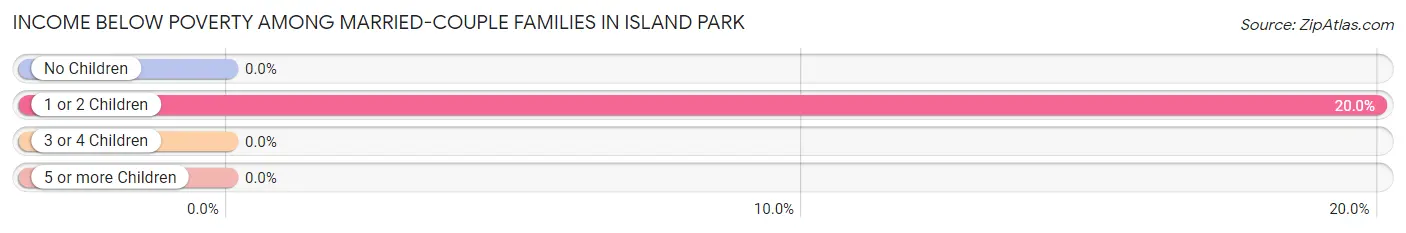
| Children | Above Poverty | Below Poverty |
| No Children | 31 (100.0%) | 0 (0.0%) |
| 1 or 2 Children | 12 (80.0%) | 3 (20.0%) |
| 3 or 4 Children | 0 (0.0%) | 0 (0.0%) |
| 5 or more Children | 0 (0.0%) | 0 (0.0%) |
| Total | 43 (93.5%) | 3 (6.5%) |
Income Below Poverty Among Single-Parent Households in Island Park
| Children | Single Father | Single Mother |
| No Children | 0 (0.0%) | 0 (0.0%) |
| 1 or 2 Children | 0 (0.0%) | 0 (0.0%) |
| 3 or 4 Children | 0 (0.0%) | 0 (0.0%) |
| 5 or more Children | 0 (0.0%) | 0 (0.0%) |
| Total | 0 (0.0%) | 0 (0.0%) |
Income Below Poverty Among Married-Couple vs Single-Parent Households in Island Park
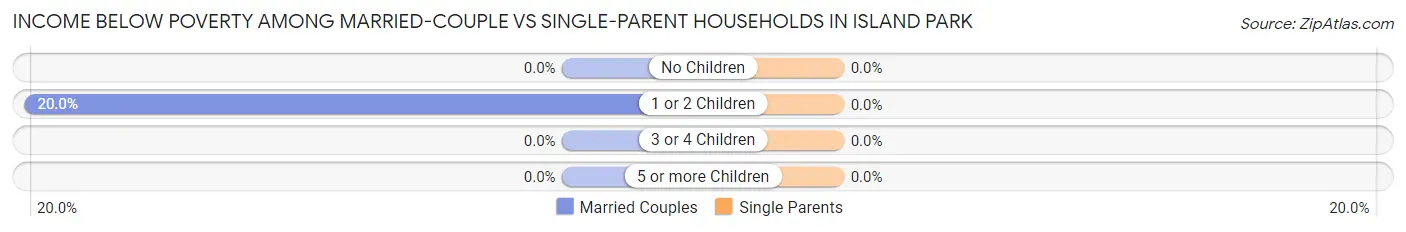
| Children | Married-Couple Families | Single-Parent Households |
| No Children | 0 (0.0%) | 0 (0.0%) |
| 1 or 2 Children | 3 (20.0%) | 0 (0.0%) |
| 3 or 4 Children | 0 (0.0%) | 0 (0.0%) |
| 5 or more Children | 0 (0.0%) | 0 (0.0%) |
| Total | 3 (6.5%) | 0 (0.0%) |
Race in Island Park
The most populous races in Island Park are , and White / Caucasian (144 | 100.0%).
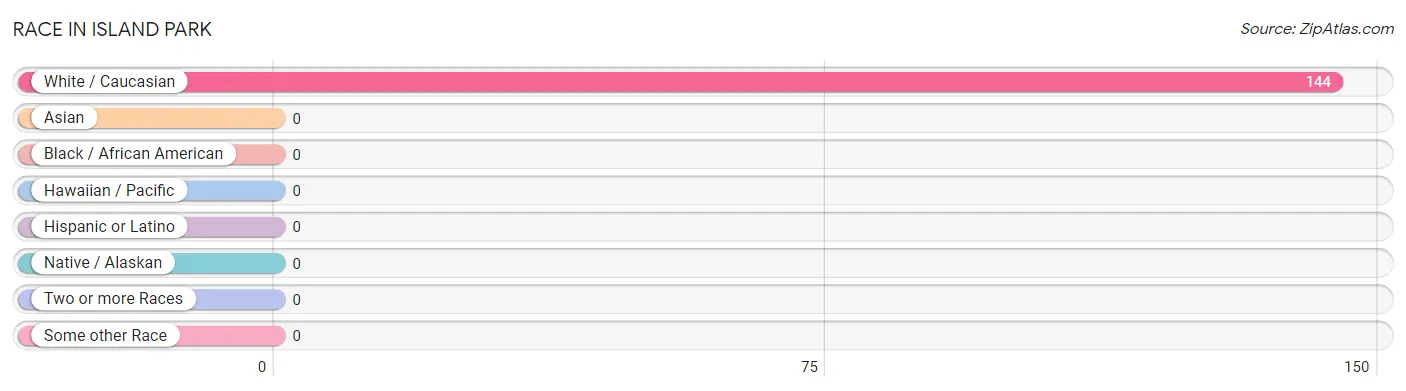
| Race | # Population | % Population |
| Asian | 0 | 0.0% |
| Black / African American | 0 | 0.0% |
| Hawaiian / Pacific | 0 | 0.0% |
| Hispanic or Latino | 0 | 0.0% |
| Native / Alaskan | 0 | 0.0% |
| White / Caucasian | 144 | 100.0% |
| Two or more Races | 0 | 0.0% |
| Some other Race | 0 | 0.0% |
| Total | 144 | 100.0% |
Ancestry in Island Park
The most populous ancestries reported in Island Park are English (60 | 41.7%), German (28 | 19.4%), Polish (23 | 16.0%), Irish (12 | 8.3%), and Scandinavian (12 | 8.3%), together accounting for 93.7% of all Island Park residents.
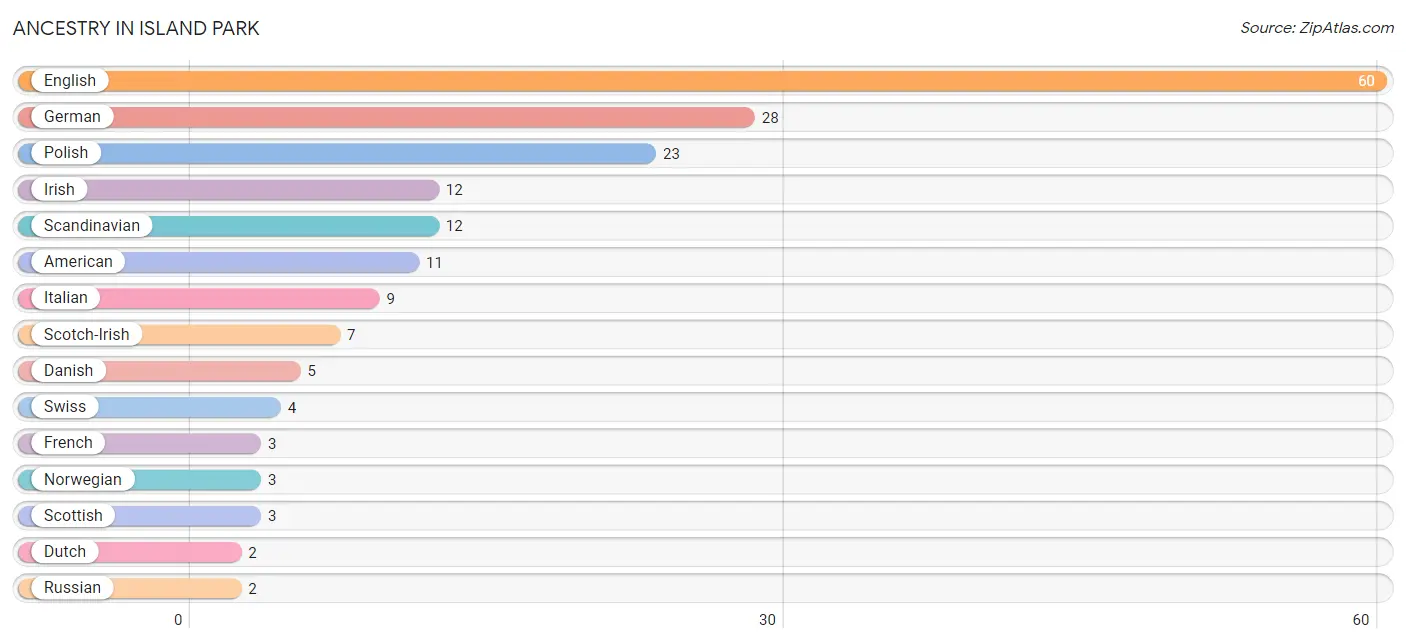
| Ancestry | # Population | % Population |
| American | 11 | 7.6% |
| Danish | 5 | 3.5% |
| Dutch | 2 | 1.4% |
| English | 60 | 41.7% |
| French | 3 | 2.1% |
| German | 28 | 19.4% |
| Irish | 12 | 8.3% |
| Italian | 9 | 6.2% |
| Norwegian | 3 | 2.1% |
| Polish | 23 | 16.0% |
| Russian | 2 | 1.4% |
| Scandinavian | 12 | 8.3% |
| Scotch-Irish | 7 | 4.9% |
| Scottish | 3 | 2.1% |
| Swedish | 1 | 0.7% |
| Swiss | 4 | 2.8% | View All 16 Rows |
Immigrants in Island Park
The most numerous immigrant groups reported in Island Park came from , and Canada (2 | 1.4%), together accounting for 1.4% of all Island Park residents.

| Immigration Origin | # Population | % Population |
| Canada | 2 | 1.4% | View All 1 Rows |
Sex and Age in Island Park
Sex and Age in Island Park
The most populous age groups in Island Park are 50 to 54 Years (17 | 21.5%) for men and 70 to 74 Years (15 | 23.1%) for women.
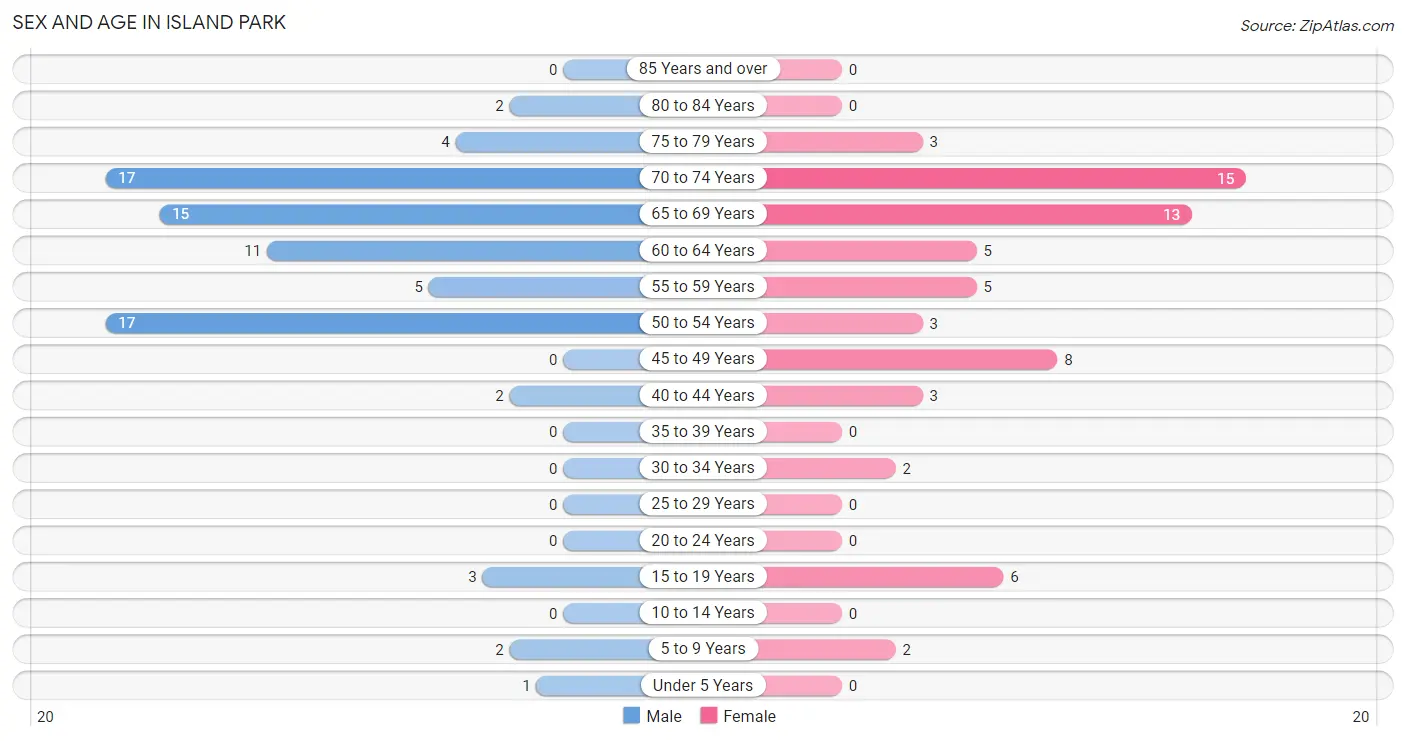
| Age Bracket | Male | Female |
| Under 5 Years | 1 (1.3%) | 0 (0.0%) |
| 5 to 9 Years | 2 (2.5%) | 2 (3.1%) |
| 10 to 14 Years | 0 (0.0%) | 0 (0.0%) |
| 15 to 19 Years | 3 (3.8%) | 6 (9.2%) |
| 20 to 24 Years | 0 (0.0%) | 0 (0.0%) |
| 25 to 29 Years | 0 (0.0%) | 0 (0.0%) |
| 30 to 34 Years | 0 (0.0%) | 2 (3.1%) |
| 35 to 39 Years | 0 (0.0%) | 0 (0.0%) |
| 40 to 44 Years | 2 (2.5%) | 3 (4.6%) |
| 45 to 49 Years | 0 (0.0%) | 8 (12.3%) |
| 50 to 54 Years | 17 (21.5%) | 3 (4.6%) |
| 55 to 59 Years | 5 (6.3%) | 5 (7.7%) |
| 60 to 64 Years | 11 (13.9%) | 5 (7.7%) |
| 65 to 69 Years | 15 (19.0%) | 13 (20.0%) |
| 70 to 74 Years | 17 (21.5%) | 15 (23.1%) |
| 75 to 79 Years | 4 (5.1%) | 3 (4.6%) |
| 80 to 84 Years | 2 (2.5%) | 0 (0.0%) |
| 85 Years and over | 0 (0.0%) | 0 (0.0%) |
| Total | 79 (100.0%) | 65 (100.0%) |
Families and Households in Island Park
Median Family Size in Island Park
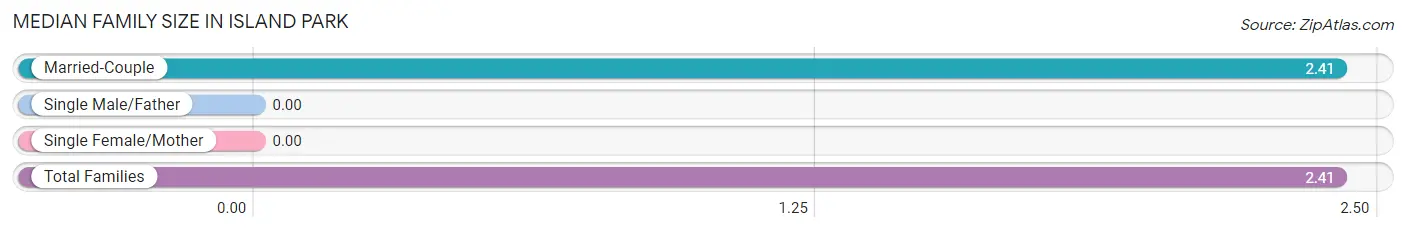
| Family Type | # Families | Family Size |
| Married-Couple | 46 (100.0%) | 2.41 |
| Single Male/Father | 0 (0.0%) | - |
| Single Female/Mother | 0 (0.0%) | - |
| Total Families | 46 (100.0%) | 2.41 |
Median Household Size in Island Park
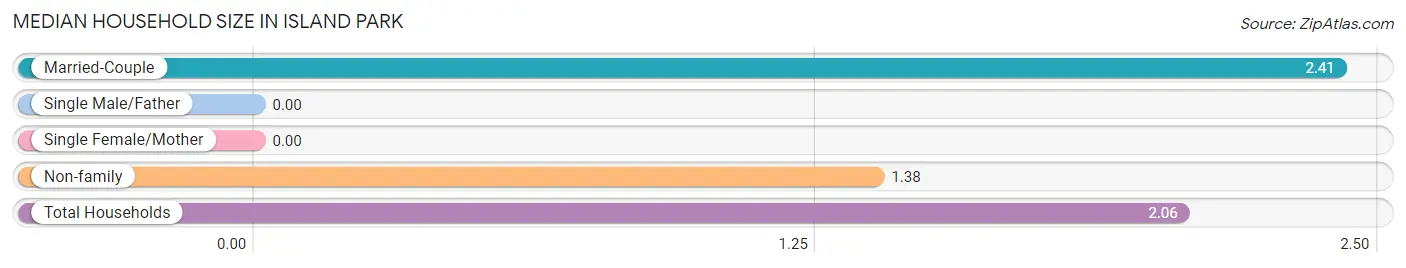
| Household Type | # Households | Household Size |
| Married-Couple | 46 (65.7%) | 2.41 |
| Single Male/Father | 0 (0.0%) | - |
| Single Female/Mother | 0 (0.0%) | - |
| Non-family | 24 (34.3%) | 1.38 |
| Total Households | 70 (100.0%) | 2.06 |
Household Size by Marriage Status in Island Park
Out of a total of 70 households in Island Park, 46 (65.7%) are family households, while 24 (34.3%) are nonfamily households. The most numerous type of family households are 2-person households, comprising 29, and the most common type of nonfamily households are 1-person households, comprising 15.
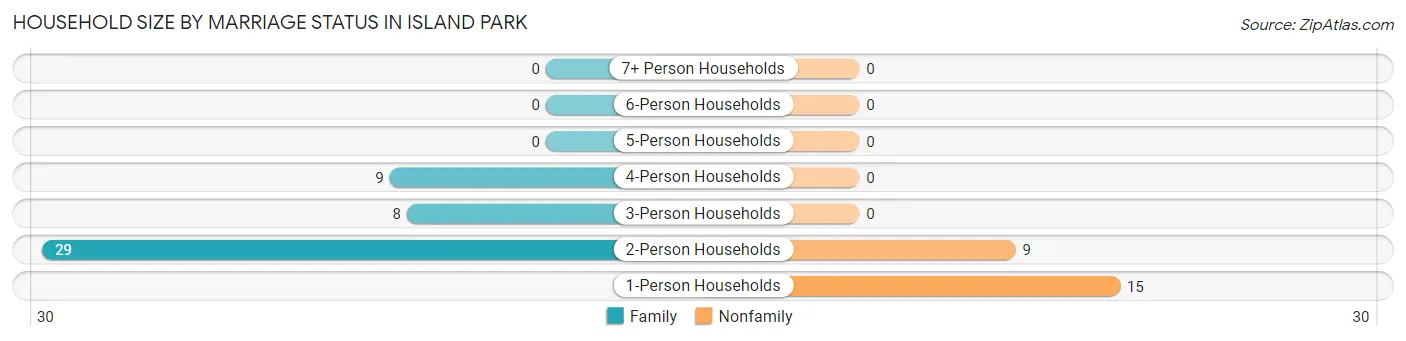
| Household Size | Family Households | Nonfamily Households |
| 1-Person Households | - | 15 (21.4%) |
| 2-Person Households | 29 (41.4%) | 9 (12.9%) |
| 3-Person Households | 8 (11.4%) | 0 (0.0%) |
| 4-Person Households | 9 (12.9%) | 0 (0.0%) |
| 5-Person Households | 0 (0.0%) | 0 (0.0%) |
| 6-Person Households | 0 (0.0%) | 0 (0.0%) |
| 7+ Person Households | 0 (0.0%) | 0 (0.0%) |
| Total | 46 (65.7%) | 24 (34.3%) |
Female Fertility in Island Park
Fertility by Age in Island Park
| Age Bracket | Women with Births | Births / 1,000 Women |
| 15 to 19 years | 0 (0.0%) | 0.0 |
| 20 to 34 years | 0 (0.0%) | 0.0 |
| 35 to 50 years | 0 (0.0%) | 0.0 |
| Total | 0 (0.0%) | 0.0 |
Fertility by Age by Marriage Status in Island Park
| Age Bracket | Married | Unmarried |
| 15 to 19 years | 0 (0.0%) | 0 (0.0%) |
| 20 to 34 years | 0 (0.0%) | 0 (0.0%) |
| 35 to 50 years | 0 (0.0%) | 0 (0.0%) |
| Total | 0 (0.0%) | 0 (0.0%) |
Fertility by Education in Island Park
| Educational Attainment | Women with Births | Births / 1,000 Women |
| Less than High School | 0 (0.0%) | 0.0 |
| High School Diploma | 0 (0.0%) | 0.0 |
| College or Associate's Degree | 0 (0.0%) | 0.0 |
| Bachelor's Degree | 0 (0.0%) | 0.0 |
| Graduate Degree | 0 (0.0%) | 0.0 |
| Total | 0 (0.0%) | 0.0 |
Fertility by Education by Marriage Status in Island Park
| Educational Attainment | Married | Unmarried |
| Less than High School | 0 (0.0%) | 0 (0.0%) |
| High School Diploma | 0 (0.0%) | 0 (0.0%) |
| College or Associate's Degree | 0 (0.0%) | 0 (0.0%) |
| Bachelor's Degree | 0 (0.0%) | 0 (0.0%) |
| Graduate Degree | 0 (0.0%) | 0 (0.0%) |
| Total | 0 (0.0%) | 0 (0.0%) |
Employment Characteristics in Island Park
Employment by Class of Employer in Island Park
Among the 60 employed individuals in Island Park, private company employees (27 | 45.0%), self-employed (incorporated) (18 | 30.0%), and self-employed (not incorporated) (7 | 11.7%) make up the most common classes of employment.
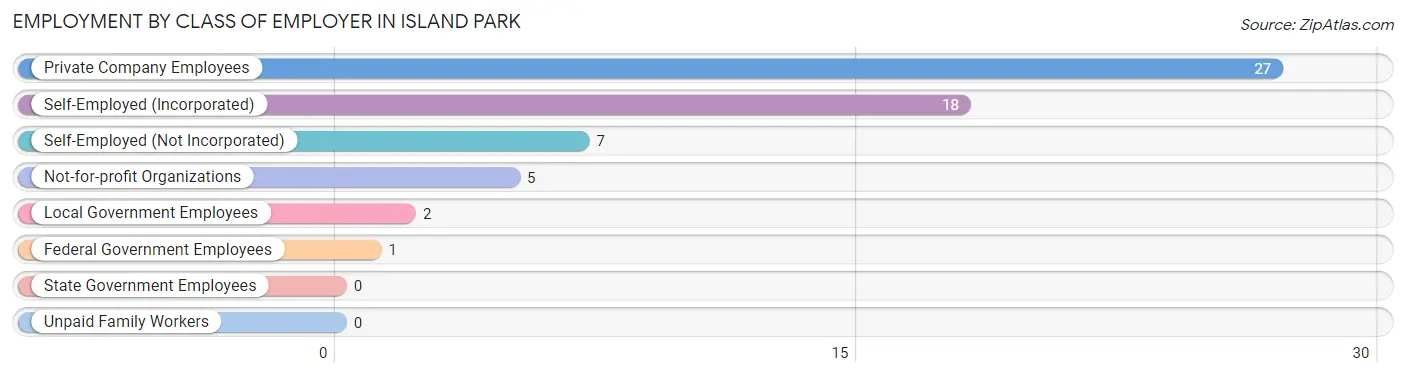
| Employer Class | # Employees | % Employees |
| Private Company Employees | 27 | 45.0% |
| Self-Employed (Incorporated) | 18 | 30.0% |
| Self-Employed (Not Incorporated) | 7 | 11.7% |
| Not-for-profit Organizations | 5 | 8.3% |
| Local Government Employees | 2 | 3.3% |
| State Government Employees | 0 | 0.0% |
| Federal Government Employees | 1 | 1.7% |
| Unpaid Family Workers | 0 | 0.0% |
| Total | 60 | 100.0% |
Employment Status by Age in Island Park
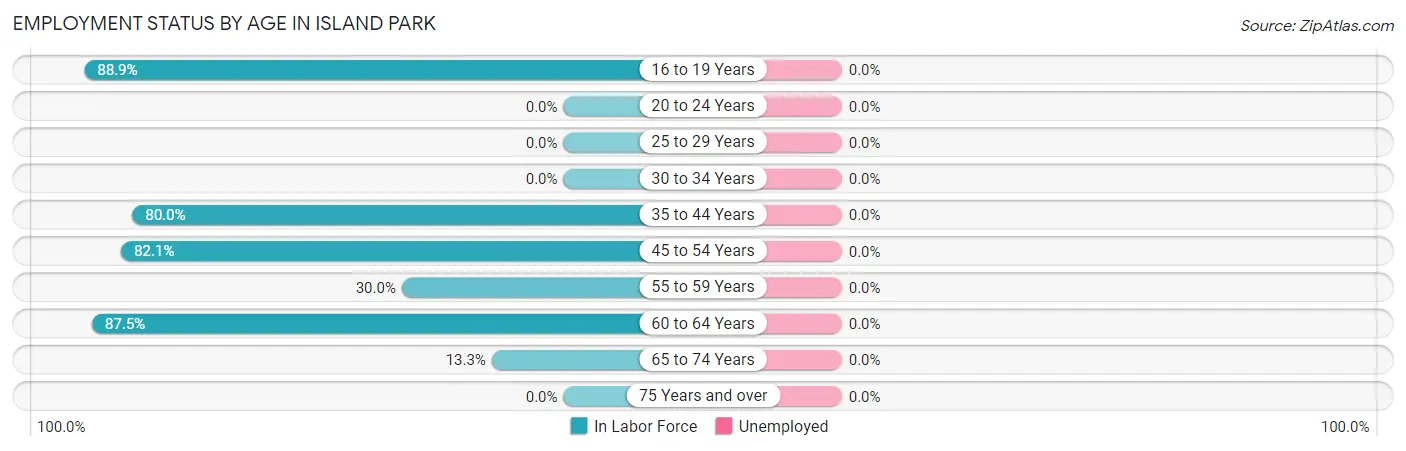
| Age Bracket | In Labor Force | Unemployed |
| 16 to 19 Years | 8 (88.9%) | 0 (0.0%) |
| 20 to 24 Years | 0 (0.0%) | 0 (0.0%) |
| 25 to 29 Years | 0 (0.0%) | 0 (0.0%) |
| 30 to 34 Years | 0 (0.0%) | 0 (0.0%) |
| 35 to 44 Years | 4 (80.0%) | 0 (0.0%) |
| 45 to 54 Years | 23 (82.1%) | 0 (0.0%) |
| 55 to 59 Years | 3 (30.0%) | 0 (0.0%) |
| 60 to 64 Years | 14 (87.5%) | 0 (0.0%) |
| 65 to 74 Years | 8 (13.3%) | 0 (0.0%) |
| 75 Years and over | 0 (0.0%) | 0 (0.0%) |
| Total | 60 (43.2%) | 0 (0.0%) |
Employment Status by Educational Attainment in Island Park
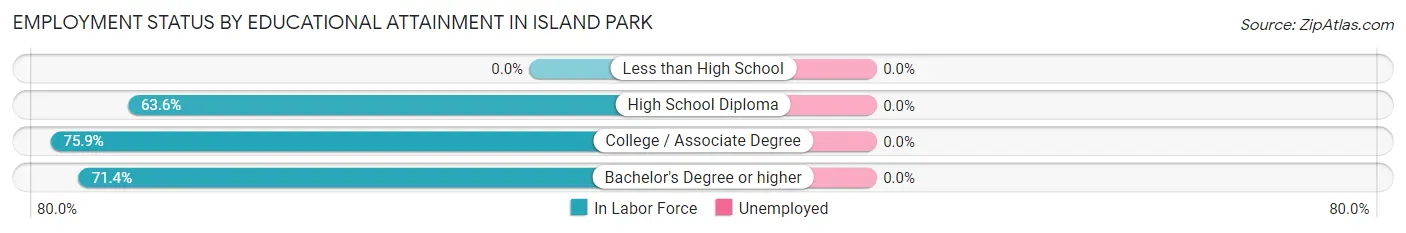
| Educational Attainment | In Labor Force | Unemployed |
| Less than High School | 0 (0.0%) | 0 (0.0%) |
| High School Diploma | 7 (63.6%) | 0 (0.0%) |
| College / Associate Degree | 22 (75.9%) | 0 (0.0%) |
| Bachelor's Degree or higher | 15 (71.4%) | 0 (0.0%) |
| Total | 44 (72.1%) | 0 (0.0%) |
Employment Occupations by Sex in Island Park
Management, Business, Science and Arts Occupations
The most common Management, Business, Science and Arts occupations in Island Park are Management (8 | 13.3%), Health Diagnosing & Treating (2 | 3.3%), Health Technologists (2 | 3.3%), and Business & Financial (1 | 1.7%).
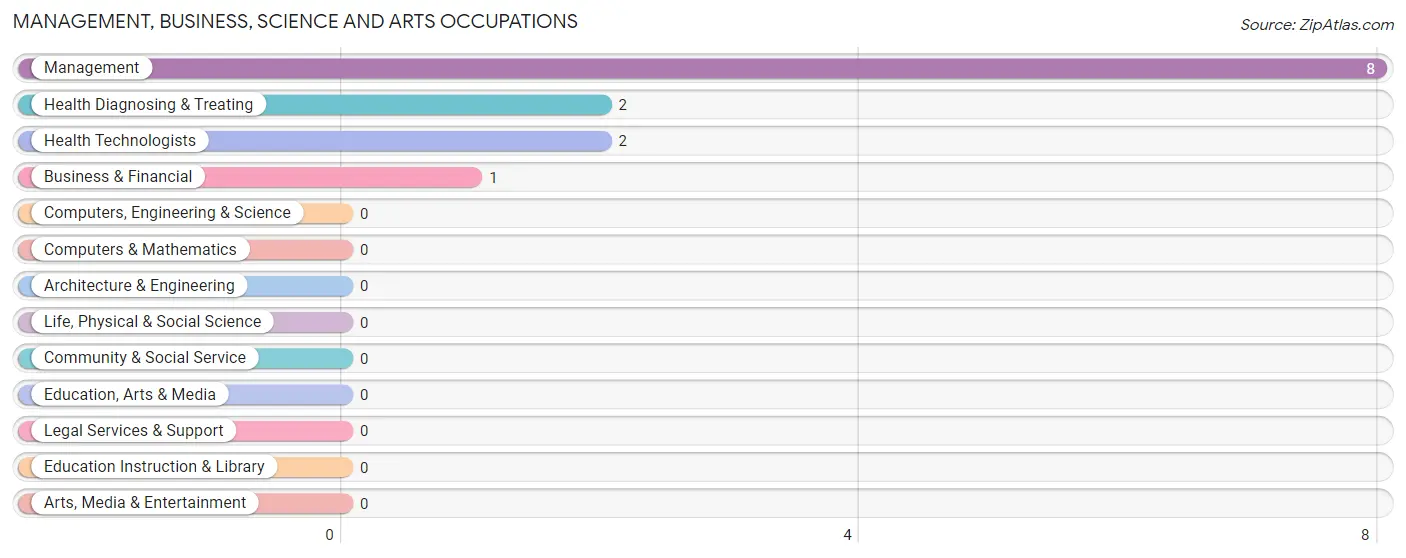
Management, Business, Science and Arts Occupations by Sex
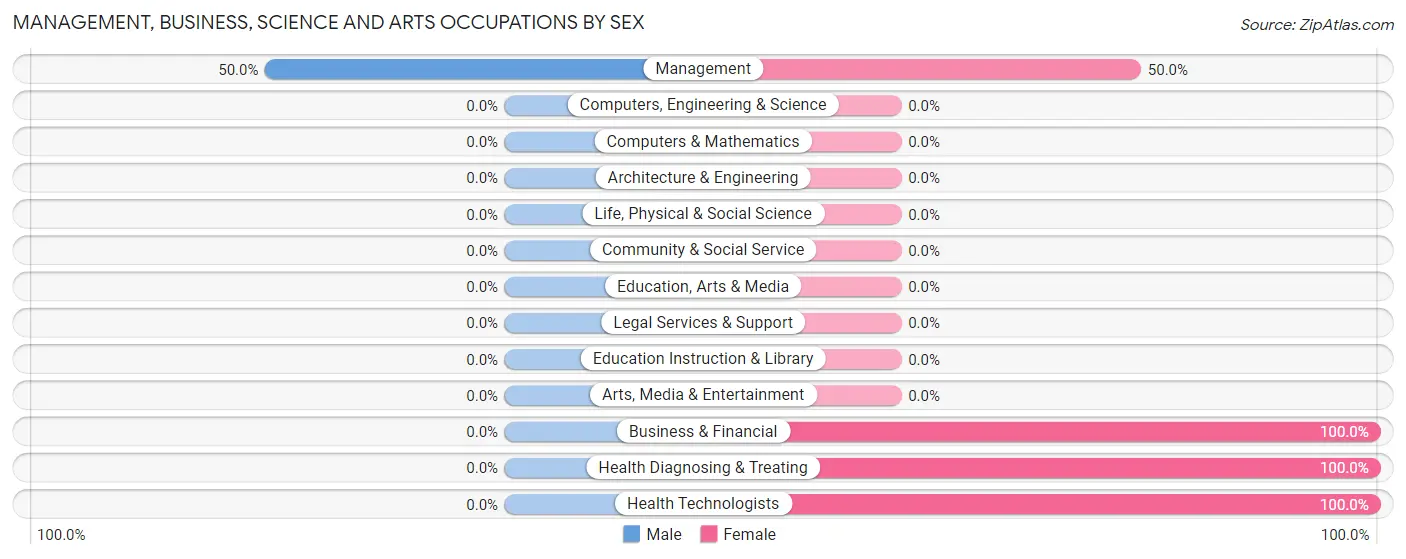
| Occupation | Male | Female |
| Management | 4 (50.0%) | 4 (50.0%) |
| Business & Financial | 0 (0.0%) | 1 (100.0%) |
| Computers, Engineering & Science | 0 (0.0%) | 0 (0.0%) |
| Computers & Mathematics | 0 (0.0%) | 0 (0.0%) |
| Architecture & Engineering | 0 (0.0%) | 0 (0.0%) |
| Life, Physical & Social Science | 0 (0.0%) | 0 (0.0%) |
| Community & Social Service | 0 (0.0%) | 0 (0.0%) |
| Education, Arts & Media | 0 (0.0%) | 0 (0.0%) |
| Legal Services & Support | 0 (0.0%) | 0 (0.0%) |
| Education Instruction & Library | 0 (0.0%) | 0 (0.0%) |
| Arts, Media & Entertainment | 0 (0.0%) | 0 (0.0%) |
| Health Diagnosing & Treating | 0 (0.0%) | 2 (100.0%) |
| Health Technologists | 0 (0.0%) | 2 (100.0%) |
| Total (Category) | 4 (36.4%) | 7 (63.6%) |
| Total (Overall) | 34 (56.7%) | 26 (43.3%) |
Services Occupations
The most common Services occupations in Island Park are Food Preparation & Serving (5 | 8.3%), and Personal Care & Service (3 | 5.0%).
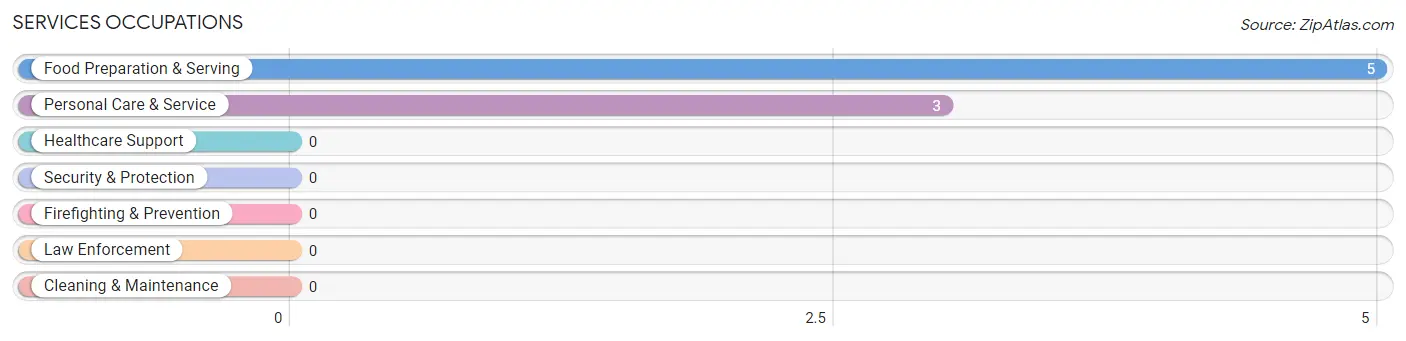
Services Occupations by Sex
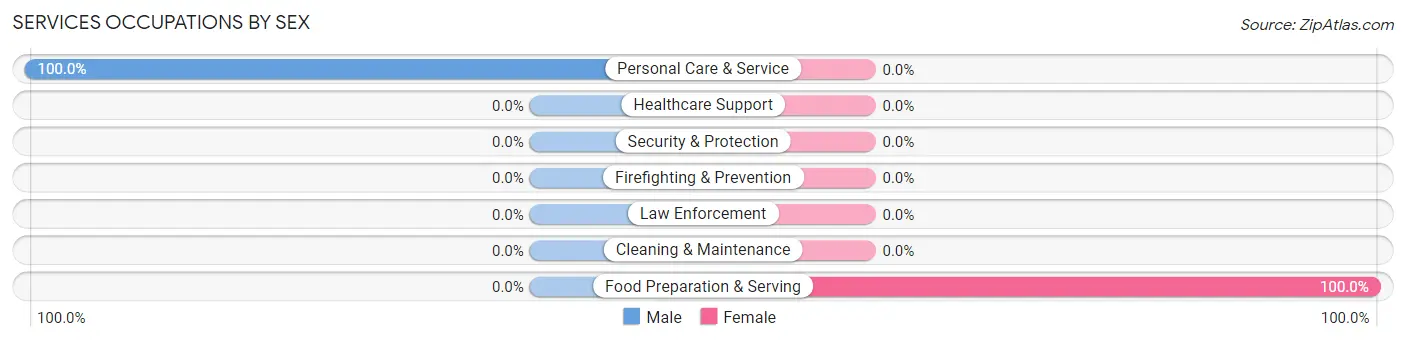
| Occupation | Male | Female |
| Healthcare Support | 0 (0.0%) | 0 (0.0%) |
| Security & Protection | 0 (0.0%) | 0 (0.0%) |
| Firefighting & Prevention | 0 (0.0%) | 0 (0.0%) |
| Law Enforcement | 0 (0.0%) | 0 (0.0%) |
| Food Preparation & Serving | 0 (0.0%) | 5 (100.0%) |
| Cleaning & Maintenance | 0 (0.0%) | 0 (0.0%) |
| Personal Care & Service | 3 (100.0%) | 0 (0.0%) |
| Total (Category) | 3 (37.5%) | 5 (62.5%) |
| Total (Overall) | 34 (56.7%) | 26 (43.3%) |
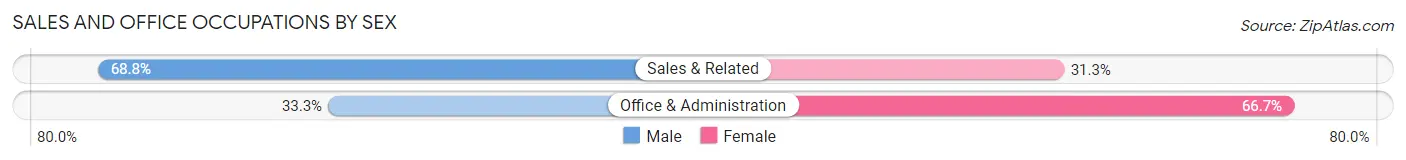
Sales and Office Occupations
The most common Sales and Office occupations in Island Park are Sales & Related (16 | 26.7%), and Office & Administration (9 | 15.0%).
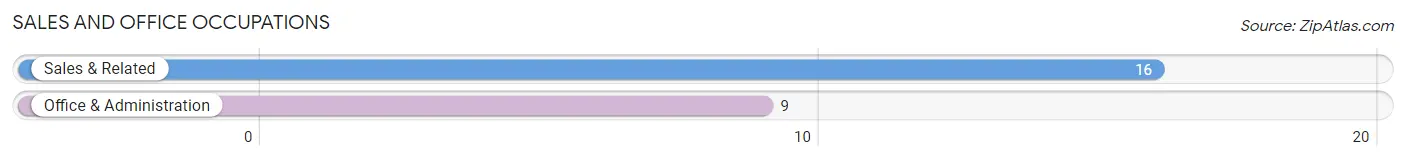
Sales and Office Occupations by Sex
| Occupation | Male | Female |
| Sales & Related | 11 (68.8%) | 5 (31.2%) |
| Office & Administration | 3 (33.3%) | 6 (66.7%) |
| Total (Category) | 14 (56.0%) | 11 (44.0%) |
| Total (Overall) | 34 (56.7%) | 26 (43.3%) |
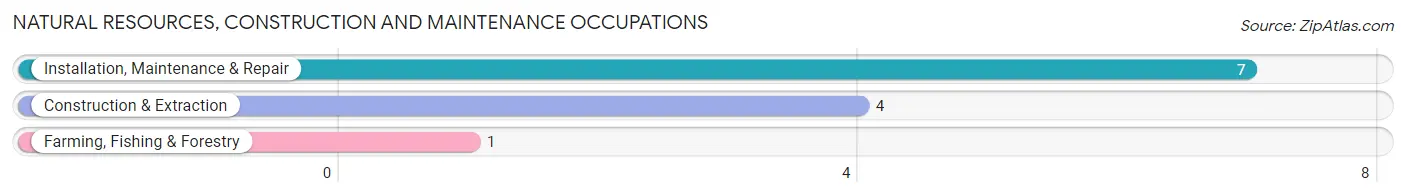
Natural Resources, Construction and Maintenance Occupations
The most common Natural Resources, Construction and Maintenance occupations in Island Park are Installation, Maintenance & Repair (7 | 11.7%), Construction & Extraction (4 | 6.7%), and Farming, Fishing & Forestry (1 | 1.7%).
Natural Resources, Construction and Maintenance Occupations by Sex
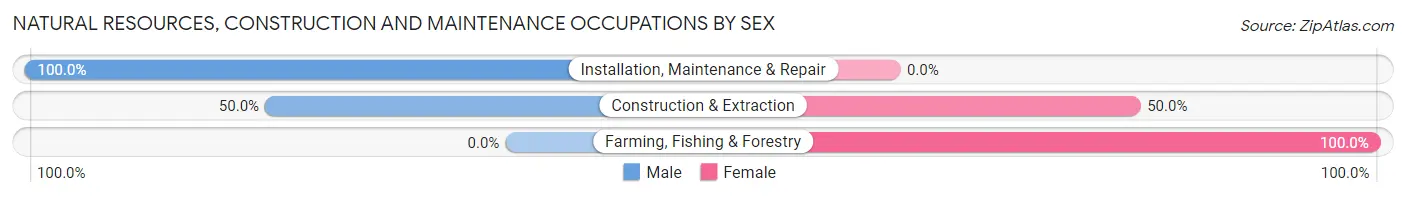
| Occupation | Male | Female |
| Farming, Fishing & Forestry | 0 (0.0%) | 1 (100.0%) |
| Construction & Extraction | 2 (50.0%) | 2 (50.0%) |
| Installation, Maintenance & Repair | 7 (100.0%) | 0 (0.0%) |
| Total (Category) | 9 (75.0%) | 3 (25.0%) |
| Total (Overall) | 34 (56.7%) | 26 (43.3%) |
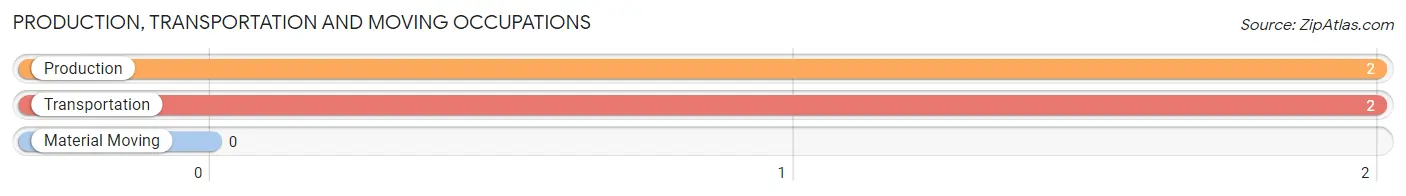
Production, Transportation and Moving Occupations
The most common Production, Transportation and Moving occupations in Island Park are Production (2 | 3.3%), and Transportation (2 | 3.3%).
Production, Transportation and Moving Occupations by Sex
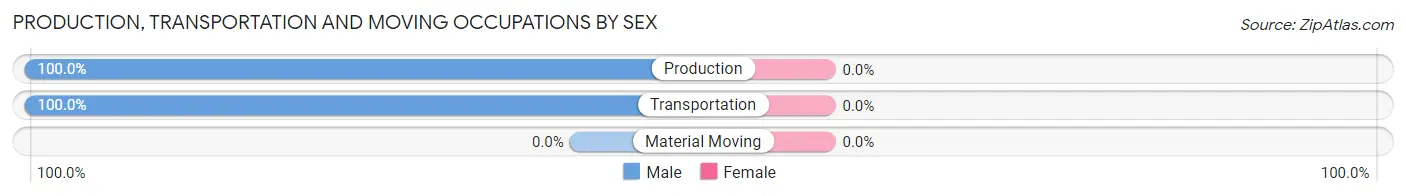
| Occupation | Male | Female |
| Production | 2 (100.0%) | 0 (0.0%) |
| Transportation | 2 (100.0%) | 0 (0.0%) |
| Material Moving | 0 (0.0%) | 0 (0.0%) |
| Total (Category) | 4 (100.0%) | 0 (0.0%) |
| Total (Overall) | 34 (56.7%) | 26 (43.3%) |
Employment Industries by Sex in Island Park
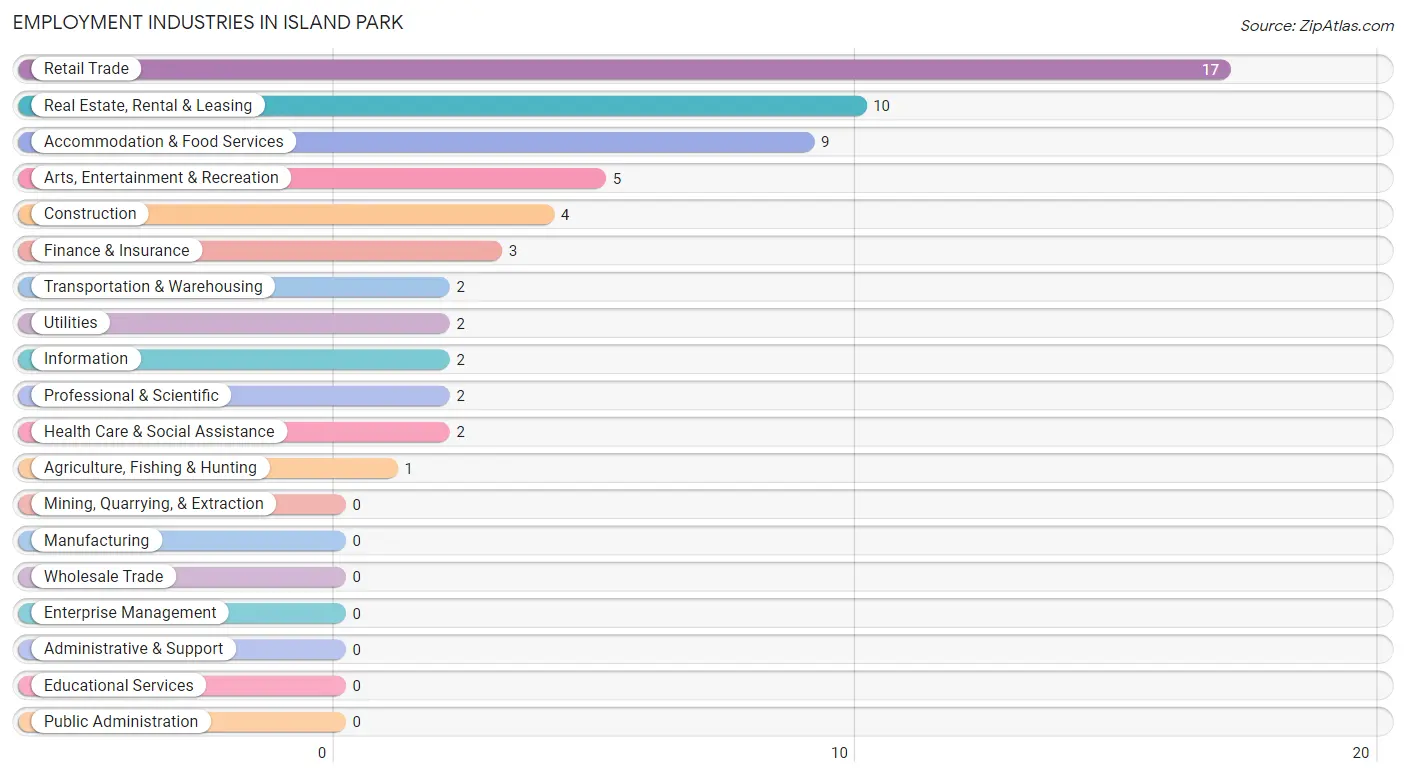
Employment Industries in Island Park
The major employment industries in Island Park include Retail Trade (17 | 28.3%), Real Estate, Rental & Leasing (10 | 16.7%), Accommodation & Food Services (9 | 15.0%), Arts, Entertainment & Recreation (5 | 8.3%), and Construction (4 | 6.7%).
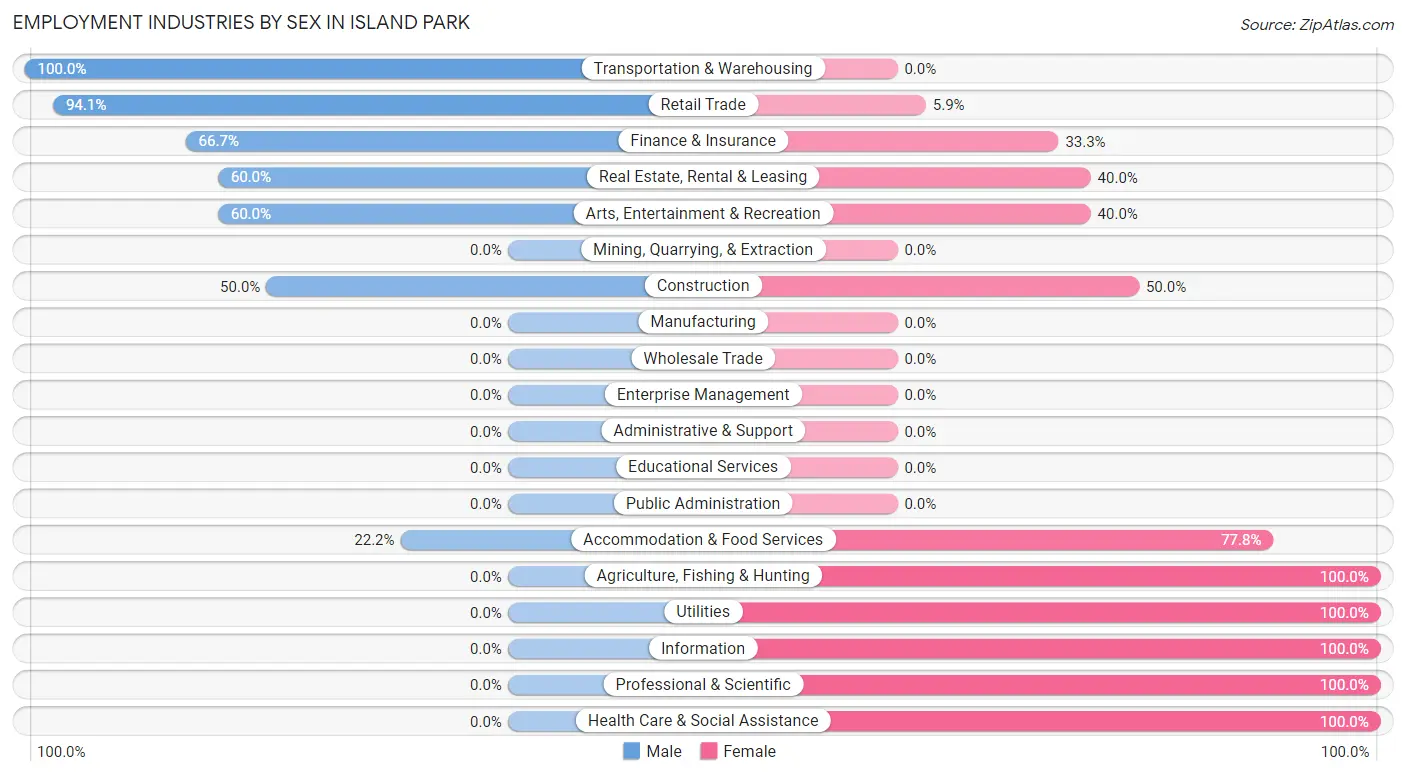
Employment Industries by Sex in Island Park
The Island Park industries that see more men than women are Transportation & Warehousing (100.0%), Retail Trade (94.1%), and Finance & Insurance (66.7%), whereas the industries that tend to have a higher number of women are Agriculture, Fishing & Hunting (100.0%), Utilities (100.0%), and Information (100.0%).
| Industry | Male | Female |
| Agriculture, Fishing & Hunting | 0 (0.0%) | 1 (100.0%) |
| Mining, Quarrying, & Extraction | 0 (0.0%) | 0 (0.0%) |
| Construction | 2 (50.0%) | 2 (50.0%) |
| Manufacturing | 0 (0.0%) | 0 (0.0%) |
| Wholesale Trade | 0 (0.0%) | 0 (0.0%) |
| Retail Trade | 16 (94.1%) | 1 (5.9%) |
| Transportation & Warehousing | 2 (100.0%) | 0 (0.0%) |
| Utilities | 0 (0.0%) | 2 (100.0%) |
| Information | 0 (0.0%) | 2 (100.0%) |
| Finance & Insurance | 2 (66.7%) | 1 (33.3%) |
| Real Estate, Rental & Leasing | 6 (60.0%) | 4 (40.0%) |
| Professional & Scientific | 0 (0.0%) | 2 (100.0%) |
| Enterprise Management | 0 (0.0%) | 0 (0.0%) |
| Administrative & Support | 0 (0.0%) | 0 (0.0%) |
| Educational Services | 0 (0.0%) | 0 (0.0%) |
| Health Care & Social Assistance | 0 (0.0%) | 2 (100.0%) |
| Arts, Entertainment & Recreation | 3 (60.0%) | 2 (40.0%) |
| Accommodation & Food Services | 2 (22.2%) | 7 (77.8%) |
| Public Administration | 0 (0.0%) | 0 (0.0%) |
| Total | 34 (56.7%) | 26 (43.3%) |
Education in Island Park
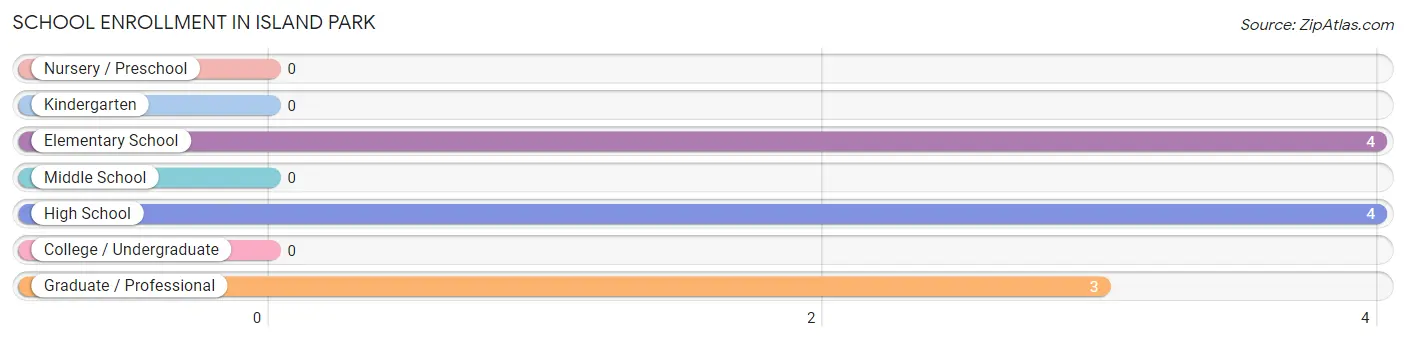
School Enrollment in Island Park
The most common levels of schooling among the 11 students in Island Park are elementary school (4 | 36.4%), high school (4 | 36.4%), and graduate / professional (3 | 27.3%).
| School Level | # Students | % Students |
| Nursery / Preschool | 0 | 0.0% |
| Kindergarten | 0 | 0.0% |
| Elementary School | 4 | 36.4% |
| Middle School | 0 | 0.0% |
| High School | 4 | 36.4% |
| College / Undergraduate | 0 | 0.0% |
| Graduate / Professional | 3 | 27.3% |
| Total | 11 | 100.0% |
School Enrollment by Age by Funding Source in Island Park
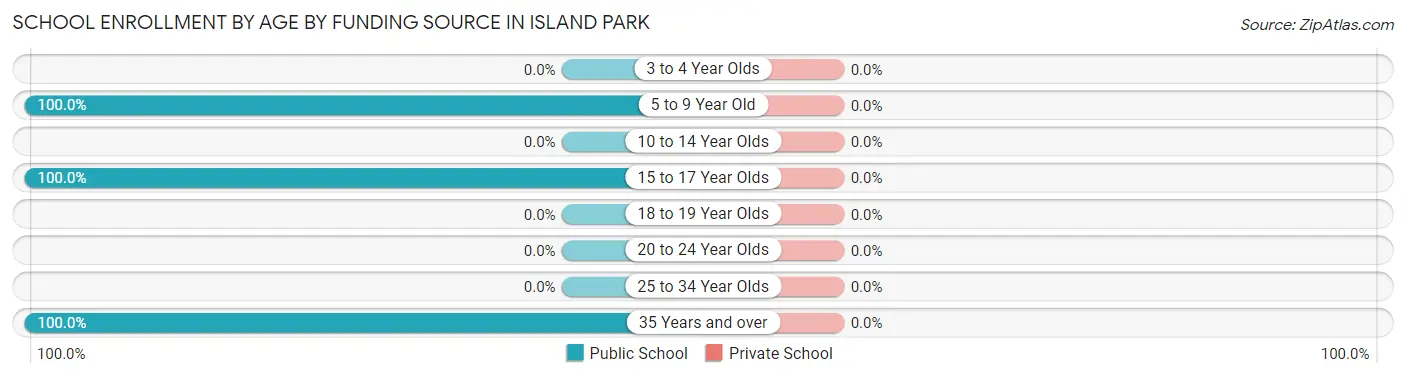
| Age Bracket | Public School | Private School |
| 3 to 4 Year Olds | 0 (0.0%) | 0 (0.0%) |
| 5 to 9 Year Old | 4 (100.0%) | 0 (0.0%) |
| 10 to 14 Year Olds | 0 (0.0%) | 0 (0.0%) |
| 15 to 17 Year Olds | 4 (100.0%) | 0 (0.0%) |
| 18 to 19 Year Olds | 0 (0.0%) | 0 (0.0%) |
| 20 to 24 Year Olds | 0 (0.0%) | 0 (0.0%) |
| 25 to 34 Year Olds | 0 (0.0%) | 0 (0.0%) |
| 35 Years and over | 3 (100.0%) | 0 (0.0%) |
| Total | 11 (100.0%) | 0 (0.0%) |
Educational Attainment by Field of Study in Island Park
Education (18 | 32.7%), arts & humanities (12 | 21.8%), social sciences (9 | 16.4%), engineering (5 | 9.1%), and bio, nature & agricultural (4 | 7.3%) are the most common fields of study among 55 individuals in Island Park who have obtained a bachelor's degree or higher.
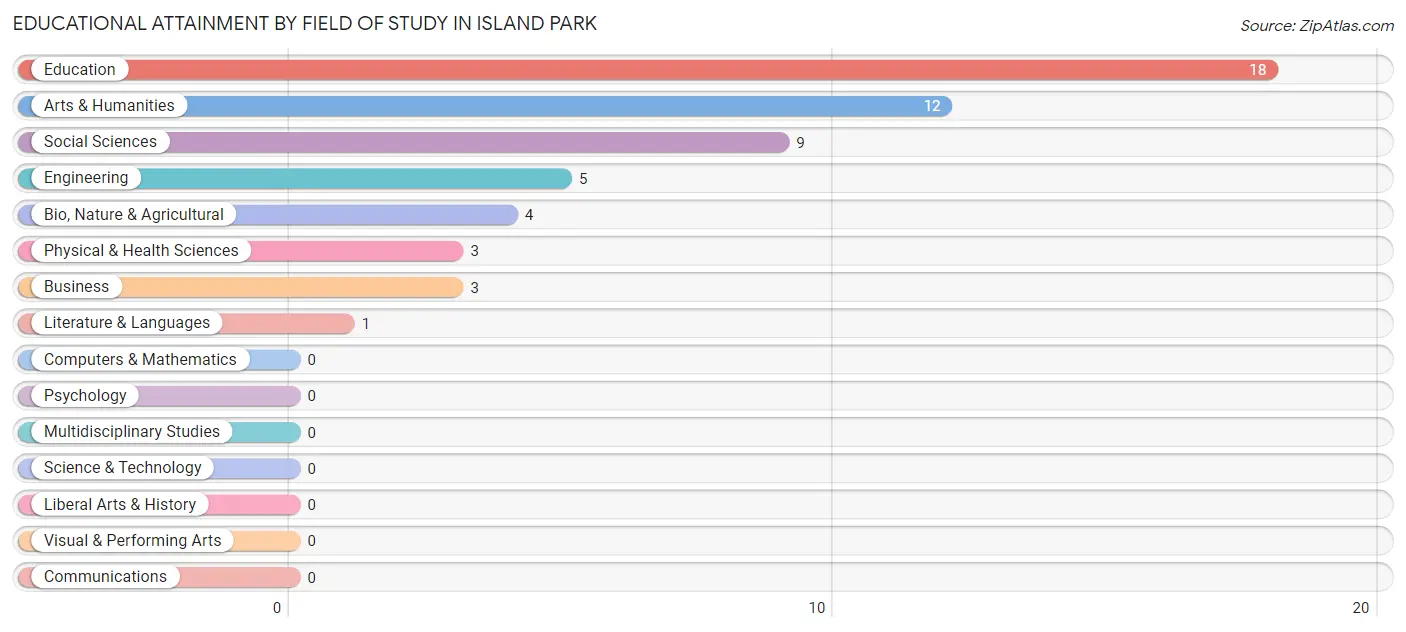
| Field of Study | # Graduates | % Graduates |
| Computers & Mathematics | 0 | 0.0% |
| Bio, Nature & Agricultural | 4 | 7.3% |
| Physical & Health Sciences | 3 | 5.4% |
| Psychology | 0 | 0.0% |
| Social Sciences | 9 | 16.4% |
| Engineering | 5 | 9.1% |
| Multidisciplinary Studies | 0 | 0.0% |
| Science & Technology | 0 | 0.0% |
| Business | 3 | 5.4% |
| Education | 18 | 32.7% |
| Literature & Languages | 1 | 1.8% |
| Liberal Arts & History | 0 | 0.0% |
| Visual & Performing Arts | 0 | 0.0% |
| Communications | 0 | 0.0% |
| Arts & Humanities | 12 | 21.8% |
| Total | 55 | 100.0% |
Transportation & Commute in Island Park
Vehicle Availability by Sex in Island Park
The most prevalent vehicle ownership categories in Island Park are males with 2 vehicles (16, accounting for 47.1%) and females with 2 vehicles (8, making up 61.5%).
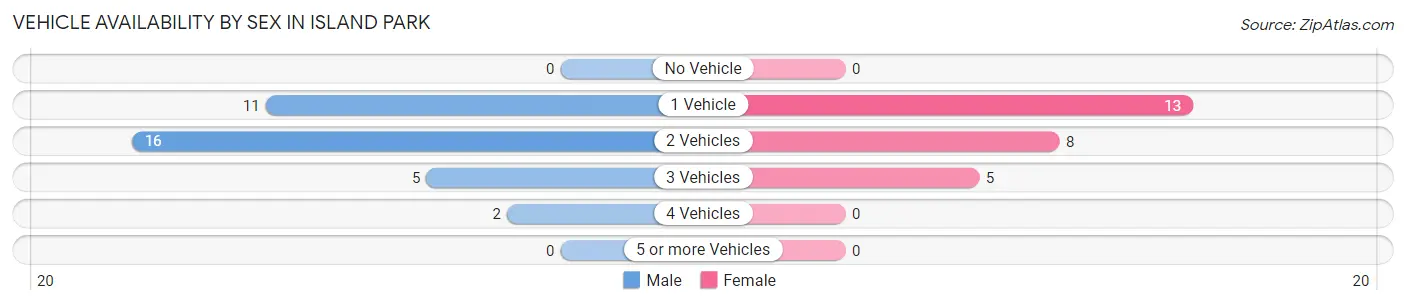
| Vehicles Available | Male | Female |
| No Vehicle | 0 (0.0%) | 0 (0.0%) |
| 1 Vehicle | 11 (32.4%) | 13 (50.0%) |
| 2 Vehicles | 16 (47.1%) | 8 (30.8%) |
| 3 Vehicles | 5 (14.7%) | 5 (19.2%) |
| 4 Vehicles | 2 (5.9%) | 0 (0.0%) |
| 5 or more Vehicles | 0 (0.0%) | 0 (0.0%) |
| Total | 34 (100.0%) | 26 (100.0%) |
Commute Time in Island Park
The most frequently occuring commute durations in Island Park are 5 to 9 minutes (19 commuters, 35.8%), less than 5 minutes (18 commuters, 34.0%), and 20 to 24 minutes (6 commuters, 11.3%).
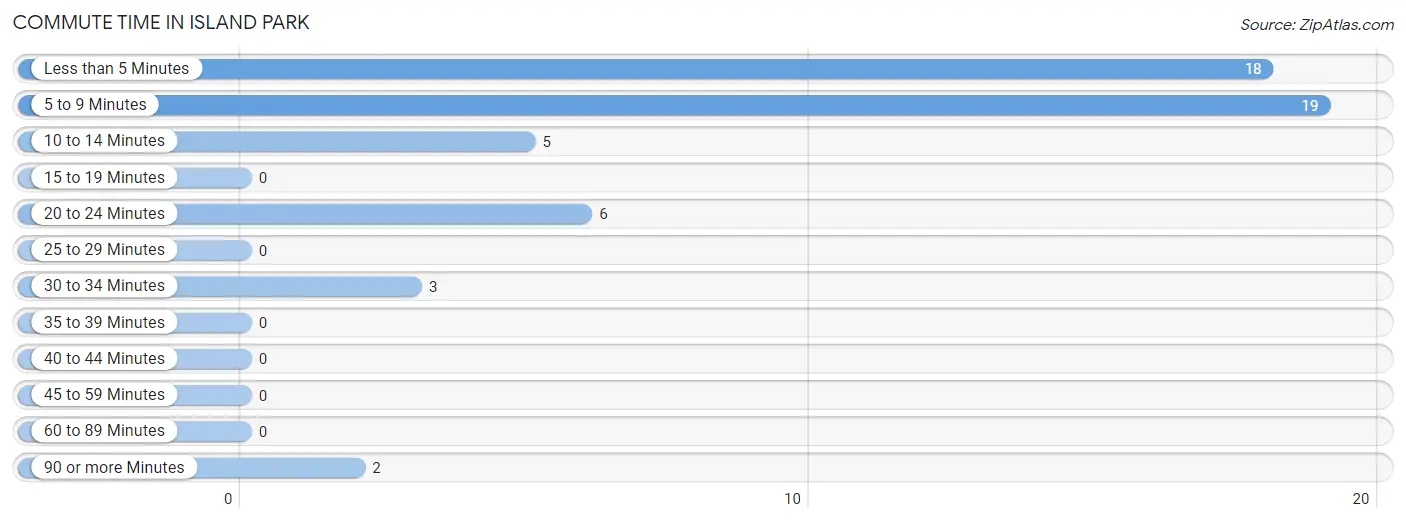
| Commute Time | # Commuters | % Commuters |
| Less than 5 Minutes | 18 | 34.0% |
| 5 to 9 Minutes | 19 | 35.8% |
| 10 to 14 Minutes | 5 | 9.4% |
| 15 to 19 Minutes | 0 | 0.0% |
| 20 to 24 Minutes | 6 | 11.3% |
| 25 to 29 Minutes | 0 | 0.0% |
| 30 to 34 Minutes | 3 | 5.7% |
| 35 to 39 Minutes | 0 | 0.0% |
| 40 to 44 Minutes | 0 | 0.0% |
| 45 to 59 Minutes | 0 | 0.0% |
| 60 to 89 Minutes | 0 | 0.0% |
| 90 or more Minutes | 2 | 3.8% |
Commute Time by Sex in Island Park
The most common commute times in Island Park are less than 5 minutes (12 commuters, 40.0%) for males and 5 to 9 minutes (8 commuters, 34.8%) for females.
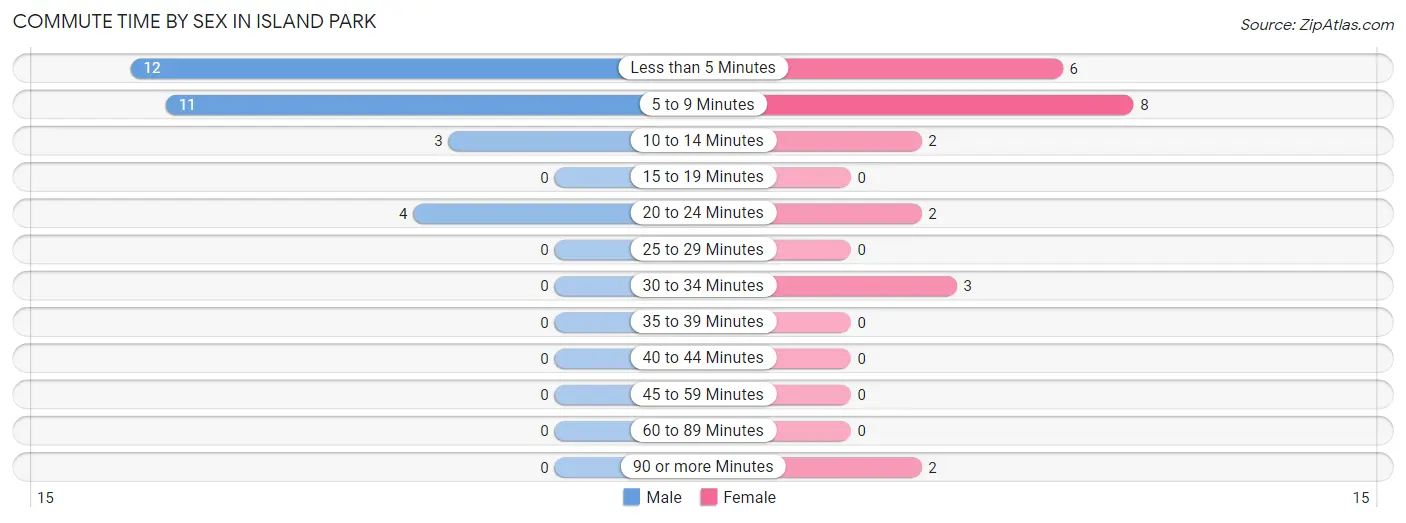
| Commute Time | Male | Female |
| Less than 5 Minutes | 12 (40.0%) | 6 (26.1%) |
| 5 to 9 Minutes | 11 (36.7%) | 8 (34.8%) |
| 10 to 14 Minutes | 3 (10.0%) | 2 (8.7%) |
| 15 to 19 Minutes | 0 (0.0%) | 0 (0.0%) |
| 20 to 24 Minutes | 4 (13.3%) | 2 (8.7%) |
| 25 to 29 Minutes | 0 (0.0%) | 0 (0.0%) |
| 30 to 34 Minutes | 0 (0.0%) | 3 (13.0%) |
| 35 to 39 Minutes | 0 (0.0%) | 0 (0.0%) |
| 40 to 44 Minutes | 0 (0.0%) | 0 (0.0%) |
| 45 to 59 Minutes | 0 (0.0%) | 0 (0.0%) |
| 60 to 89 Minutes | 0 (0.0%) | 0 (0.0%) |
| 90 or more Minutes | 0 (0.0%) | 2 (8.7%) |
Time of Departure to Work by Sex in Island Park
The most frequent times of departure to work in Island Park are 9:00 AM to 9:59 AM (6, 20.0%) for males and 4:00 PM to 11:59 PM (6, 26.1%) for females.
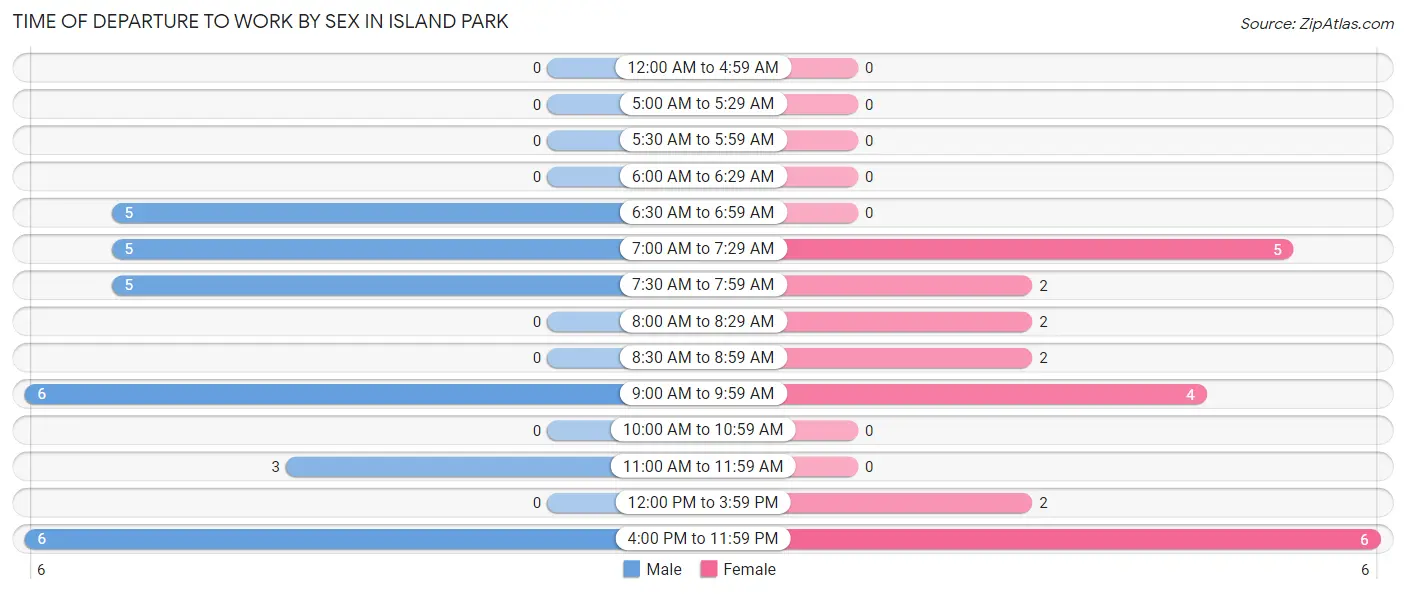
| Time of Departure | Male | Female |
| 12:00 AM to 4:59 AM | 0 (0.0%) | 0 (0.0%) |
| 5:00 AM to 5:29 AM | 0 (0.0%) | 0 (0.0%) |
| 5:30 AM to 5:59 AM | 0 (0.0%) | 0 (0.0%) |
| 6:00 AM to 6:29 AM | 0 (0.0%) | 0 (0.0%) |
| 6:30 AM to 6:59 AM | 5 (16.7%) | 0 (0.0%) |
| 7:00 AM to 7:29 AM | 5 (16.7%) | 5 (21.7%) |
| 7:30 AM to 7:59 AM | 5 (16.7%) | 2 (8.7%) |
| 8:00 AM to 8:29 AM | 0 (0.0%) | 2 (8.7%) |
| 8:30 AM to 8:59 AM | 0 (0.0%) | 2 (8.7%) |
| 9:00 AM to 9:59 AM | 6 (20.0%) | 4 (17.4%) |
| 10:00 AM to 10:59 AM | 0 (0.0%) | 0 (0.0%) |
| 11:00 AM to 11:59 AM | 3 (10.0%) | 0 (0.0%) |
| 12:00 PM to 3:59 PM | 0 (0.0%) | 2 (8.7%) |
| 4:00 PM to 11:59 PM | 6 (20.0%) | 6 (26.1%) |
| Total | 30 (100.0%) | 23 (100.0%) |
Housing Occupancy in Island Park
Occupancy by Ownership in Island Park
Of the total 70 dwellings in Island Park, owner-occupied units account for 70 (100.0%), while renter-occupied units make up 0 (0.0%).
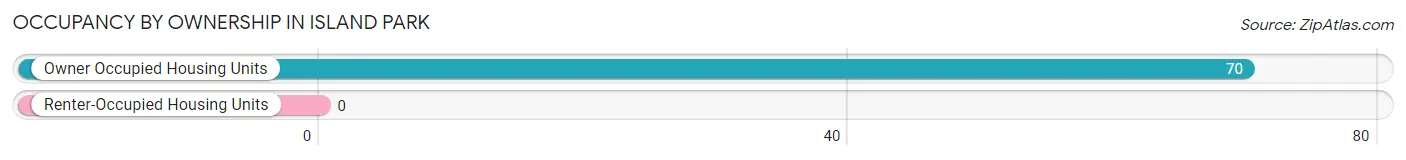
| Occupancy | # Housing Units | % Housing Units |
| Owner Occupied Housing Units | 70 | 100.0% |
| Renter-Occupied Housing Units | 0 | 0.0% |
| Total Occupied Housing Units | 70 | 100.0% |
Occupancy by Household Size in Island Park
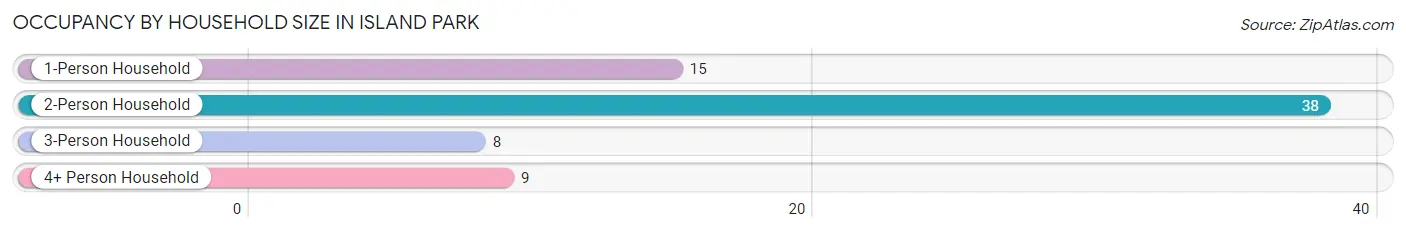
| Household Size | # Housing Units | % Housing Units |
| 1-Person Household | 15 | 21.4% |
| 2-Person Household | 38 | 54.3% |
| 3-Person Household | 8 | 11.4% |
| 4+ Person Household | 9 | 12.9% |
| Total Housing Units | 70 | 100.0% |
Occupancy by Ownership by Household Size in Island Park
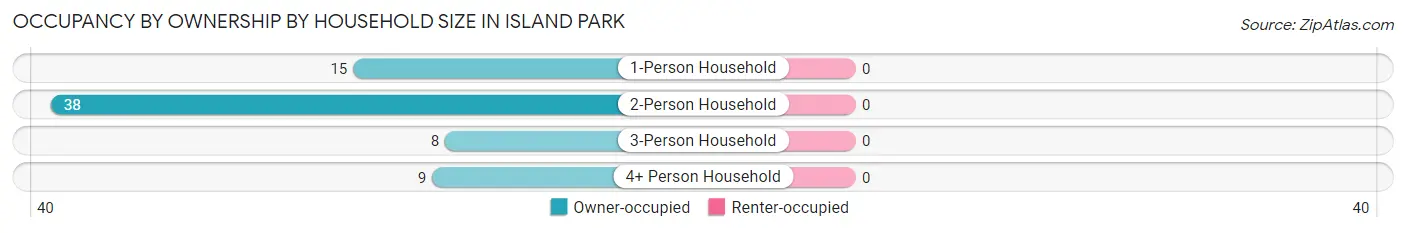
| Household Size | Owner-occupied | Renter-occupied |
| 1-Person Household | 15 (100.0%) | 0 (0.0%) |
| 2-Person Household | 38 (100.0%) | 0 (0.0%) |
| 3-Person Household | 8 (100.0%) | 0 (0.0%) |
| 4+ Person Household | 9 (100.0%) | 0 (0.0%) |
| Total Housing Units | 70 (100.0%) | 0 (0.0%) |
Occupancy by Educational Attainment in Island Park
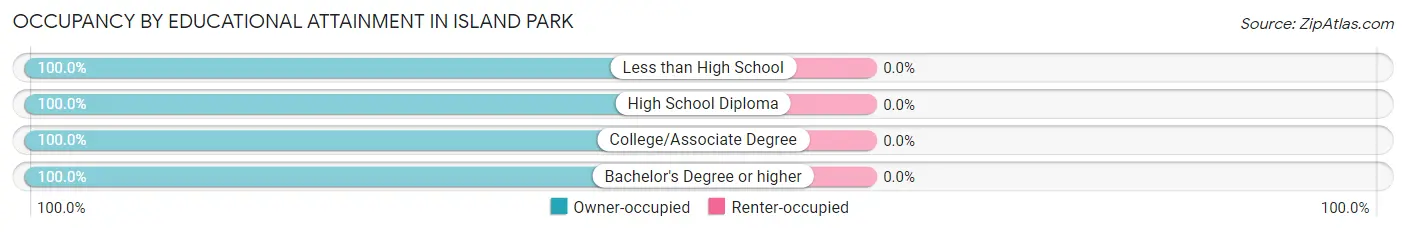
| Household Size | Owner-occupied | Renter-occupied |
| Less than High School | 1 (100.0%) | 0 (0.0%) |
| High School Diploma | 23 (100.0%) | 0 (0.0%) |
| College/Associate Degree | 18 (100.0%) | 0 (0.0%) |
| Bachelor's Degree or higher | 28 (100.0%) | 0 (0.0%) |
Occupancy by Age of Householder in Island Park
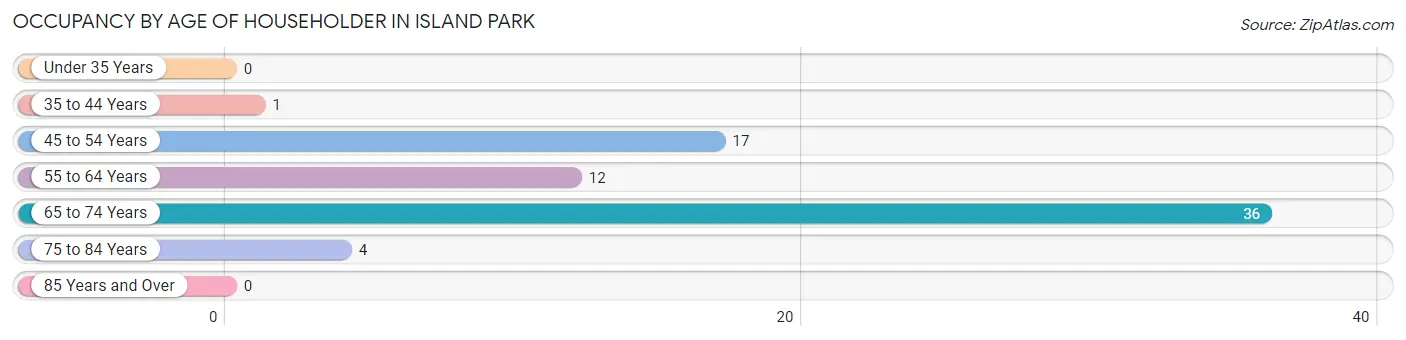
| Age Bracket | # Households | % Households |
| Under 35 Years | 0 | 0.0% |
| 35 to 44 Years | 1 | 1.4% |
| 45 to 54 Years | 17 | 24.3% |
| 55 to 64 Years | 12 | 17.1% |
| 65 to 74 Years | 36 | 51.4% |
| 75 to 84 Years | 4 | 5.7% |
| 85 Years and Over | 0 | 0.0% |
| Total | 70 | 100.0% |
Housing Finances in Island Park
Median Income by Occupancy in Island Park
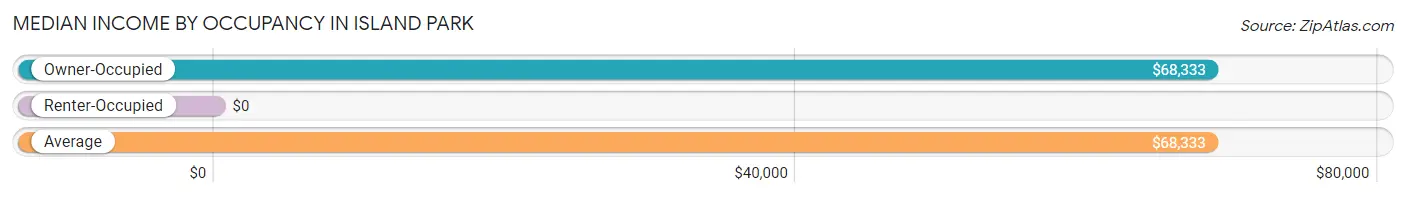
| Occupancy Type | # Households | Median Income |
| Owner-Occupied | 70 (100.0%) | $68,333 |
| Renter-Occupied | 0 (0.0%) | $0 |
| Average | 70 (100.0%) | $68,333 |
Occupancy by Householder Income Bracket in Island Park
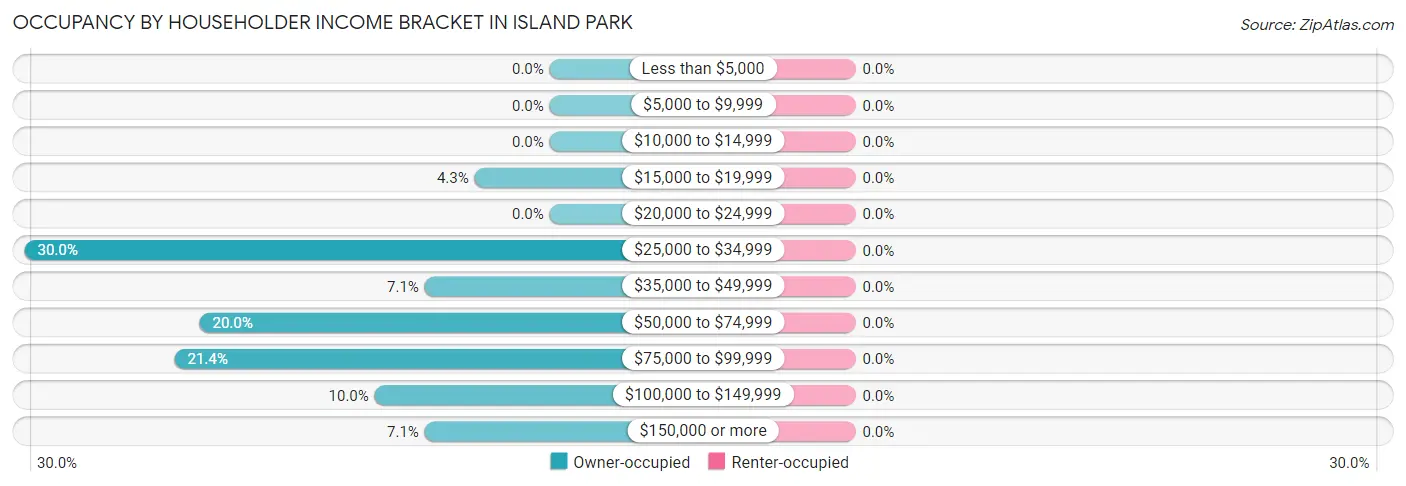
| Income Bracket | Owner-occupied | Renter-occupied |
| Less than $5,000 | 0 (0.0%) | 0 (0.0%) |
| $5,000 to $9,999 | 0 (0.0%) | 0 (0.0%) |
| $10,000 to $14,999 | 0 (0.0%) | 0 (0.0%) |
| $15,000 to $19,999 | 3 (4.3%) | 0 (0.0%) |
| $20,000 to $24,999 | 0 (0.0%) | 0 (0.0%) |
| $25,000 to $34,999 | 21 (30.0%) | 0 (0.0%) |
| $35,000 to $49,999 | 5 (7.1%) | 0 (0.0%) |
| $50,000 to $74,999 | 14 (20.0%) | 0 (0.0%) |
| $75,000 to $99,999 | 15 (21.4%) | 0 (0.0%) |
| $100,000 to $149,999 | 7 (10.0%) | 0 (0.0%) |
| $150,000 or more | 5 (7.1%) | 0 (0.0%) |
| Total | 70 (100.0%) | 0 (0.0%) |
Monthly Housing Cost Tiers in Island Park
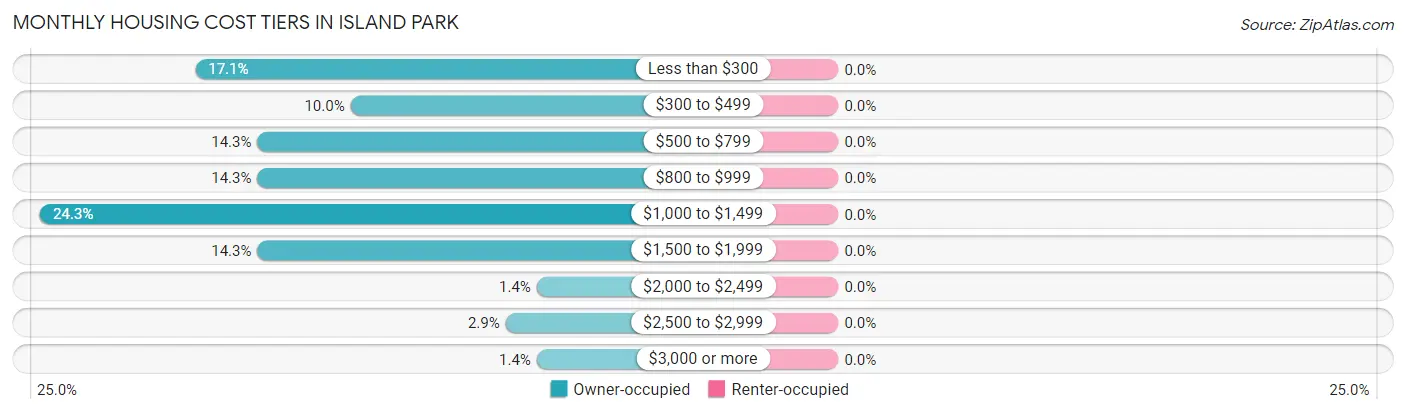
| Monthly Cost | Owner-occupied | Renter-occupied |
| Less than $300 | 12 (17.1%) | 0 (0.0%) |
| $300 to $499 | 7 (10.0%) | 0 (0.0%) |
| $500 to $799 | 10 (14.3%) | 0 (0.0%) |
| $800 to $999 | 10 (14.3%) | 0 (0.0%) |
| $1,000 to $1,499 | 17 (24.3%) | 0 (0.0%) |
| $1,500 to $1,999 | 10 (14.3%) | 0 (0.0%) |
| $2,000 to $2,499 | 1 (1.4%) | 0 (0.0%) |
| $2,500 to $2,999 | 2 (2.9%) | 0 (0.0%) |
| $3,000 or more | 1 (1.4%) | 0 (0.0%) |
| Total | 70 (100.0%) | 0 (0.0%) |
Physical Housing Characteristics in Island Park
Housing Structures in Island Park
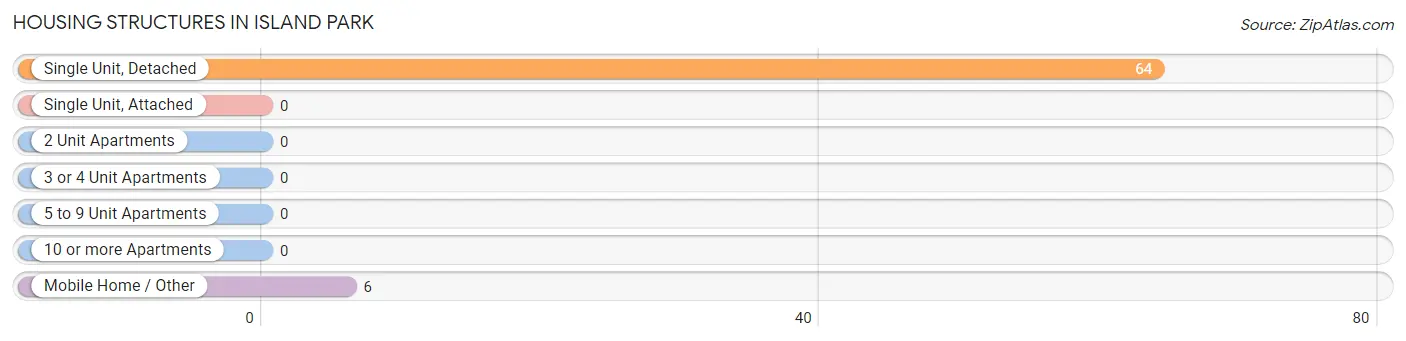
| Structure Type | # Housing Units | % Housing Units |
| Single Unit, Detached | 64 | 91.4% |
| Single Unit, Attached | 0 | 0.0% |
| 2 Unit Apartments | 0 | 0.0% |
| 3 or 4 Unit Apartments | 0 | 0.0% |
| 5 to 9 Unit Apartments | 0 | 0.0% |
| 10 or more Apartments | 0 | 0.0% |
| Mobile Home / Other | 6 | 8.6% |
| Total | 70 | 100.0% |
Housing Structures by Occupancy in Island Park
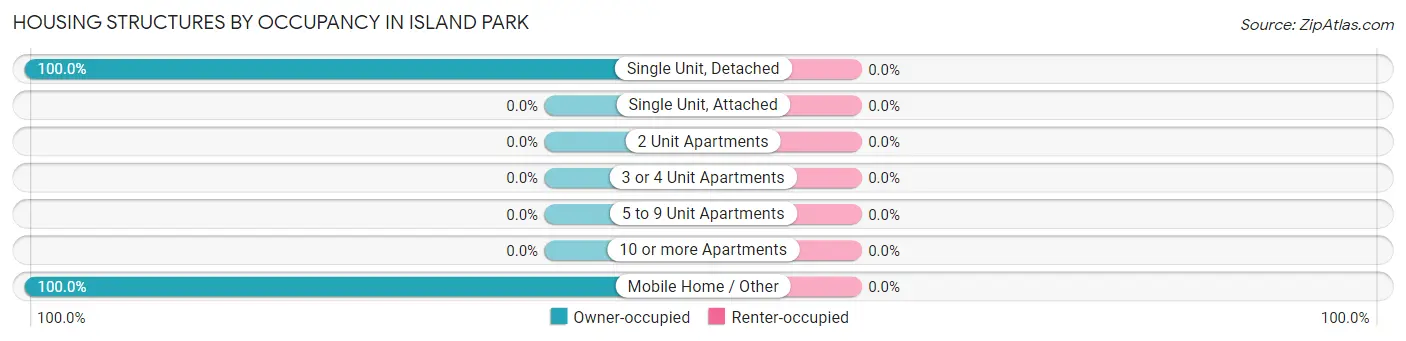
| Structure Type | Owner-occupied | Renter-occupied |
| Single Unit, Detached | 64 (100.0%) | 0 (0.0%) |
| Single Unit, Attached | 0 (0.0%) | 0 (0.0%) |
| 2 Unit Apartments | 0 (0.0%) | 0 (0.0%) |
| 3 or 4 Unit Apartments | 0 (0.0%) | 0 (0.0%) |
| 5 to 9 Unit Apartments | 0 (0.0%) | 0 (0.0%) |
| 10 or more Apartments | 0 (0.0%) | 0 (0.0%) |
| Mobile Home / Other | 6 (100.0%) | 0 (0.0%) |
| Total | 70 (100.0%) | 0 (0.0%) |
Housing Structures by Number of Rooms in Island Park
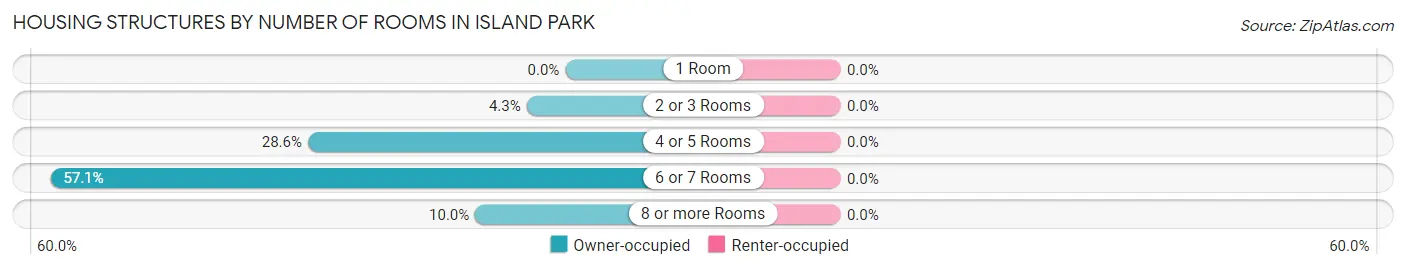
| Number of Rooms | Owner-occupied | Renter-occupied |
| 1 Room | 0 (0.0%) | 0 (0.0%) |
| 2 or 3 Rooms | 3 (4.3%) | 0 (0.0%) |
| 4 or 5 Rooms | 20 (28.6%) | 0 (0.0%) |
| 6 or 7 Rooms | 40 (57.1%) | 0 (0.0%) |
| 8 or more Rooms | 7 (10.0%) | 0 (0.0%) |
| Total | 70 (100.0%) | 0 (0.0%) |
Housing Structure by Heating Type in Island Park
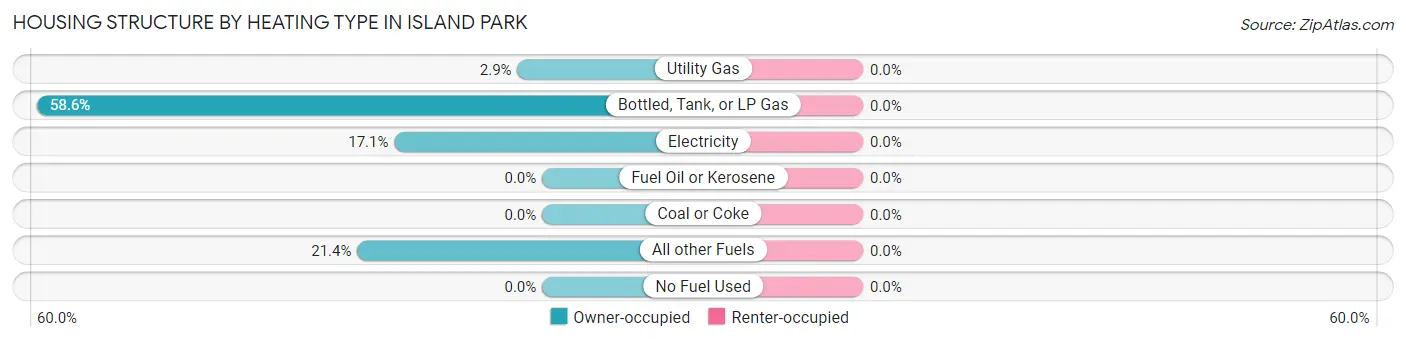
| Heating Type | Owner-occupied | Renter-occupied |
| Utility Gas | 2 (2.9%) | 0 (0.0%) |
| Bottled, Tank, or LP Gas | 41 (58.6%) | 0 (0.0%) |
| Electricity | 12 (17.1%) | 0 (0.0%) |
| Fuel Oil or Kerosene | 0 (0.0%) | 0 (0.0%) |
| Coal or Coke | 0 (0.0%) | 0 (0.0%) |
| All other Fuels | 15 (21.4%) | 0 (0.0%) |
| No Fuel Used | 0 (0.0%) | 0 (0.0%) |
| Total | 70 (100.0%) | 0 (0.0%) |
Household Vehicle Usage in Island Park
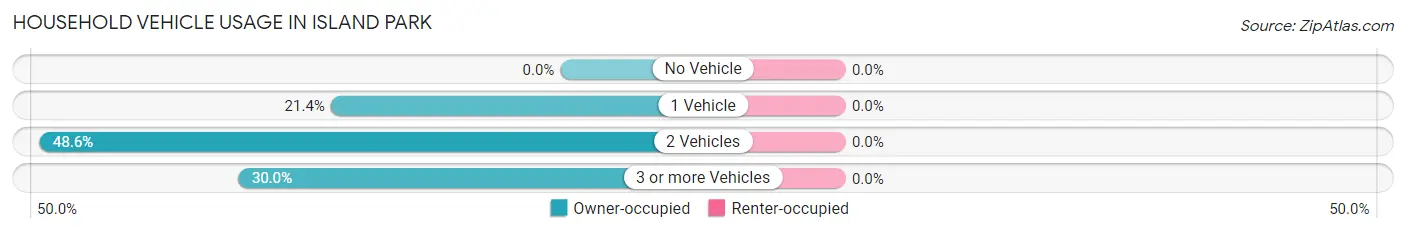
| Vehicles per Household | Owner-occupied | Renter-occupied |
| No Vehicle | 0 (0.0%) | 0 (0.0%) |
| 1 Vehicle | 15 (21.4%) | 0 (0.0%) |
| 2 Vehicles | 34 (48.6%) | 0 (0.0%) |
| 3 or more Vehicles | 21 (30.0%) | 0 (0.0%) |
| Total | 70 (100.0%) | 0 (0.0%) |
Real Estate & Mortgages in Island Park
Real Estate and Mortgage Overview in Island Park
| Characteristic | Without Mortgage | With Mortgage |
| Housing Units | 48 | 22 |
| Median Property Value | - | - |
| Median Household Income | $52,500 | $3 |
| Monthly Housing Costs | $620 | $1 |
| Real Estate Taxes | $2,500 | $0 |
Property Value by Mortgage Status in Island Park
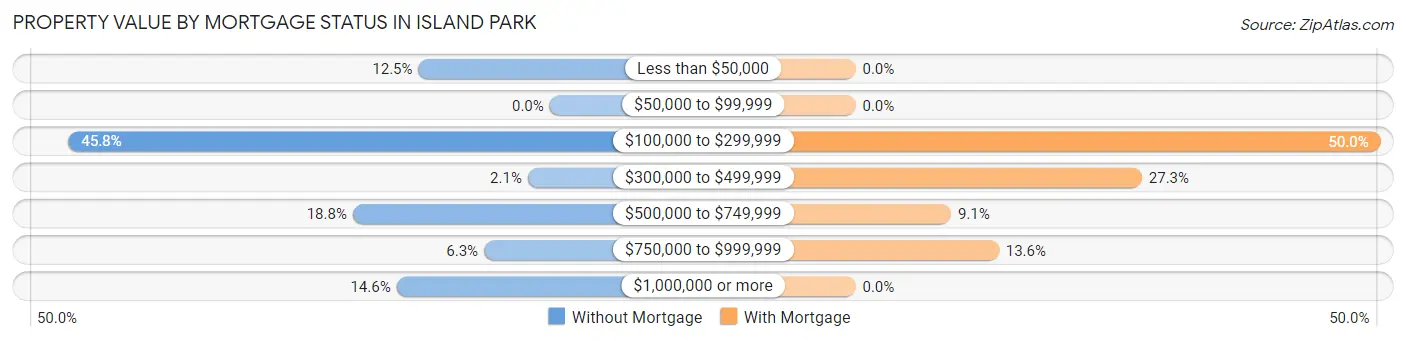
| Property Value | Without Mortgage | With Mortgage |
| Less than $50,000 | 6 (12.5%) | 0 (0.0%) |
| $50,000 to $99,999 | 0 (0.0%) | 0 (0.0%) |
| $100,000 to $299,999 | 22 (45.8%) | 11 (50.0%) |
| $300,000 to $499,999 | 1 (2.1%) | 6 (27.3%) |
| $500,000 to $749,999 | 9 (18.8%) | 2 (9.1%) |
| $750,000 to $999,999 | 3 (6.2%) | 3 (13.6%) |
| $1,000,000 or more | 7 (14.6%) | 0 (0.0%) |
| Total | 48 (100.0%) | 22 (100.0%) |
Household Income by Mortgage Status in Island Park
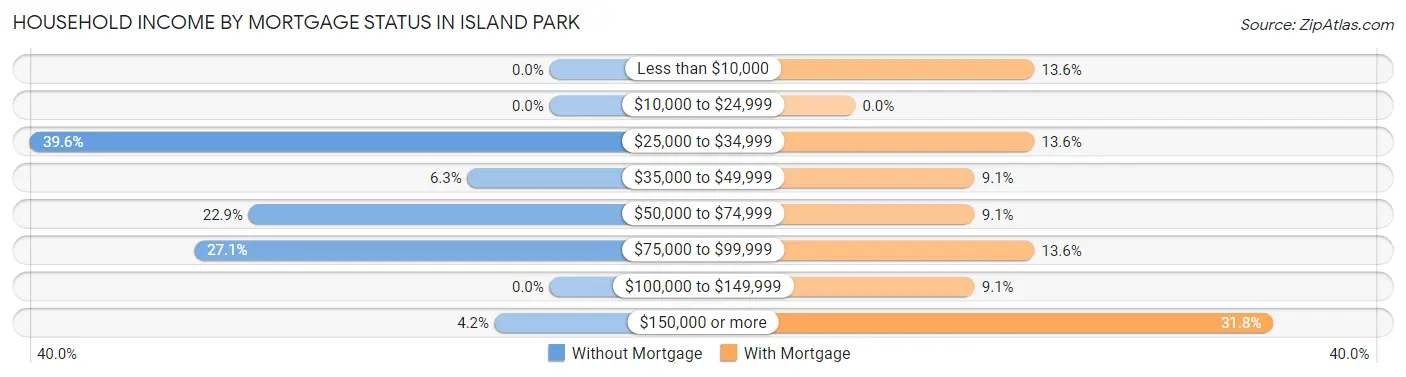
| Household Income | Without Mortgage | With Mortgage |
| Less than $10,000 | 0 (0.0%) | 3 (13.6%) |
| $10,000 to $24,999 | 0 (0.0%) | 0 (0.0%) |
| $25,000 to $34,999 | 19 (39.6%) | 3 (13.6%) |
| $35,000 to $49,999 | 3 (6.2%) | 2 (9.1%) |
| $50,000 to $74,999 | 11 (22.9%) | 2 (9.1%) |
| $75,000 to $99,999 | 13 (27.1%) | 3 (13.6%) |
| $100,000 to $149,999 | 0 (0.0%) | 2 (9.1%) |
| $150,000 or more | 2 (4.2%) | 7 (31.8%) |
| Total | 48 (100.0%) | 22 (100.0%) |
Property Value to Household Income Ratio in Island Park
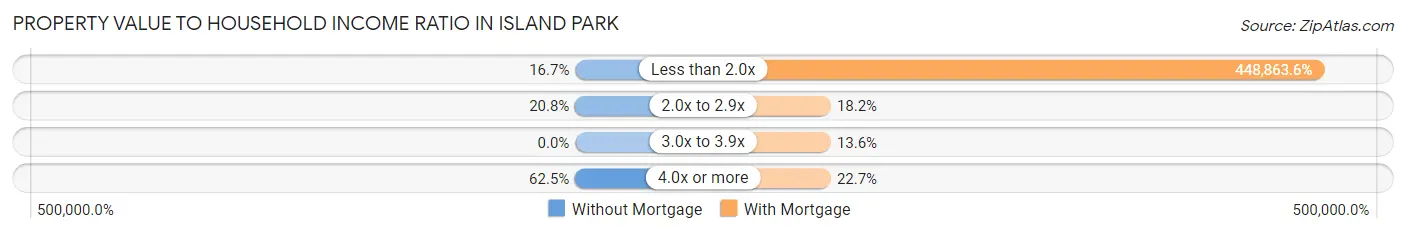
| Value-to-Income Ratio | Without Mortgage | With Mortgage |
| Less than 2.0x | 8 (16.7%) | 98,750 (448,863.6%) |
| 2.0x to 2.9x | 10 (20.8%) | 4 (18.2%) |
| 3.0x to 3.9x | 0 (0.0%) | 3 (13.6%) |
| 4.0x or more | 30 (62.5%) | 5 (22.7%) |
| Total | 48 (100.0%) | 22 (100.0%) |
Real Estate Taxes by Mortgage Status in Island Park
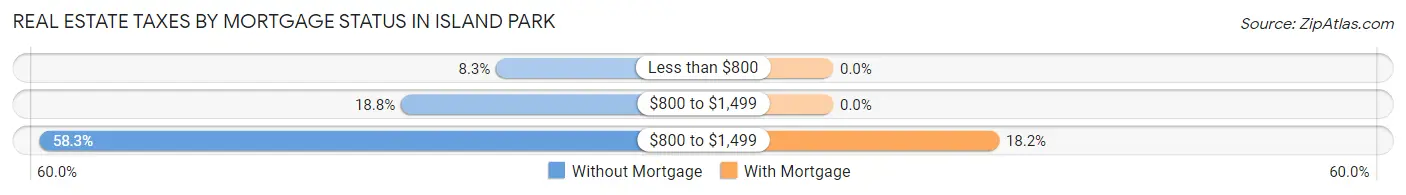
| Property Taxes | Without Mortgage | With Mortgage |
| Less than $800 | 4 (8.3%) | 0 (0.0%) |
| $800 to $1,499 | 9 (18.8%) | 0 (0.0%) |
| $800 to $1,499 | 28 (58.3%) | 4 (18.2%) |
| Total | 48 (100.0%) | 22 (100.0%) |
Health & Disability in Island Park
Health Insurance Coverage by Age in Island Park
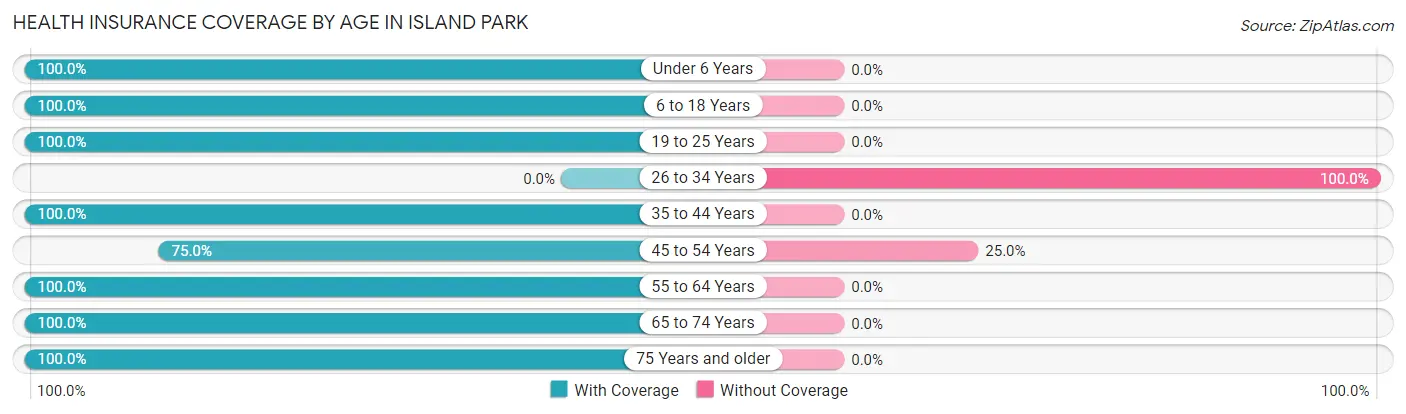
| Age Bracket | With Coverage | Without Coverage |
| Under 6 Years | 1 (100.0%) | 0 (0.0%) |
| 6 to 18 Years | 8 (100.0%) | 0 (0.0%) |
| 19 to 25 Years | 5 (100.0%) | 0 (0.0%) |
| 26 to 34 Years | 0 (0.0%) | 2 (100.0%) |
| 35 to 44 Years | 5 (100.0%) | 0 (0.0%) |
| 45 to 54 Years | 21 (75.0%) | 7 (25.0%) |
| 55 to 64 Years | 26 (100.0%) | 0 (0.0%) |
| 65 to 74 Years | 60 (100.0%) | 0 (0.0%) |
| 75 Years and older | 9 (100.0%) | 0 (0.0%) |
| Total | 135 (93.8%) | 9 (6.2%) |
Health Insurance Coverage by Citizenship Status in Island Park
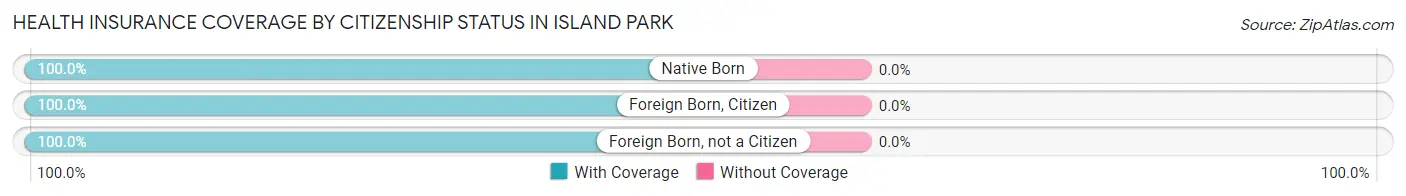
| Citizenship Status | With Coverage | Without Coverage |
| Native Born | 1 (100.0%) | 0 (0.0%) |
| Foreign Born, Citizen | 8 (100.0%) | 0 (0.0%) |
| Foreign Born, not a Citizen | 5 (100.0%) | 0 (0.0%) |
Health Insurance Coverage by Household Income in Island Park
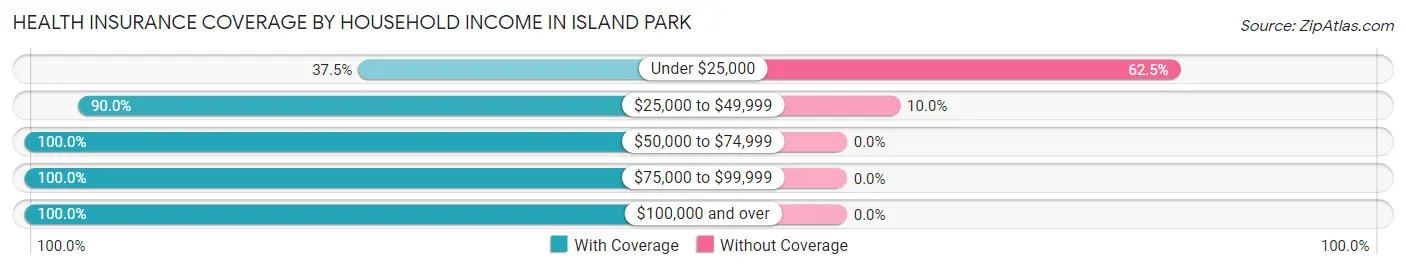
| Household Income | With Coverage | Without Coverage |
| Under $25,000 | 3 (37.5%) | 5 (62.5%) |
| $25,000 to $49,999 | 36 (90.0%) | 4 (10.0%) |
| $50,000 to $74,999 | 37 (100.0%) | 0 (0.0%) |
| $75,000 to $99,999 | 31 (100.0%) | 0 (0.0%) |
| $100,000 and over | 28 (100.0%) | 0 (0.0%) |
Public vs Private Health Insurance Coverage by Age in Island Park
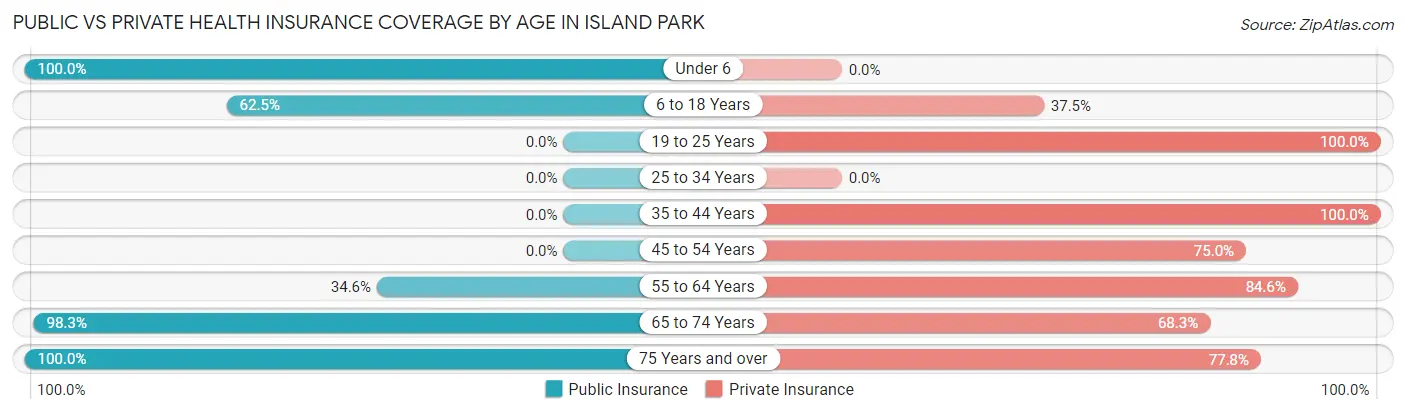
| Age Bracket | Public Insurance | Private Insurance |
| Under 6 | 1 (100.0%) | 0 (0.0%) |
| 6 to 18 Years | 5 (62.5%) | 3 (37.5%) |
| 19 to 25 Years | 0 (0.0%) | 5 (100.0%) |
| 25 to 34 Years | 0 (0.0%) | 0 (0.0%) |
| 35 to 44 Years | 0 (0.0%) | 5 (100.0%) |
| 45 to 54 Years | 0 (0.0%) | 21 (75.0%) |
| 55 to 64 Years | 9 (34.6%) | 22 (84.6%) |
| 65 to 74 Years | 59 (98.3%) | 41 (68.3%) |
| 75 Years and over | 9 (100.0%) | 7 (77.8%) |
| Total | 83 (57.6%) | 104 (72.2%) |
Disability Status by Sex by Age in Island Park
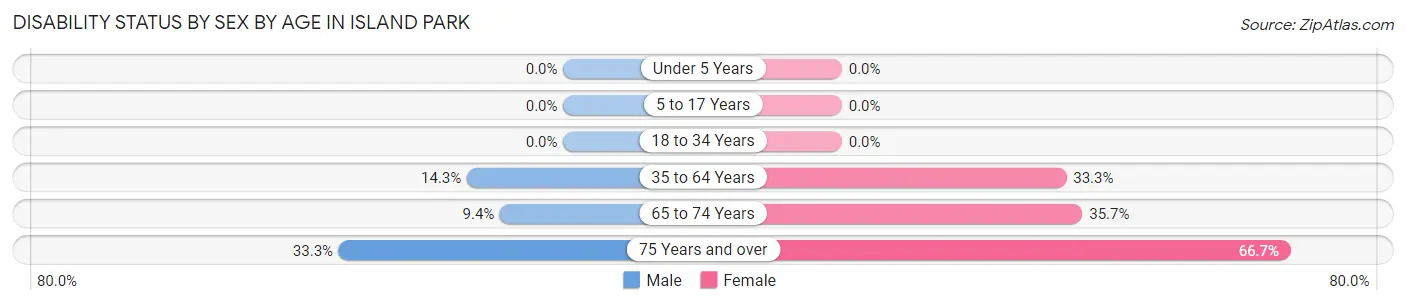
| Age Bracket | Male | Female |
| Under 5 Years | 0 (0.0%) | 0 (0.0%) |
| 5 to 17 Years | 0 (0.0%) | 0 (0.0%) |
| 18 to 34 Years | 0 (0.0%) | 0 (0.0%) |
| 35 to 64 Years | 5 (14.3%) | 8 (33.3%) |
| 65 to 74 Years | 3 (9.4%) | 10 (35.7%) |
| 75 Years and over | 2 (33.3%) | 2 (66.7%) |
Disability Class by Sex by Age in Island Park
Disability Class: Hearing Difficulty
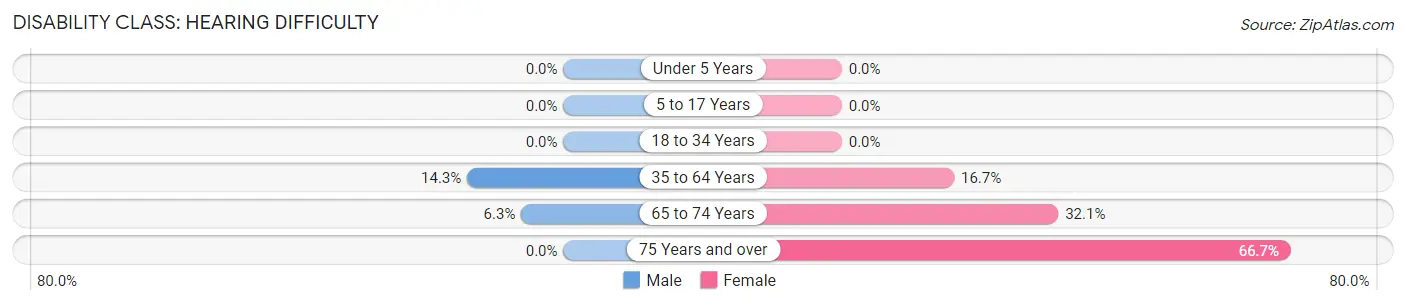
| Age Bracket | Male | Female |
| Under 5 Years | 0 (0.0%) | 0 (0.0%) |
| 5 to 17 Years | 0 (0.0%) | 0 (0.0%) |
| 18 to 34 Years | 0 (0.0%) | 0 (0.0%) |
| 35 to 64 Years | 5 (14.3%) | 4 (16.7%) |
| 65 to 74 Years | 2 (6.2%) | 9 (32.1%) |
| 75 Years and over | 0 (0.0%) | 2 (66.7%) |
Disability Class: Vision Difficulty
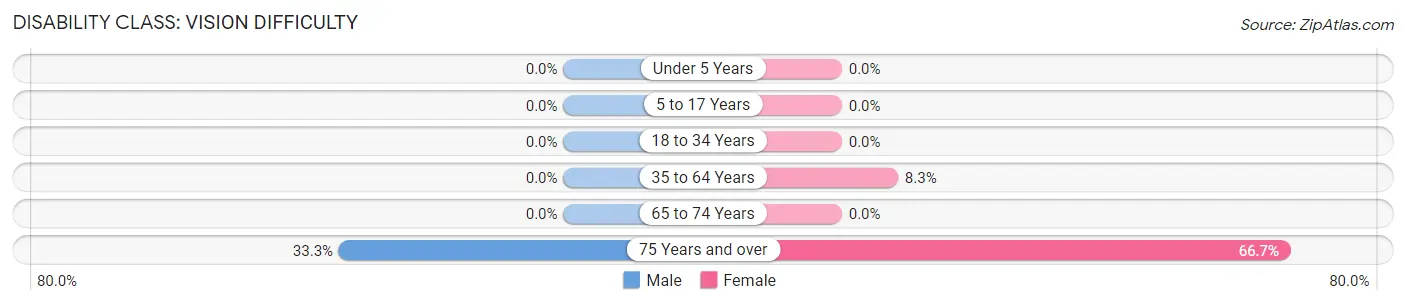
| Age Bracket | Male | Female |
| Under 5 Years | 0 (0.0%) | 0 (0.0%) |
| 5 to 17 Years | 0 (0.0%) | 0 (0.0%) |
| 18 to 34 Years | 0 (0.0%) | 0 (0.0%) |
| 35 to 64 Years | 0 (0.0%) | 2 (8.3%) |
| 65 to 74 Years | 0 (0.0%) | 0 (0.0%) |
| 75 Years and over | 2 (33.3%) | 2 (66.7%) |
Disability Class: Cognitive Difficulty
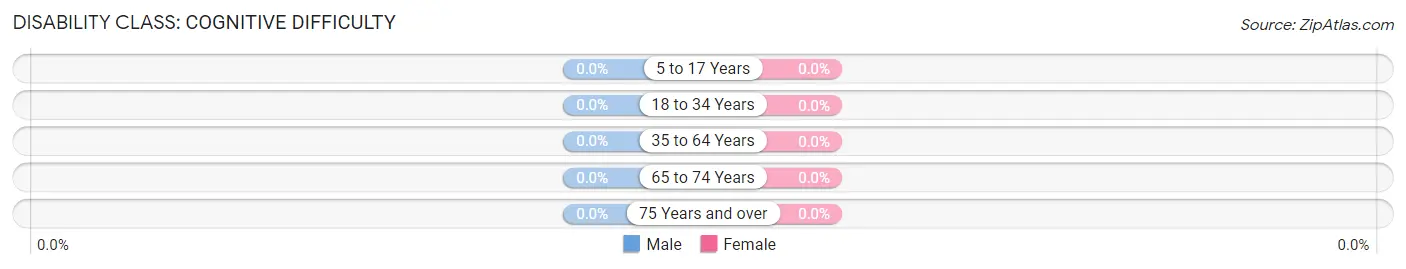
| Age Bracket | Male | Female |
| 5 to 17 Years | 0 (0.0%) | 0 (0.0%) |
| 18 to 34 Years | 0 (0.0%) | 0 (0.0%) |
| 35 to 64 Years | 0 (0.0%) | 0 (0.0%) |
| 65 to 74 Years | 0 (0.0%) | 0 (0.0%) |
| 75 Years and over | 0 (0.0%) | 0 (0.0%) |
Disability Class: Ambulatory Difficulty
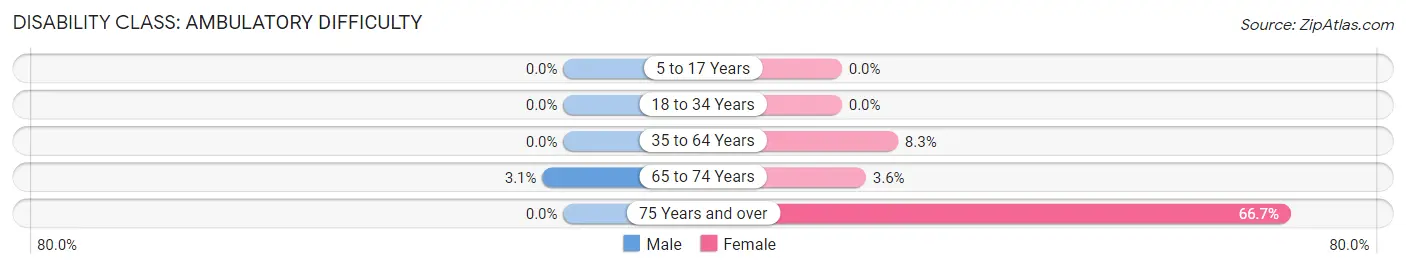
| Age Bracket | Male | Female |
| 5 to 17 Years | 0 (0.0%) | 0 (0.0%) |
| 18 to 34 Years | 0 (0.0%) | 0 (0.0%) |
| 35 to 64 Years | 0 (0.0%) | 2 (8.3%) |
| 65 to 74 Years | 1 (3.1%) | 1 (3.6%) |
| 75 Years and over | 0 (0.0%) | 2 (66.7%) |
Disability Class: Self-Care Difficulty
| Age Bracket | Male | Female |
| 5 to 17 Years | 0 (0.0%) | 0 (0.0%) |
| 18 to 34 Years | 0 (0.0%) | 0 (0.0%) |
| 35 to 64 Years | 0 (0.0%) | 0 (0.0%) |
| 65 to 74 Years | 0 (0.0%) | 0 (0.0%) |
| 75 Years and over | 0 (0.0%) | 0 (0.0%) |
Technology Access in Island Park
Computing Device Access in Island Park
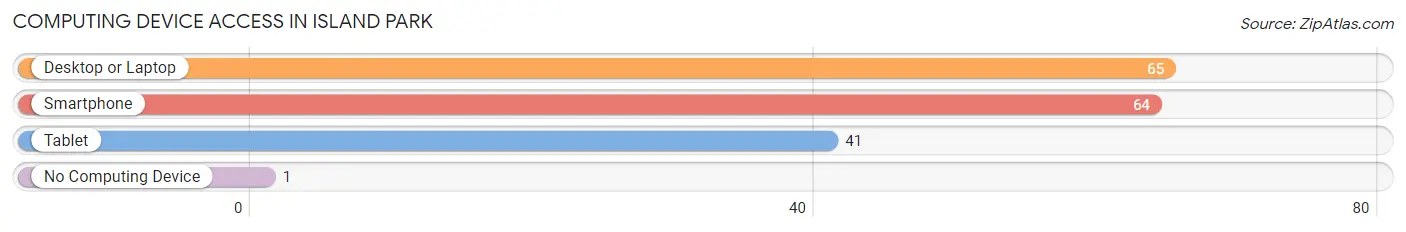
| Device Type | # Households | % Households |
| Desktop or Laptop | 65 | 92.9% |
| Smartphone | 64 | 91.4% |
| Tablet | 41 | 58.6% |
| No Computing Device | 1 | 1.4% |
| Total | 70 | 100.0% |
Internet Access in Island Park
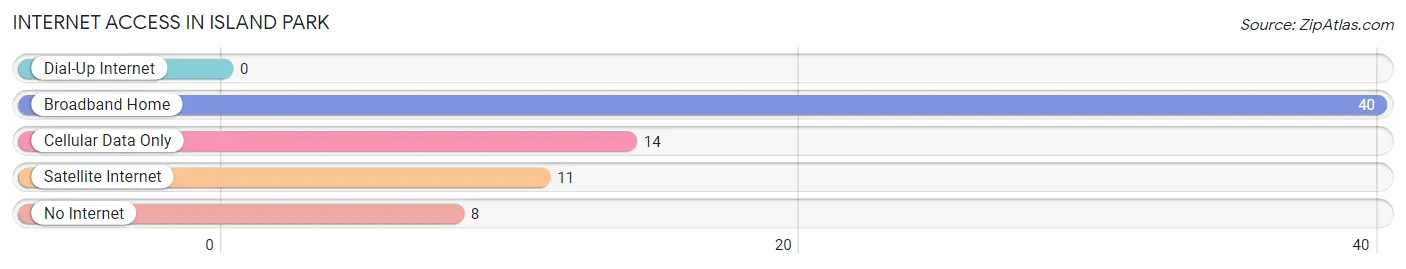
| Internet Type | # Households | % Households |
| Dial-Up Internet | 0 | 0.0% |
| Broadband Home | 40 | 57.1% |
| Cellular Data Only | 14 | 20.0% |
| Satellite Internet | 11 | 15.7% |
| No Internet | 8 | 11.4% |
| Total | 70 | 100.0% |
Island Park Summary
Island Park is a small town located in Fremont County, Idaho, United States. It is situated in the southeastern corner of the state, near the border with Wyoming and Montana. The town is located in the Island Park Caldera, a large volcanic caldera that was formed by a series of eruptions about 2 million years ago. The town is surrounded by the Caribou-Targhee National Forest and is home to many outdoor activities, including fishing, camping, hiking, and snowmobiling.
History
The area around Island Park was first inhabited by the Shoshone and Bannock Native American tribes. The first non-native settlers arrived in the area in the late 1800s, and the town of Island Park was officially established in 1908. The town was named after the nearby Island Park Reservoir, which was created in the early 1900s to provide irrigation water for the surrounding area.
In the early 1900s, the town was a popular destination for tourists, who came to enjoy the area’s natural beauty and outdoor activities. The town was also home to several resorts, which provided lodging and other amenities for visitors.
In the 1950s, the town began to experience a decline in tourism due to the construction of the nearby Henry’s Fork Dam. The dam caused the water level of the reservoir to drop, making it less attractive to visitors. In the 1960s, the town began to experience a resurgence in tourism due to the construction of the nearby Yellowstone National Park.
Geography
Island Park is located in the southeastern corner of Idaho, near the border with Wyoming and Montana. The town is situated in the Island Park Caldera, a large volcanic caldera that was formed by a series of eruptions about 2 million years ago. The town is surrounded by the Caribou-Targhee National Forest and is home to many outdoor activities, including fishing, camping, hiking, and snowmobiling.
The town is located at an elevation of 6,400 feet and has a total area of 4.2 square miles. The climate in Island Park is semi-arid, with hot summers and cold winters. The average annual temperature is 44°F, and the average annual precipitation is 16 inches.
Economy
The economy of Island Park is largely based on tourism. The town is home to several resorts, which provide lodging and other amenities for visitors. The town is also home to several restaurants, bars, and shops, which cater to tourists.
In addition to tourism, the town is also home to several businesses that provide goods and services to the local community. These businesses include a grocery store, a hardware store, a gas station, and a post office.
Demographics
As of the 2010 census, the population of Island Park was 545. The racial makeup of the town was 95.3% White, 0.2% African American, 0.7% Native American, 0.2% Asian, 0.2% Pacific Islander, and 3.6% from other races. The median household income was $37,500, and the median family income was $41,250. The per capita income was $19,890.
Conclusion
Island Park is a small town located in Fremont County, Idaho, United States. It is situated in the Island Park Caldera, a large volcanic caldera that was formed by a series of eruptions about 2 million years ago. The town is surrounded by the Caribou-Targhee National Forest and is home to many outdoor activities, including fishing, camping, hiking, and snowmobiling. The economy of Island Park is largely based on tourism, and the town is home to several resorts, restaurants, bars, and shops. As of the 2010 census, the population of Island Park was 545. The racial makeup of the town was 95.3% White, 0.2% African American, 0.7% Native American, 0.2% Asian, 0.2% Pacific Islander, and 3.6% from other races. The median household income was $37,500, and the median family income was $41,250. The per capita income was $19,890.
Common Questions
What is Per Capita Income in Island Park?
Per Capita income in Island Park is $50,215.
What is the Median Family Income in Island Park?
Median Family Income in Island Park is $88,000.
What is the Median Household income in Island Park?
Median Household Income in Island Park is $68,333.
What is Income or Wage Gap in Island Park?
Income or Wage Gap in Island Park is 40.0%.
Women in Island Park earn 60.0 cents for every dollar earned by a man.
What is Inequality or Gini Index in Island Park?
Inequality or Gini Index in Island Park is 0.50.
What is the Total Population of Island Park?
Total Population of Island Park is 144.
What is the Total Male Population of Island Park?
Total Male Population of Island Park is 79.
What is the Total Female Population of Island Park?
Total Female Population of Island Park is 65.
What is the Ratio of Males per 100 Females in Island Park?
There are 121.54 Males per 100 Females in Island Park.
What is the Ratio of Females per 100 Males in Island Park?
There are 82.28 Females per 100 Males in Island Park.
What is the Median Population Age in Island Park?
Median Population Age in Island Park is 64.5 Years.
What is the Average Family Size in Island Park
Average Family Size in Island Park is 2.4 People.
What is the Average Household Size in Island Park
Average Household Size in Island Park is 2.1 People.
How Large is the Labor Force in Island Park?
There are 60 People in the Labor Forcein in Island Park.
What is the Percentage of People in the Labor Force in Island Park?
43.2% of People are in the Labor Force in Island Park.