Inkom, ID Map & Demographics
Inkom Map
Inkom Overview
$25,945
PER CAPITA INCOME
$95,625
AVG FAMILY INCOME
$68,594
AVG HOUSEHOLD INCOME
0.38
INEQUALITY / GINI INDEX
954
TOTAL POPULATION
513
MALE POPULATION
441
FEMALE POPULATION
116.33
MALES / 100 FEMALES
85.96
FEMALES / 100 MALES
33.8
MEDIAN AGE
4.5
AVG FAMILY SIZE
3.5
AVG HOUSEHOLD SIZE
408
LABOR FORCE [ PEOPLE ]
59.4%
PERCENT IN LABOR FORCE
3.7%
UNEMPLOYMENT RATE
Inkom Zip Codes
Inkom Area Codes
Income in Inkom
Income Overview in Inkom
Per Capita Income in Inkom is $25,945, while median incomes of families and households are $95,625 and $68,594 respectively.
| Characteristic | Number | Measure |
| Per Capita Income | 954 | $25,945 |
| Median Family Income | 190 | $95,625 |
| Mean Family Income | 190 | $96,877 |
| Median Household Income | 272 | $68,594 |
| Mean Household Income | 272 | $80,411 |
| Income Deficit | 190 | $0 |
| Wage / Income Gap (%) | 954 | 0.00% |
| Wage / Income Gap ($) | 954 | 100.00¢ per $1 |
| Gini / Inequality Index | 954 | 0.38 |
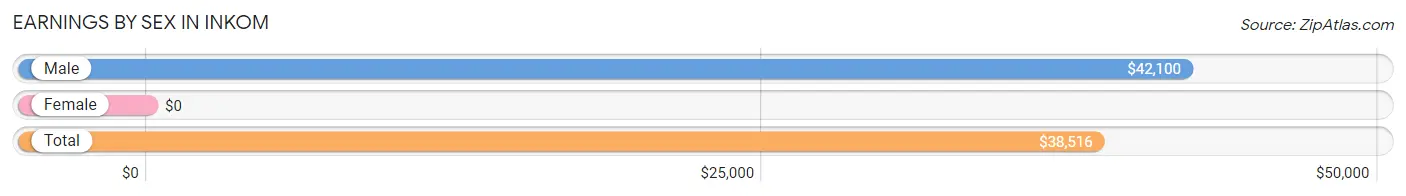
Earnings by Sex in Inkom
| Sex | Number | Average Earnings |
| Male | 274 (60.9%) | $42,100 |
| Female | 176 (39.1%) | $0 |
| Total | 450 (100.0%) | $38,516 |
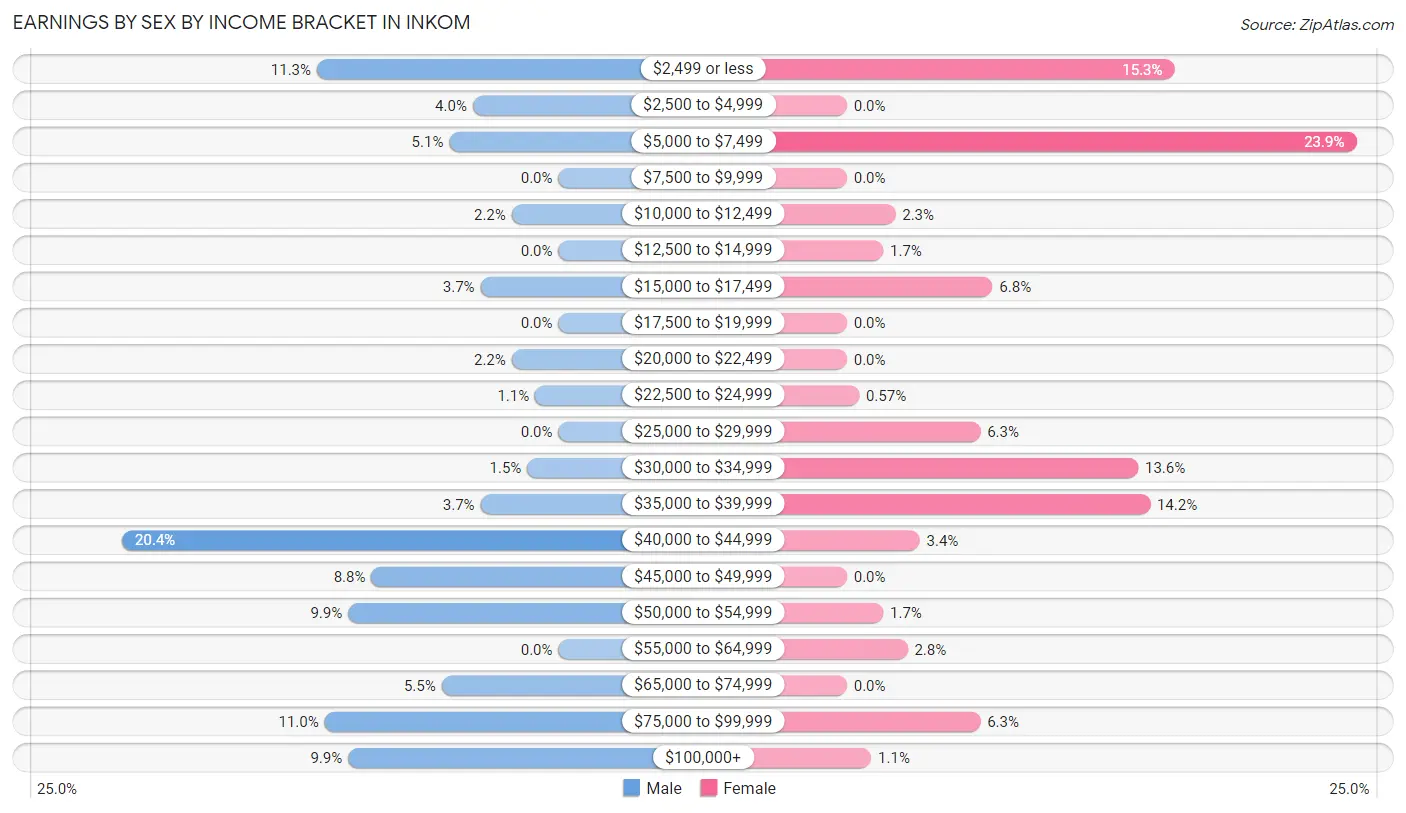
Earnings by Sex by Income Bracket in Inkom
The most common earnings brackets in Inkom are $40,000 to $44,999 for men (56 | 20.4%) and $5,000 to $7,499 for women (42 | 23.9%).
| Income | Male | Female |
| $2,499 or less | 31 (11.3%) | 27 (15.3%) |
| $2,500 to $4,999 | 11 (4.0%) | 0 (0.0%) |
| $5,000 to $7,499 | 14 (5.1%) | 42 (23.9%) |
| $7,500 to $9,999 | 0 (0.0%) | 0 (0.0%) |
| $10,000 to $12,499 | 6 (2.2%) | 4 (2.3%) |
| $12,500 to $14,999 | 0 (0.0%) | 3 (1.7%) |
| $15,000 to $17,499 | 10 (3.6%) | 12 (6.8%) |
| $17,500 to $19,999 | 0 (0.0%) | 0 (0.0%) |
| $20,000 to $22,499 | 6 (2.2%) | 0 (0.0%) |
| $22,500 to $24,999 | 3 (1.1%) | 1 (0.6%) |
| $25,000 to $29,999 | 0 (0.0%) | 11 (6.2%) |
| $30,000 to $34,999 | 4 (1.5%) | 24 (13.6%) |
| $35,000 to $39,999 | 10 (3.6%) | 25 (14.2%) |
| $40,000 to $44,999 | 56 (20.4%) | 6 (3.4%) |
| $45,000 to $49,999 | 24 (8.8%) | 0 (0.0%) |
| $50,000 to $54,999 | 27 (9.9%) | 3 (1.7%) |
| $55,000 to $64,999 | 0 (0.0%) | 5 (2.8%) |
| $65,000 to $74,999 | 15 (5.5%) | 0 (0.0%) |
| $75,000 to $99,999 | 30 (11.0%) | 11 (6.2%) |
| $100,000+ | 27 (9.9%) | 2 (1.1%) |
| Total | 274 (100.0%) | 176 (100.0%) |
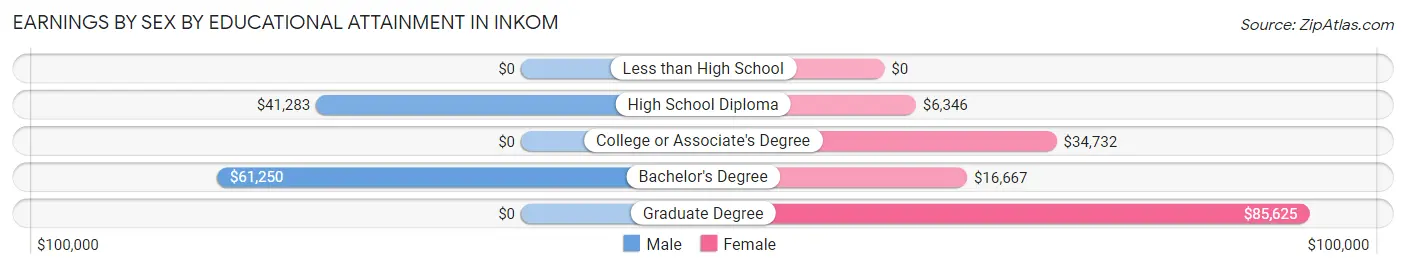
Earnings by Sex by Educational Attainment in Inkom
Average earnings in Inkom are $47,000 for men and $28,056 for women, a difference of 40.3%. Men with an educational attainment of bachelor's degree enjoy the highest average annual earnings of $61,250, while those with high school diploma education earn the least with $41,283. Women with an educational attainment of graduate degree earn the most with the average annual earnings of $85,625, while those with high school diploma education have the smallest earnings of $6,346.
| Educational Attainment | Male Income | Female Income |
| Less than High School | - | - |
| High School Diploma | $41,283 | $6,346 |
| College or Associate's Degree | - | - |
| Bachelor's Degree | $61,250 | $16,667 |
| Graduate Degree | - | - |
| Total | $47,000 | $28,056 |
Family Income in Inkom
Family Income Brackets in Inkom
According to the Inkom family income data, there are 47 families falling into the $100,000 to $149,999 income range, which is the most common income bracket and makes up 24.7% of all families.
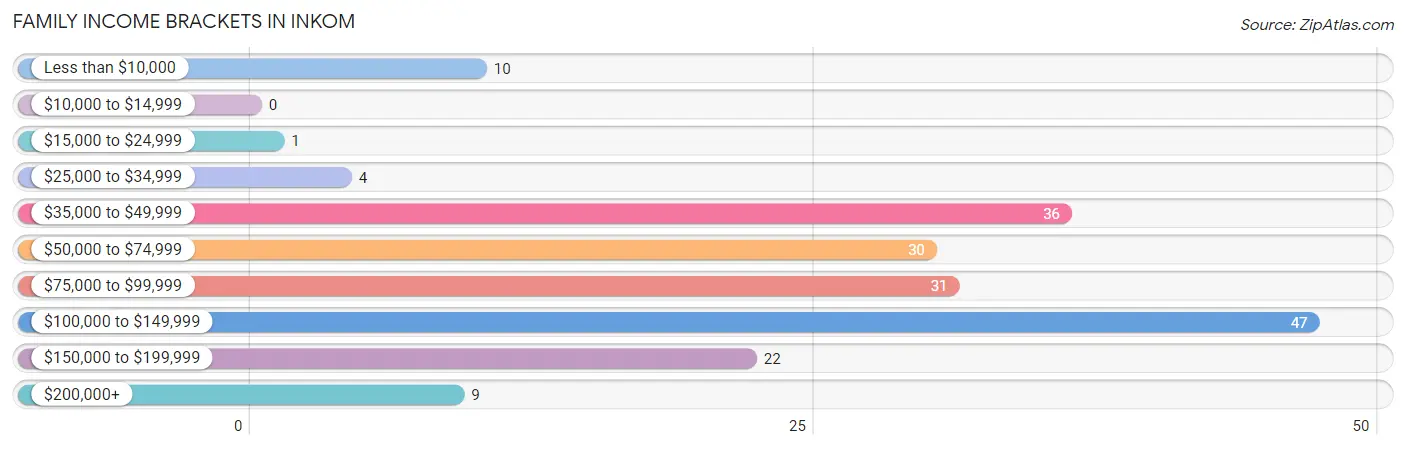
| Income Bracket | # Families | % Families |
| Less than $10,000 | 10 | 5.3% |
| $10,000 to $14,999 | 0 | 0.0% |
| $15,000 to $24,999 | 1 | 0.5% |
| $25,000 to $34,999 | 4 | 2.1% |
| $35,000 to $49,999 | 36 | 18.9% |
| $50,000 to $74,999 | 30 | 15.8% |
| $75,000 to $99,999 | 31 | 16.3% |
| $100,000 to $149,999 | 47 | 24.7% |
| $150,000 to $199,999 | 22 | 11.6% |
| $200,000+ | 9 | 4.7% |
Family Income by Famaliy Size in Inkom
7+ person families (11 | 5.8%) account for the highest median family income in Inkom with $113,542 per family, while 2-person families (40 | 21.0%) have the highest median income of $29,546 per family member.
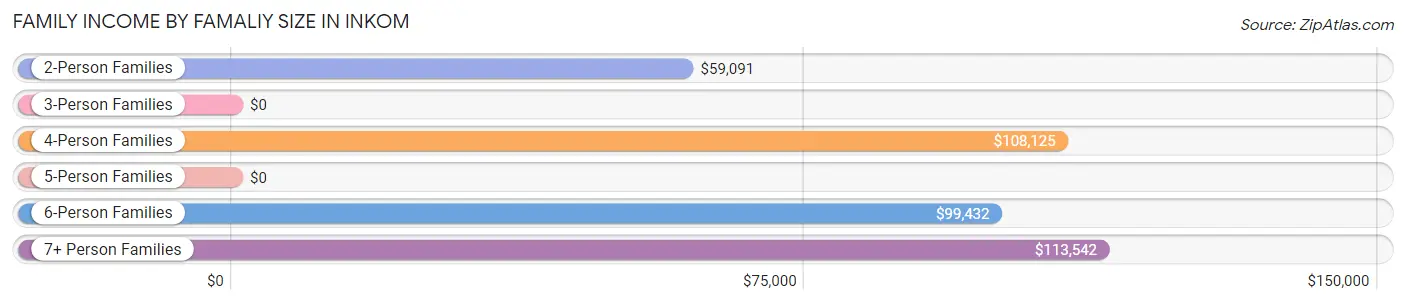
| Income Bracket | # Families | Median Income |
| 2-Person Families | 40 (21.0%) | $59,091 |
| 3-Person Families | 74 (39.0%) | $0 |
| 4-Person Families | 41 (21.6%) | $108,125 |
| 5-Person Families | 7 (3.7%) | $0 |
| 6-Person Families | 17 (8.9%) | $99,432 |
| 7+ Person Families | 11 (5.8%) | $113,542 |
| Total | 190 (100.0%) | $95,625 |
Family Income by Number of Earners in Inkom
The median family income in Inkom is $95,625, with families comprising no earners (11) having the highest median family income of $137,813, while families with 1 earner (61) have the lowest median family income of $69,375, accounting for 5.8% and 32.1% of families, respectively.
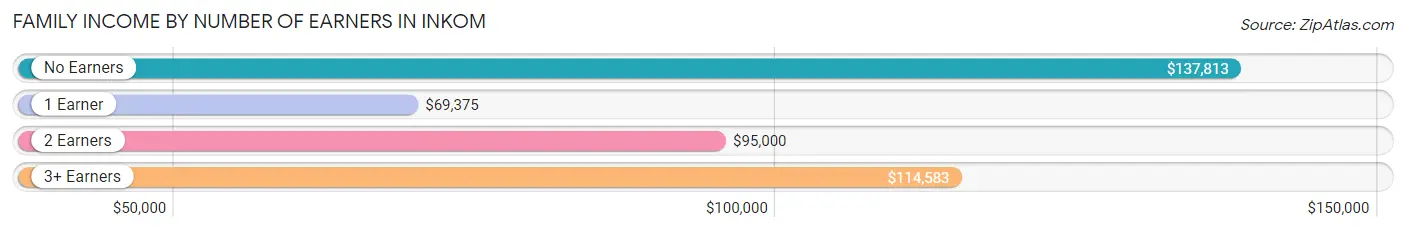
| Number of Earners | # Families | Median Income |
| No Earners | 11 (5.8%) | $137,813 |
| 1 Earner | 61 (32.1%) | $69,375 |
| 2 Earners | 88 (46.3%) | $95,000 |
| 3+ Earners | 30 (15.8%) | $114,583 |
| Total | 190 (100.0%) | $95,625 |
Household Income in Inkom
Household Income Brackets in Inkom
With 66 households falling in the category, the $35,000 to $49,999 income range is the most frequent in Inkom, accounting for 24.3% of all households.
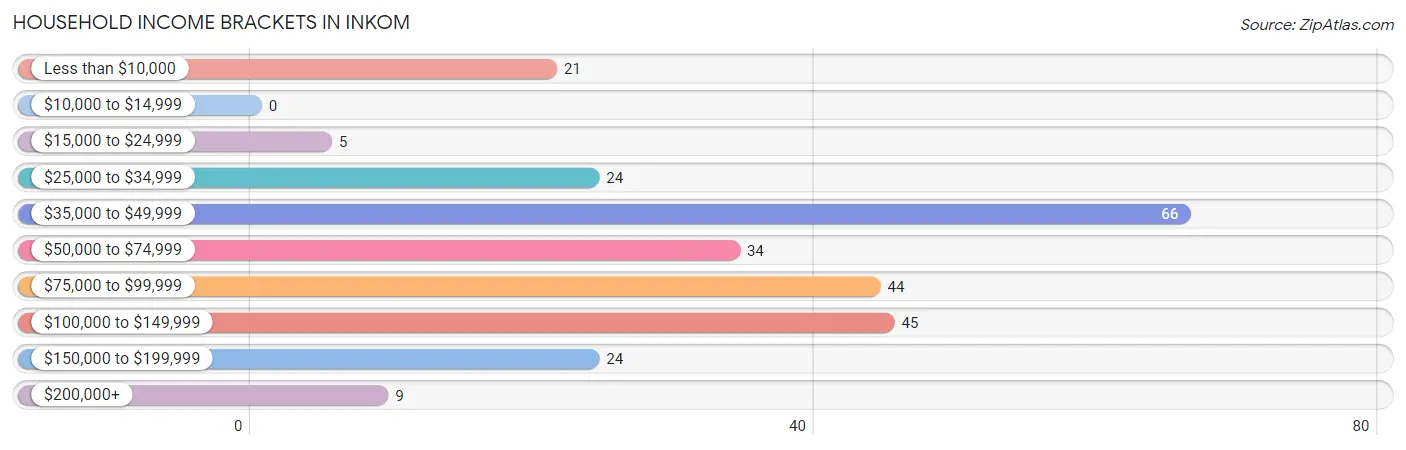
| Income Bracket | # Households | % Households |
| Less than $10,000 | 21 | 7.7% |
| $10,000 to $14,999 | 0 | 0.0% |
| $15,000 to $24,999 | 5 | 1.8% |
| $25,000 to $34,999 | 24 | 8.8% |
| $35,000 to $49,999 | 66 | 24.3% |
| $50,000 to $74,999 | 34 | 12.5% |
| $75,000 to $99,999 | 44 | 16.2% |
| $100,000 to $149,999 | 45 | 16.5% |
| $150,000 to $199,999 | 24 | 8.8% |
| $200,000+ | 9 | 3.3% |
Household Income by Householder Age in Inkom
The median household income in Inkom is $68,594, with the highest median household income of $85,417 found in the 25 to 44 years age bracket for the primary householder. A total of 99 households (36.4%) fall into this category.
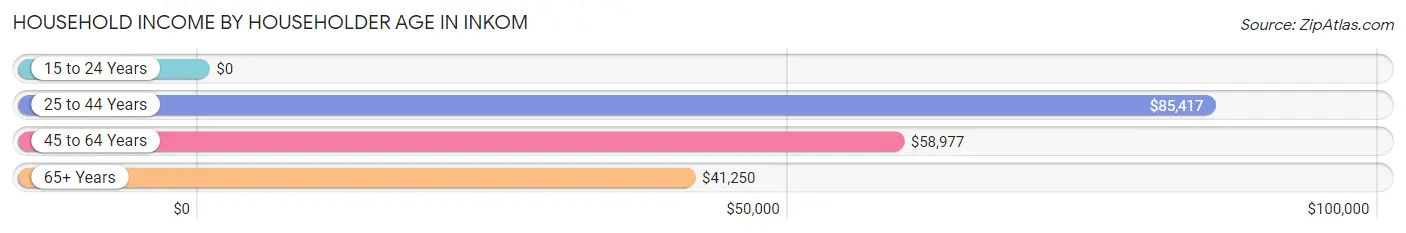
| Income Bracket | # Households | Median Income |
| 15 to 24 Years | 0 (0.0%) | $0 |
| 25 to 44 Years | 99 (36.4%) | $85,417 |
| 45 to 64 Years | 101 (37.1%) | $58,977 |
| 65+ Years | 72 (26.5%) | $41,250 |
| Total | 272 (100.0%) | $68,594 |
Poverty in Inkom
Income Below Poverty by Sex and Age in Inkom
With 8.2% poverty level for males and 2.5% for females among the residents of Inkom, 18 to 24 year old males and 45 to 54 year old females are the most vulnerable to poverty, with 12 males (32.4%) and 8 females (21.6%) in their respective age groups living below the poverty level.
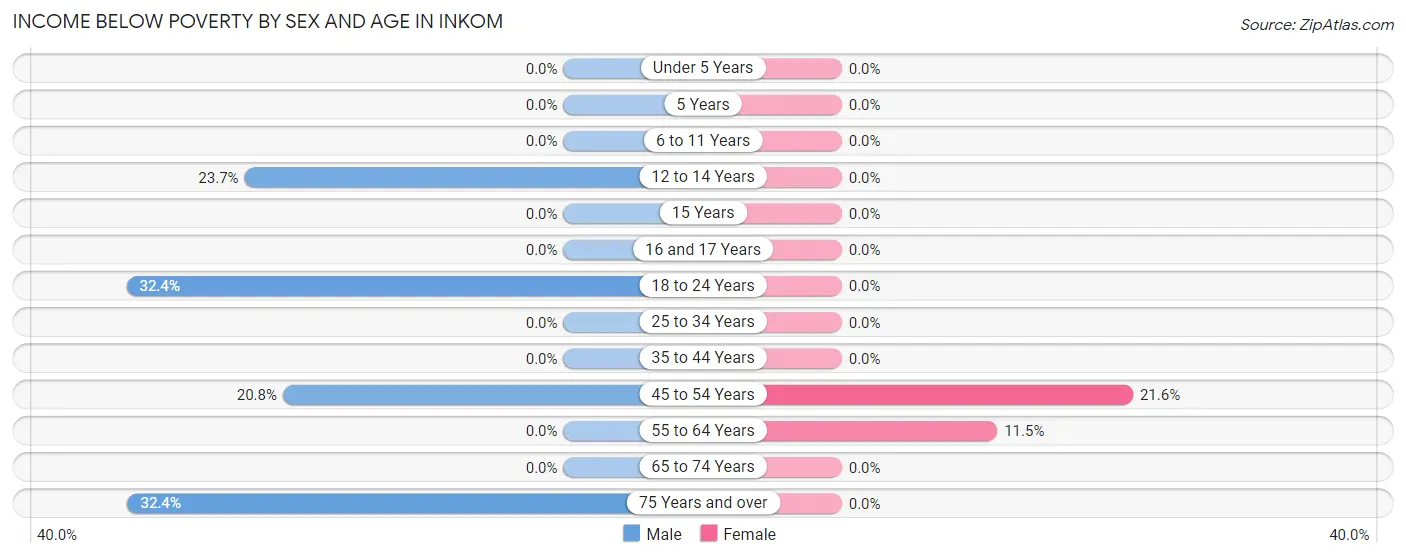
| Age Bracket | Male | Female |
| Under 5 Years | 0 (0.0%) | 0 (0.0%) |
| 5 Years | 0 (0.0%) | 0 (0.0%) |
| 6 to 11 Years | 0 (0.0%) | 0 (0.0%) |
| 12 to 14 Years | 9 (23.7%) | 0 (0.0%) |
| 15 Years | 0 (0.0%) | 0 (0.0%) |
| 16 and 17 Years | 0 (0.0%) | 0 (0.0%) |
| 18 to 24 Years | 12 (32.4%) | 0 (0.0%) |
| 25 to 34 Years | 0 (0.0%) | 0 (0.0%) |
| 35 to 44 Years | 0 (0.0%) | 0 (0.0%) |
| 45 to 54 Years | 10 (20.8%) | 8 (21.6%) |
| 55 to 64 Years | 0 (0.0%) | 3 (11.5%) |
| 65 to 74 Years | 0 (0.0%) | 0 (0.0%) |
| 75 Years and over | 11 (32.4%) | 0 (0.0%) |
| Total | 42 (8.2%) | 11 (2.5%) |
Income Above Poverty by Sex and Age in Inkom
According to the poverty statistics in Inkom, males aged under 5 years and females aged under 5 years are the age groups that are most secure financially, with 100.0% of males and 100.0% of females in these age groups living above the poverty line.
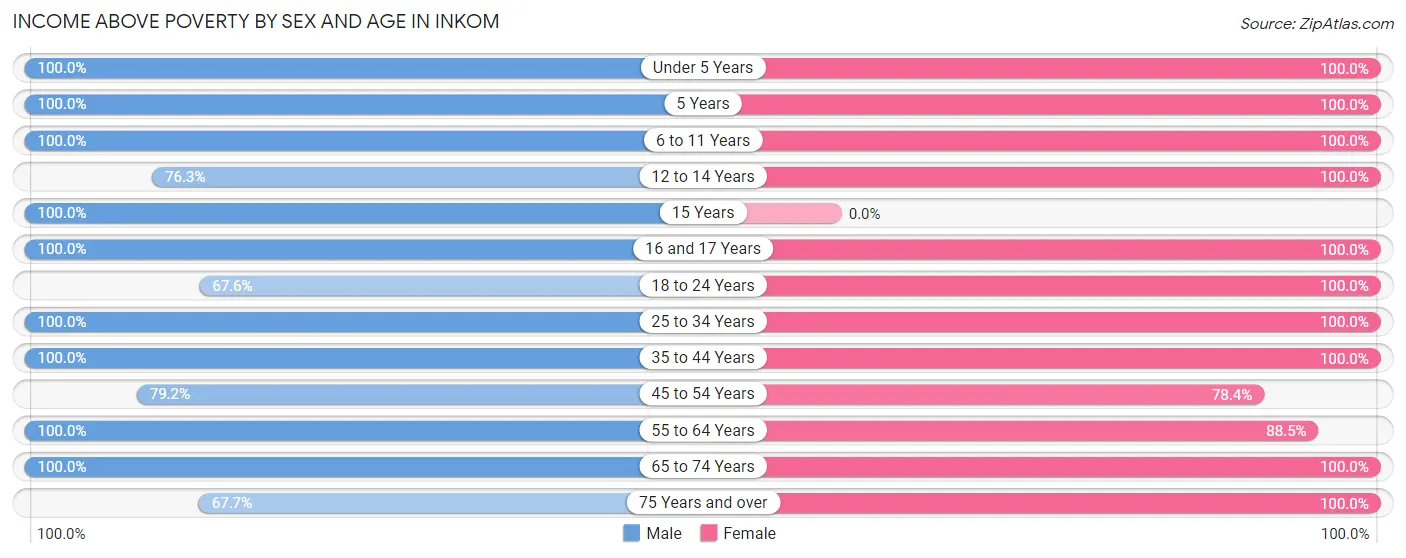
| Age Bracket | Male | Female |
| Under 5 Years | 35 (100.0%) | 42 (100.0%) |
| 5 Years | 3 (100.0%) | 3 (100.0%) |
| 6 to 11 Years | 51 (100.0%) | 53 (100.0%) |
| 12 to 14 Years | 29 (76.3%) | 37 (100.0%) |
| 15 Years | 5 (100.0%) | 0 (0.0%) |
| 16 and 17 Years | 26 (100.0%) | 34 (100.0%) |
| 18 to 24 Years | 25 (67.6%) | 6 (100.0%) |
| 25 to 34 Years | 30 (100.0%) | 112 (100.0%) |
| 35 to 44 Years | 131 (100.0%) | 46 (100.0%) |
| 45 to 54 Years | 38 (79.2%) | 29 (78.4%) |
| 55 to 64 Years | 51 (100.0%) | 23 (88.5%) |
| 65 to 74 Years | 24 (100.0%) | 30 (100.0%) |
| 75 Years and over | 23 (67.6%) | 15 (100.0%) |
| Total | 471 (91.8%) | 430 (97.5%) |
Income Below Poverty Among Married-Couple Families in Inkom
The poverty statistics for married-couple families in Inkom show that 6.9% or 10 of the total 144 families live below the poverty line. Families with 1 or 2 children have the highest poverty rate of 13.2%, comprising of 10 families. On the other hand, families with no children have the lowest poverty rate of 0.0%, which includes 0 families.
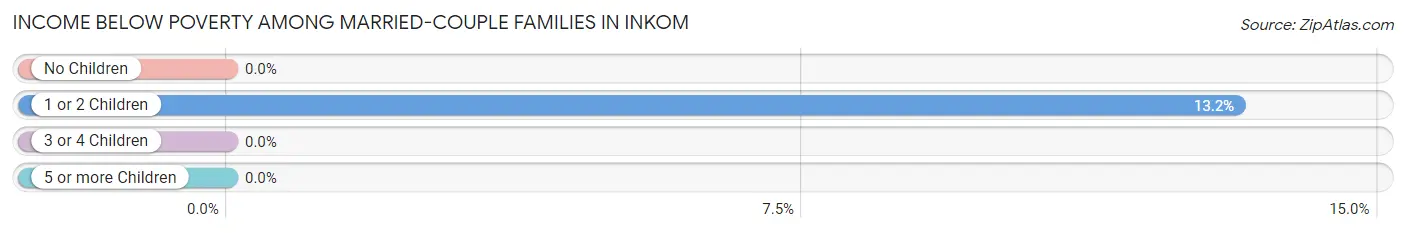
| Children | Above Poverty | Below Poverty |
| No Children | 43 (100.0%) | 0 (0.0%) |
| 1 or 2 Children | 66 (86.8%) | 10 (13.2%) |
| 3 or 4 Children | 22 (100.0%) | 0 (0.0%) |
| 5 or more Children | 3 (100.0%) | 0 (0.0%) |
| Total | 134 (93.1%) | 10 (6.9%) |
Income Below Poverty Among Single-Parent Households in Inkom
| Children | Single Father | Single Mother |
| No Children | 0 (0.0%) | 0 (0.0%) |
| 1 or 2 Children | 0 (0.0%) | 0 (0.0%) |
| 3 or 4 Children | 0 (0.0%) | 0 (0.0%) |
| 5 or more Children | 0 (0.0%) | 0 (0.0%) |
| Total | 0 (0.0%) | 0 (0.0%) |
Income Below Poverty Among Married-Couple vs Single-Parent Households in Inkom
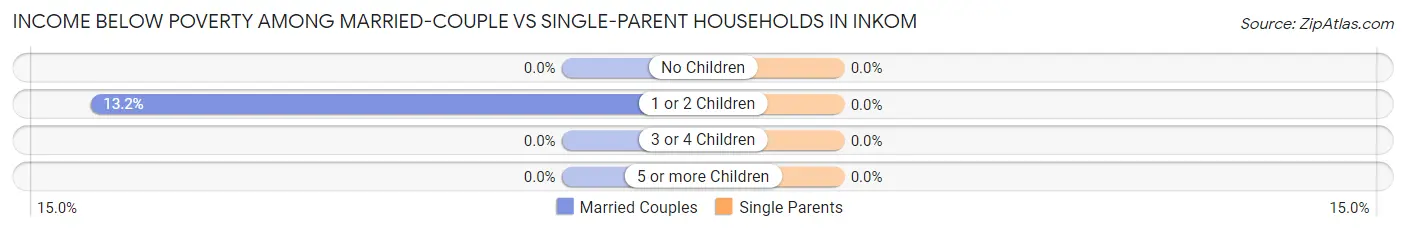
| Children | Married-Couple Families | Single-Parent Households |
| No Children | 0 (0.0%) | 0 (0.0%) |
| 1 or 2 Children | 10 (13.2%) | 0 (0.0%) |
| 3 or 4 Children | 0 (0.0%) | 0 (0.0%) |
| 5 or more Children | 0 (0.0%) | 0 (0.0%) |
| Total | 10 (6.9%) | 0 (0.0%) |
Race in Inkom
The most populous races in Inkom are White / Caucasian (889 | 93.2%), Two or more Races (59 | 6.2%), and Hispanic or Latino (24 | 2.5%).
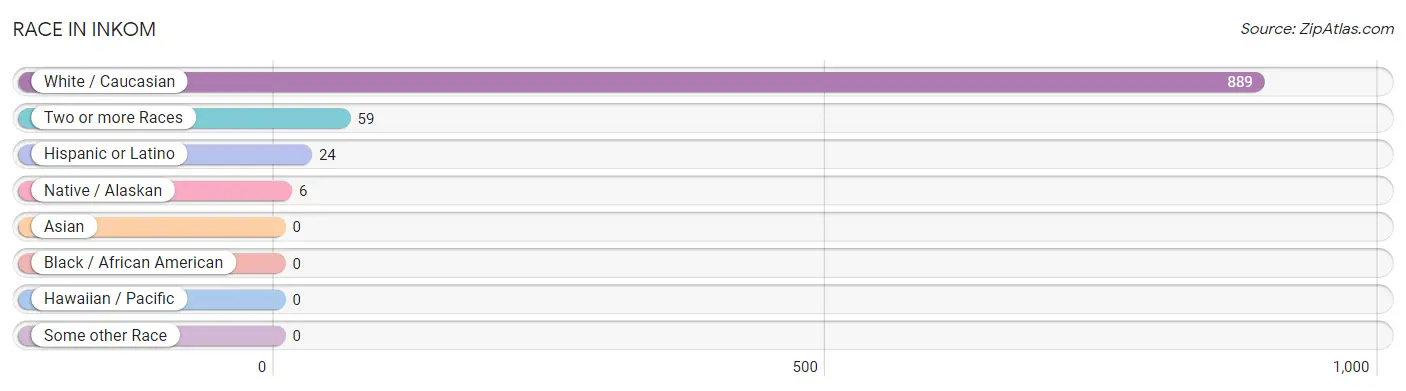
| Race | # Population | % Population |
| Asian | 0 | 0.0% |
| Black / African American | 0 | 0.0% |
| Hawaiian / Pacific | 0 | 0.0% |
| Hispanic or Latino | 24 | 2.5% |
| Native / Alaskan | 6 | 0.6% |
| White / Caucasian | 889 | 93.2% |
| Two or more Races | 59 | 6.2% |
| Some other Race | 0 | 0.0% |
| Total | 954 | 100.0% |
Ancestry in Inkom
The most populous ancestries reported in Inkom are English (207 | 21.7%), German (162 | 17.0%), European (127 | 13.3%), Slovak (63 | 6.6%), and Norwegian (50 | 5.2%), together accounting for 63.8% of all Inkom residents.
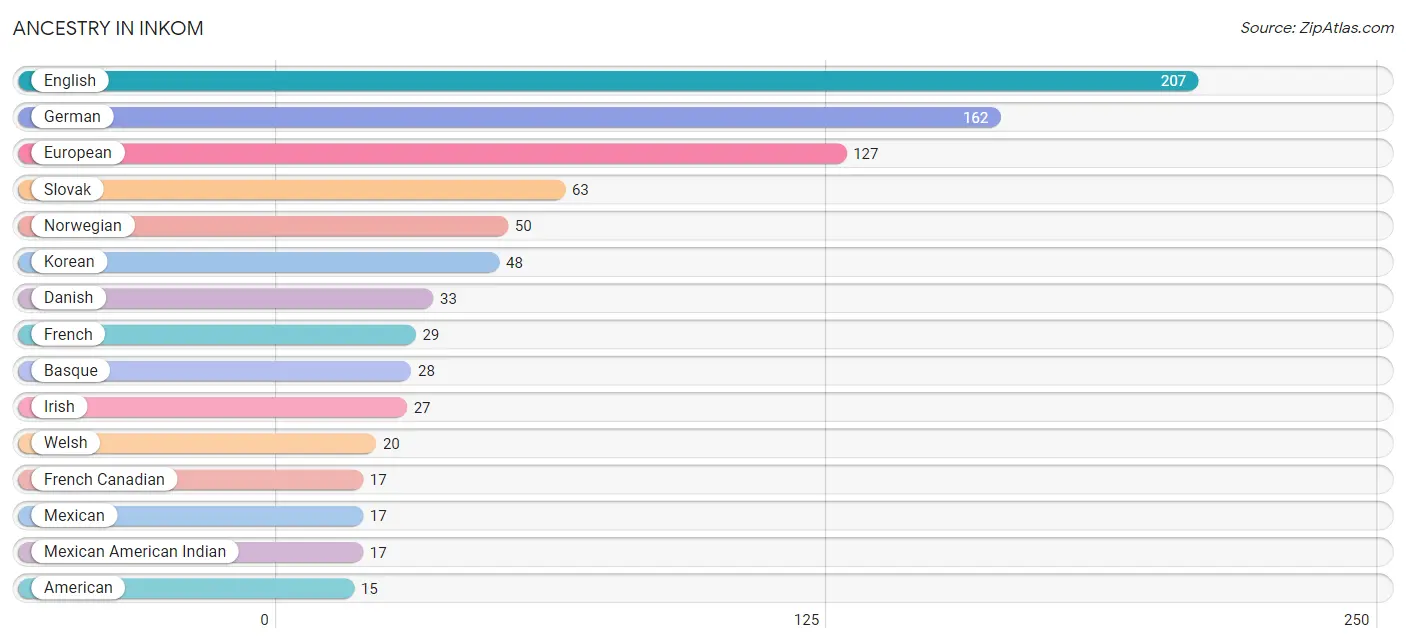
| Ancestry | # Population | % Population |
| American | 15 | 1.6% |
| Basque | 28 | 2.9% |
| British | 15 | 1.6% |
| Colombian | 7 | 0.7% |
| Croatian | 2 | 0.2% |
| Danish | 33 | 3.5% |
| English | 207 | 21.7% |
| European | 127 | 13.3% |
| French | 29 | 3.0% |
| French Canadian | 17 | 1.8% |
| German | 162 | 17.0% |
| Hungarian | 10 | 1.1% |
| Irish | 27 | 2.8% |
| Italian | 13 | 1.4% |
| Korean | 48 | 5.0% |
| Mexican | 17 | 1.8% |
| Mexican American Indian | 17 | 1.8% |
| Norwegian | 50 | 5.2% |
| Scotch-Irish | 8 | 0.8% |
| Scottish | 7 | 0.7% |
| Slovak | 63 | 6.6% |
| South American | 7 | 0.7% |
| Swedish | 7 | 0.7% |
| Welsh | 20 | 2.1% | View All 24 Rows |
Immigrants in Inkom

| Immigration Origin | # Population | % Population | View All 0 Rows |
Sex and Age in Inkom
Sex and Age in Inkom
The most populous age groups in Inkom are 35 to 39 Years (104 | 20.3%) for men and 30 to 34 Years (63 | 14.3%) for women.
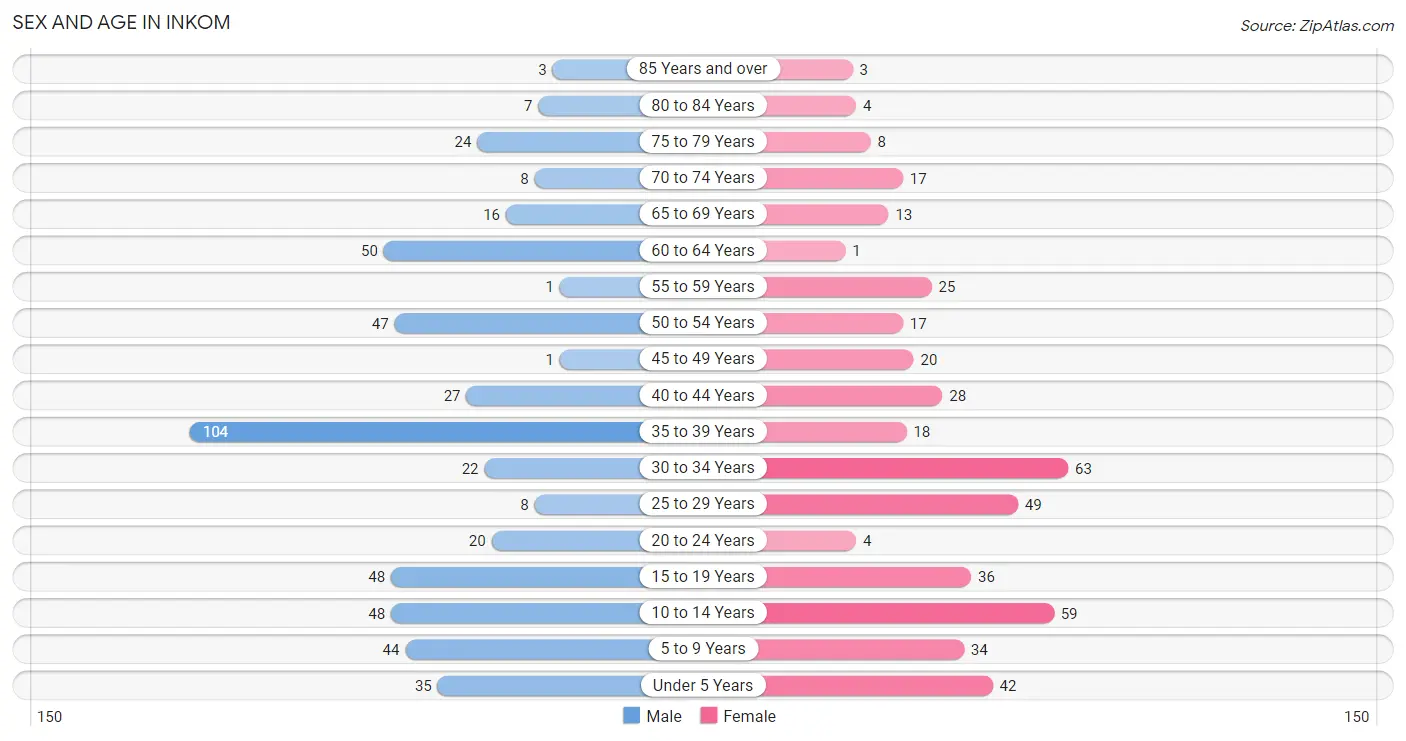
| Age Bracket | Male | Female |
| Under 5 Years | 35 (6.8%) | 42 (9.5%) |
| 5 to 9 Years | 44 (8.6%) | 34 (7.7%) |
| 10 to 14 Years | 48 (9.4%) | 59 (13.4%) |
| 15 to 19 Years | 48 (9.4%) | 36 (8.2%) |
| 20 to 24 Years | 20 (3.9%) | 4 (0.9%) |
| 25 to 29 Years | 8 (1.6%) | 49 (11.1%) |
| 30 to 34 Years | 22 (4.3%) | 63 (14.3%) |
| 35 to 39 Years | 104 (20.3%) | 18 (4.1%) |
| 40 to 44 Years | 27 (5.3%) | 28 (6.4%) |
| 45 to 49 Years | 1 (0.2%) | 20 (4.5%) |
| 50 to 54 Years | 47 (9.2%) | 17 (3.8%) |
| 55 to 59 Years | 1 (0.2%) | 25 (5.7%) |
| 60 to 64 Years | 50 (9.8%) | 1 (0.2%) |
| 65 to 69 Years | 16 (3.1%) | 13 (2.9%) |
| 70 to 74 Years | 8 (1.6%) | 17 (3.8%) |
| 75 to 79 Years | 24 (4.7%) | 8 (1.8%) |
| 80 to 84 Years | 7 (1.4%) | 4 (0.9%) |
| 85 Years and over | 3 (0.6%) | 3 (0.7%) |
| Total | 513 (100.0%) | 441 (100.0%) |
Families and Households in Inkom
Median Family Size in Inkom
The median family size in Inkom is 4.55 persons per family, with single male/father families (30 | 15.8%) accounting for the largest median family size of 7.87 persons per family. On the other hand, married-couple families (144 | 75.8%) represent the smallest median family size with 3.88 persons per family.
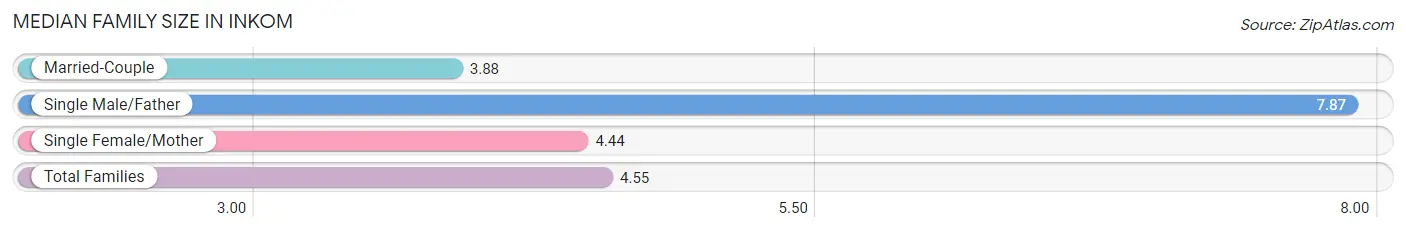
| Family Type | # Families | Family Size |
| Married-Couple | 144 (75.8%) | 3.88 |
| Single Male/Father | 30 (15.8%) | 7.87 |
| Single Female/Mother | 16 (8.4%) | 4.44 |
| Total Families | 190 (100.0%) | 4.55 |
Median Household Size in Inkom
The median household size in Inkom is 3.51 persons per household, with single male/father households (30 | 11.0%) accounting for the largest median household size of 7.9 persons per household. non-family households (82 | 30.1%) represent the smallest median household size with 1.04 persons per household.
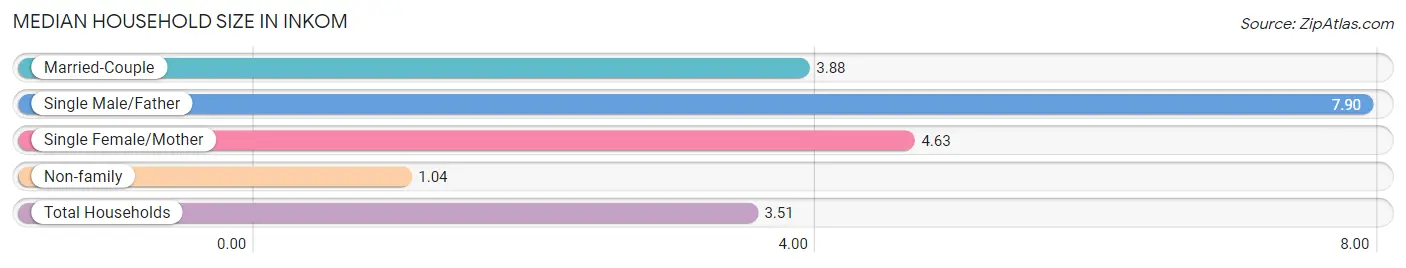
| Household Type | # Households | Household Size |
| Married-Couple | 144 (52.9%) | 3.88 |
| Single Male/Father | 30 (11.0%) | 7.90 |
| Single Female/Mother | 16 (5.9%) | 4.63 |
| Non-family | 82 (30.1%) | 1.04 |
| Total Households | 272 (100.0%) | 3.51 |
Household Size by Marriage Status in Inkom
Out of a total of 272 households in Inkom, 190 (69.9%) are family households, while 82 (30.1%) are nonfamily households. The most numerous type of family households are 3-person households, comprising 72, and the most common type of nonfamily households are 1-person households, comprising 78.
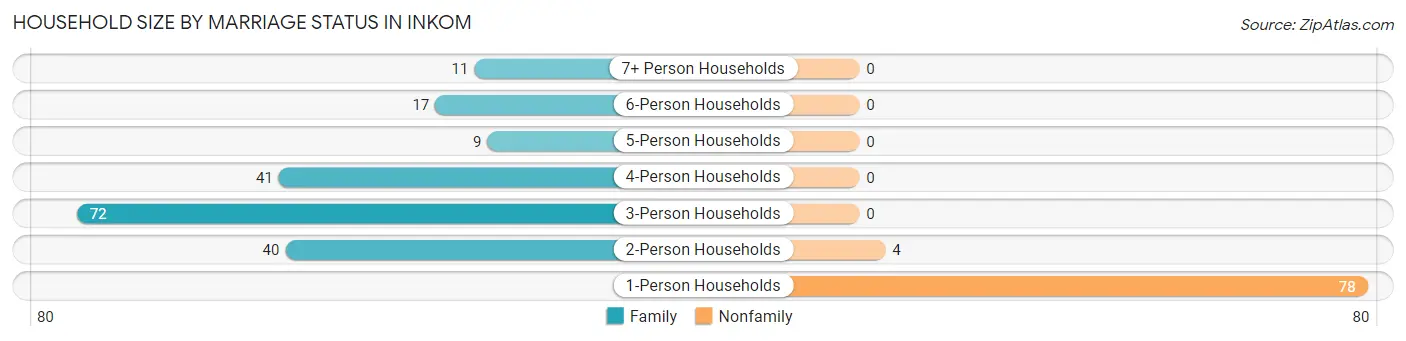
| Household Size | Family Households | Nonfamily Households |
| 1-Person Households | - | 78 (28.7%) |
| 2-Person Households | 40 (14.7%) | 4 (1.5%) |
| 3-Person Households | 72 (26.5%) | 0 (0.0%) |
| 4-Person Households | 41 (15.1%) | 0 (0.0%) |
| 5-Person Households | 9 (3.3%) | 0 (0.0%) |
| 6-Person Households | 17 (6.2%) | 0 (0.0%) |
| 7+ Person Households | 11 (4.0%) | 0 (0.0%) |
| Total | 190 (69.9%) | 82 (30.1%) |
Female Fertility in Inkom
Fertility by Age in Inkom
Average fertility rate in Inkom is 14.0 births per 1,000 women. Women in the age bracket of 35 to 50 years have the highest fertility rate with 30.0 births per 1,000 women. Women in the age bracket of 35 to 50 years acount for 66.7% of all women with births.
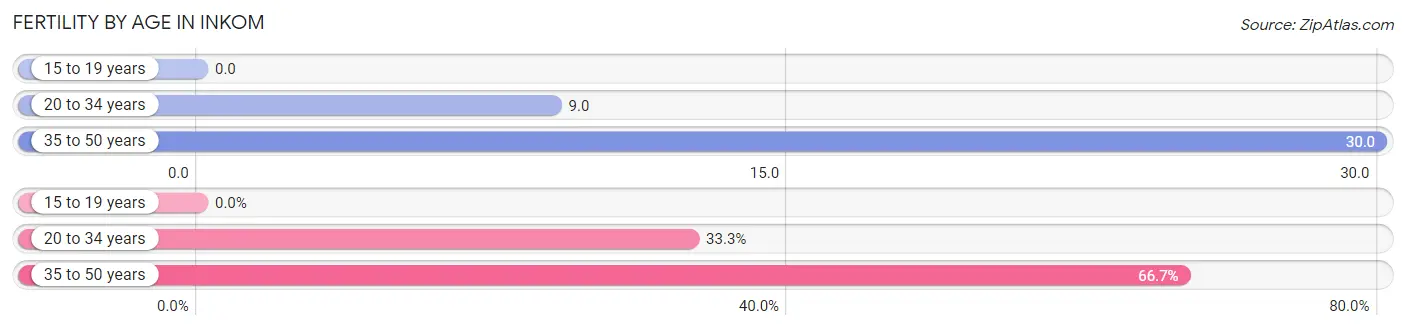
| Age Bracket | Women with Births | Births / 1,000 Women |
| 15 to 19 years | 0 (0.0%) | 0.0 |
| 20 to 34 years | 1 (33.3%) | 9.0 |
| 35 to 50 years | 2 (66.7%) | 30.0 |
| Total | 3 (100.0%) | 14.0 |
Fertility by Age by Marriage Status in Inkom
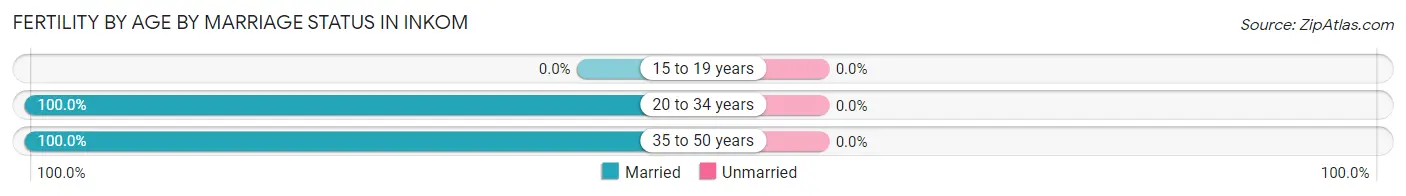
| Age Bracket | Married | Unmarried |
| 15 to 19 years | 0 (0.0%) | 0 (0.0%) |
| 20 to 34 years | 1 (100.0%) | 0 (0.0%) |
| 35 to 50 years | 2 (100.0%) | 0 (0.0%) |
| Total | 3 (100.0%) | 0 (0.0%) |
Fertility by Education in Inkom
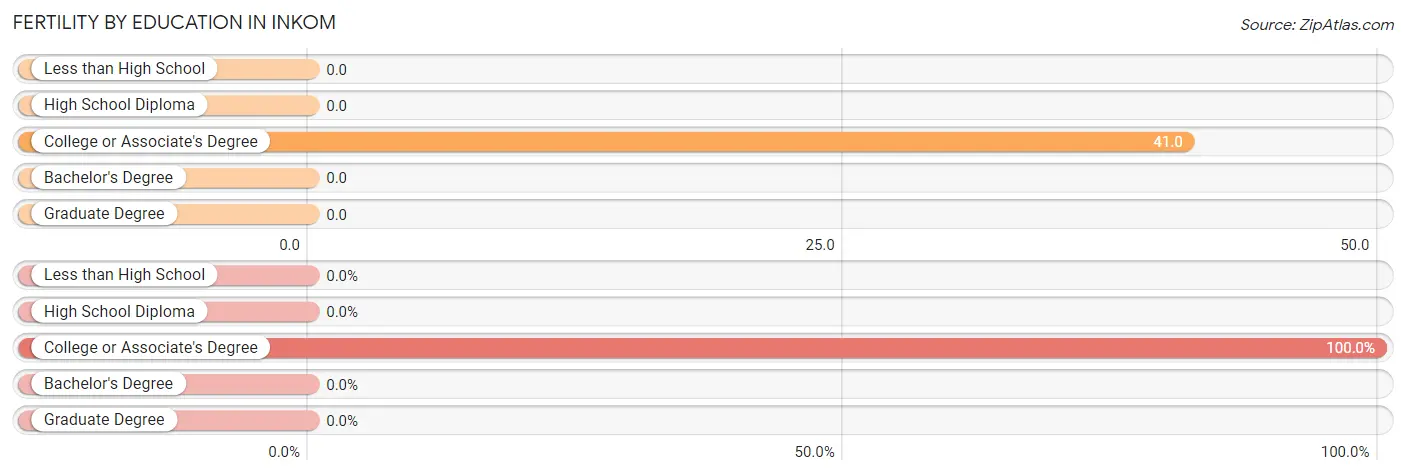
| Educational Attainment | Women with Births | Births / 1,000 Women |
| Less than High School | 0 (0.0%) | 0.0 |
| High School Diploma | 0 (0.0%) | 0.0 |
| College or Associate's Degree | 3 (100.0%) | 41.0 |
| Bachelor's Degree | 0 (0.0%) | 0.0 |
| Graduate Degree | 0 (0.0%) | 0.0 |
| Total | 3 (100.0%) | 14.0 |
Fertility by Education by Marriage Status in Inkom
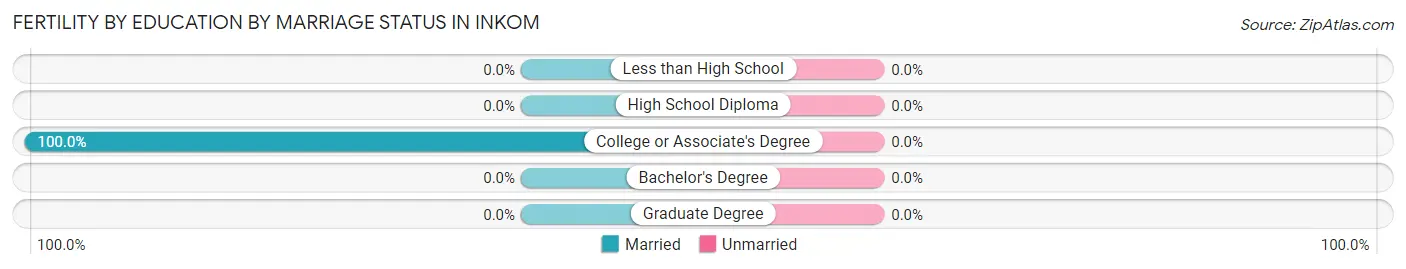
| Educational Attainment | Married | Unmarried |
| Less than High School | 0 (0.0%) | 0 (0.0%) |
| High School Diploma | 0 (0.0%) | 0 (0.0%) |
| College or Associate's Degree | 3 (100.0%) | 0 (0.0%) |
| Bachelor's Degree | 0 (0.0%) | 0 (0.0%) |
| Graduate Degree | 0 (0.0%) | 0 (0.0%) |
| Total | 3 (100.0%) | 0 (0.0%) |
Employment Characteristics in Inkom
Employment by Class of Employer in Inkom
Among the 376 employed individuals in Inkom, private company employees (216 | 57.5%), not-for-profit organizations (47 | 12.5%), and self-employed (not incorporated) (35 | 9.3%) make up the most common classes of employment.
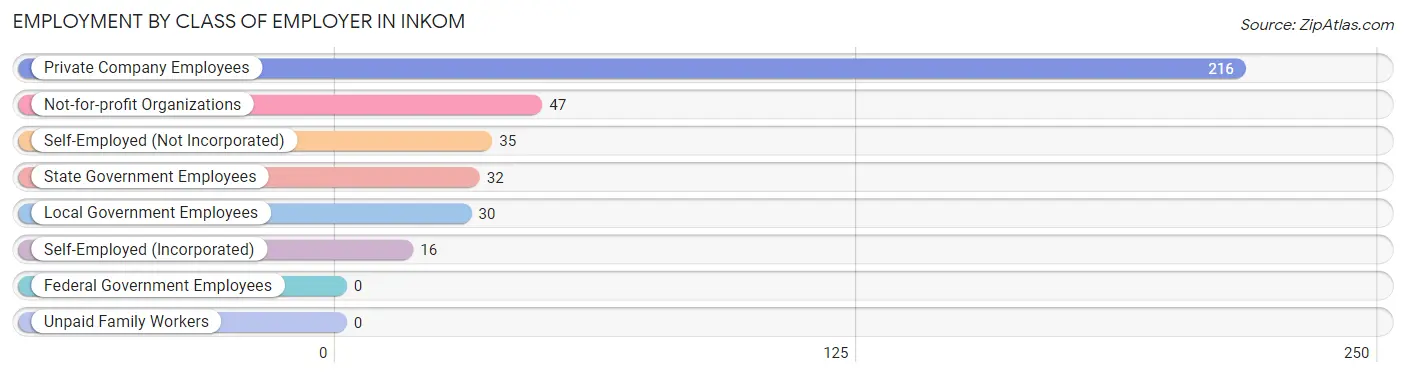
| Employer Class | # Employees | % Employees |
| Private Company Employees | 216 | 57.5% |
| Self-Employed (Incorporated) | 16 | 4.3% |
| Self-Employed (Not Incorporated) | 35 | 9.3% |
| Not-for-profit Organizations | 47 | 12.5% |
| Local Government Employees | 30 | 8.0% |
| State Government Employees | 32 | 8.5% |
| Federal Government Employees | 0 | 0.0% |
| Unpaid Family Workers | 0 | 0.0% |
| Total | 376 | 100.0% |
Employment Status by Age in Inkom
According to the labor force statistics for Inkom, out of the total population over 16 years of age (687), 59.4% or 408 individuals are in the labor force, with 3.7% or 15 of them unemployed. The age group with the highest labor force participation rate is 20 to 24 years, with 100.0% or 24 individuals in the labor force. Within the labor force, the 16 to 19 years age range has the highest percentage of unemployed individuals, with 60.0% or 15 of them being unemployed.
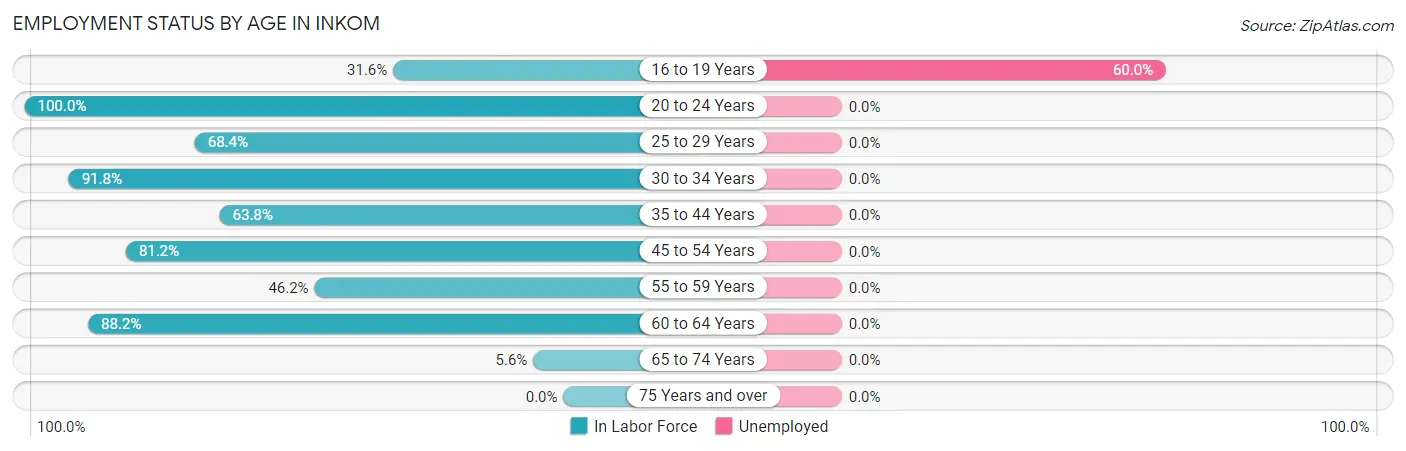
| Age Bracket | In Labor Force | Unemployed |
| 16 to 19 Years | 25 (31.6%) | 15 (60.0%) |
| 20 to 24 Years | 24 (100.0%) | 0 (0.0%) |
| 25 to 29 Years | 39 (68.4%) | 0 (0.0%) |
| 30 to 34 Years | 78 (91.8%) | 0 (0.0%) |
| 35 to 44 Years | 113 (63.8%) | 0 (0.0%) |
| 45 to 54 Years | 69 (81.2%) | 0 (0.0%) |
| 55 to 59 Years | 12 (46.2%) | 0 (0.0%) |
| 60 to 64 Years | 45 (88.2%) | 0 (0.0%) |
| 65 to 74 Years | 3 (5.6%) | 0 (0.0%) |
| 75 Years and over | 0 (0.0%) | 0 (0.0%) |
| Total | 408 (59.4%) | 15 (3.7%) |
Employment Status by Educational Attainment in Inkom
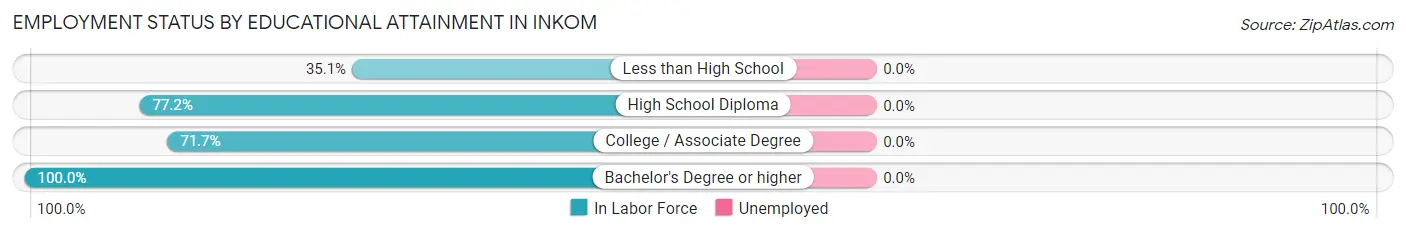
| Educational Attainment | In Labor Force | Unemployed |
| Less than High School | 20 (35.1%) | 0 (0.0%) |
| High School Diploma | 122 (77.2%) | 0 (0.0%) |
| College / Associate Degree | 132 (71.7%) | 0 (0.0%) |
| Bachelor's Degree or higher | 82 (100.0%) | 0 (0.0%) |
| Total | 356 (74.0%) | 0 (0.0%) |
Employment Occupations by Sex in Inkom
Management, Business, Science and Arts Occupations
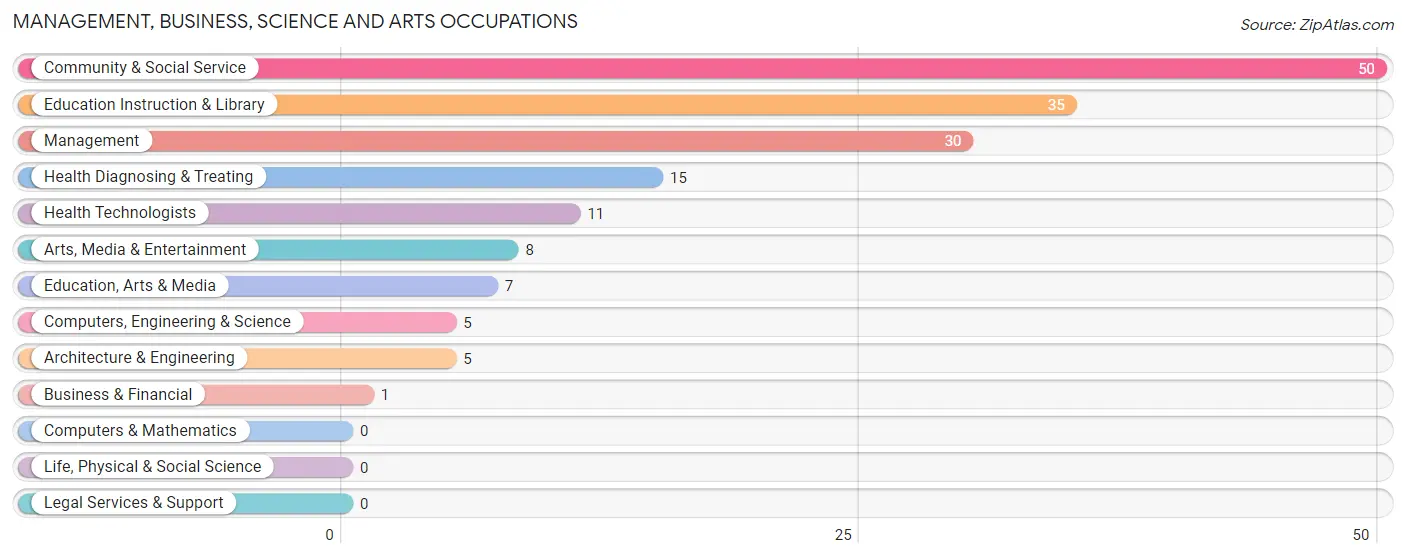
The most common Management, Business, Science and Arts occupations in Inkom are Community & Social Service (50 | 12.7%), Education Instruction & Library (35 | 8.9%), Management (30 | 7.6%), Health Diagnosing & Treating (15 | 3.8%), and Health Technologists (11 | 2.8%).
Management, Business, Science and Arts Occupations by Sex
Within the Management, Business, Science and Arts occupations in Inkom, the most male-oriented occupations are Computers, Engineering & Science (100.0%), Architecture & Engineering (100.0%), and Health Technologists (100.0%), while the most female-oriented occupations are Business & Financial (100.0%), Arts, Media & Entertainment (100.0%), and Management (46.7%).
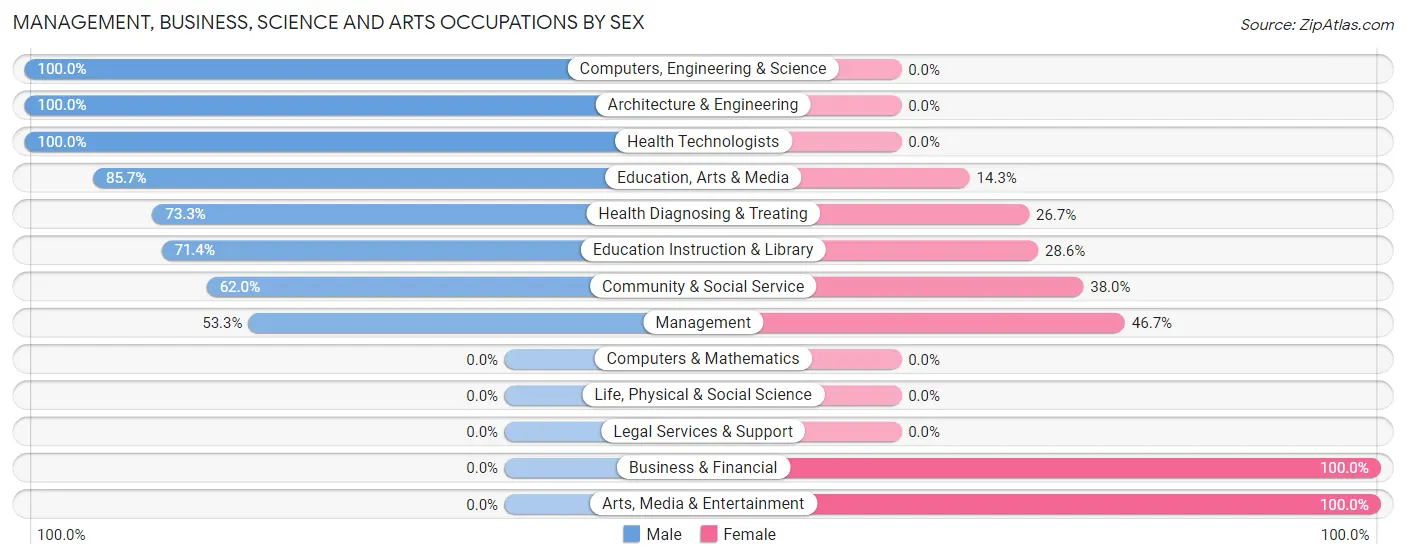
| Occupation | Male | Female |
| Management | 16 (53.3%) | 14 (46.7%) |
| Business & Financial | 0 (0.0%) | 1 (100.0%) |
| Computers, Engineering & Science | 5 (100.0%) | 0 (0.0%) |
| Computers & Mathematics | 0 (0.0%) | 0 (0.0%) |
| Architecture & Engineering | 5 (100.0%) | 0 (0.0%) |
| Life, Physical & Social Science | 0 (0.0%) | 0 (0.0%) |
| Community & Social Service | 31 (62.0%) | 19 (38.0%) |
| Education, Arts & Media | 6 (85.7%) | 1 (14.3%) |
| Legal Services & Support | 0 (0.0%) | 0 (0.0%) |
| Education Instruction & Library | 25 (71.4%) | 10 (28.6%) |
| Arts, Media & Entertainment | 0 (0.0%) | 8 (100.0%) |
| Health Diagnosing & Treating | 11 (73.3%) | 4 (26.7%) |
| Health Technologists | 11 (100.0%) | 0 (0.0%) |
| Total (Category) | 63 (62.4%) | 38 (37.6%) |
| Total (Overall) | 232 (59.0%) | 161 (41.0%) |
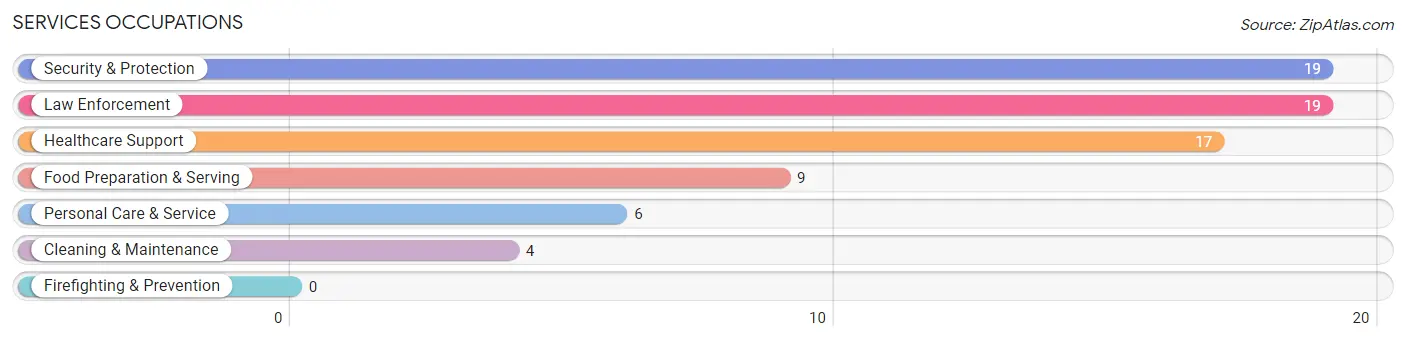
Services Occupations
The most common Services occupations in Inkom are Security & Protection (19 | 4.8%), Law Enforcement (19 | 4.8%), Healthcare Support (17 | 4.3%), Food Preparation & Serving (9 | 2.3%), and Personal Care & Service (6 | 1.5%).
Services Occupations by Sex
Within the Services occupations in Inkom, the most male-oriented occupations are Personal Care & Service (50.0%), Security & Protection (36.8%), and Law Enforcement (36.8%), while the most female-oriented occupations are Food Preparation & Serving (100.0%), Cleaning & Maintenance (100.0%), and Healthcare Support (64.7%).
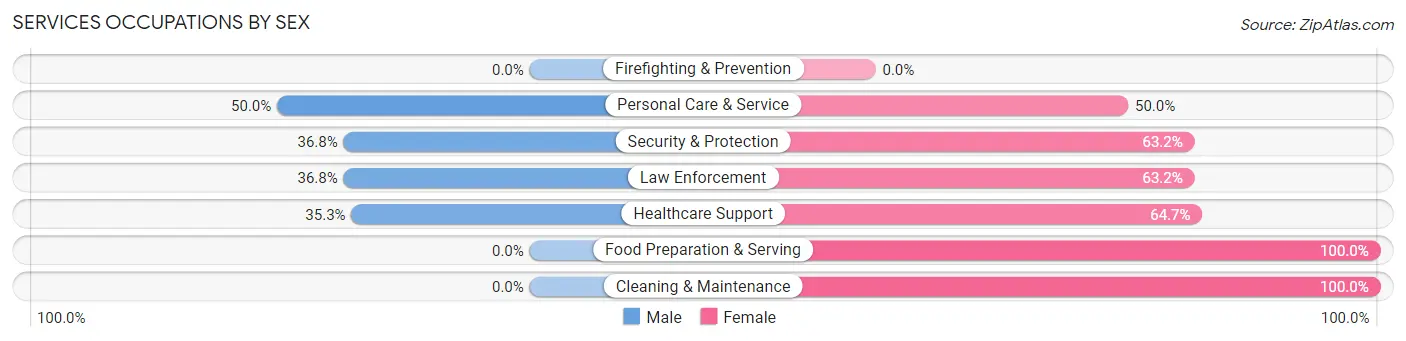
| Occupation | Male | Female |
| Healthcare Support | 6 (35.3%) | 11 (64.7%) |
| Security & Protection | 7 (36.8%) | 12 (63.2%) |
| Firefighting & Prevention | 0 (0.0%) | 0 (0.0%) |
| Law Enforcement | 7 (36.8%) | 12 (63.2%) |
| Food Preparation & Serving | 0 (0.0%) | 9 (100.0%) |
| Cleaning & Maintenance | 0 (0.0%) | 4 (100.0%) |
| Personal Care & Service | 3 (50.0%) | 3 (50.0%) |
| Total (Category) | 16 (29.1%) | 39 (70.9%) |
| Total (Overall) | 232 (59.0%) | 161 (41.0%) |
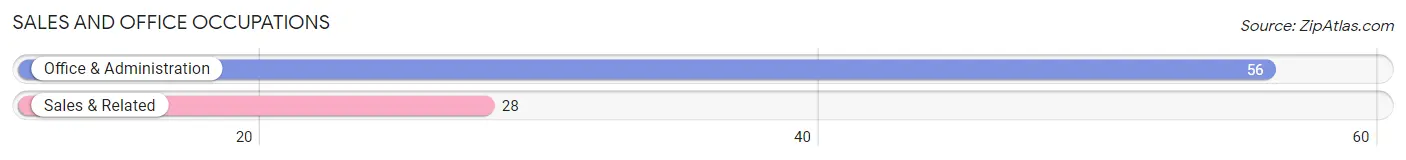
Sales and Office Occupations
The most common Sales and Office occupations in Inkom are Office & Administration (56 | 14.2%), and Sales & Related (28 | 7.1%).
Sales and Office Occupations by Sex
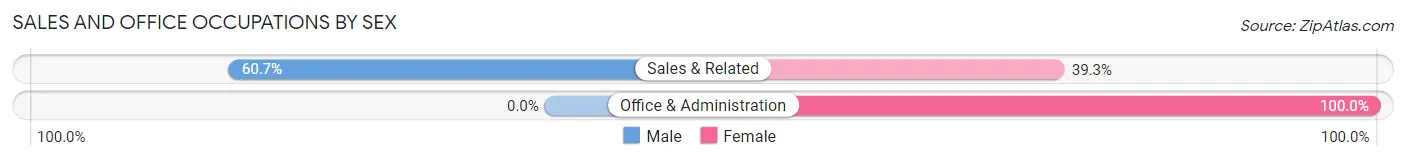
| Occupation | Male | Female |
| Sales & Related | 17 (60.7%) | 11 (39.3%) |
| Office & Administration | 0 (0.0%) | 56 (100.0%) |
| Total (Category) | 17 (20.2%) | 67 (79.8%) |
| Total (Overall) | 232 (59.0%) | 161 (41.0%) |
Natural Resources, Construction and Maintenance Occupations
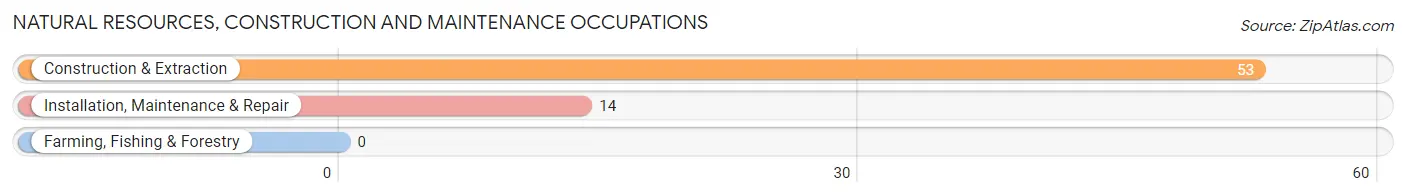
The most common Natural Resources, Construction and Maintenance occupations in Inkom are Construction & Extraction (53 | 13.5%), and Installation, Maintenance & Repair (14 | 3.6%).
Natural Resources, Construction and Maintenance Occupations by Sex
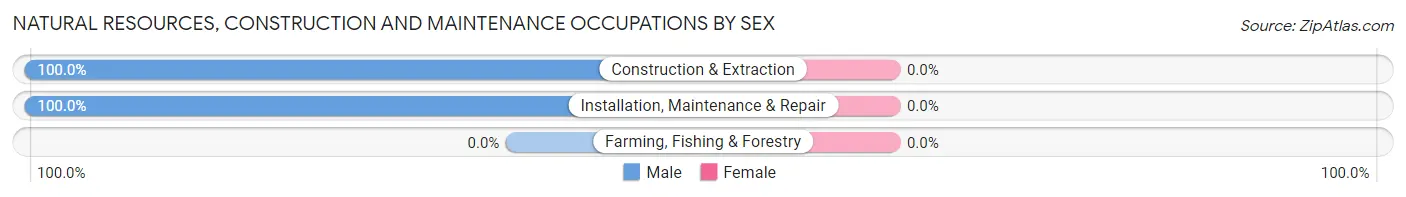
| Occupation | Male | Female |
| Farming, Fishing & Forestry | 0 (0.0%) | 0 (0.0%) |
| Construction & Extraction | 53 (100.0%) | 0 (0.0%) |
| Installation, Maintenance & Repair | 14 (100.0%) | 0 (0.0%) |
| Total (Category) | 67 (100.0%) | 0 (0.0%) |
| Total (Overall) | 232 (59.0%) | 161 (41.0%) |
Production, Transportation and Moving Occupations
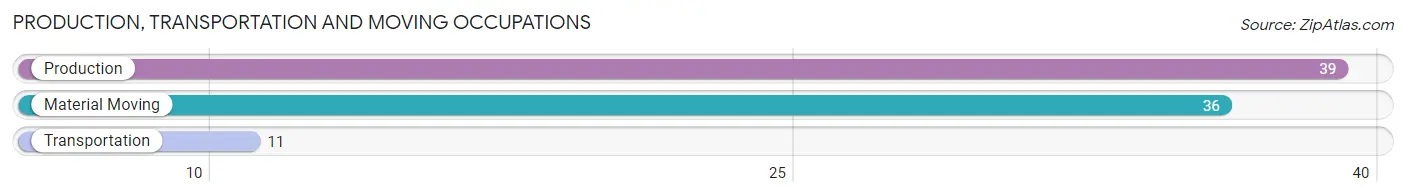
The most common Production, Transportation and Moving occupations in Inkom are Production (39 | 9.9%), Material Moving (36 | 9.2%), and Transportation (11 | 2.8%).
Production, Transportation and Moving Occupations by Sex
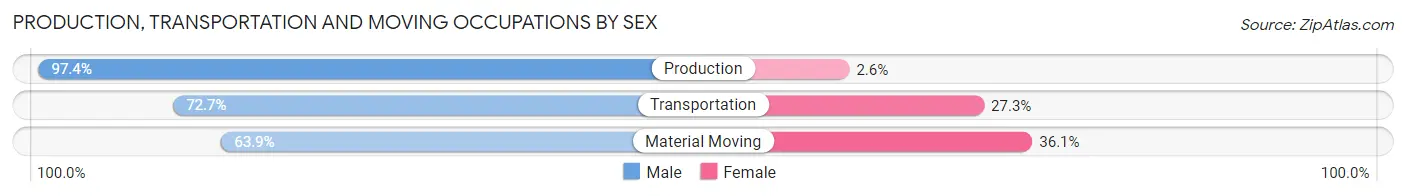
| Occupation | Male | Female |
| Production | 38 (97.4%) | 1 (2.6%) |
| Transportation | 8 (72.7%) | 3 (27.3%) |
| Material Moving | 23 (63.9%) | 13 (36.1%) |
| Total (Category) | 69 (80.2%) | 17 (19.8%) |
| Total (Overall) | 232 (59.0%) | 161 (41.0%) |
Employment Industries by Sex in Inkom
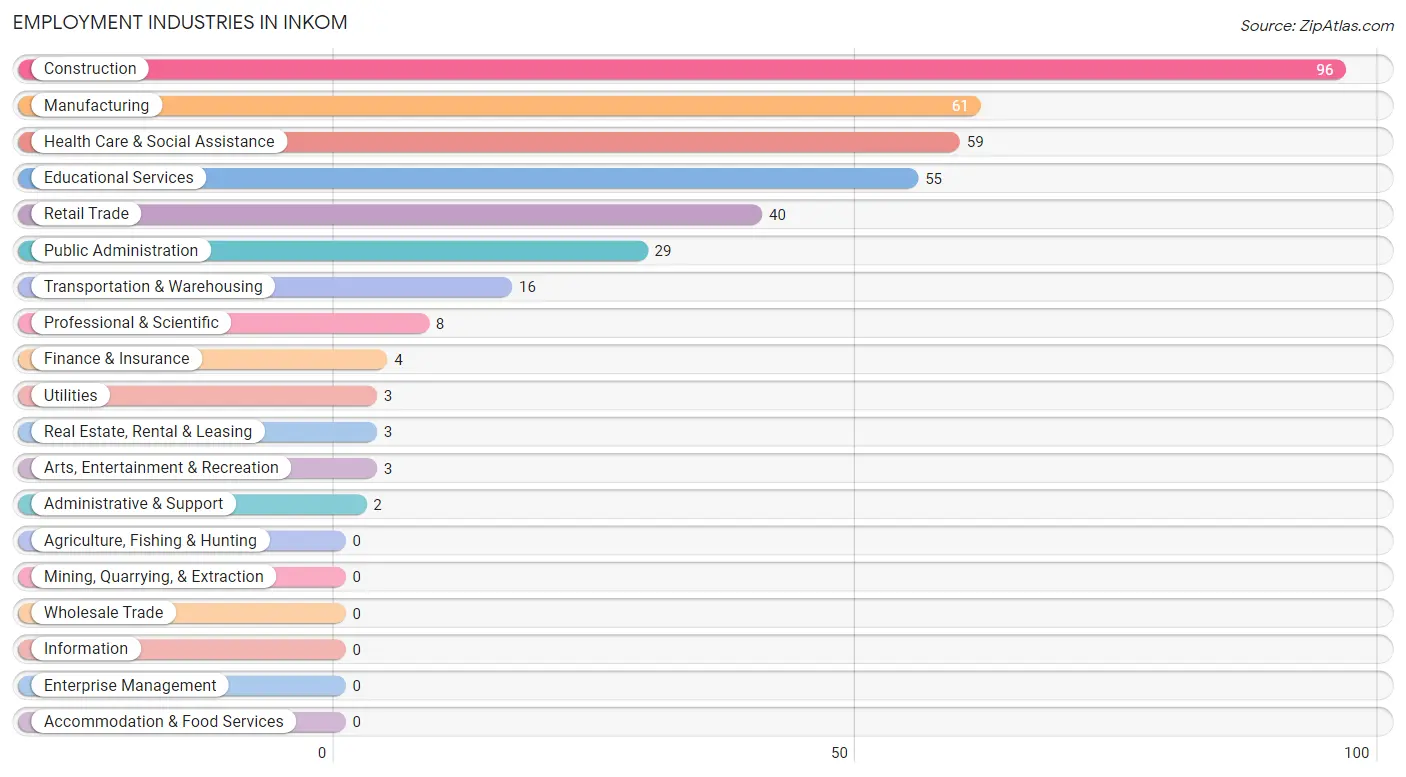
Employment Industries in Inkom
The major employment industries in Inkom include Construction (96 | 24.4%), Manufacturing (61 | 15.5%), Health Care & Social Assistance (59 | 15.0%), Educational Services (55 | 14.0%), and Retail Trade (40 | 10.2%).
Employment Industries by Sex in Inkom
The Inkom industries that see more men than women are Utilities (100.0%), Real Estate, Rental & Leasing (100.0%), and Manufacturing (96.7%), whereas the industries that tend to have a higher number of women are Finance & Insurance (100.0%), Administrative & Support (100.0%), and Arts, Entertainment & Recreation (100.0%).
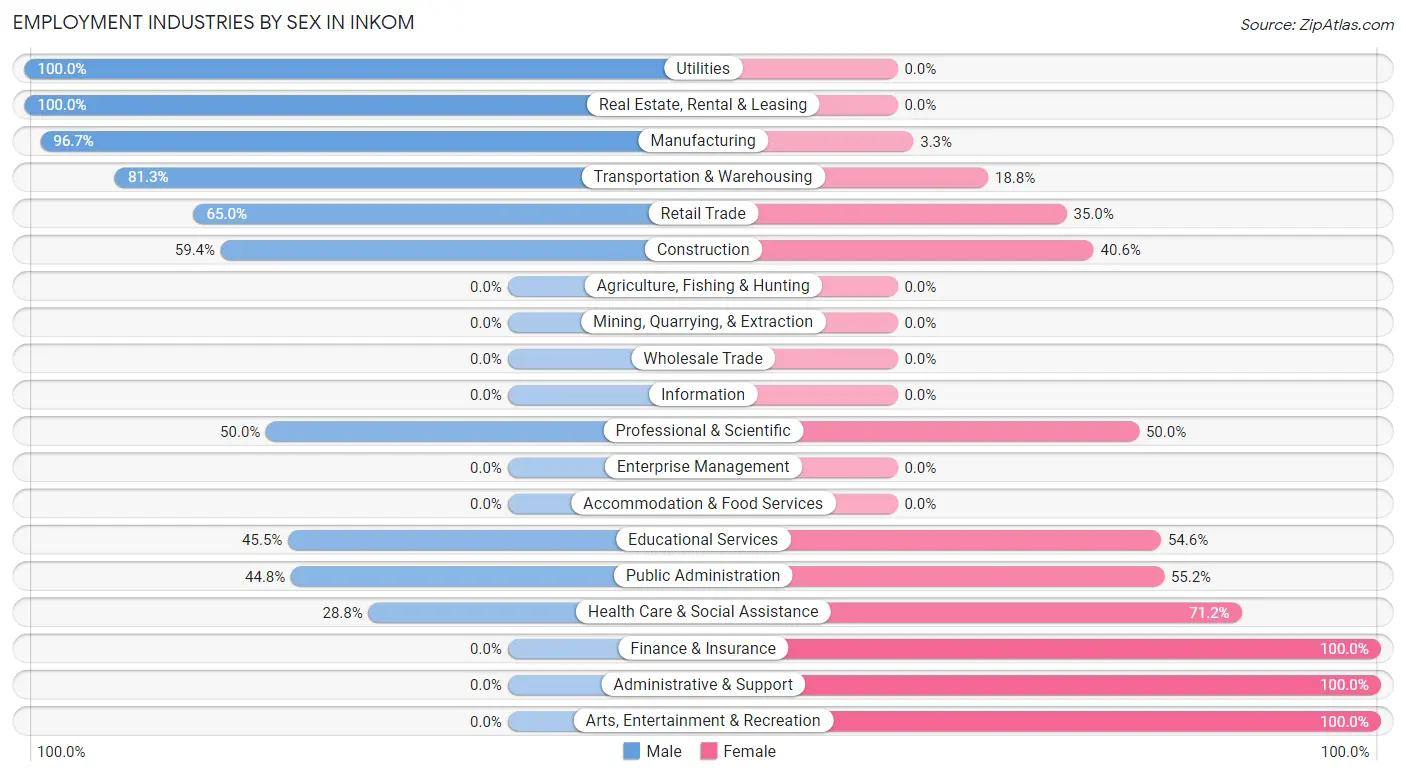
| Industry | Male | Female |
| Agriculture, Fishing & Hunting | 0 (0.0%) | 0 (0.0%) |
| Mining, Quarrying, & Extraction | 0 (0.0%) | 0 (0.0%) |
| Construction | 57 (59.4%) | 39 (40.6%) |
| Manufacturing | 59 (96.7%) | 2 (3.3%) |
| Wholesale Trade | 0 (0.0%) | 0 (0.0%) |
| Retail Trade | 26 (65.0%) | 14 (35.0%) |
| Transportation & Warehousing | 13 (81.2%) | 3 (18.8%) |
| Utilities | 3 (100.0%) | 0 (0.0%) |
| Information | 0 (0.0%) | 0 (0.0%) |
| Finance & Insurance | 0 (0.0%) | 4 (100.0%) |
| Real Estate, Rental & Leasing | 3 (100.0%) | 0 (0.0%) |
| Professional & Scientific | 4 (50.0%) | 4 (50.0%) |
| Enterprise Management | 0 (0.0%) | 0 (0.0%) |
| Administrative & Support | 0 (0.0%) | 2 (100.0%) |
| Educational Services | 25 (45.5%) | 30 (54.5%) |
| Health Care & Social Assistance | 17 (28.8%) | 42 (71.2%) |
| Arts, Entertainment & Recreation | 0 (0.0%) | 3 (100.0%) |
| Accommodation & Food Services | 0 (0.0%) | 0 (0.0%) |
| Public Administration | 13 (44.8%) | 16 (55.2%) |
| Total | 232 (59.0%) | 161 (41.0%) |
Education in Inkom
School Enrollment in Inkom
The most common levels of schooling among the 315 students in Inkom are middle school (97 | 30.8%), high school (91 | 28.9%), and elementary school (58 | 18.4%).
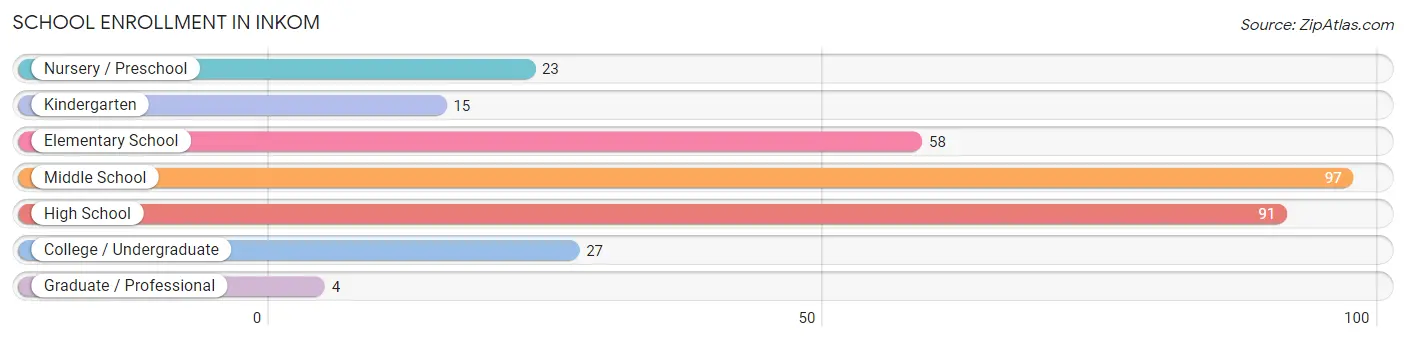
| School Level | # Students | % Students |
| Nursery / Preschool | 23 | 7.3% |
| Kindergarten | 15 | 4.8% |
| Elementary School | 58 | 18.4% |
| Middle School | 97 | 30.8% |
| High School | 91 | 28.9% |
| College / Undergraduate | 27 | 8.6% |
| Graduate / Professional | 4 | 1.3% |
| Total | 315 | 100.0% |
School Enrollment by Age by Funding Source in Inkom
Out of a total of 315 students who are enrolled in schools in Inkom, 41 (13.0%) attend a private institution, while the remaining 274 (87.0%) are enrolled in public schools. The age group of 3 to 4 year olds has the highest likelihood of being enrolled in private schools, with 17 (100.0% in the age bracket) enrolled. Conversely, the age group of 10 to 14 year olds has the lowest likelihood of being enrolled in a private school, with 107 (100.0% in the age bracket) attending a public institution.
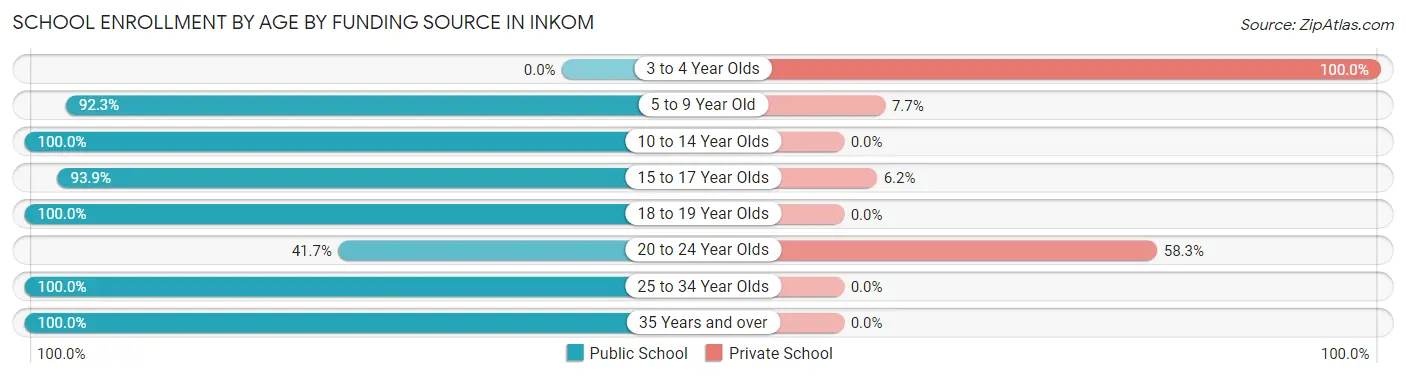
| Age Bracket | Public School | Private School |
| 3 to 4 Year Olds | 0 (0.0%) | 17 (100.0%) |
| 5 to 9 Year Old | 72 (92.3%) | 6 (7.7%) |
| 10 to 14 Year Olds | 107 (100.0%) | 0 (0.0%) |
| 15 to 17 Year Olds | 61 (93.9%) | 4 (6.1%) |
| 18 to 19 Year Olds | 17 (100.0%) | 0 (0.0%) |
| 20 to 24 Year Olds | 10 (41.7%) | 14 (58.3%) |
| 25 to 34 Year Olds | 3 (100.0%) | 0 (0.0%) |
| 35 Years and over | 4 (100.0%) | 0 (0.0%) |
| Total | 274 (87.0%) | 41 (13.0%) |
Educational Attainment by Field of Study in Inkom
Bio, nature & agricultural (22 | 15.7%), science & technology (19 | 13.6%), social sciences (15 | 10.7%), arts & humanities (15 | 10.7%), and education (14 | 10.0%) are the most common fields of study among 140 individuals in Inkom who have obtained a bachelor's degree or higher.
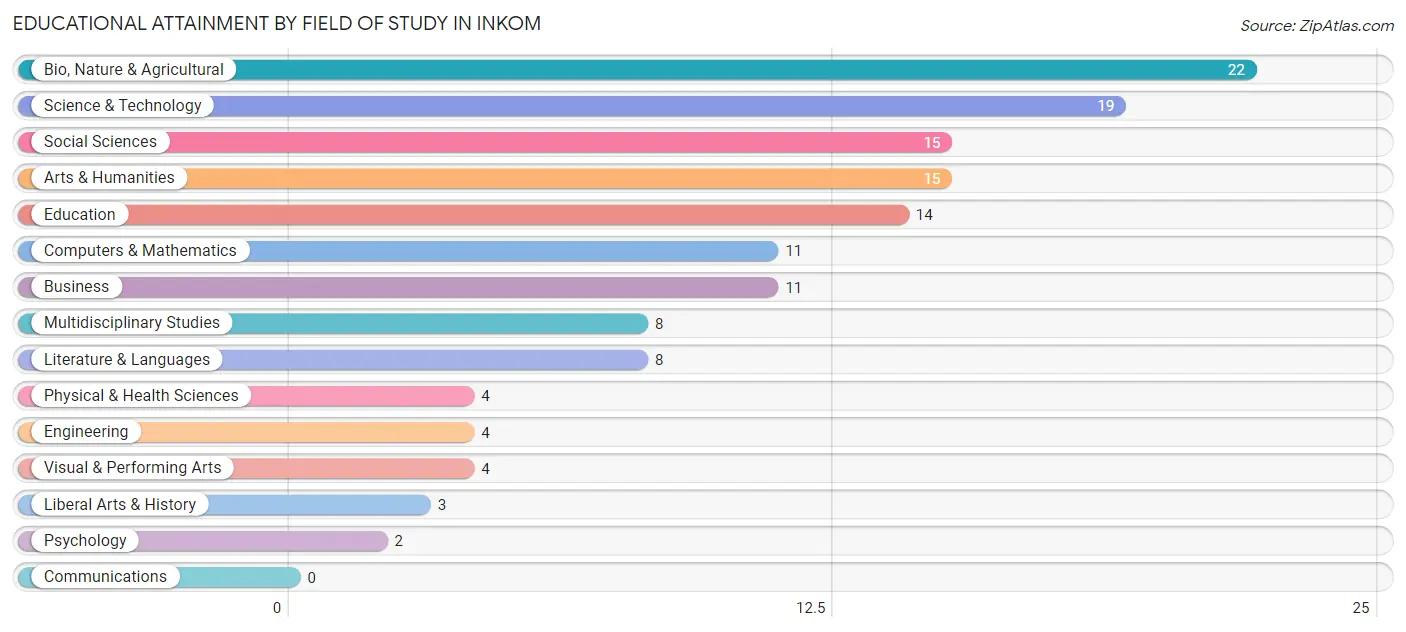
| Field of Study | # Graduates | % Graduates |
| Computers & Mathematics | 11 | 7.9% |
| Bio, Nature & Agricultural | 22 | 15.7% |
| Physical & Health Sciences | 4 | 2.9% |
| Psychology | 2 | 1.4% |
| Social Sciences | 15 | 10.7% |
| Engineering | 4 | 2.9% |
| Multidisciplinary Studies | 8 | 5.7% |
| Science & Technology | 19 | 13.6% |
| Business | 11 | 7.9% |
| Education | 14 | 10.0% |
| Literature & Languages | 8 | 5.7% |
| Liberal Arts & History | 3 | 2.1% |
| Visual & Performing Arts | 4 | 2.9% |
| Communications | 0 | 0.0% |
| Arts & Humanities | 15 | 10.7% |
| Total | 140 | 100.0% |
Transportation & Commute in Inkom
Vehicle Availability by Sex in Inkom
The most prevalent vehicle ownership categories in Inkom are males with 3 vehicles (66, accounting for 29.6%) and females with 3 vehicles (59, making up 43.1%).
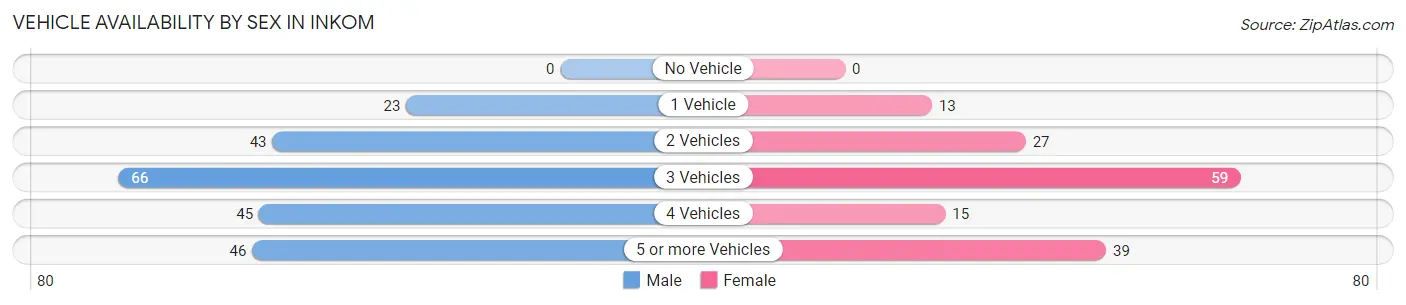
| Vehicles Available | Male | Female |
| No Vehicle | 0 (0.0%) | 0 (0.0%) |
| 1 Vehicle | 23 (10.3%) | 13 (8.5%) |
| 2 Vehicles | 43 (19.3%) | 27 (17.6%) |
| 3 Vehicles | 66 (29.6%) | 59 (38.6%) |
| 4 Vehicles | 45 (20.2%) | 15 (9.8%) |
| 5 or more Vehicles | 46 (20.6%) | 39 (25.5%) |
| Total | 223 (100.0%) | 153 (100.0%) |
Commute Time in Inkom
The most frequently occuring commute durations in Inkom are 20 to 24 minutes (109 commuters, 32.9%), 15 to 19 minutes (85 commuters, 25.7%), and 25 to 29 minutes (44 commuters, 13.3%).
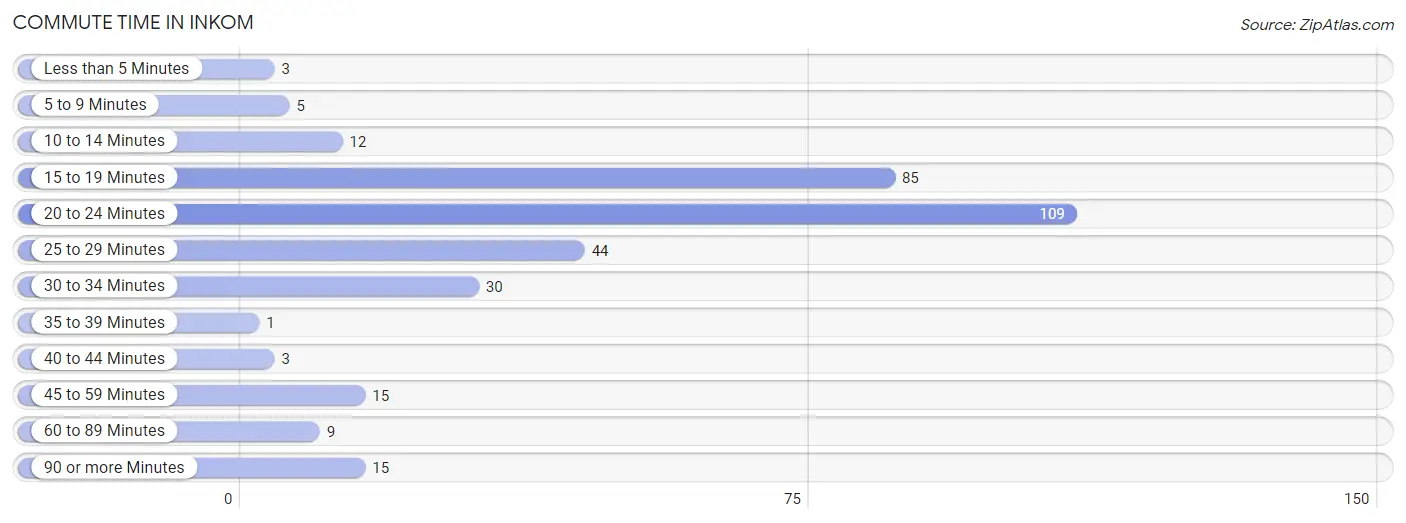
| Commute Time | # Commuters | % Commuters |
| Less than 5 Minutes | 3 | 0.9% |
| 5 to 9 Minutes | 5 | 1.5% |
| 10 to 14 Minutes | 12 | 3.6% |
| 15 to 19 Minutes | 85 | 25.7% |
| 20 to 24 Minutes | 109 | 32.9% |
| 25 to 29 Minutes | 44 | 13.3% |
| 30 to 34 Minutes | 30 | 9.1% |
| 35 to 39 Minutes | 1 | 0.3% |
| 40 to 44 Minutes | 3 | 0.9% |
| 45 to 59 Minutes | 15 | 4.5% |
| 60 to 89 Minutes | 9 | 2.7% |
| 90 or more Minutes | 15 | 4.5% |
Commute Time by Sex in Inkom
The most common commute times in Inkom are 15 to 19 minutes (66 commuters, 30.4%) for males and 20 to 24 minutes (66 commuters, 57.9%) for females.
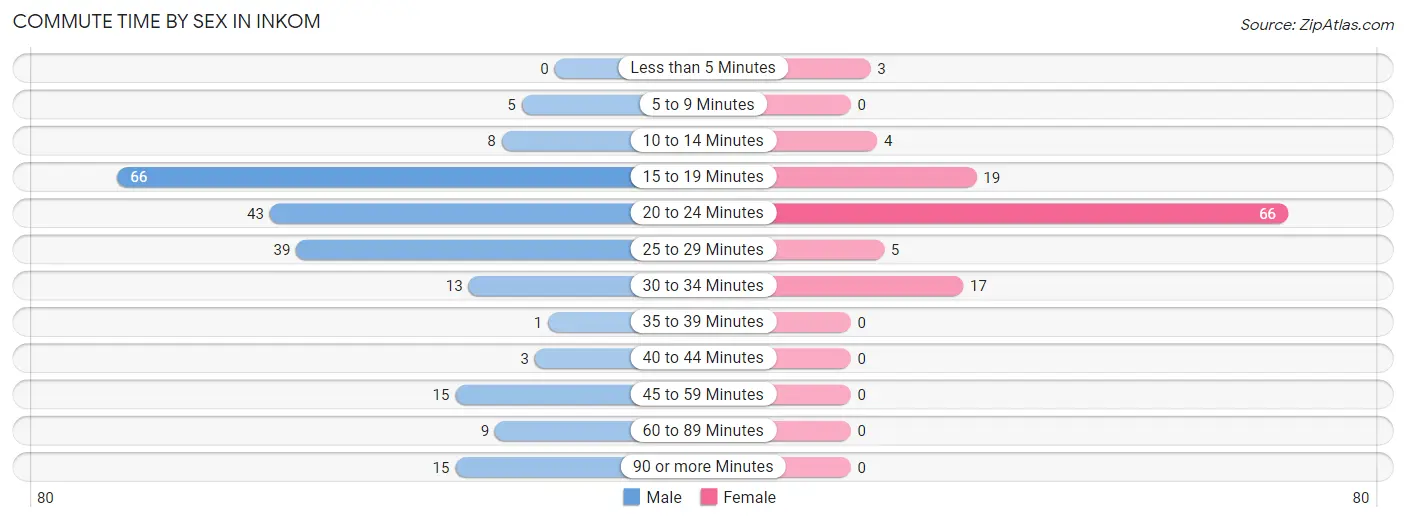
| Commute Time | Male | Female |
| Less than 5 Minutes | 0 (0.0%) | 3 (2.6%) |
| 5 to 9 Minutes | 5 (2.3%) | 0 (0.0%) |
| 10 to 14 Minutes | 8 (3.7%) | 4 (3.5%) |
| 15 to 19 Minutes | 66 (30.4%) | 19 (16.7%) |
| 20 to 24 Minutes | 43 (19.8%) | 66 (57.9%) |
| 25 to 29 Minutes | 39 (18.0%) | 5 (4.4%) |
| 30 to 34 Minutes | 13 (6.0%) | 17 (14.9%) |
| 35 to 39 Minutes | 1 (0.5%) | 0 (0.0%) |
| 40 to 44 Minutes | 3 (1.4%) | 0 (0.0%) |
| 45 to 59 Minutes | 15 (6.9%) | 0 (0.0%) |
| 60 to 89 Minutes | 9 (4.2%) | 0 (0.0%) |
| 90 or more Minutes | 15 (6.9%) | 0 (0.0%) |
Time of Departure to Work by Sex in Inkom
The most frequent times of departure to work in Inkom are 6:00 AM to 6:29 AM (63, 29.0%) for males and 8:30 AM to 8:59 AM (36, 31.6%) for females.
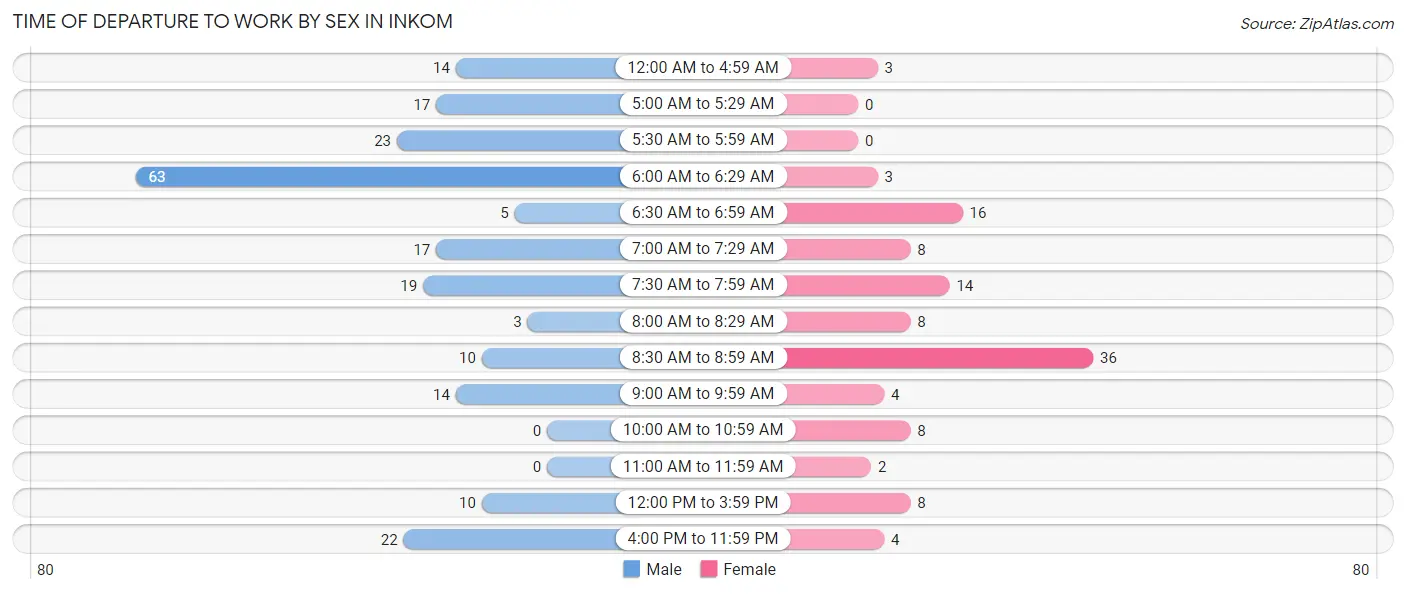
| Time of Departure | Male | Female |
| 12:00 AM to 4:59 AM | 14 (6.5%) | 3 (2.6%) |
| 5:00 AM to 5:29 AM | 17 (7.8%) | 0 (0.0%) |
| 5:30 AM to 5:59 AM | 23 (10.6%) | 0 (0.0%) |
| 6:00 AM to 6:29 AM | 63 (29.0%) | 3 (2.6%) |
| 6:30 AM to 6:59 AM | 5 (2.3%) | 16 (14.0%) |
| 7:00 AM to 7:29 AM | 17 (7.8%) | 8 (7.0%) |
| 7:30 AM to 7:59 AM | 19 (8.8%) | 14 (12.3%) |
| 8:00 AM to 8:29 AM | 3 (1.4%) | 8 (7.0%) |
| 8:30 AM to 8:59 AM | 10 (4.6%) | 36 (31.6%) |
| 9:00 AM to 9:59 AM | 14 (6.5%) | 4 (3.5%) |
| 10:00 AM to 10:59 AM | 0 (0.0%) | 8 (7.0%) |
| 11:00 AM to 11:59 AM | 0 (0.0%) | 2 (1.8%) |
| 12:00 PM to 3:59 PM | 10 (4.6%) | 8 (7.0%) |
| 4:00 PM to 11:59 PM | 22 (10.1%) | 4 (3.5%) |
| Total | 217 (100.0%) | 114 (100.0%) |
Housing Occupancy in Inkom
Occupancy by Ownership in Inkom
Of the total 272 dwellings in Inkom, owner-occupied units account for 232 (85.3%), while renter-occupied units make up 40 (14.7%).
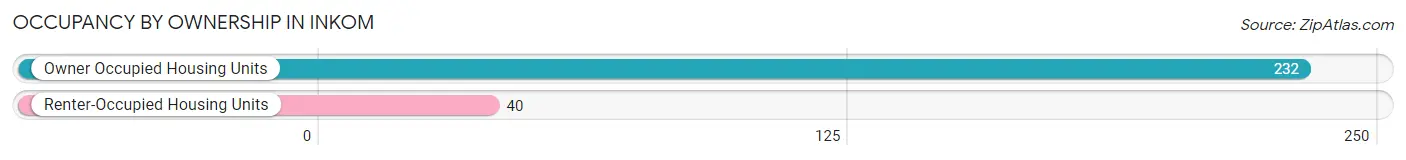
| Occupancy | # Housing Units | % Housing Units |
| Owner Occupied Housing Units | 232 | 85.3% |
| Renter-Occupied Housing Units | 40 | 14.7% |
| Total Occupied Housing Units | 272 | 100.0% |
Occupancy by Household Size in Inkom
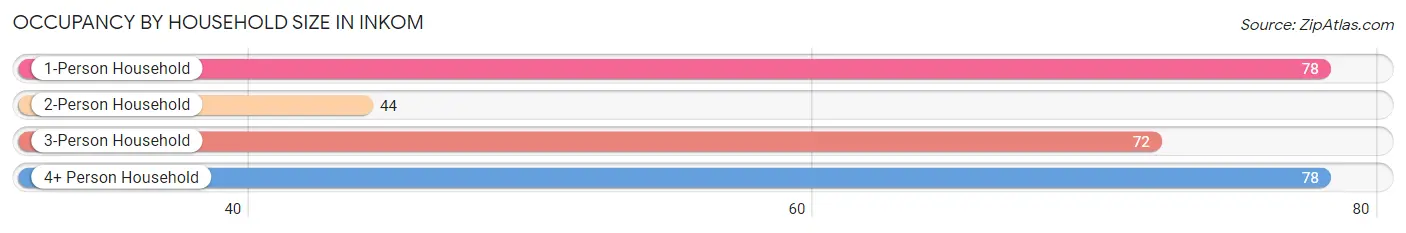
| Household Size | # Housing Units | % Housing Units |
| 1-Person Household | 78 | 28.7% |
| 2-Person Household | 44 | 16.2% |
| 3-Person Household | 72 | 26.5% |
| 4+ Person Household | 78 | 28.7% |
| Total Housing Units | 272 | 100.0% |
Occupancy by Ownership by Household Size in Inkom
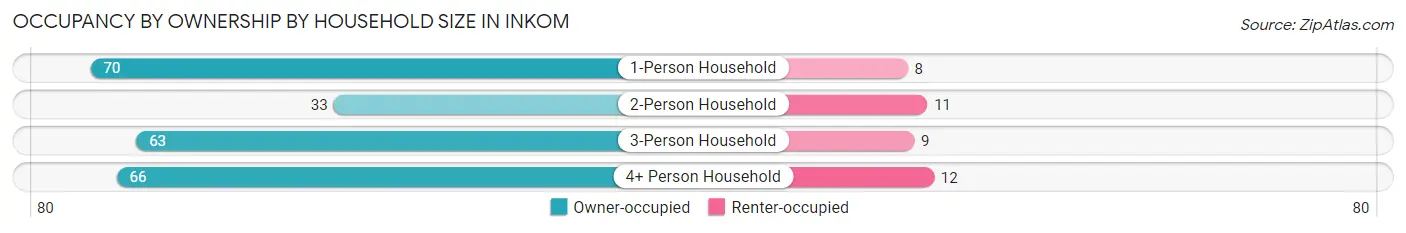
| Household Size | Owner-occupied | Renter-occupied |
| 1-Person Household | 70 (89.7%) | 8 (10.3%) |
| 2-Person Household | 33 (75.0%) | 11 (25.0%) |
| 3-Person Household | 63 (87.5%) | 9 (12.5%) |
| 4+ Person Household | 66 (84.6%) | 12 (15.4%) |
| Total Housing Units | 232 (85.3%) | 40 (14.7%) |
Occupancy by Educational Attainment in Inkom
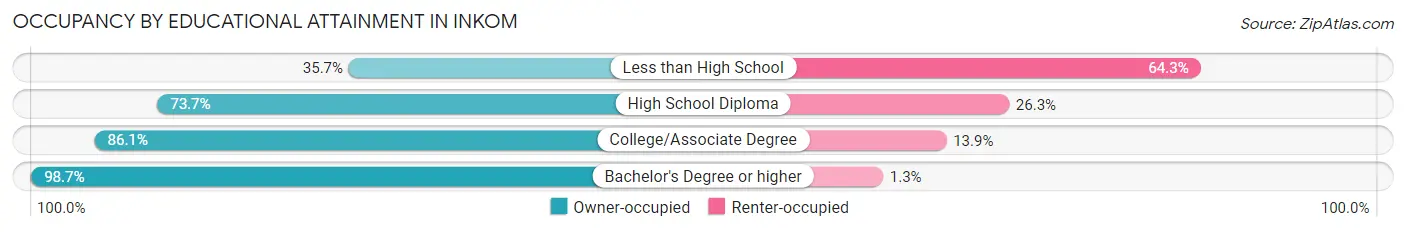
| Household Size | Owner-occupied | Renter-occupied |
| Less than High School | 5 (35.7%) | 9 (64.3%) |
| High School Diploma | 28 (73.7%) | 10 (26.3%) |
| College/Associate Degree | 124 (86.1%) | 20 (13.9%) |
| Bachelor's Degree or higher | 75 (98.7%) | 1 (1.3%) |
Occupancy by Age of Householder in Inkom
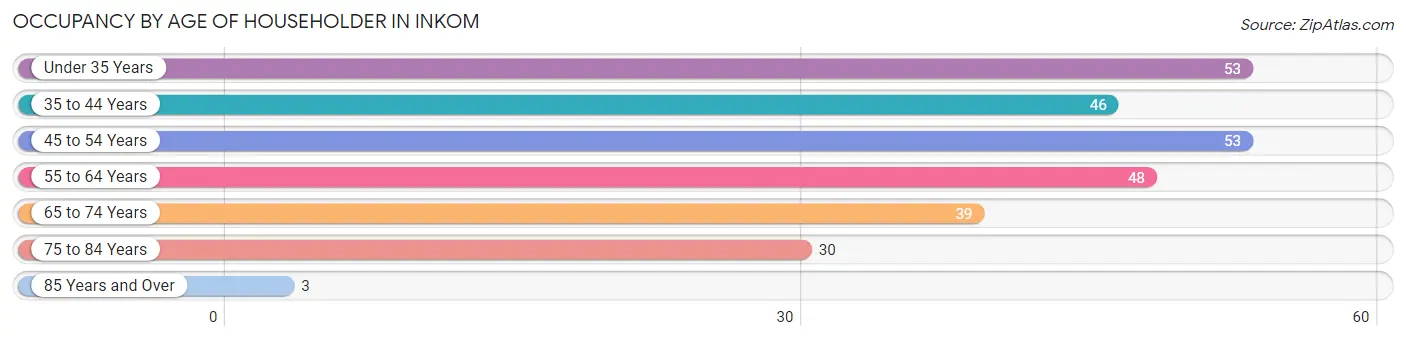
| Age Bracket | # Households | % Households |
| Under 35 Years | 53 | 19.5% |
| 35 to 44 Years | 46 | 16.9% |
| 45 to 54 Years | 53 | 19.5% |
| 55 to 64 Years | 48 | 17.6% |
| 65 to 74 Years | 39 | 14.3% |
| 75 to 84 Years | 30 | 11.0% |
| 85 Years and Over | 3 | 1.1% |
| Total | 272 | 100.0% |
Housing Finances in Inkom
Median Income by Occupancy in Inkom
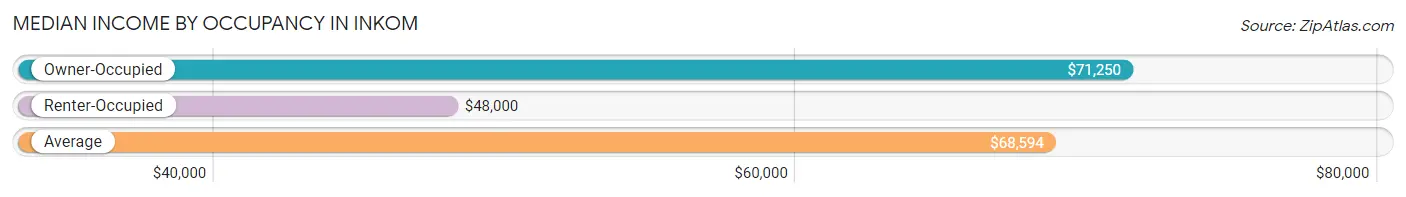
| Occupancy Type | # Households | Median Income |
| Owner-Occupied | 232 (85.3%) | $71,250 |
| Renter-Occupied | 40 (14.7%) | $48,000 |
| Average | 272 (100.0%) | $68,594 |
Occupancy by Householder Income Bracket in Inkom
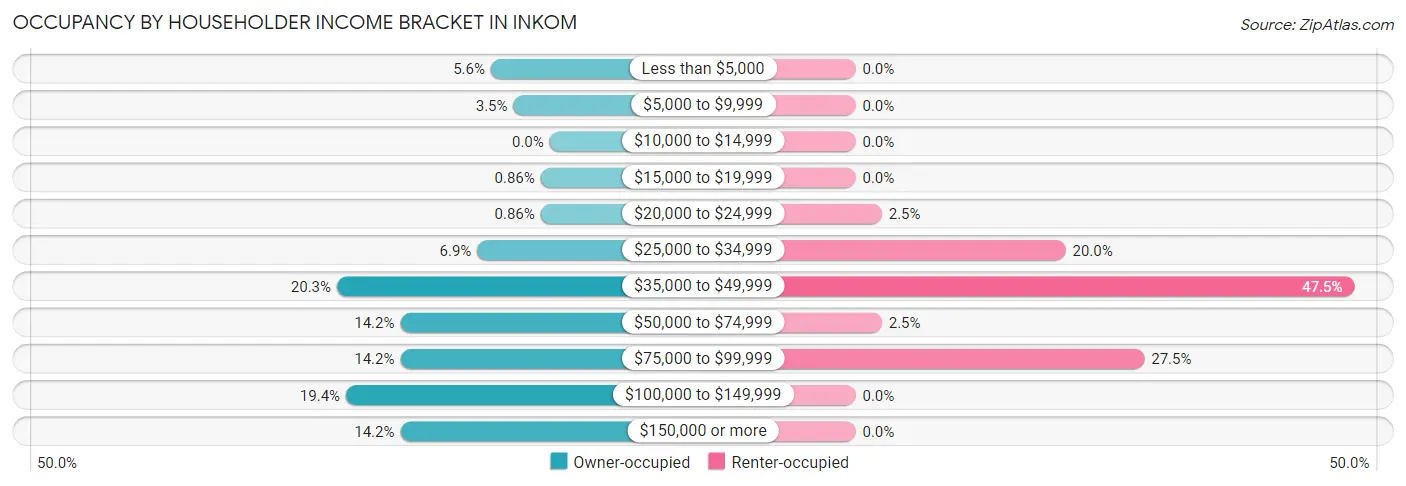
| Income Bracket | Owner-occupied | Renter-occupied |
| Less than $5,000 | 13 (5.6%) | 0 (0.0%) |
| $5,000 to $9,999 | 8 (3.5%) | 0 (0.0%) |
| $10,000 to $14,999 | 0 (0.0%) | 0 (0.0%) |
| $15,000 to $19,999 | 2 (0.9%) | 0 (0.0%) |
| $20,000 to $24,999 | 2 (0.9%) | 1 (2.5%) |
| $25,000 to $34,999 | 16 (6.9%) | 8 (20.0%) |
| $35,000 to $49,999 | 47 (20.3%) | 19 (47.5%) |
| $50,000 to $74,999 | 33 (14.2%) | 1 (2.5%) |
| $75,000 to $99,999 | 33 (14.2%) | 11 (27.5%) |
| $100,000 to $149,999 | 45 (19.4%) | 0 (0.0%) |
| $150,000 or more | 33 (14.2%) | 0 (0.0%) |
| Total | 232 (100.0%) | 40 (100.0%) |
Monthly Housing Cost Tiers in Inkom
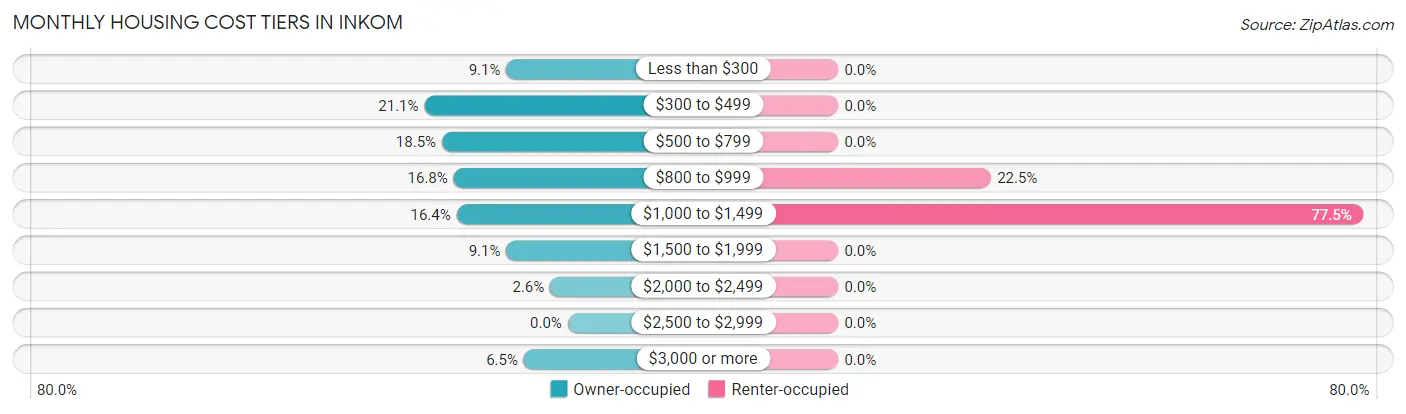
| Monthly Cost | Owner-occupied | Renter-occupied |
| Less than $300 | 21 (9.0%) | 0 (0.0%) |
| $300 to $499 | 49 (21.1%) | 0 (0.0%) |
| $500 to $799 | 43 (18.5%) | 0 (0.0%) |
| $800 to $999 | 39 (16.8%) | 9 (22.5%) |
| $1,000 to $1,499 | 38 (16.4%) | 31 (77.5%) |
| $1,500 to $1,999 | 21 (9.0%) | 0 (0.0%) |
| $2,000 to $2,499 | 6 (2.6%) | 0 (0.0%) |
| $2,500 to $2,999 | 0 (0.0%) | 0 (0.0%) |
| $3,000 or more | 15 (6.5%) | 0 (0.0%) |
| Total | 232 (100.0%) | 40 (100.0%) |
Physical Housing Characteristics in Inkom
Housing Structures in Inkom
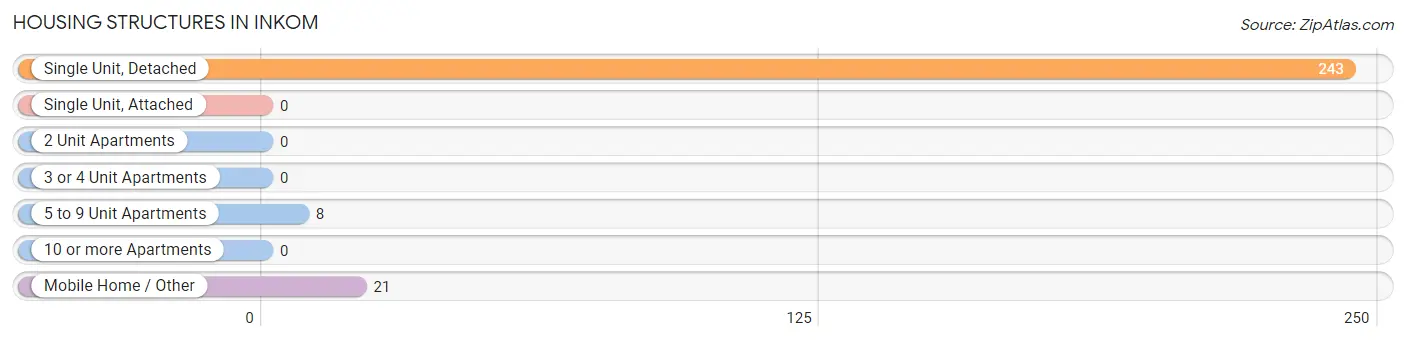
| Structure Type | # Housing Units | % Housing Units |
| Single Unit, Detached | 243 | 89.3% |
| Single Unit, Attached | 0 | 0.0% |
| 2 Unit Apartments | 0 | 0.0% |
| 3 or 4 Unit Apartments | 0 | 0.0% |
| 5 to 9 Unit Apartments | 8 | 2.9% |
| 10 or more Apartments | 0 | 0.0% |
| Mobile Home / Other | 21 | 7.7% |
| Total | 272 | 100.0% |
Housing Structures by Occupancy in Inkom
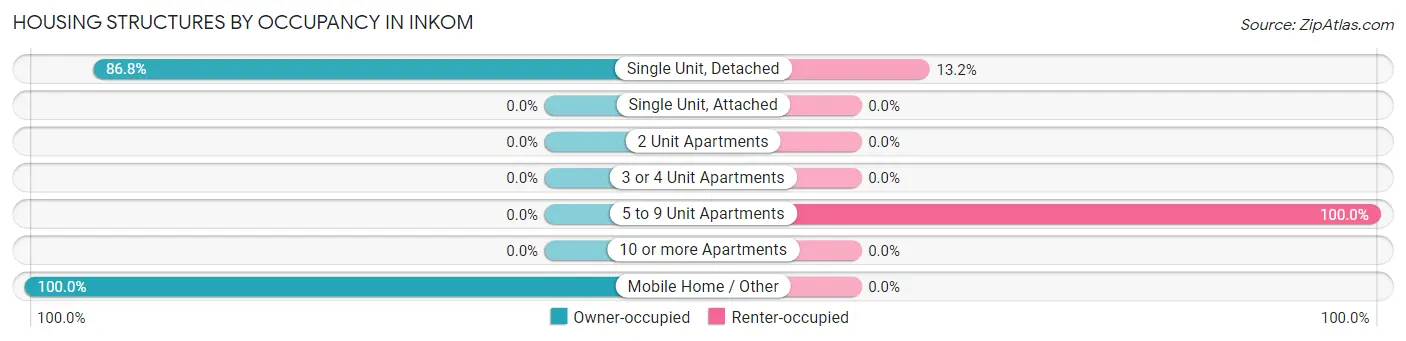
| Structure Type | Owner-occupied | Renter-occupied |
| Single Unit, Detached | 211 (86.8%) | 32 (13.2%) |
| Single Unit, Attached | 0 (0.0%) | 0 (0.0%) |
| 2 Unit Apartments | 0 (0.0%) | 0 (0.0%) |
| 3 or 4 Unit Apartments | 0 (0.0%) | 0 (0.0%) |
| 5 to 9 Unit Apartments | 0 (0.0%) | 8 (100.0%) |
| 10 or more Apartments | 0 (0.0%) | 0 (0.0%) |
| Mobile Home / Other | 21 (100.0%) | 0 (0.0%) |
| Total | 232 (85.3%) | 40 (14.7%) |
Housing Structures by Number of Rooms in Inkom
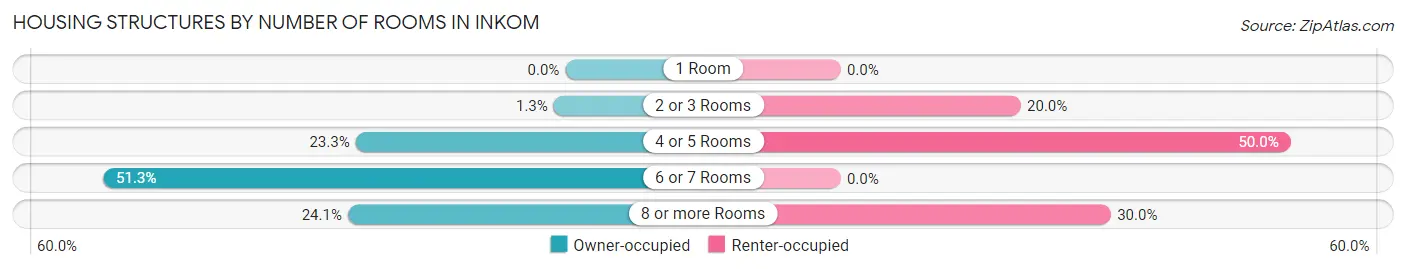
| Number of Rooms | Owner-occupied | Renter-occupied |
| 1 Room | 0 (0.0%) | 0 (0.0%) |
| 2 or 3 Rooms | 3 (1.3%) | 8 (20.0%) |
| 4 or 5 Rooms | 54 (23.3%) | 20 (50.0%) |
| 6 or 7 Rooms | 119 (51.3%) | 0 (0.0%) |
| 8 or more Rooms | 56 (24.1%) | 12 (30.0%) |
| Total | 232 (100.0%) | 40 (100.0%) |
Housing Structure by Heating Type in Inkom
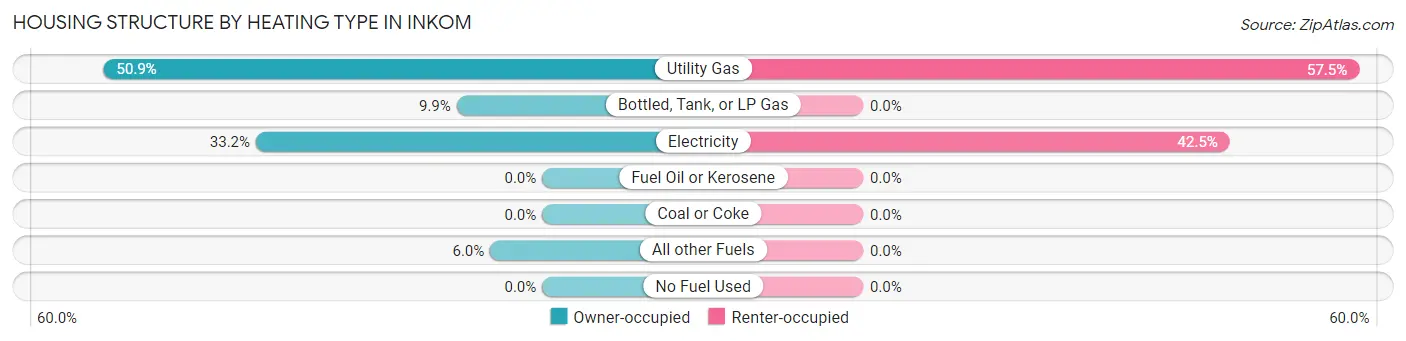
| Heating Type | Owner-occupied | Renter-occupied |
| Utility Gas | 118 (50.9%) | 23 (57.5%) |
| Bottled, Tank, or LP Gas | 23 (9.9%) | 0 (0.0%) |
| Electricity | 77 (33.2%) | 17 (42.5%) |
| Fuel Oil or Kerosene | 0 (0.0%) | 0 (0.0%) |
| Coal or Coke | 0 (0.0%) | 0 (0.0%) |
| All other Fuels | 14 (6.0%) | 0 (0.0%) |
| No Fuel Used | 0 (0.0%) | 0 (0.0%) |
| Total | 232 (100.0%) | 40 (100.0%) |
Household Vehicle Usage in Inkom
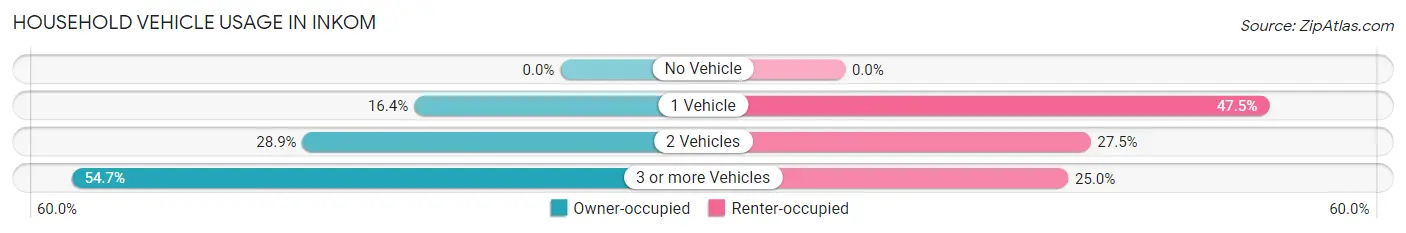
| Vehicles per Household | Owner-occupied | Renter-occupied |
| No Vehicle | 0 (0.0%) | 0 (0.0%) |
| 1 Vehicle | 38 (16.4%) | 19 (47.5%) |
| 2 Vehicles | 67 (28.9%) | 11 (27.5%) |
| 3 or more Vehicles | 127 (54.7%) | 10 (25.0%) |
| Total | 232 (100.0%) | 40 (100.0%) |
Real Estate & Mortgages in Inkom
Real Estate and Mortgage Overview in Inkom
| Characteristic | Without Mortgage | With Mortgage |
| Housing Units | 109 | 123 |
| Median Property Value | $224,300 | $220,800 |
| Median Household Income | $58,523 | $28 |
| Monthly Housing Costs | $412 | $15 |
| Real Estate Taxes | $1,125 | $4 |
Property Value by Mortgage Status in Inkom
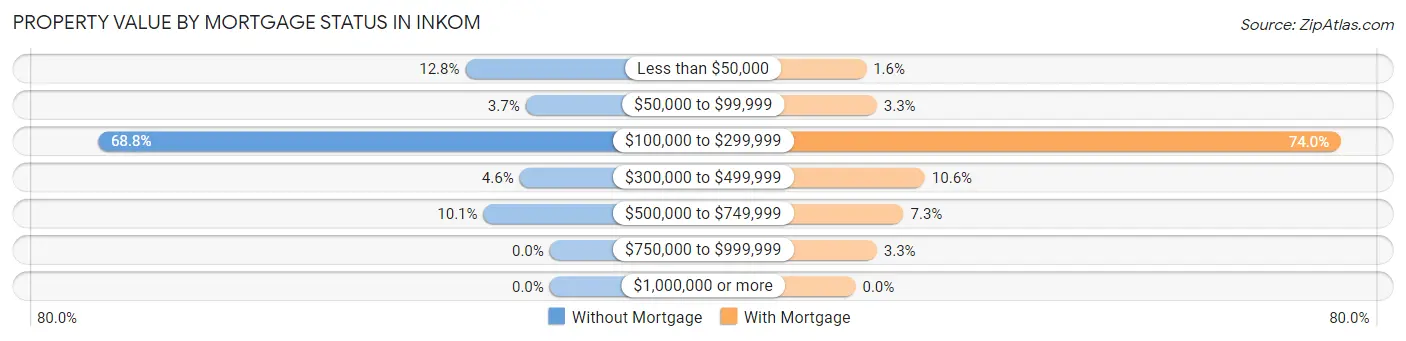
| Property Value | Without Mortgage | With Mortgage |
| Less than $50,000 | 14 (12.8%) | 2 (1.6%) |
| $50,000 to $99,999 | 4 (3.7%) | 4 (3.3%) |
| $100,000 to $299,999 | 75 (68.8%) | 91 (74.0%) |
| $300,000 to $499,999 | 5 (4.6%) | 13 (10.6%) |
| $500,000 to $749,999 | 11 (10.1%) | 9 (7.3%) |
| $750,000 to $999,999 | 0 (0.0%) | 4 (3.3%) |
| $1,000,000 or more | 0 (0.0%) | 0 (0.0%) |
| Total | 109 (100.0%) | 123 (100.0%) |
Household Income by Mortgage Status in Inkom
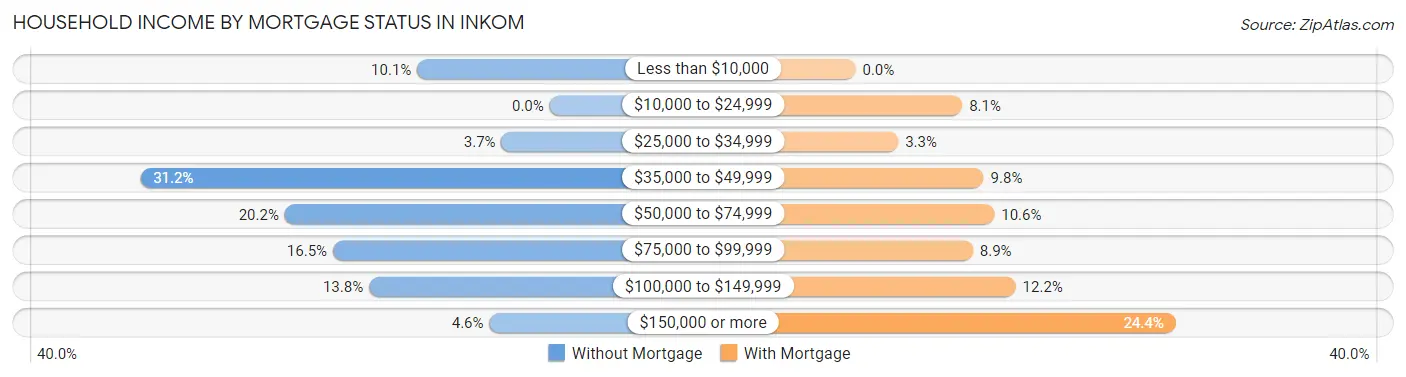
| Household Income | Without Mortgage | With Mortgage |
| Less than $10,000 | 11 (10.1%) | 0 (0.0%) |
| $10,000 to $24,999 | 0 (0.0%) | 10 (8.1%) |
| $25,000 to $34,999 | 4 (3.7%) | 4 (3.3%) |
| $35,000 to $49,999 | 34 (31.2%) | 12 (9.8%) |
| $50,000 to $74,999 | 22 (20.2%) | 13 (10.6%) |
| $75,000 to $99,999 | 18 (16.5%) | 11 (8.9%) |
| $100,000 to $149,999 | 15 (13.8%) | 15 (12.2%) |
| $150,000 or more | 5 (4.6%) | 30 (24.4%) |
| Total | 109 (100.0%) | 123 (100.0%) |
Property Value to Household Income Ratio in Inkom
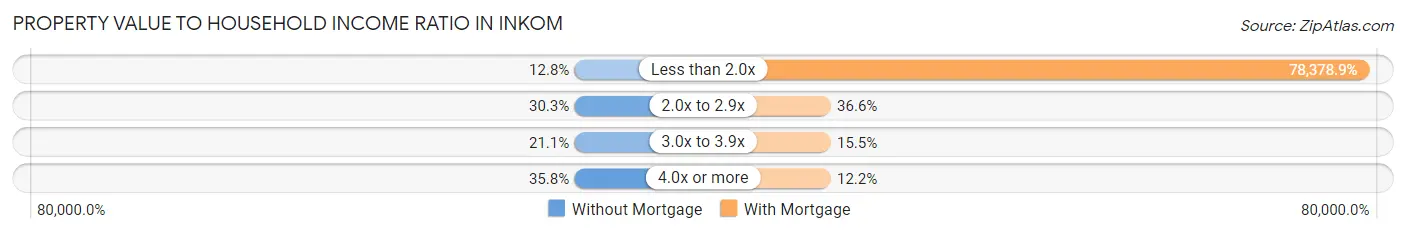
| Value-to-Income Ratio | Without Mortgage | With Mortgage |
| Less than 2.0x | 14 (12.8%) | 96,406 (78,378.9%) |
| 2.0x to 2.9x | 33 (30.3%) | 45 (36.6%) |
| 3.0x to 3.9x | 23 (21.1%) | 19 (15.4%) |
| 4.0x or more | 39 (35.8%) | 15 (12.2%) |
| Total | 109 (100.0%) | 123 (100.0%) |
Real Estate Taxes by Mortgage Status in Inkom
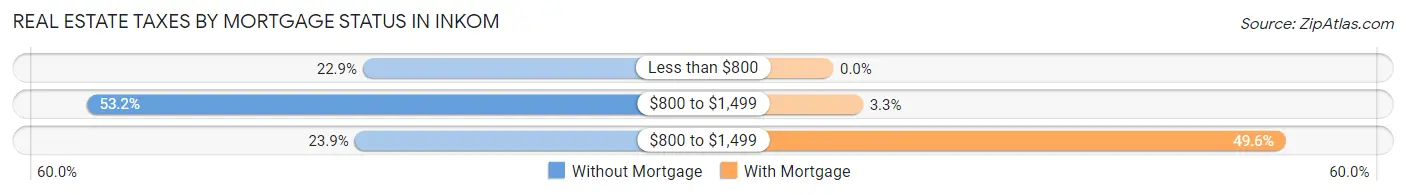
| Property Taxes | Without Mortgage | With Mortgage |
| Less than $800 | 25 (22.9%) | 0 (0.0%) |
| $800 to $1,499 | 58 (53.2%) | 4 (3.3%) |
| $800 to $1,499 | 26 (23.8%) | 61 (49.6%) |
| Total | 109 (100.0%) | 123 (100.0%) |
Health & Disability in Inkom
Health Insurance Coverage by Age in Inkom
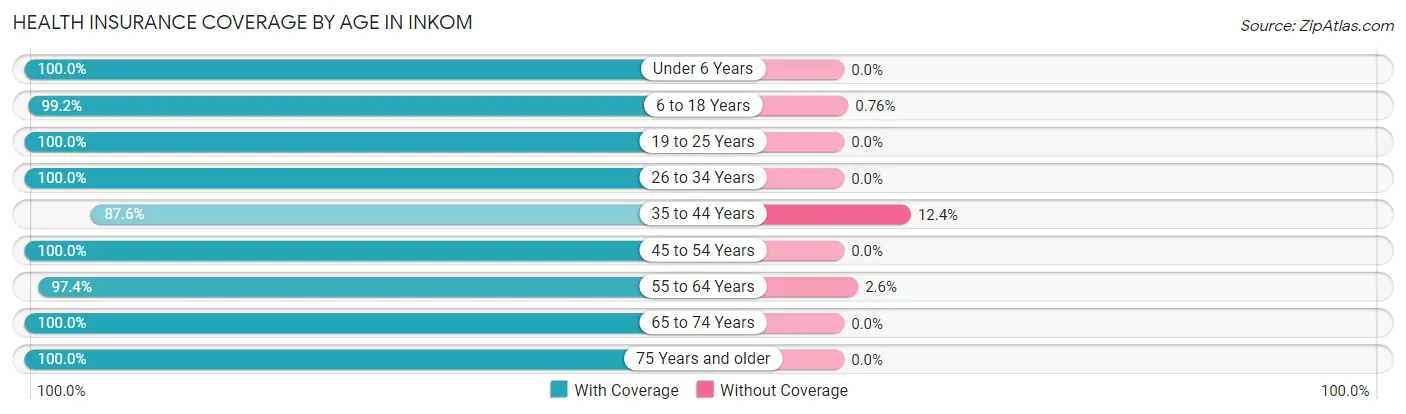
| Age Bracket | With Coverage | Without Coverage |
| Under 6 Years | 83 (100.0%) | 0 (0.0%) |
| 6 to 18 Years | 261 (99.2%) | 2 (0.8%) |
| 19 to 25 Years | 32 (100.0%) | 0 (0.0%) |
| 26 to 34 Years | 134 (100.0%) | 0 (0.0%) |
| 35 to 44 Years | 155 (87.6%) | 22 (12.4%) |
| 45 to 54 Years | 85 (100.0%) | 0 (0.0%) |
| 55 to 64 Years | 75 (97.4%) | 2 (2.6%) |
| 65 to 74 Years | 54 (100.0%) | 0 (0.0%) |
| 75 Years and older | 49 (100.0%) | 0 (0.0%) |
| Total | 928 (97.3%) | 26 (2.7%) |
Health Insurance Coverage by Citizenship Status in Inkom
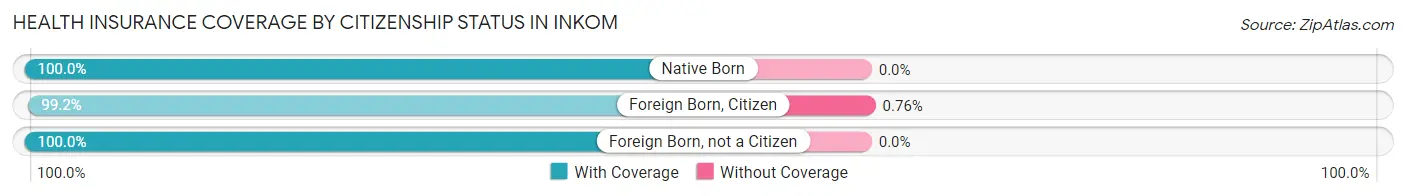
| Citizenship Status | With Coverage | Without Coverage |
| Native Born | 83 (100.0%) | 0 (0.0%) |
| Foreign Born, Citizen | 261 (99.2%) | 2 (0.8%) |
| Foreign Born, not a Citizen | 32 (100.0%) | 0 (0.0%) |
Health Insurance Coverage by Household Income in Inkom
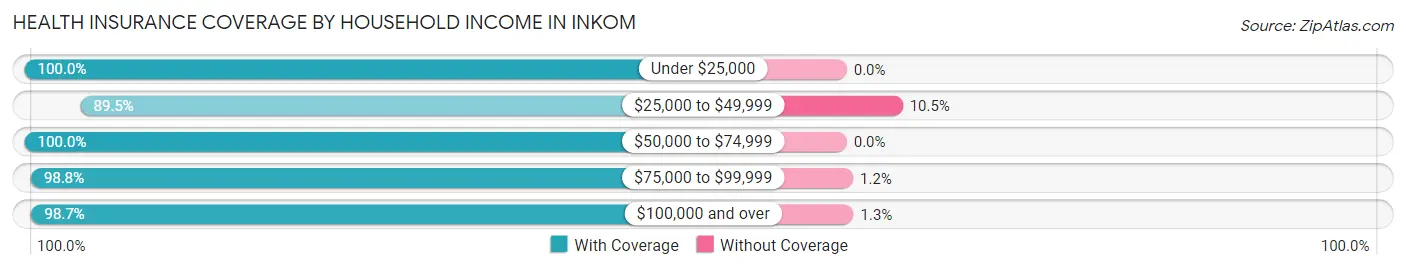
| Household Income | With Coverage | Without Coverage |
| Under $25,000 | 56 (100.0%) | 0 (0.0%) |
| $25,000 to $49,999 | 154 (89.5%) | 18 (10.5%) |
| $50,000 to $74,999 | 87 (100.0%) | 0 (0.0%) |
| $75,000 to $99,999 | 168 (98.8%) | 2 (1.2%) |
| $100,000 and over | 463 (98.7%) | 6 (1.3%) |
Public vs Private Health Insurance Coverage by Age in Inkom
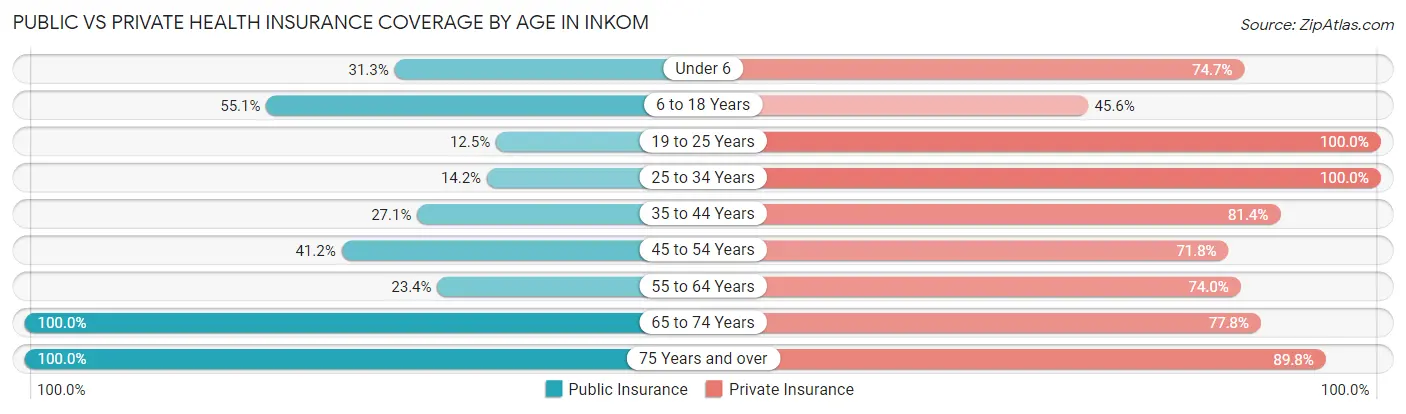
| Age Bracket | Public Insurance | Private Insurance |
| Under 6 | 26 (31.3%) | 62 (74.7%) |
| 6 to 18 Years | 145 (55.1%) | 120 (45.6%) |
| 19 to 25 Years | 4 (12.5%) | 32 (100.0%) |
| 25 to 34 Years | 19 (14.2%) | 134 (100.0%) |
| 35 to 44 Years | 48 (27.1%) | 144 (81.4%) |
| 45 to 54 Years | 35 (41.2%) | 61 (71.8%) |
| 55 to 64 Years | 18 (23.4%) | 57 (74.0%) |
| 65 to 74 Years | 54 (100.0%) | 42 (77.8%) |
| 75 Years and over | 49 (100.0%) | 44 (89.8%) |
| Total | 398 (41.7%) | 696 (73.0%) |
Disability Status by Sex by Age in Inkom
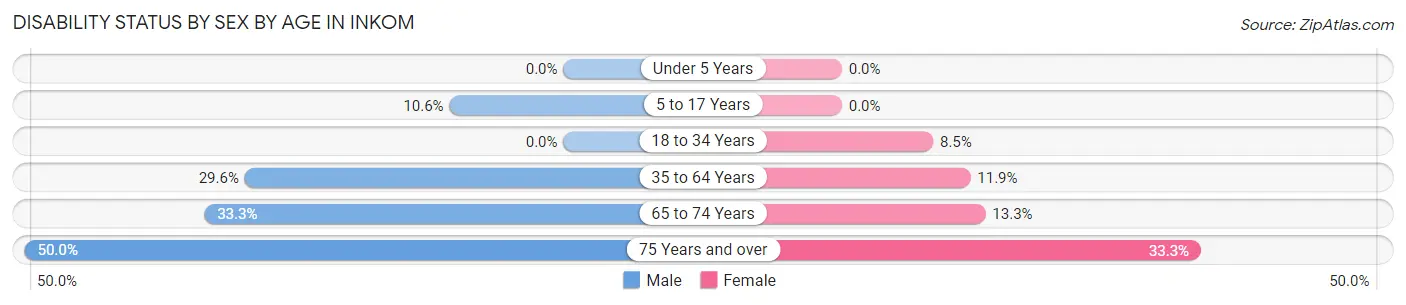
| Age Bracket | Male | Female |
| Under 5 Years | 0 (0.0%) | 0 (0.0%) |
| 5 to 17 Years | 13 (10.6%) | 0 (0.0%) |
| 18 to 34 Years | 0 (0.0%) | 10 (8.5%) |
| 35 to 64 Years | 68 (29.6%) | 13 (11.9%) |
| 65 to 74 Years | 8 (33.3%) | 4 (13.3%) |
| 75 Years and over | 17 (50.0%) | 5 (33.3%) |
Disability Class by Sex by Age in Inkom
Disability Class: Hearing Difficulty
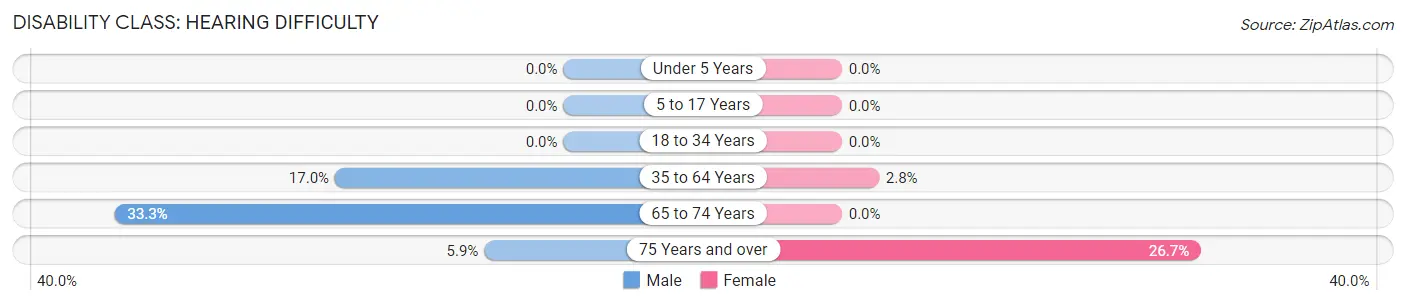
| Age Bracket | Male | Female |
| Under 5 Years | 0 (0.0%) | 0 (0.0%) |
| 5 to 17 Years | 0 (0.0%) | 0 (0.0%) |
| 18 to 34 Years | 0 (0.0%) | 0 (0.0%) |
| 35 to 64 Years | 39 (17.0%) | 3 (2.8%) |
| 65 to 74 Years | 8 (33.3%) | 0 (0.0%) |
| 75 Years and over | 2 (5.9%) | 4 (26.7%) |
Disability Class: Vision Difficulty
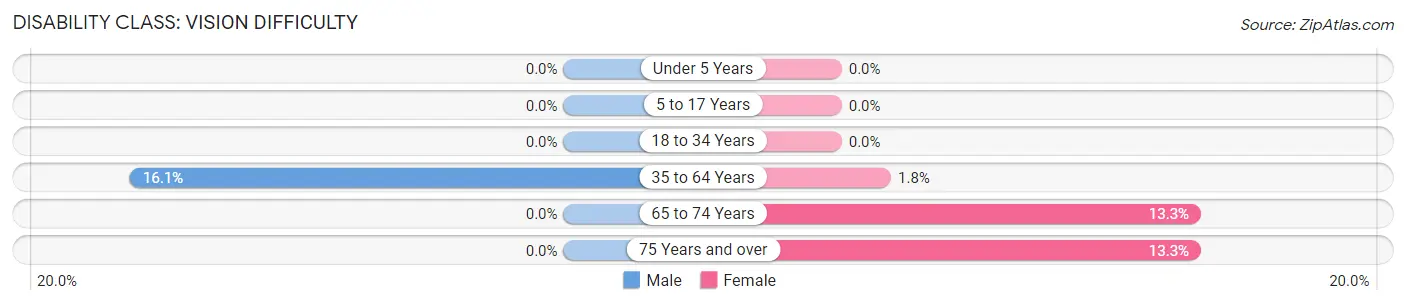
| Age Bracket | Male | Female |
| Under 5 Years | 0 (0.0%) | 0 (0.0%) |
| 5 to 17 Years | 0 (0.0%) | 0 (0.0%) |
| 18 to 34 Years | 0 (0.0%) | 0 (0.0%) |
| 35 to 64 Years | 37 (16.1%) | 2 (1.8%) |
| 65 to 74 Years | 0 (0.0%) | 4 (13.3%) |
| 75 Years and over | 0 (0.0%) | 2 (13.3%) |
Disability Class: Cognitive Difficulty
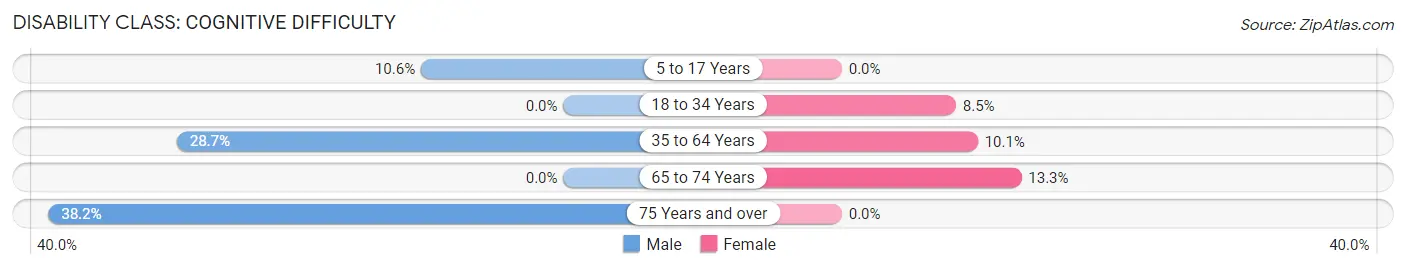
| Age Bracket | Male | Female |
| 5 to 17 Years | 13 (10.6%) | 0 (0.0%) |
| 18 to 34 Years | 0 (0.0%) | 10 (8.5%) |
| 35 to 64 Years | 66 (28.7%) | 11 (10.1%) |
| 65 to 74 Years | 0 (0.0%) | 4 (13.3%) |
| 75 Years and over | 13 (38.2%) | 0 (0.0%) |
Disability Class: Ambulatory Difficulty
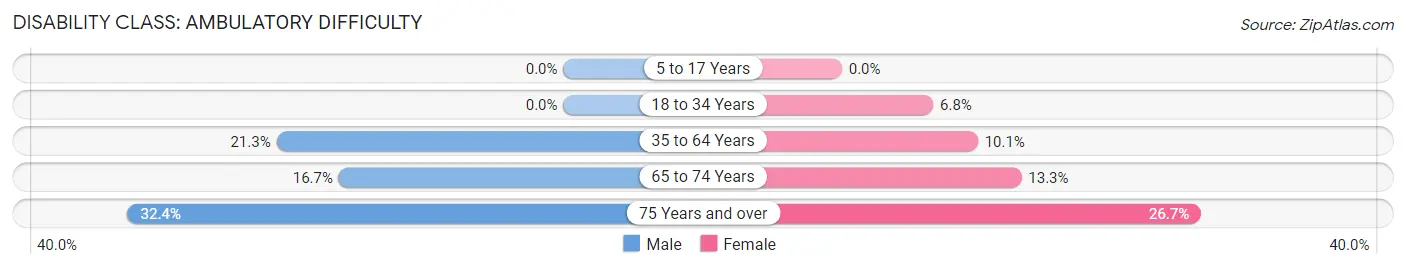
| Age Bracket | Male | Female |
| 5 to 17 Years | 0 (0.0%) | 0 (0.0%) |
| 18 to 34 Years | 0 (0.0%) | 8 (6.8%) |
| 35 to 64 Years | 49 (21.3%) | 11 (10.1%) |
| 65 to 74 Years | 4 (16.7%) | 4 (13.3%) |
| 75 Years and over | 11 (32.4%) | 4 (26.7%) |
Disability Class: Self-Care Difficulty
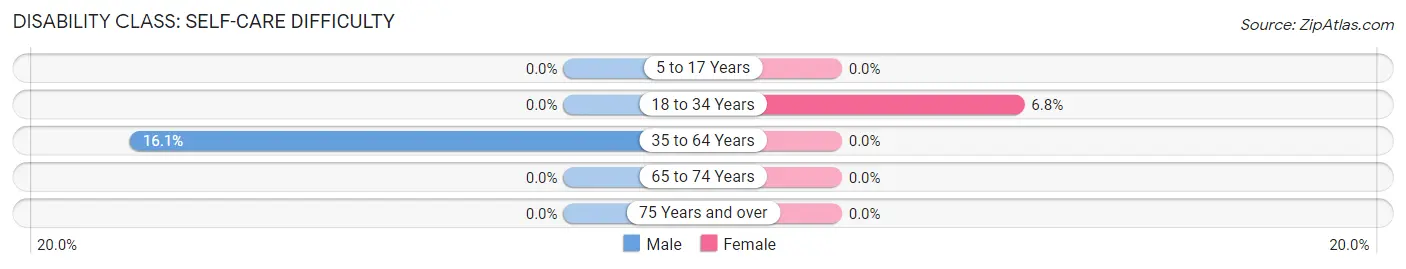
| Age Bracket | Male | Female |
| 5 to 17 Years | 0 (0.0%) | 0 (0.0%) |
| 18 to 34 Years | 0 (0.0%) | 8 (6.8%) |
| 35 to 64 Years | 37 (16.1%) | 0 (0.0%) |
| 65 to 74 Years | 0 (0.0%) | 0 (0.0%) |
| 75 Years and over | 0 (0.0%) | 0 (0.0%) |
Technology Access in Inkom
Computing Device Access in Inkom
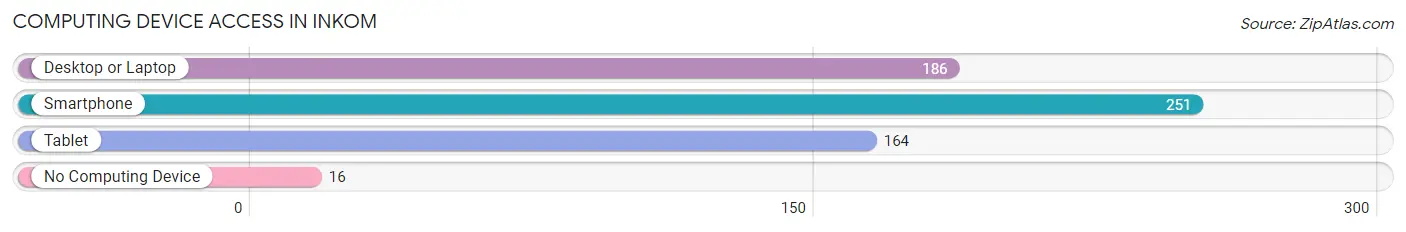
| Device Type | # Households | % Households |
| Desktop or Laptop | 186 | 68.4% |
| Smartphone | 251 | 92.3% |
| Tablet | 164 | 60.3% |
| No Computing Device | 16 | 5.9% |
| Total | 272 | 100.0% |
Internet Access in Inkom
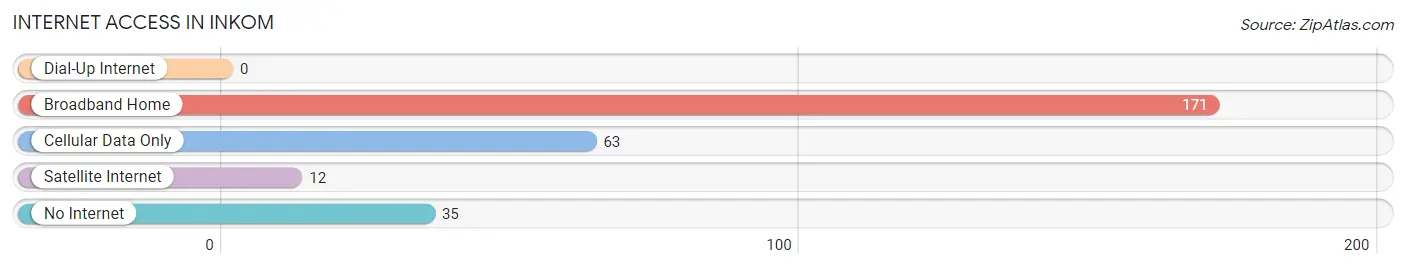
| Internet Type | # Households | % Households |
| Dial-Up Internet | 0 | 0.0% |
| Broadband Home | 171 | 62.9% |
| Cellular Data Only | 63 | 23.2% |
| Satellite Internet | 12 | 4.4% |
| No Internet | 35 | 12.9% |
| Total | 272 | 100.0% |
Inkom Summary
Inkom is a city located in southeastern Idaho, United States. It is the county seat of Bannock County and is part of the Pocatello metropolitan area. The population of Inkom was 1,845 at the 2010 census.
History
Inkom was founded in 1883 by the Union Pacific Railroad. The city was named after the Shoshone word for "blackbird," which was the name of a nearby creek. The city was incorporated in 1891 and was the first city in Bannock County.
Inkom was an important stop on the Union Pacific Railroad, and the city grew rapidly in the early 20th century. The city was home to several businesses, including a flour mill, a creamery, and a brickyard.
Inkom was also the site of a major labor dispute in the early 1900s. In 1903, the city's miners went on strike, demanding better wages and working conditions. The strike lasted for several months and was eventually resolved in favor of the miners.
Geography
Inkom is located in southeastern Idaho, in the Snake River Plain region. The city is situated at an elevation of 4,845 feet (1,477 m) above sea level.
The city is located near the Portneuf River, which flows through the city. The city is also located near the Blackfoot Mountains, which are part of the Rocky Mountains.
Economy
Inkom's economy is largely based on agriculture and manufacturing. The city is home to several food processing plants, including a potato processing plant and a cheese factory.
The city is also home to several retail stores including a Walmart Supercenter
Demographics
As of the 2010 census, the population of Inkom was 1,845. The racial makeup of the city was 94.3% White, 0.7% African American, 0.7% Native American, 0.3% Asian, 0.1% Pacific Islander, 1.2% from other races, and 2.1% from two or more races. Hispanic or Latino of any race were 3.2% of the population.
The median household income in Inkom was $37,917, and the median family income was $45,938. The per capita income was $18,945. About 11.2% of families and 14.2% of the population were below the poverty line, including 18.2% of those under age 18 and 8.3% of those age 65 or over.
Inkom is served by the Bannock County School District. The city is home to Inkom Elementary School, Inkom Middle School, and Inkom High School.
Common Questions
What is Per Capita Income in Inkom?
Per Capita income in Inkom is $25,945.
What is the Median Family Income in Inkom?
Median Family Income in Inkom is $95,625.
What is the Median Household income in Inkom?
Median Household Income in Inkom is $68,594.
What is Inequality or Gini Index in Inkom?
Inequality or Gini Index in Inkom is 0.38.
What is the Total Population of Inkom?
Total Population of Inkom is 954.
What is the Total Male Population of Inkom?
Total Male Population of Inkom is 513.
What is the Total Female Population of Inkom?
Total Female Population of Inkom is 441.
What is the Ratio of Males per 100 Females in Inkom?
There are 116.33 Males per 100 Females in Inkom.
What is the Ratio of Females per 100 Males in Inkom?
There are 85.96 Females per 100 Males in Inkom.
What is the Median Population Age in Inkom?
Median Population Age in Inkom is 33.8 Years.
What is the Average Family Size in Inkom
Average Family Size in Inkom is 4.5 People.
What is the Average Household Size in Inkom
Average Household Size in Inkom is 3.5 People.
How Large is the Labor Force in Inkom?
There are 408 People in the Labor Forcein in Inkom.
What is the Percentage of People in the Labor Force in Inkom?
59.4% of People are in the Labor Force in Inkom.
What is the Unemployment Rate in Inkom?
Unemployment Rate in Inkom is 3.7%.