Idaho City, ID Map & Demographics
Idaho City Map
Idaho City Overview
$27,091
PER CAPITA INCOME
$53,967
AVG FAMILY INCOME
$42,361
AVG HOUSEHOLD INCOME
10.1%
WAGE / INCOME GAP [ % ]
89.9¢/ $1
WAGE / INCOME GAP [ $ ]
0.34
INEQUALITY / GINI INDEX
673
TOTAL POPULATION
309
MALE POPULATION
364
FEMALE POPULATION
84.89
MALES / 100 FEMALES
117.80
FEMALES / 100 MALES
38.3
MEDIAN AGE
2.4
AVG FAMILY SIZE
2.1
AVG HOUSEHOLD SIZE
315
LABOR FORCE [ PEOPLE ]
62.4%
PERCENT IN LABOR FORCE
6.0%
UNEMPLOYMENT RATE
Idaho City Zip Codes
Idaho City Area Codes
Income in Idaho City
Income Overview in Idaho City
Per Capita Income in Idaho City is $27,091, while median incomes of families and households are $53,967 and $42,361 respectively.
| Characteristic | Number | Measure |
| Per Capita Income | 673 | $27,091 |
| Median Family Income | 226 | $53,967 |
| Mean Family Income | 226 | $65,253 |
| Median Household Income | 319 | $42,361 |
| Mean Household Income | 319 | $57,496 |
| Income Deficit | 226 | $0 |
| Wage / Income Gap (%) | 673 | 10.11% |
| Wage / Income Gap ($) | 673 | 89.89¢ per $1 |
| Gini / Inequality Index | 673 | 0.34 |
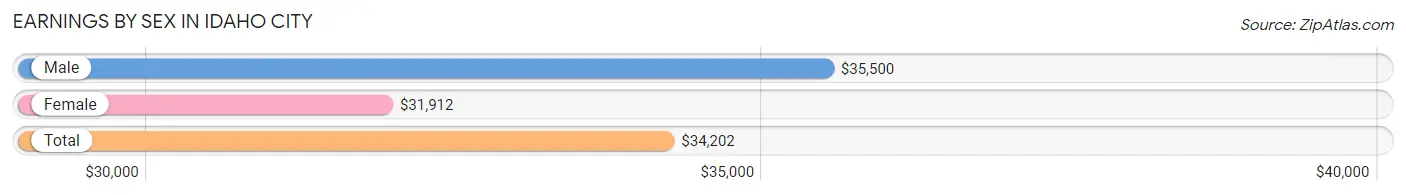
Earnings by Sex in Idaho City
Average Earnings in Idaho City are $34,202, $35,500 for men and $31,912 for women, a difference of 10.1%.
| Sex | Number | Average Earnings |
| Male | 166 (49.4%) | $35,500 |
| Female | 170 (50.6%) | $31,912 |
| Total | 336 (100.0%) | $34,202 |
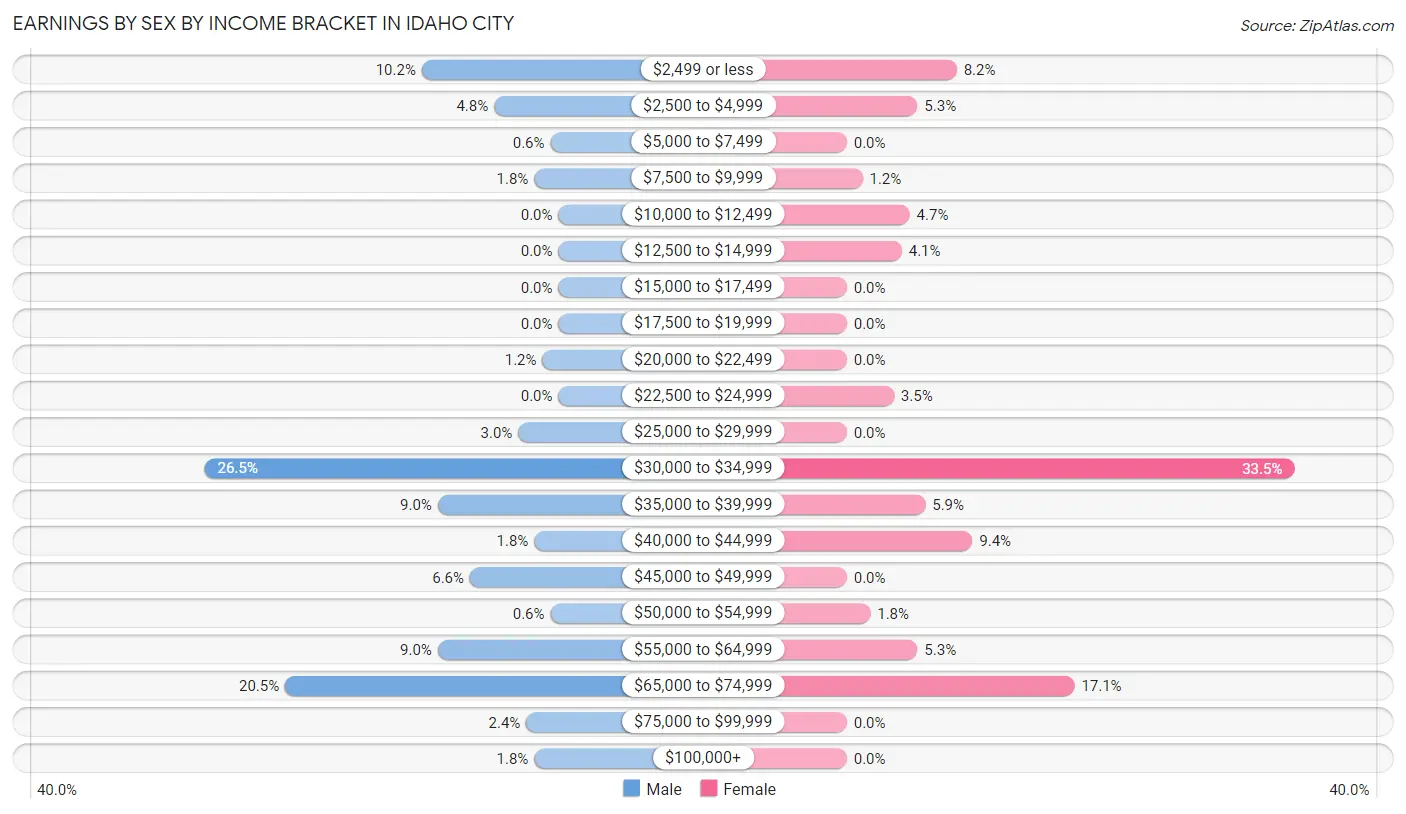
Earnings by Sex by Income Bracket in Idaho City
The most common earnings brackets in Idaho City are $30,000 to $34,999 for men (44 | 26.5%) and $30,000 to $34,999 for women (57 | 33.5%).
| Income | Male | Female |
| $2,499 or less | 17 (10.2%) | 14 (8.2%) |
| $2,500 to $4,999 | 8 (4.8%) | 9 (5.3%) |
| $5,000 to $7,499 | 1 (0.6%) | 0 (0.0%) |
| $7,500 to $9,999 | 3 (1.8%) | 2 (1.2%) |
| $10,000 to $12,499 | 0 (0.0%) | 8 (4.7%) |
| $12,500 to $14,999 | 0 (0.0%) | 7 (4.1%) |
| $15,000 to $17,499 | 0 (0.0%) | 0 (0.0%) |
| $17,500 to $19,999 | 0 (0.0%) | 0 (0.0%) |
| $20,000 to $22,499 | 2 (1.2%) | 0 (0.0%) |
| $22,500 to $24,999 | 0 (0.0%) | 6 (3.5%) |
| $25,000 to $29,999 | 5 (3.0%) | 0 (0.0%) |
| $30,000 to $34,999 | 44 (26.5%) | 57 (33.5%) |
| $35,000 to $39,999 | 15 (9.0%) | 10 (5.9%) |
| $40,000 to $44,999 | 3 (1.8%) | 16 (9.4%) |
| $45,000 to $49,999 | 11 (6.6%) | 0 (0.0%) |
| $50,000 to $54,999 | 1 (0.6%) | 3 (1.8%) |
| $55,000 to $64,999 | 15 (9.0%) | 9 (5.3%) |
| $65,000 to $74,999 | 34 (20.5%) | 29 (17.1%) |
| $75,000 to $99,999 | 4 (2.4%) | 0 (0.0%) |
| $100,000+ | 3 (1.8%) | 0 (0.0%) |
| Total | 166 (100.0%) | 170 (100.0%) |
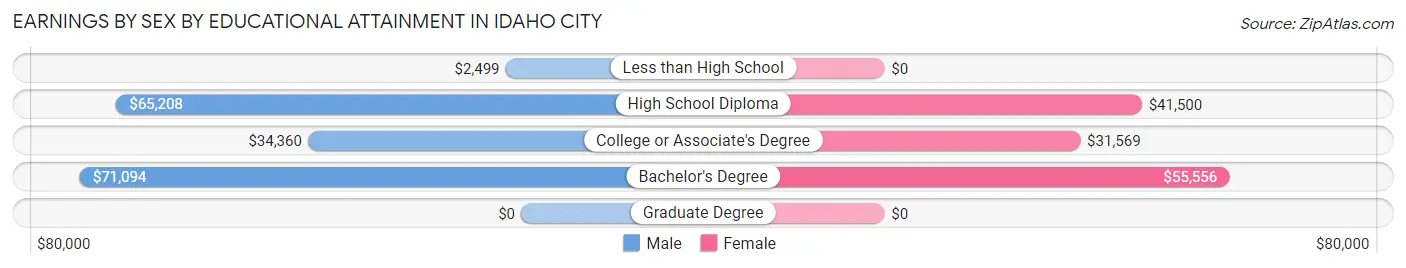
Earnings by Sex by Educational Attainment in Idaho City
Average earnings in Idaho City are $35,583 for men and $32,157 for women, a difference of 9.6%. Men with an educational attainment of bachelor's degree enjoy the highest average annual earnings of $71,094, while those with less than high school education earn the least with $2,499. Women with an educational attainment of bachelor's degree earn the most with the average annual earnings of $55,556, while those with college or associate's degree education have the smallest earnings of $31,569.
| Educational Attainment | Male Income | Female Income |
| Less than High School | $2,499 | $0 |
| High School Diploma | $65,208 | $41,500 |
| College or Associate's Degree | $34,360 | $31,569 |
| Bachelor's Degree | $71,094 | $55,556 |
| Graduate Degree | - | - |
| Total | $35,583 | $32,157 |
Family Income in Idaho City
Family Income Brackets in Idaho City
According to the Idaho City family income data, there are 89 families falling into the $50,000 to $74,999 income range, which is the most common income bracket and makes up 39.4% of all families.
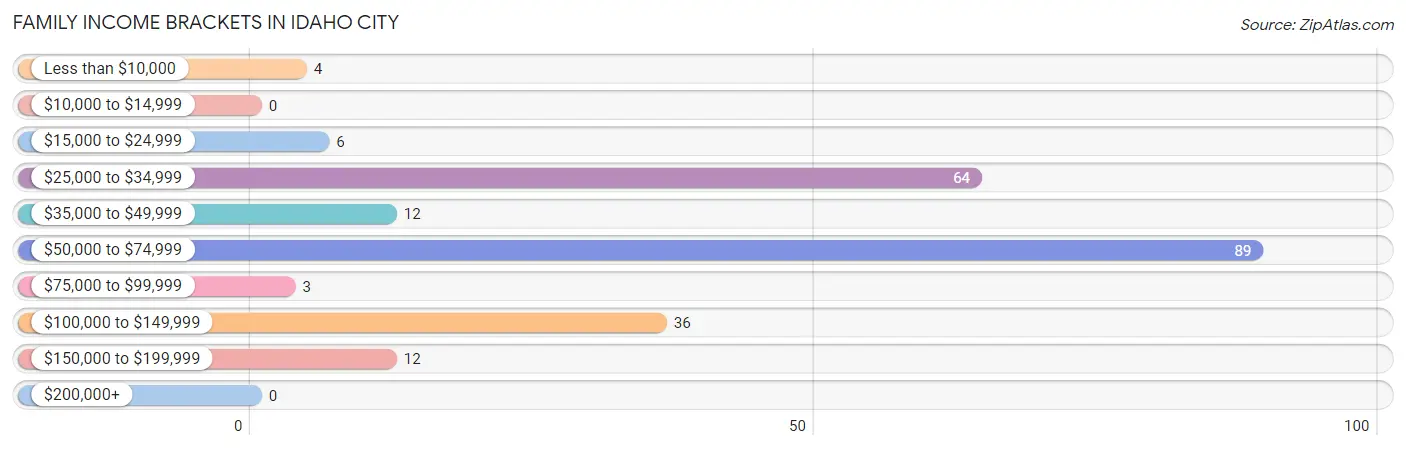
| Income Bracket | # Families | % Families |
| Less than $10,000 | 4 | 1.8% |
| $10,000 to $14,999 | 0 | 0.0% |
| $15,000 to $24,999 | 6 | 2.7% |
| $25,000 to $34,999 | 64 | 28.3% |
| $35,000 to $49,999 | 12 | 5.3% |
| $50,000 to $74,999 | 89 | 39.4% |
| $75,000 to $99,999 | 3 | 1.3% |
| $100,000 to $149,999 | 36 | 15.9% |
| $150,000 to $199,999 | 12 | 5.3% |
| $200,000+ | 0 | 0.0% |
Family Income by Famaliy Size in Idaho City
4-person families (16 | 7.1%) account for the highest median family income in Idaho City with $100,682 per family, while 2-person families (98 | 43.4%) have the highest median income of $26,930 per family member.
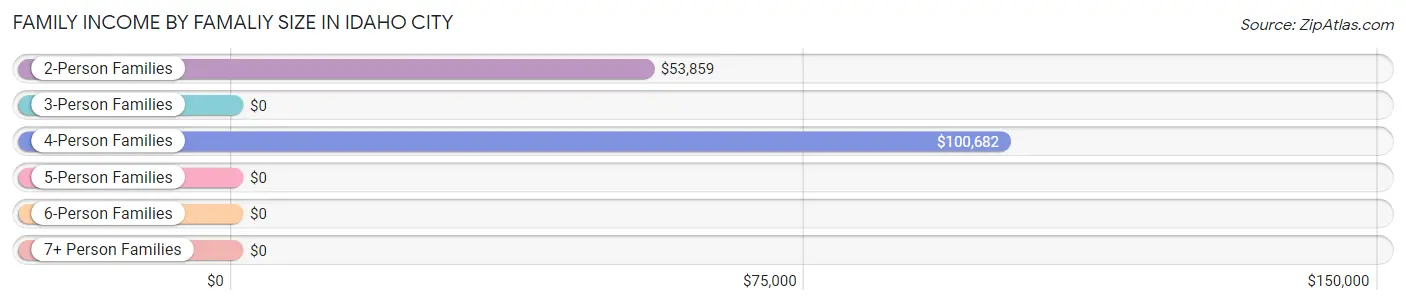
| Income Bracket | # Families | Median Income |
| 2-Person Families | 98 (43.4%) | $53,859 |
| 3-Person Families | 85 (37.6%) | $0 |
| 4-Person Families | 16 (7.1%) | $100,682 |
| 5-Person Families | 12 (5.3%) | $0 |
| 6-Person Families | 15 (6.6%) | $0 |
| 7+ Person Families | 0 (0.0%) | $0 |
| Total | 226 (100.0%) | $53,967 |
Family Income by Number of Earners in Idaho City
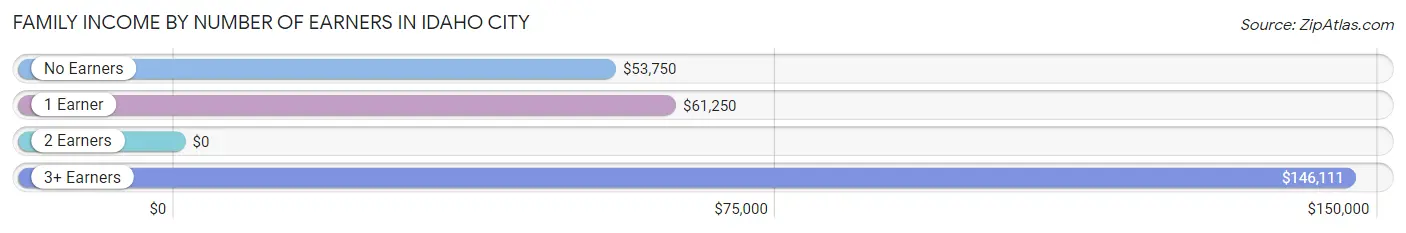
| Number of Earners | # Families | Median Income |
| No Earners | 58 (25.7%) | $53,750 |
| 1 Earner | 52 (23.0%) | $61,250 |
| 2 Earners | 102 (45.1%) | $0 |
| 3+ Earners | 14 (6.2%) | $146,111 |
| Total | 226 (100.0%) | $53,967 |
Household Income in Idaho City
Household Income Brackets in Idaho City
With 118 households falling in the category, the $25,000 to $34,999 income range is the most frequent in Idaho City, accounting for 37.0% of all households.
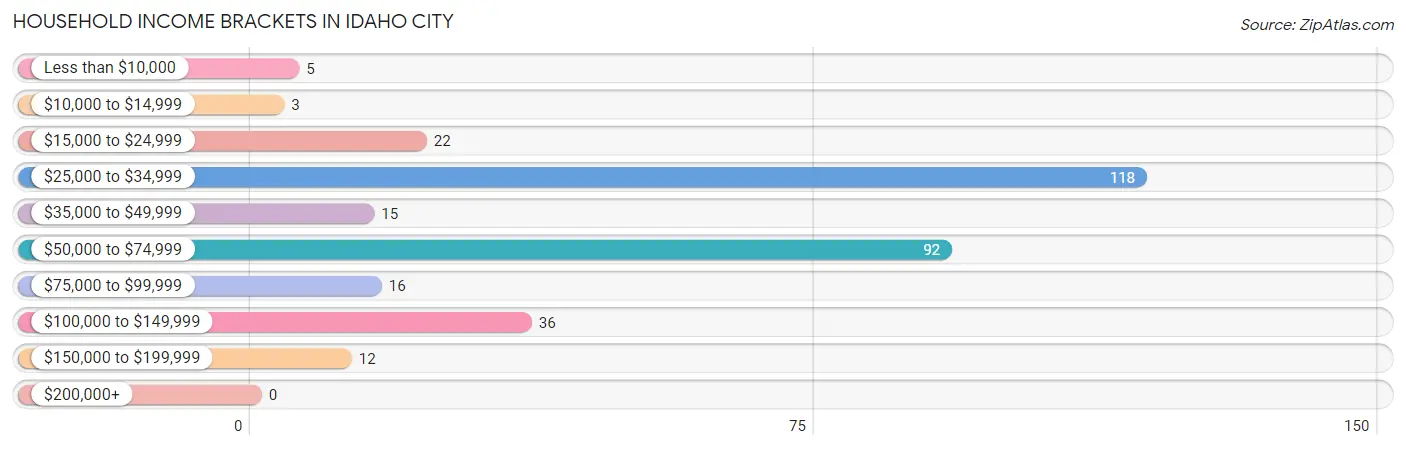
| Income Bracket | # Households | % Households |
| Less than $10,000 | 5 | 1.6% |
| $10,000 to $14,999 | 3 | 0.9% |
| $15,000 to $24,999 | 22 | 6.9% |
| $25,000 to $34,999 | 118 | 37.0% |
| $35,000 to $49,999 | 15 | 4.7% |
| $50,000 to $74,999 | 92 | 28.8% |
| $75,000 to $99,999 | 16 | 5.0% |
| $100,000 to $149,999 | 36 | 11.3% |
| $150,000 to $199,999 | 12 | 3.8% |
| $200,000+ | 0 | 0.0% |
Household Income by Householder Age in Idaho City
The median household income in Idaho City is $42,361, with the highest median household income of $53,016 found in the 65+ years age bracket for the primary householder. A total of 97 households (30.4%) fall into this category.
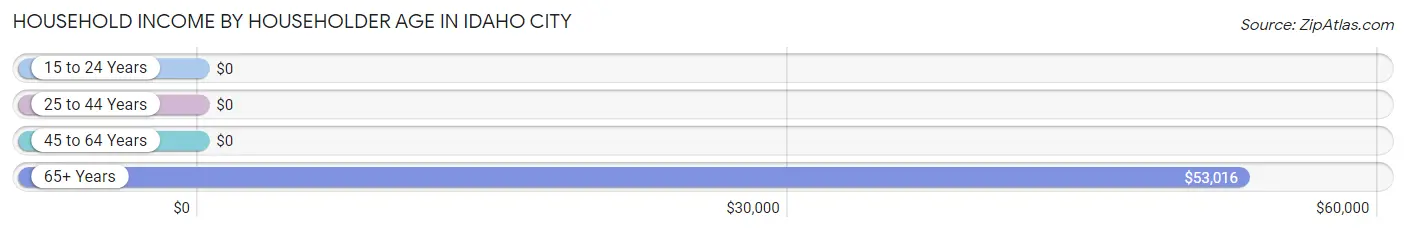
| Income Bracket | # Households | Median Income |
| 15 to 24 Years | 0 (0.0%) | $0 |
| 25 to 44 Years | 130 (40.7%) | $0 |
| 45 to 64 Years | 92 (28.8%) | $0 |
| 65+ Years | 97 (30.4%) | $53,016 |
| Total | 319 (100.0%) | $42,361 |
Poverty in Idaho City
Income Below Poverty by Sex and Age in Idaho City
With 1.9% poverty level for males and 11.0% for females among the residents of Idaho City, 18 to 24 year old males and 25 to 34 year old females are the most vulnerable to poverty, with 1 males (100.0%) and 19 females (35.8%) in their respective age groups living below the poverty level.
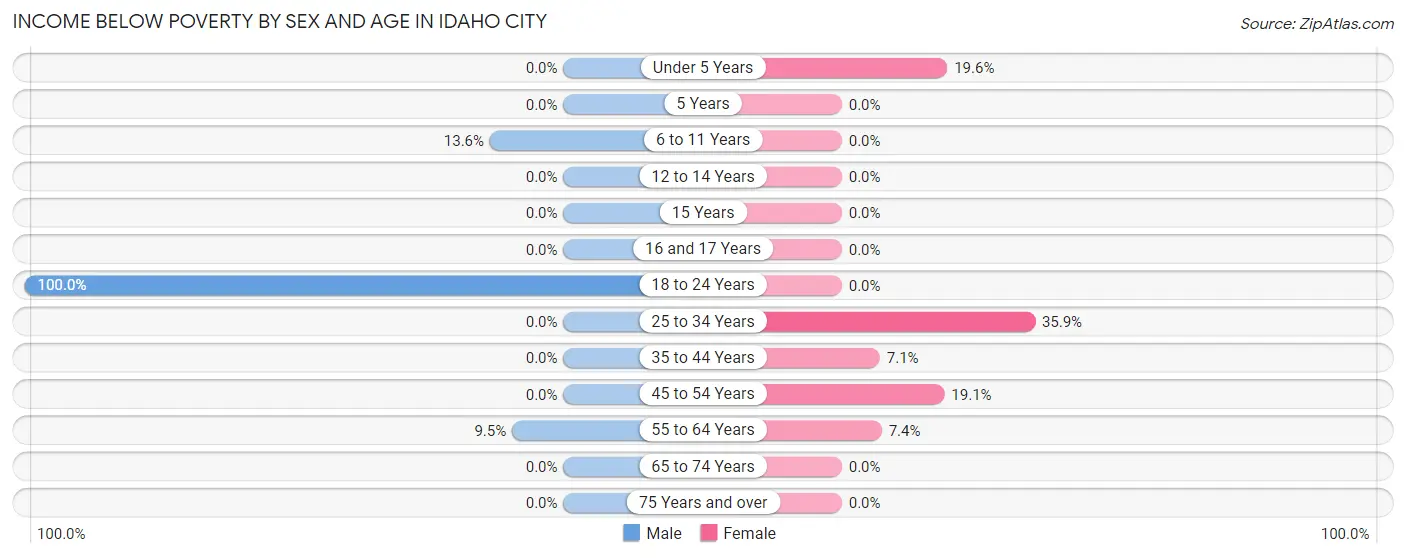
| Age Bracket | Male | Female |
| Under 5 Years | 0 (0.0%) | 9 (19.6%) |
| 5 Years | 0 (0.0%) | 0 (0.0%) |
| 6 to 11 Years | 3 (13.6%) | 0 (0.0%) |
| 12 to 14 Years | 0 (0.0%) | 0 (0.0%) |
| 15 Years | 0 (0.0%) | 0 (0.0%) |
| 16 and 17 Years | 0 (0.0%) | 0 (0.0%) |
| 18 to 24 Years | 1 (100.0%) | 0 (0.0%) |
| 25 to 34 Years | 0 (0.0%) | 19 (35.8%) |
| 35 to 44 Years | 0 (0.0%) | 6 (7.1%) |
| 45 to 54 Years | 0 (0.0%) | 4 (19.1%) |
| 55 to 64 Years | 2 (9.5%) | 2 (7.4%) |
| 65 to 74 Years | 0 (0.0%) | 0 (0.0%) |
| 75 Years and over | 0 (0.0%) | 0 (0.0%) |
| Total | 6 (1.9%) | 40 (11.0%) |
Income Above Poverty by Sex and Age in Idaho City
According to the poverty statistics in Idaho City, males aged under 5 years and females aged 5 years are the age groups that are most secure financially, with 100.0% of males and 100.0% of females in these age groups living above the poverty line.
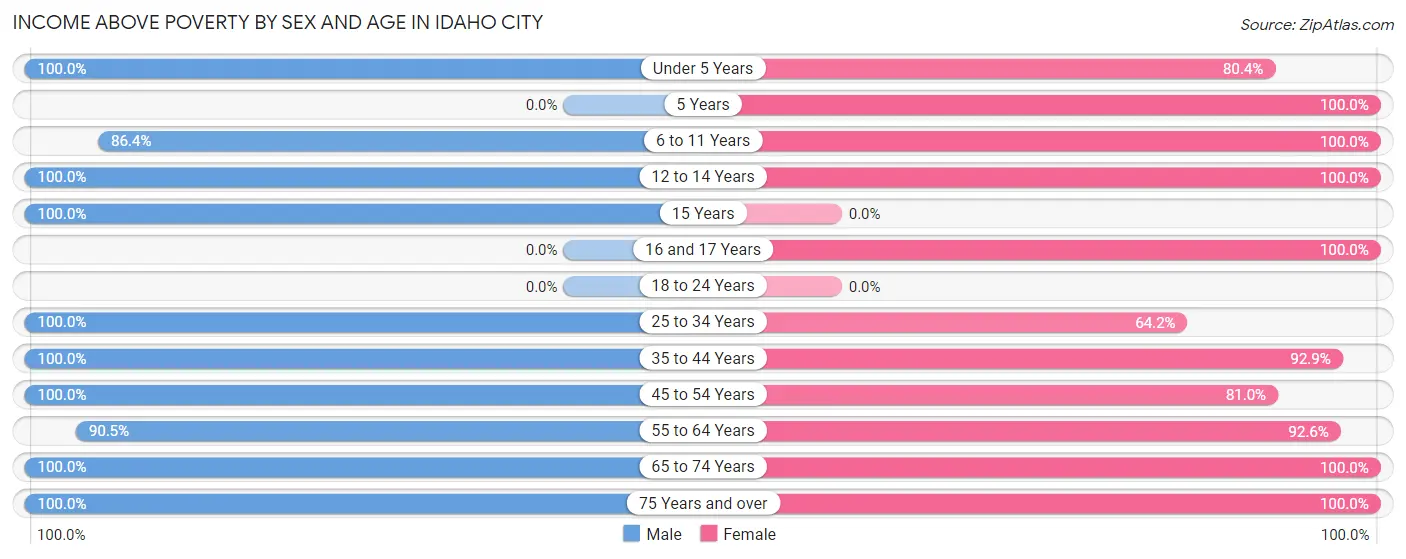
| Age Bracket | Male | Female |
| Under 5 Years | 17 (100.0%) | 37 (80.4%) |
| 5 Years | 0 (0.0%) | 25 (100.0%) |
| 6 to 11 Years | 19 (86.4%) | 34 (100.0%) |
| 12 to 14 Years | 3 (100.0%) | 12 (100.0%) |
| 15 Years | 9 (100.0%) | 0 (0.0%) |
| 16 and 17 Years | 0 (0.0%) | 10 (100.0%) |
| 18 to 24 Years | 0 (0.0%) | 0 (0.0%) |
| 25 to 34 Years | 44 (100.0%) | 34 (64.1%) |
| 35 to 44 Years | 57 (100.0%) | 79 (92.9%) |
| 45 to 54 Years | 47 (100.0%) | 17 (80.9%) |
| 55 to 64 Years | 19 (90.5%) | 25 (92.6%) |
| 65 to 74 Years | 39 (100.0%) | 14 (100.0%) |
| 75 Years and over | 49 (100.0%) | 37 (100.0%) |
| Total | 303 (98.1%) | 324 (89.0%) |
Income Below Poverty Among Married-Couple Families in Idaho City
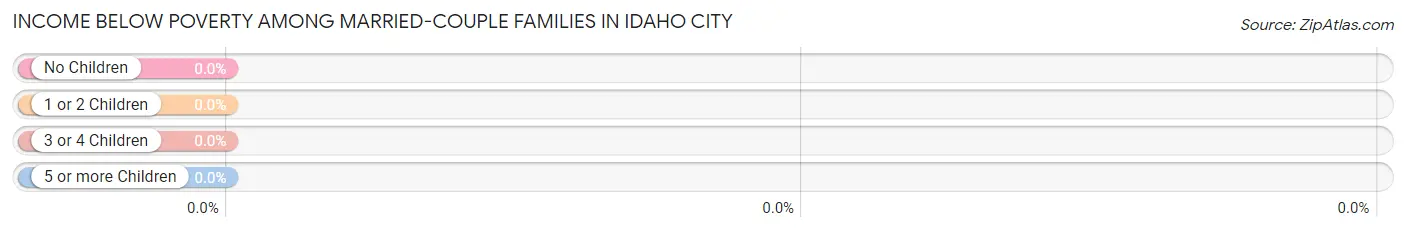
| Children | Above Poverty | Below Poverty |
| No Children | 85 (100.0%) | 0 (0.0%) |
| 1 or 2 Children | 79 (100.0%) | 0 (0.0%) |
| 3 or 4 Children | 24 (100.0%) | 0 (0.0%) |
| 5 or more Children | 0 (0.0%) | 0 (0.0%) |
| Total | 188 (100.0%) | 0 (0.0%) |
Income Below Poverty Among Single-Parent Households in Idaho City
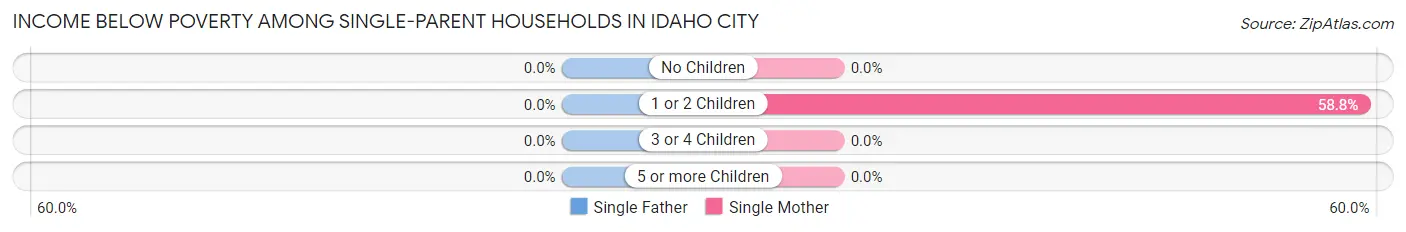
| Children | Single Father | Single Mother |
| No Children | 0 (0.0%) | 0 (0.0%) |
| 1 or 2 Children | 0 (0.0%) | 10 (58.8%) |
| 3 or 4 Children | 0 (0.0%) | 0 (0.0%) |
| 5 or more Children | 0 (0.0%) | 0 (0.0%) |
| Total | 0 (0.0%) | 10 (50.0%) |
Income Below Poverty Among Married-Couple vs Single-Parent Households in Idaho City
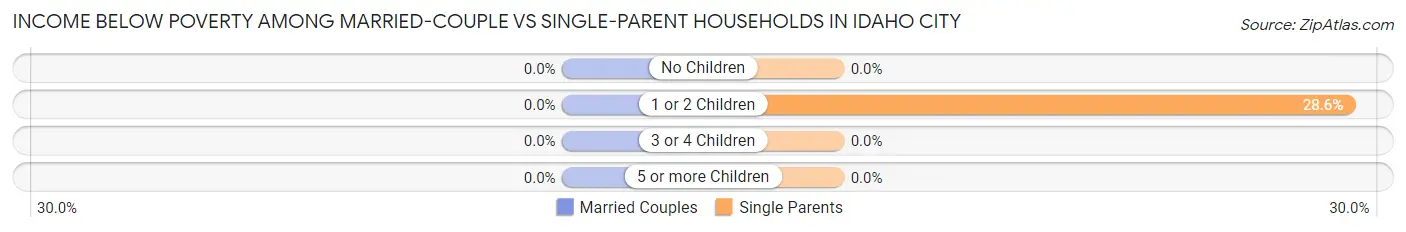
| Children | Married-Couple Families | Single-Parent Households |
| No Children | 0 (0.0%) | 0 (0.0%) |
| 1 or 2 Children | 0 (0.0%) | 10 (28.6%) |
| 3 or 4 Children | 0 (0.0%) | 0 (0.0%) |
| 5 or more Children | 0 (0.0%) | 0 (0.0%) |
| Total | 0 (0.0%) | 10 (26.3%) |
Race in Idaho City
The most populous races in Idaho City are White / Caucasian (610 | 90.6%), Hispanic or Latino (54 | 8.0%), and Two or more Races (44 | 6.5%).
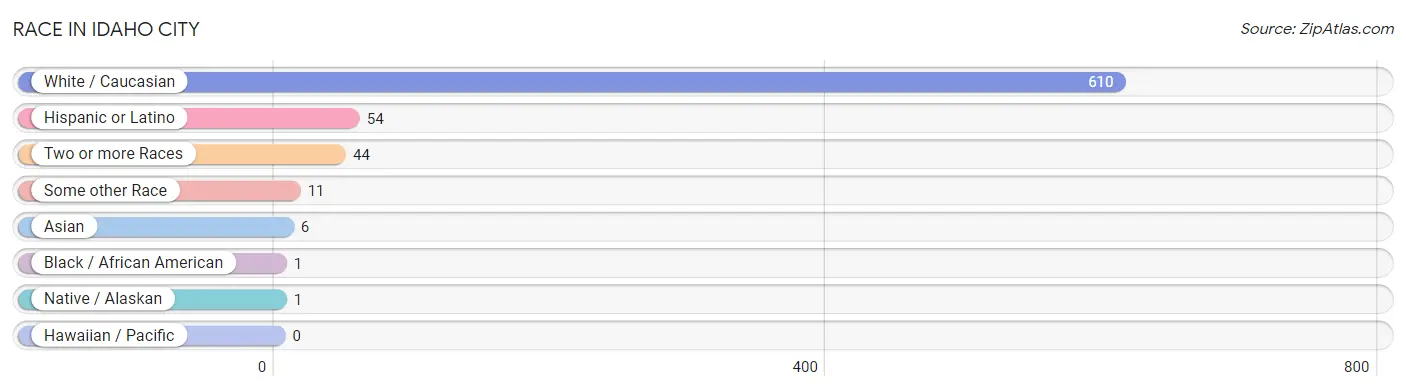
| Race | # Population | % Population |
| Asian | 6 | 0.9% |
| Black / African American | 1 | 0.2% |
| Hawaiian / Pacific | 0 | 0.0% |
| Hispanic or Latino | 54 | 8.0% |
| Native / Alaskan | 1 | 0.2% |
| White / Caucasian | 610 | 90.6% |
| Two or more Races | 44 | 6.5% |
| Some other Race | 11 | 1.6% |
| Total | 673 | 100.0% |
Ancestry in Idaho City
The most populous ancestries reported in Idaho City are German (146 | 21.7%), English (84 | 12.5%), American (69 | 10.2%), Scottish (63 | 9.4%), and Mexican (53 | 7.9%), together accounting for 61.7% of all Idaho City residents.
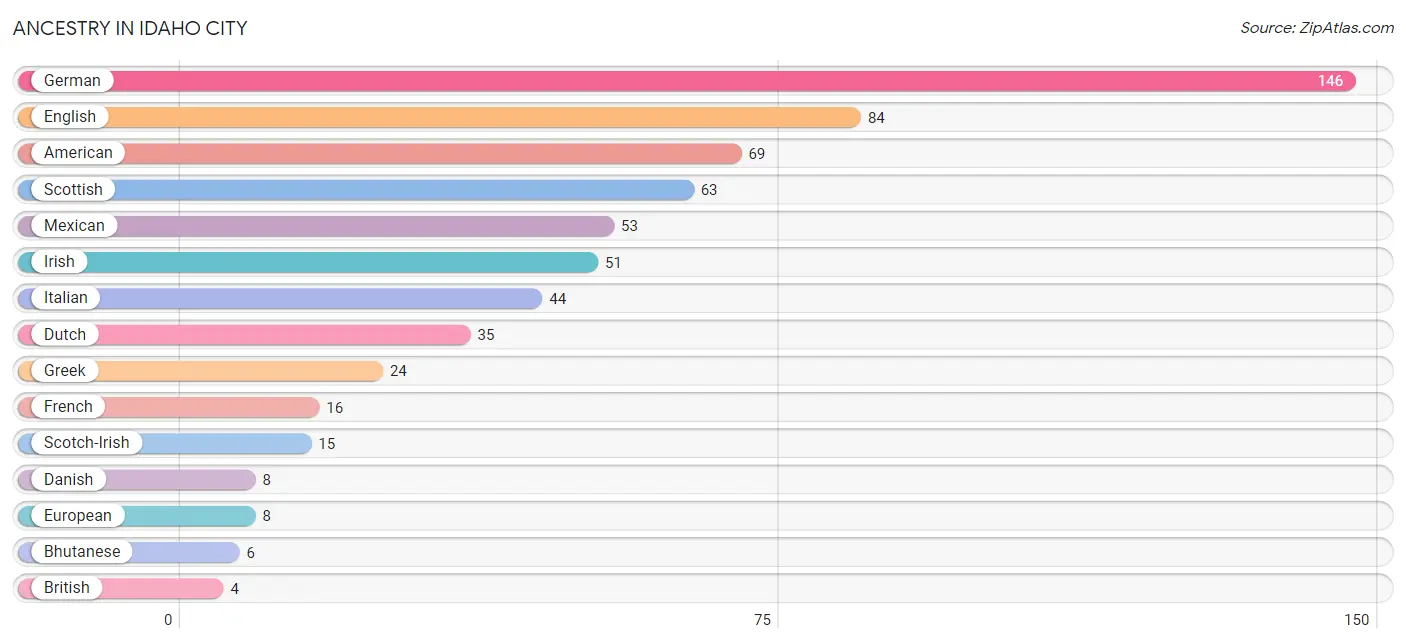
| Ancestry | # Population | % Population |
| African | 1 | 0.2% |
| American | 69 | 10.2% |
| Bhutanese | 6 | 0.9% |
| British | 4 | 0.6% |
| Danish | 8 | 1.2% |
| Dutch | 35 | 5.2% |
| Eastern European | 4 | 0.6% |
| English | 84 | 12.5% |
| European | 8 | 1.2% |
| French | 16 | 2.4% |
| German | 146 | 21.7% |
| Greek | 24 | 3.6% |
| Irish | 51 | 7.6% |
| Italian | 44 | 6.5% |
| Mexican | 53 | 7.9% |
| Polish | 1 | 0.2% |
| Scandinavian | 2 | 0.3% |
| Scotch-Irish | 15 | 2.2% |
| Scottish | 63 | 9.4% |
| Subsaharan African | 1 | 0.2% | View All 20 Rows |
Immigrants in Idaho City
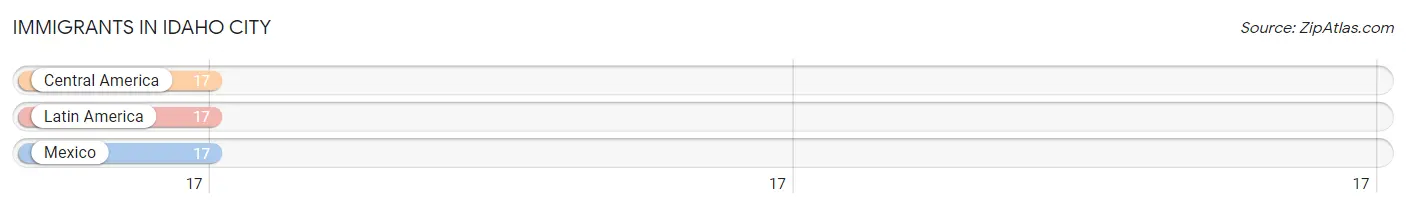
The most numerous immigrant groups reported in Idaho City came from Central America (17 | 2.5%), Latin America (17 | 2.5%), and Mexico (17 | 2.5%), together accounting for 7.6% of all Idaho City residents.
| Immigration Origin | # Population | % Population |
| Central America | 17 | 2.5% |
| Latin America | 17 | 2.5% |
| Mexico | 17 | 2.5% | View All 3 Rows |
Sex and Age in Idaho City
Sex and Age in Idaho City
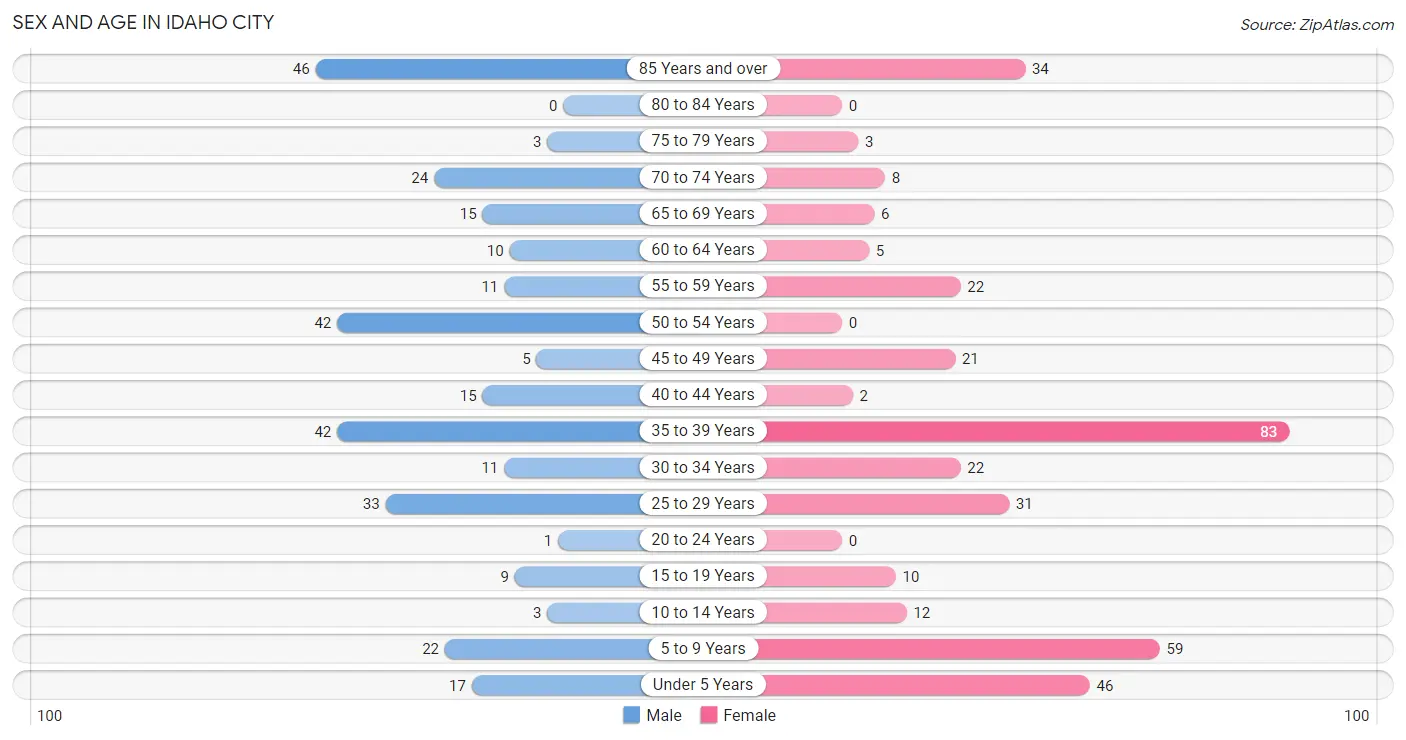
The most populous age groups in Idaho City are 85 Years and over (46 | 14.9%) for men and 35 to 39 Years (83 | 22.8%) for women.
| Age Bracket | Male | Female |
| Under 5 Years | 17 (5.5%) | 46 (12.6%) |
| 5 to 9 Years | 22 (7.1%) | 59 (16.2%) |
| 10 to 14 Years | 3 (1.0%) | 12 (3.3%) |
| 15 to 19 Years | 9 (2.9%) | 10 (2.8%) |
| 20 to 24 Years | 1 (0.3%) | 0 (0.0%) |
| 25 to 29 Years | 33 (10.7%) | 31 (8.5%) |
| 30 to 34 Years | 11 (3.6%) | 22 (6.0%) |
| 35 to 39 Years | 42 (13.6%) | 83 (22.8%) |
| 40 to 44 Years | 15 (4.9%) | 2 (0.5%) |
| 45 to 49 Years | 5 (1.6%) | 21 (5.8%) |
| 50 to 54 Years | 42 (13.6%) | 0 (0.0%) |
| 55 to 59 Years | 11 (3.6%) | 22 (6.0%) |
| 60 to 64 Years | 10 (3.2%) | 5 (1.4%) |
| 65 to 69 Years | 15 (4.9%) | 6 (1.7%) |
| 70 to 74 Years | 24 (7.8%) | 8 (2.2%) |
| 75 to 79 Years | 3 (1.0%) | 3 (0.8%) |
| 80 to 84 Years | 0 (0.0%) | 0 (0.0%) |
| 85 Years and over | 46 (14.9%) | 34 (9.3%) |
| Total | 309 (100.0%) | 364 (100.0%) |
Families and Households in Idaho City
Median Family Size in Idaho City
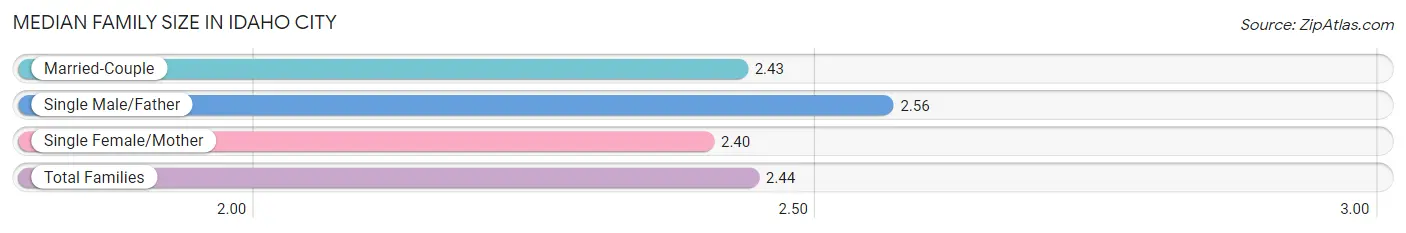
The median family size in Idaho City is 2.44 persons per family, with single male/father families (18 | 8.0%) accounting for the largest median family size of 2.56 persons per family. On the other hand, single female/mother families (20 | 8.8%) represent the smallest median family size with 2.40 persons per family.
| Family Type | # Families | Family Size |
| Married-Couple | 188 (83.2%) | 2.43 |
| Single Male/Father | 18 (8.0%) | 2.56 |
| Single Female/Mother | 20 (8.8%) | 2.40 |
| Total Families | 226 (100.0%) | 2.44 |
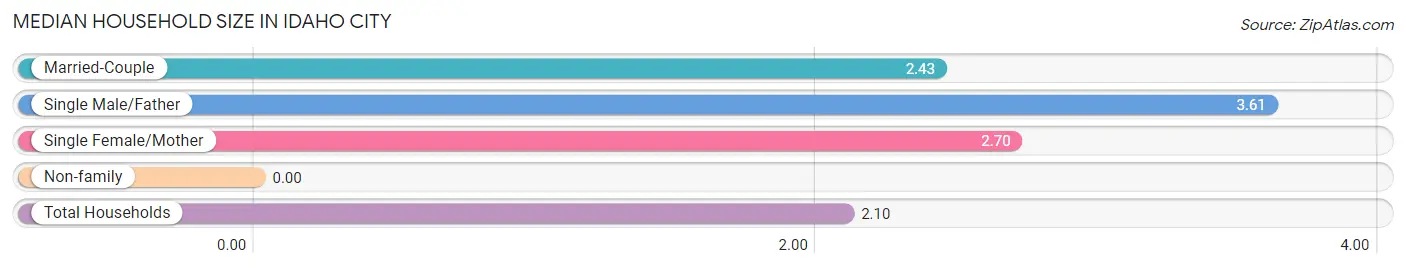
Median Household Size in Idaho City
| Household Type | # Households | Household Size |
| Married-Couple | 188 (58.9%) | 2.43 |
| Single Male/Father | 18 (5.6%) | 3.61 |
| Single Female/Mother | 20 (6.3%) | 2.70 |
| Non-family | 93 (29.1%) | - |
| Total Households | 319 (100.0%) | 2.10 |
Household Size by Marriage Status in Idaho City
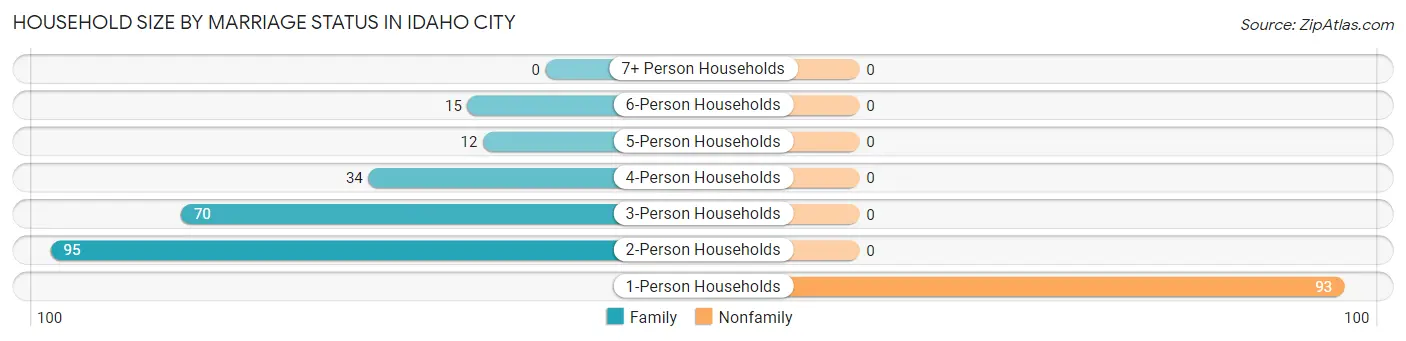
Out of a total of 319 households in Idaho City, 226 (70.9%) are family households, while 93 (29.1%) are nonfamily households. The most numerous type of family households are 2-person households, comprising 95, and the most common type of nonfamily households are 1-person households, comprising 93.
| Household Size | Family Households | Nonfamily Households |
| 1-Person Households | - | 93 (29.1%) |
| 2-Person Households | 95 (29.8%) | 0 (0.0%) |
| 3-Person Households | 70 (21.9%) | 0 (0.0%) |
| 4-Person Households | 34 (10.7%) | 0 (0.0%) |
| 5-Person Households | 12 (3.8%) | 0 (0.0%) |
| 6-Person Households | 15 (4.7%) | 0 (0.0%) |
| 7+ Person Households | 0 (0.0%) | 0 (0.0%) |
| Total | 226 (70.9%) | 93 (29.1%) |
Female Fertility in Idaho City
Fertility by Age in Idaho City
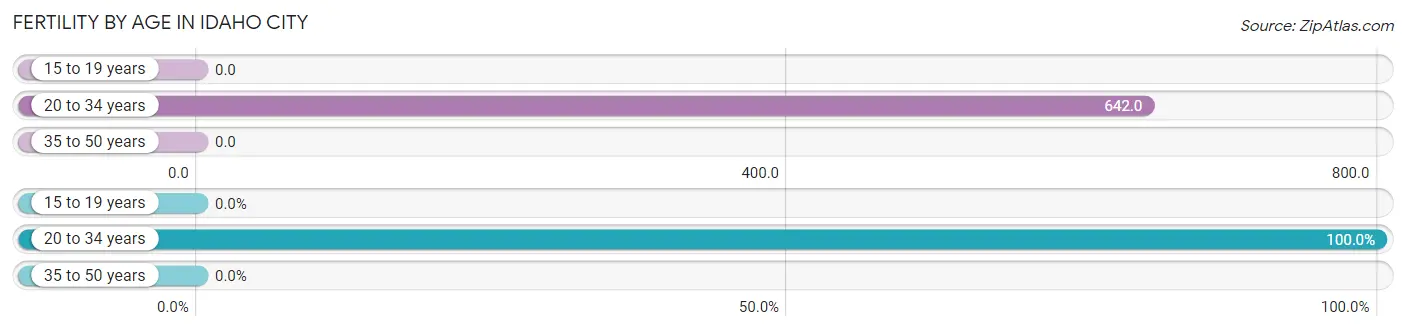
Average fertility rate in Idaho City is 201.0 births per 1,000 women. Women in the age bracket of 20 to 34 years have the highest fertility rate with 642.0 births per 1,000 women. Women in the age bracket of 20 to 34 years acount for 100.0% of all women with births.
| Age Bracket | Women with Births | Births / 1,000 Women |
| 15 to 19 years | 0 (0.0%) | 0.0 |
| 20 to 34 years | 34 (100.0%) | 642.0 |
| 35 to 50 years | 0 (0.0%) | 0.0 |
| Total | 34 (100.0%) | 201.0 |
Fertility by Age by Marriage Status in Idaho City
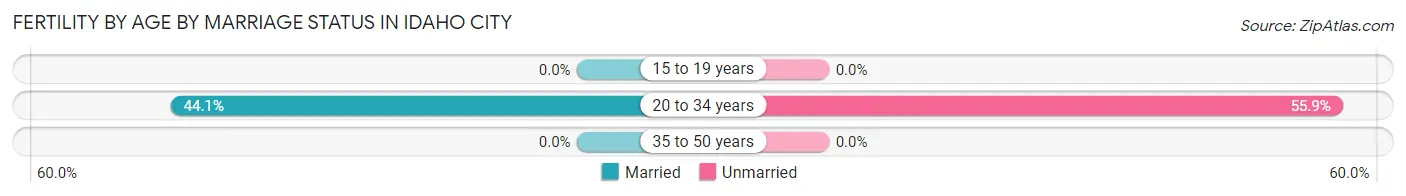
44.1% of women with births (34) in Idaho City are married. The highest percentage of unmarried women with births falls into 20 to 34 years age bracket with 55.9% of them unmarried at the time of birth, while the lowest percentage of unmarried women with births belong to 20 to 34 years age bracket with 55.9% of them unmarried.
| Age Bracket | Married | Unmarried |
| 15 to 19 years | 0 (0.0%) | 0 (0.0%) |
| 20 to 34 years | 15 (44.1%) | 19 (55.9%) |
| 35 to 50 years | 0 (0.0%) | 0 (0.0%) |
| Total | 15 (44.1%) | 19 (55.9%) |
Fertility by Education in Idaho City
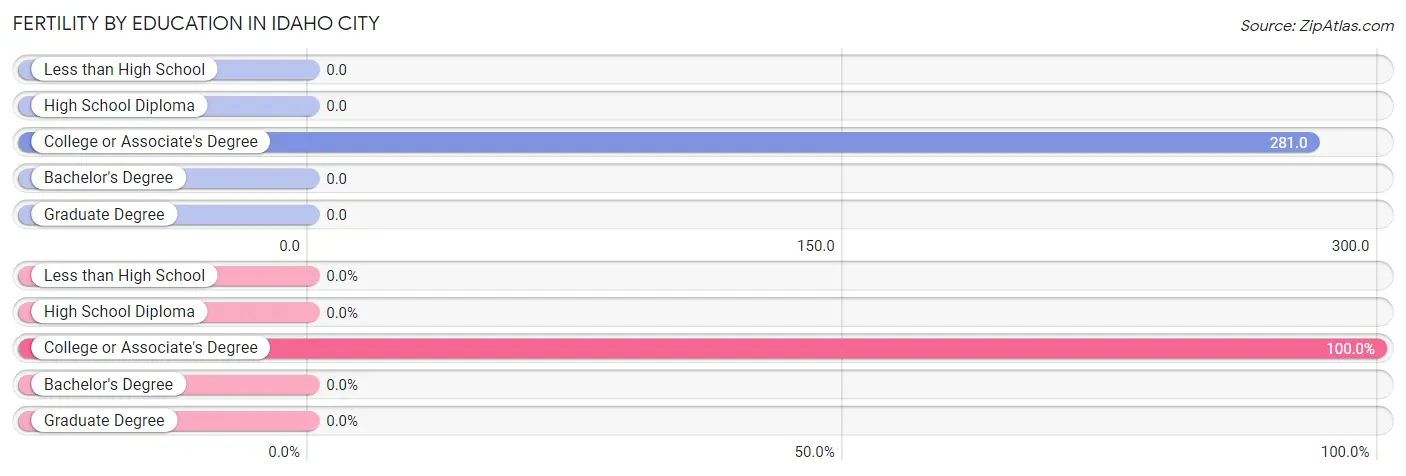
| Educational Attainment | Women with Births | Births / 1,000 Women |
| Less than High School | 0 (0.0%) | 0.0 |
| High School Diploma | 0 (0.0%) | 0.0 |
| College or Associate's Degree | 34 (100.0%) | 281.0 |
| Bachelor's Degree | 0 (0.0%) | 0.0 |
| Graduate Degree | 0 (0.0%) | 0.0 |
| Total | 34 (100.0%) | 201.0 |
Fertility by Education by Marriage Status in Idaho City
55.9% of women with births in Idaho City are unmarried. Women with the educational attainment of college or associate's degree are most likely to be married with 44.1% of them married at childbirth, while women with the educational attainment of college or associate's degree are least likely to be married with 55.9% of them unmarried at childbirth.
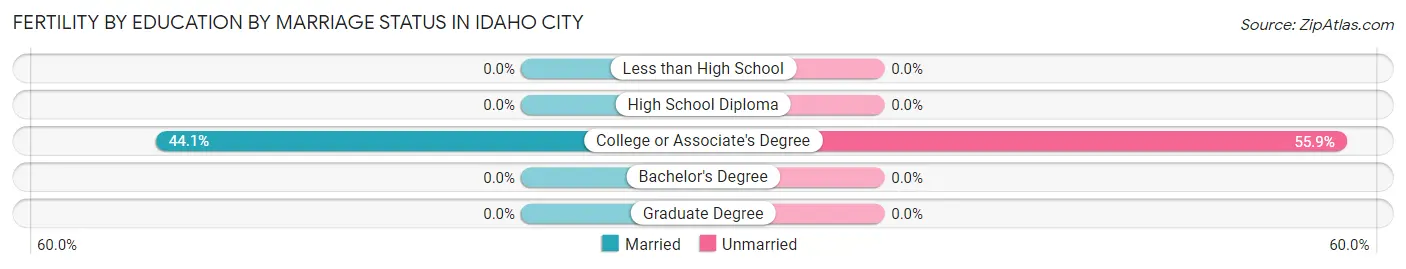
| Educational Attainment | Married | Unmarried |
| Less than High School | 0 (0.0%) | 0 (0.0%) |
| High School Diploma | 0 (0.0%) | 0 (0.0%) |
| College or Associate's Degree | 15 (44.1%) | 19 (55.9%) |
| Bachelor's Degree | 0 (0.0%) | 0 (0.0%) |
| Graduate Degree | 0 (0.0%) | 0 (0.0%) |
| Total | 15 (44.1%) | 19 (55.9%) |
Employment Characteristics in Idaho City
Employment by Class of Employer in Idaho City
Among the 223 employed individuals in Idaho City, private company employees (140 | 62.8%), local government employees (55 | 24.7%), and federal government employees (15 | 6.7%) make up the most common classes of employment.
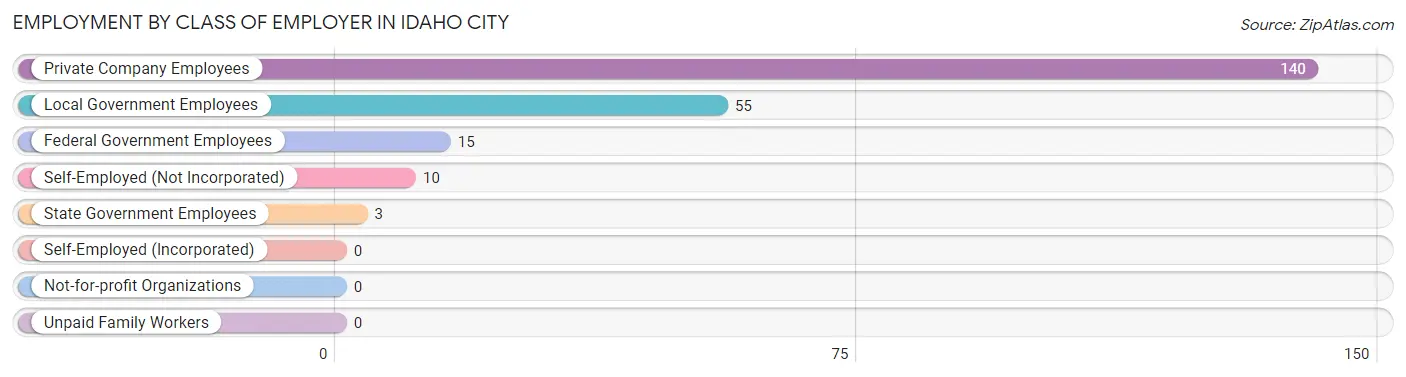
| Employer Class | # Employees | % Employees |
| Private Company Employees | 140 | 62.8% |
| Self-Employed (Incorporated) | 0 | 0.0% |
| Self-Employed (Not Incorporated) | 10 | 4.5% |
| Not-for-profit Organizations | 0 | 0.0% |
| Local Government Employees | 55 | 24.7% |
| State Government Employees | 3 | 1.3% |
| Federal Government Employees | 15 | 6.7% |
| Unpaid Family Workers | 0 | 0.0% |
| Total | 223 | 100.0% |
Employment Status by Age in Idaho City
According to the labor force statistics for Idaho City, out of the total population over 16 years of age (505), 62.4% or 315 individuals are in the labor force, with 6.0% or 19 of them unemployed. The age group with the highest labor force participation rate is 16 to 19 years, with 100.0% or 10 individuals in the labor force. Within the labor force, the 25 to 29 years age range has the highest percentage of unemployed individuals, with 40.0% or 18 of them being unemployed.
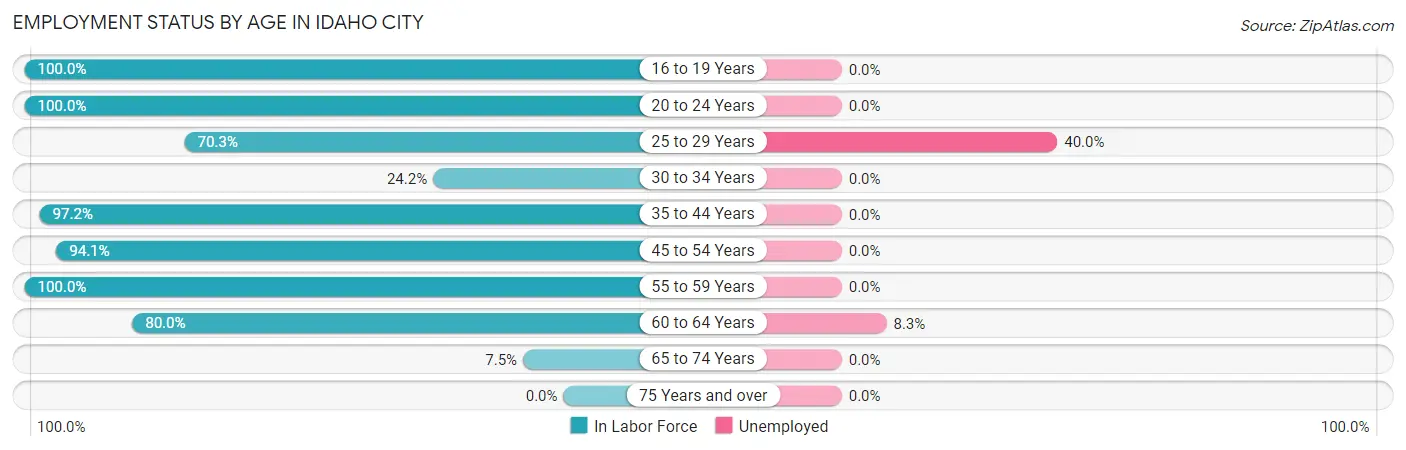
| Age Bracket | In Labor Force | Unemployed |
| 16 to 19 Years | 10 (100.0%) | 0 (0.0%) |
| 20 to 24 Years | 1 (100.0%) | 0 (0.0%) |
| 25 to 29 Years | 45 (70.3%) | 18 (40.0%) |
| 30 to 34 Years | 8 (24.2%) | 0 (0.0%) |
| 35 to 44 Years | 138 (97.2%) | 0 (0.0%) |
| 45 to 54 Years | 64 (94.1%) | 0 (0.0%) |
| 55 to 59 Years | 33 (100.0%) | 0 (0.0%) |
| 60 to 64 Years | 12 (80.0%) | 1 (8.3%) |
| 65 to 74 Years | 4 (7.5%) | 0 (0.0%) |
| 75 Years and over | 0 (0.0%) | 0 (0.0%) |
| Total | 315 (62.4%) | 19 (6.0%) |
Employment Status by Educational Attainment in Idaho City
According to labor force statistics for Idaho City, 84.5% of individuals (300) out of the total population between 25 and 64 years of age (355) are in the labor force, with 6.3% or 19 of them being unemployed. The group with the highest labor force participation rate are those with the educational attainment of less than high school, with 100.0% or 24 individuals in the labor force. Within the labor force, individuals with high school diploma education have the highest percentage of unemployment, with 27.1% or 19 of them being unemployed.
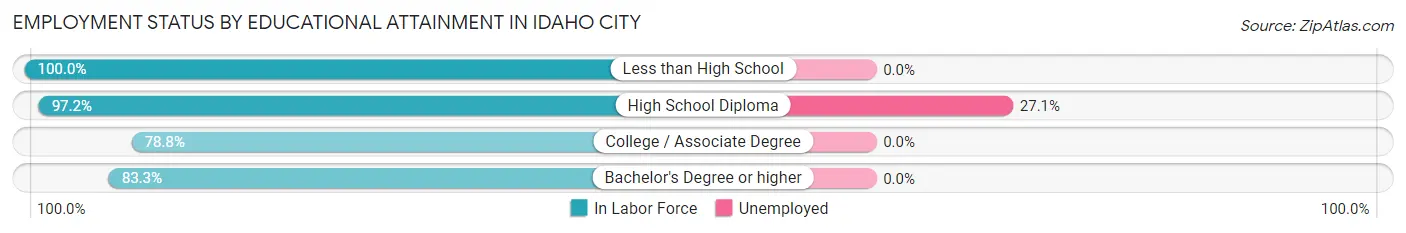
| Educational Attainment | In Labor Force | Unemployed |
| Less than High School | 24 (100.0%) | 0 (0.0%) |
| High School Diploma | 70 (97.2%) | 20 (27.1%) |
| College / Associate Degree | 171 (78.8%) | 0 (0.0%) |
| Bachelor's Degree or higher | 35 (83.3%) | 0 (0.0%) |
| Total | 300 (84.5%) | 22 (6.3%) |
Employment Occupations by Sex in Idaho City
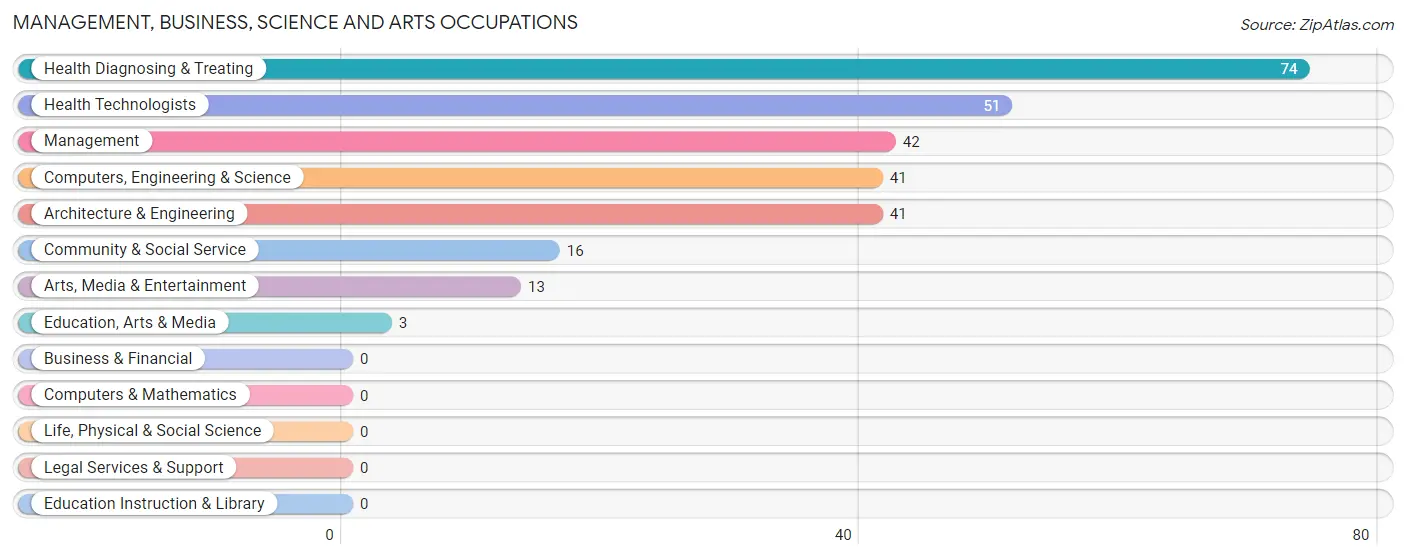
Management, Business, Science and Arts Occupations
The most common Management, Business, Science and Arts occupations in Idaho City are Health Diagnosing & Treating (74 | 25.0%), Health Technologists (51 | 17.2%), Management (42 | 14.2%), Computers, Engineering & Science (41 | 13.9%), and Architecture & Engineering (41 | 13.9%).
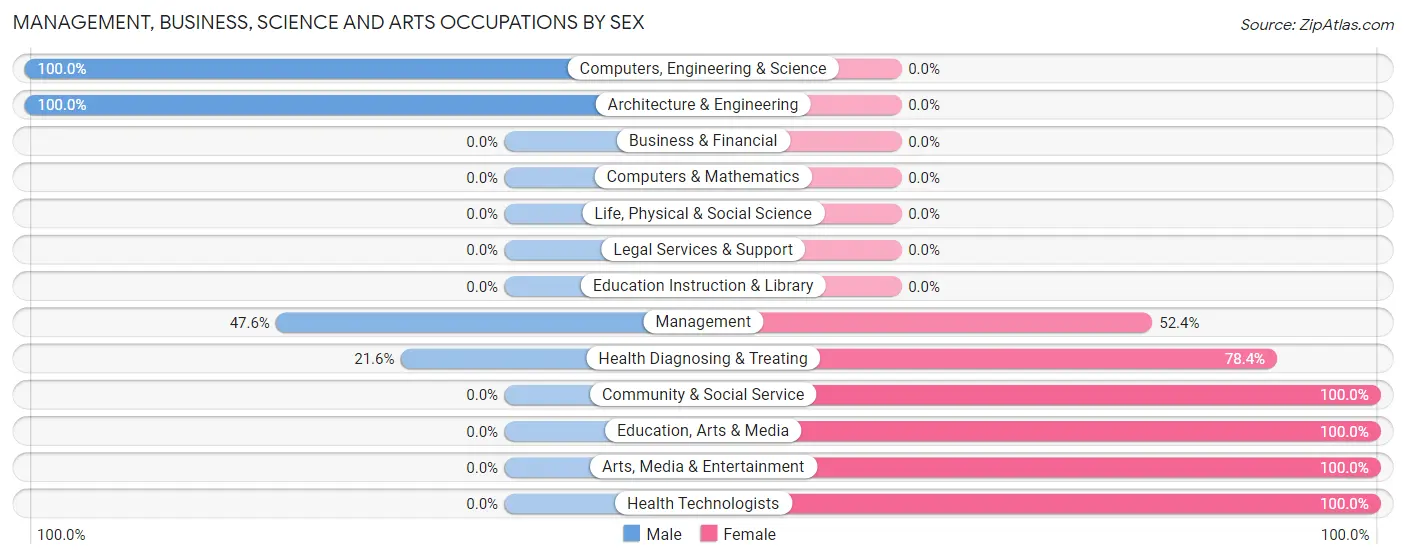
Management, Business, Science and Arts Occupations by Sex
Within the Management, Business, Science and Arts occupations in Idaho City, the most male-oriented occupations are Computers, Engineering & Science (100.0%), Architecture & Engineering (100.0%), and Management (47.6%), while the most female-oriented occupations are Community & Social Service (100.0%), Education, Arts & Media (100.0%), and Arts, Media & Entertainment (100.0%).
| Occupation | Male | Female |
| Management | 20 (47.6%) | 22 (52.4%) |
| Business & Financial | 0 (0.0%) | 0 (0.0%) |
| Computers, Engineering & Science | 41 (100.0%) | 0 (0.0%) |
| Computers & Mathematics | 0 (0.0%) | 0 (0.0%) |
| Architecture & Engineering | 41 (100.0%) | 0 (0.0%) |
| Life, Physical & Social Science | 0 (0.0%) | 0 (0.0%) |
| Community & Social Service | 0 (0.0%) | 16 (100.0%) |
| Education, Arts & Media | 0 (0.0%) | 3 (100.0%) |
| Legal Services & Support | 0 (0.0%) | 0 (0.0%) |
| Education Instruction & Library | 0 (0.0%) | 0 (0.0%) |
| Arts, Media & Entertainment | 0 (0.0%) | 13 (100.0%) |
| Health Diagnosing & Treating | 16 (21.6%) | 58 (78.4%) |
| Health Technologists | 0 (0.0%) | 51 (100.0%) |
| Total (Category) | 77 (44.5%) | 96 (55.5%) |
| Total (Overall) | 141 (47.6%) | 155 (52.4%) |
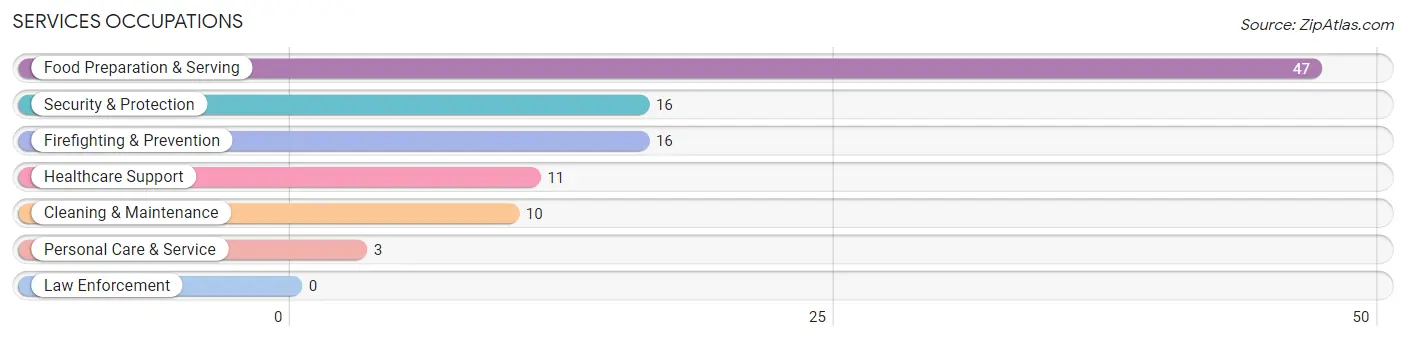
Services Occupations
The most common Services occupations in Idaho City are Food Preparation & Serving (47 | 15.9%), Security & Protection (16 | 5.4%), Firefighting & Prevention (16 | 5.4%), Healthcare Support (11 | 3.7%), and Cleaning & Maintenance (10 | 3.4%).
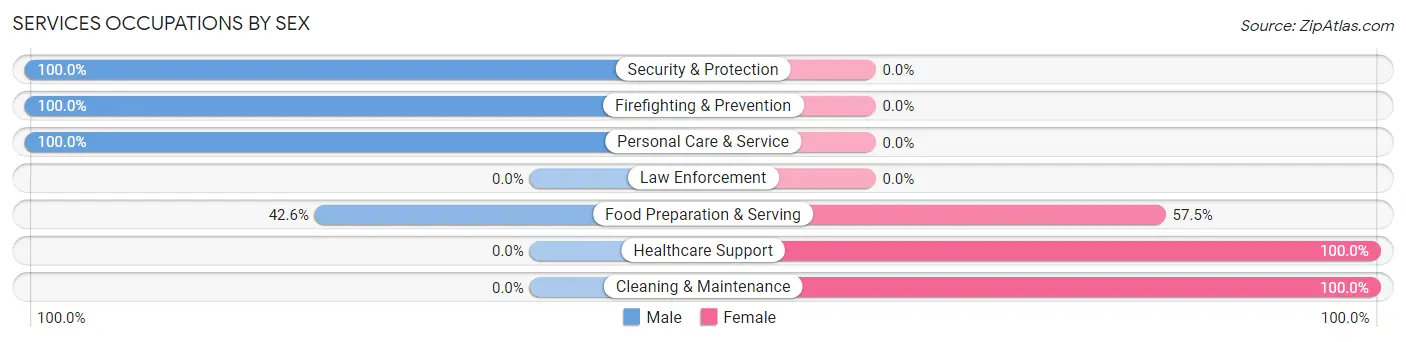
Services Occupations by Sex
Within the Services occupations in Idaho City, the most male-oriented occupations are Security & Protection (100.0%), Firefighting & Prevention (100.0%), and Personal Care & Service (100.0%), while the most female-oriented occupations are Healthcare Support (100.0%), Cleaning & Maintenance (100.0%), and Food Preparation & Serving (57.5%).
| Occupation | Male | Female |
| Healthcare Support | 0 (0.0%) | 11 (100.0%) |
| Security & Protection | 16 (100.0%) | 0 (0.0%) |
| Firefighting & Prevention | 16 (100.0%) | 0 (0.0%) |
| Law Enforcement | 0 (0.0%) | 0 (0.0%) |
| Food Preparation & Serving | 20 (42.5%) | 27 (57.5%) |
| Cleaning & Maintenance | 0 (0.0%) | 10 (100.0%) |
| Personal Care & Service | 3 (100.0%) | 0 (0.0%) |
| Total (Category) | 39 (44.8%) | 48 (55.2%) |
| Total (Overall) | 141 (47.6%) | 155 (52.4%) |
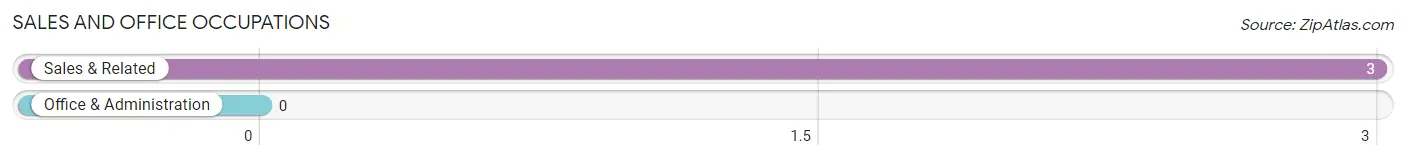
Sales and Office Occupations
The most common Sales and Office occupations in Idaho City are , and Sales & Related (3 | 1.0%).
Sales and Office Occupations by Sex
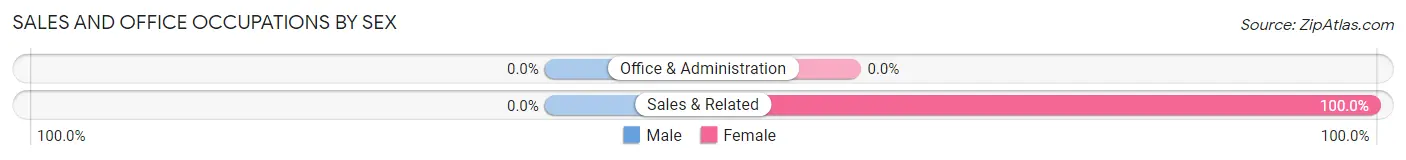
| Occupation | Male | Female |
| Sales & Related | 0 (0.0%) | 3 (100.0%) |
| Office & Administration | 0 (0.0%) | 0 (0.0%) |
| Total (Category) | 0 (0.0%) | 3 (100.0%) |
| Total (Overall) | 141 (47.6%) | 155 (52.4%) |
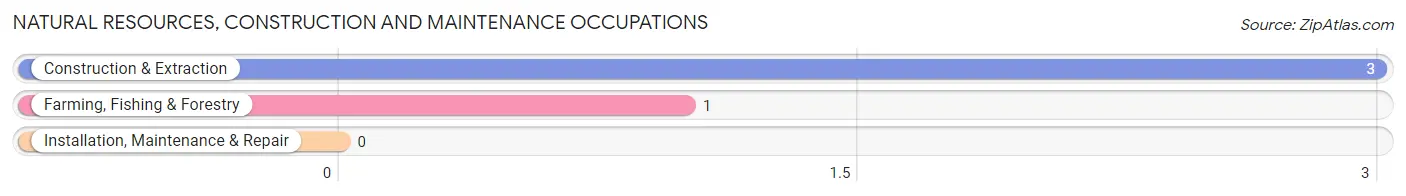
Natural Resources, Construction and Maintenance Occupations
The most common Natural Resources, Construction and Maintenance occupations in Idaho City are Construction & Extraction (3 | 1.0%), and Farming, Fishing & Forestry (1 | 0.3%).
Natural Resources, Construction and Maintenance Occupations by Sex
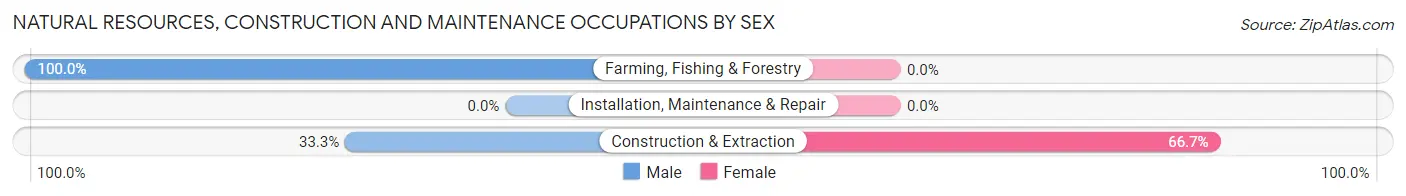
| Occupation | Male | Female |
| Farming, Fishing & Forestry | 1 (100.0%) | 0 (0.0%) |
| Construction & Extraction | 1 (33.3%) | 2 (66.7%) |
| Installation, Maintenance & Repair | 0 (0.0%) | 0 (0.0%) |
| Total (Category) | 2 (50.0%) | 2 (50.0%) |
| Total (Overall) | 141 (47.6%) | 155 (52.4%) |
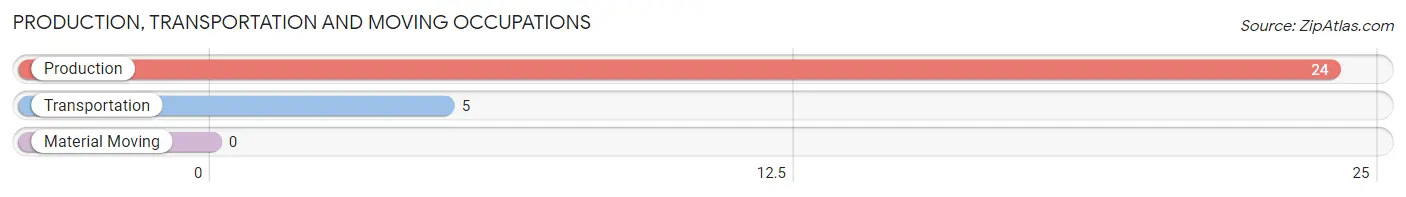
Production, Transportation and Moving Occupations
The most common Production, Transportation and Moving occupations in Idaho City are Production (24 | 8.1%), and Transportation (5 | 1.7%).
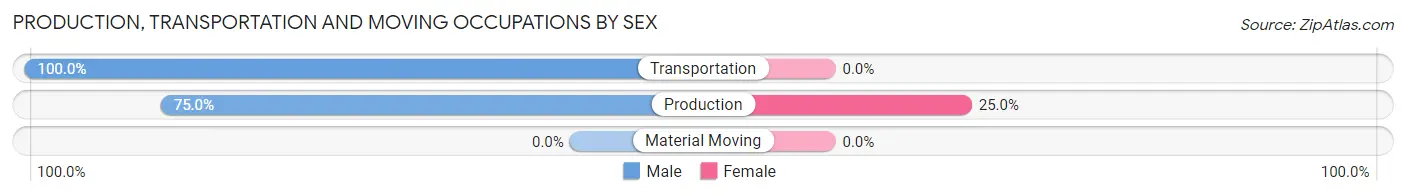
Production, Transportation and Moving Occupations by Sex
| Occupation | Male | Female |
| Production | 18 (75.0%) | 6 (25.0%) |
| Transportation | 5 (100.0%) | 0 (0.0%) |
| Material Moving | 0 (0.0%) | 0 (0.0%) |
| Total (Category) | 23 (79.3%) | 6 (20.7%) |
| Total (Overall) | 141 (47.6%) | 155 (52.4%) |
Employment Industries by Sex in Idaho City
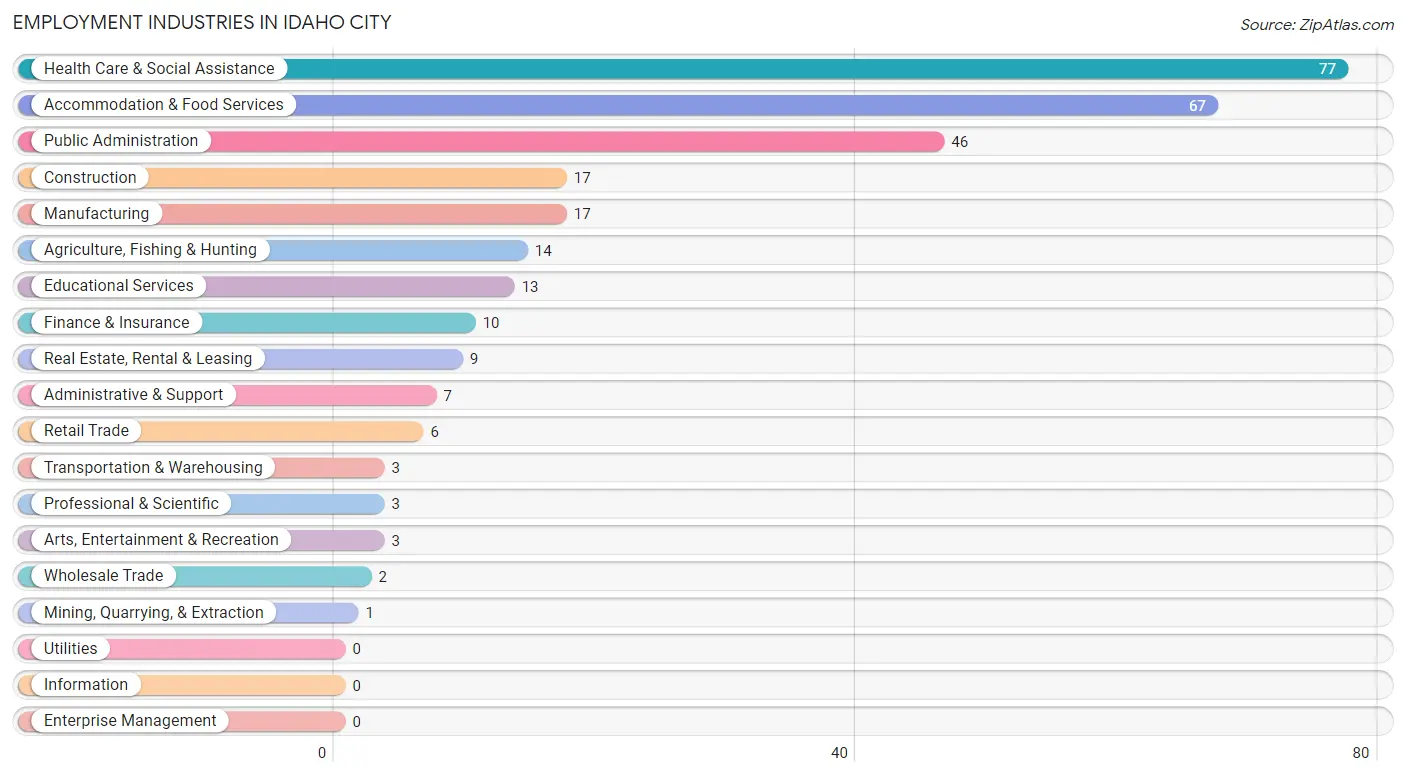
Employment Industries in Idaho City
The major employment industries in Idaho City include Health Care & Social Assistance (77 | 26.0%), Accommodation & Food Services (67 | 22.6%), Public Administration (46 | 15.5%), Construction (17 | 5.7%), and Manufacturing (17 | 5.7%).
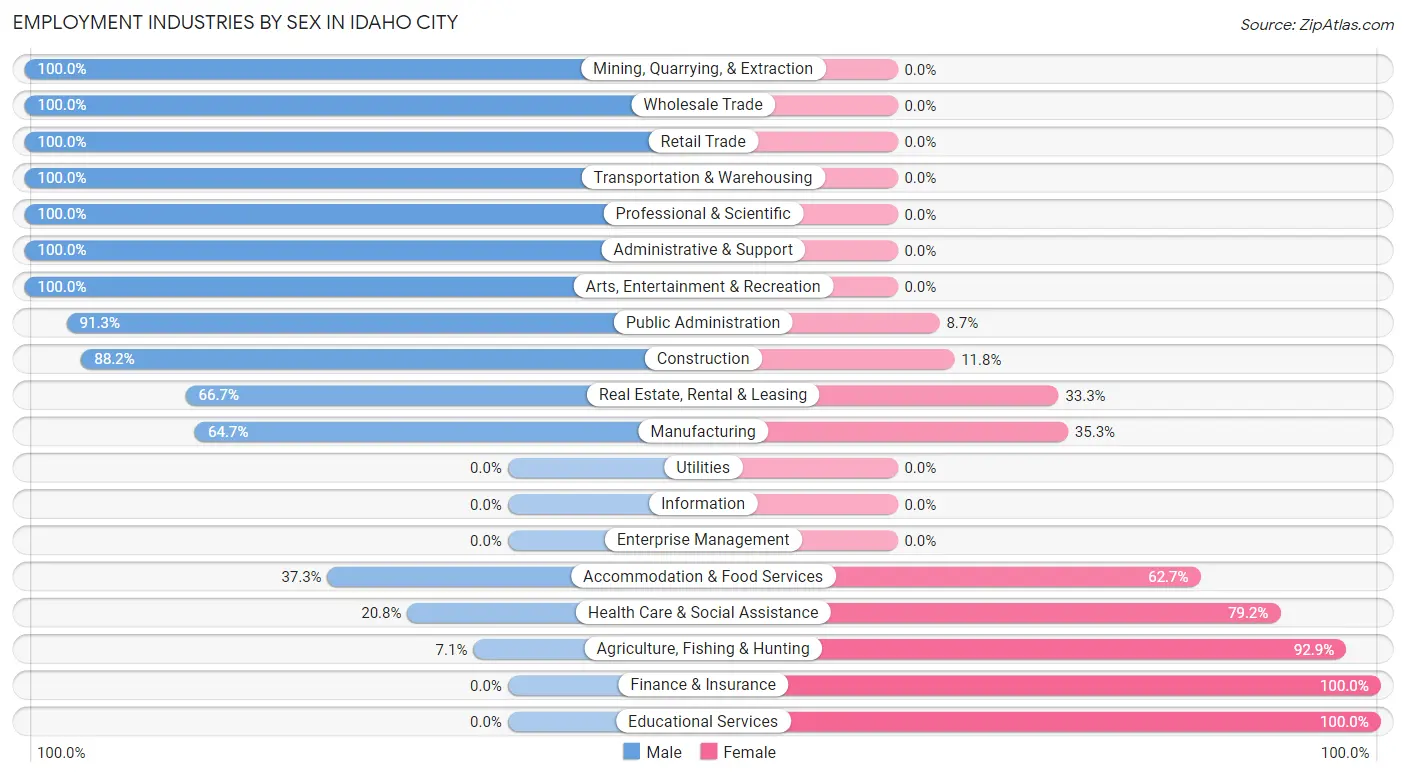
Employment Industries by Sex in Idaho City
The Idaho City industries that see more men than women are Mining, Quarrying, & Extraction (100.0%), Wholesale Trade (100.0%), and Retail Trade (100.0%), whereas the industries that tend to have a higher number of women are Finance & Insurance (100.0%), Educational Services (100.0%), and Agriculture, Fishing & Hunting (92.9%).
| Industry | Male | Female |
| Agriculture, Fishing & Hunting | 1 (7.1%) | 13 (92.9%) |
| Mining, Quarrying, & Extraction | 1 (100.0%) | 0 (0.0%) |
| Construction | 15 (88.2%) | 2 (11.8%) |
| Manufacturing | 11 (64.7%) | 6 (35.3%) |
| Wholesale Trade | 2 (100.0%) | 0 (0.0%) |
| Retail Trade | 6 (100.0%) | 0 (0.0%) |
| Transportation & Warehousing | 3 (100.0%) | 0 (0.0%) |
| Utilities | 0 (0.0%) | 0 (0.0%) |
| Information | 0 (0.0%) | 0 (0.0%) |
| Finance & Insurance | 0 (0.0%) | 10 (100.0%) |
| Real Estate, Rental & Leasing | 6 (66.7%) | 3 (33.3%) |
| Professional & Scientific | 3 (100.0%) | 0 (0.0%) |
| Enterprise Management | 0 (0.0%) | 0 (0.0%) |
| Administrative & Support | 7 (100.0%) | 0 (0.0%) |
| Educational Services | 0 (0.0%) | 13 (100.0%) |
| Health Care & Social Assistance | 16 (20.8%) | 61 (79.2%) |
| Arts, Entertainment & Recreation | 3 (100.0%) | 0 (0.0%) |
| Accommodation & Food Services | 25 (37.3%) | 42 (62.7%) |
| Public Administration | 42 (91.3%) | 4 (8.7%) |
| Total | 141 (47.6%) | 155 (52.4%) |
Education in Idaho City
School Enrollment in Idaho City
The most common levels of schooling among the 106 students in Idaho City are elementary school (43 | 40.6%), high school (19 | 17.9%), and nursery / preschool (16 | 15.1%).
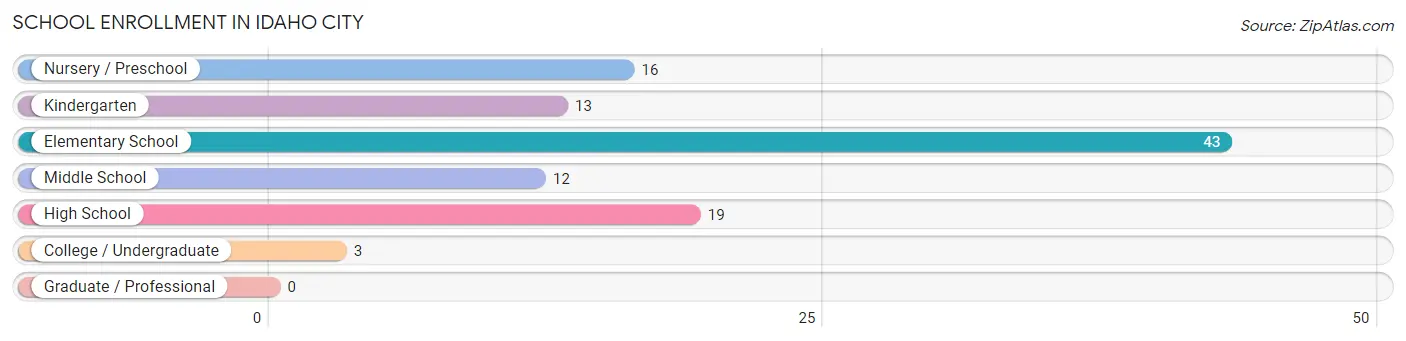
| School Level | # Students | % Students |
| Nursery / Preschool | 16 | 15.1% |
| Kindergarten | 13 | 12.3% |
| Elementary School | 43 | 40.6% |
| Middle School | 12 | 11.3% |
| High School | 19 | 17.9% |
| College / Undergraduate | 3 | 2.8% |
| Graduate / Professional | 0 | 0.0% |
| Total | 106 | 100.0% |
School Enrollment by Age by Funding Source in Idaho City
Out of a total of 106 students who are enrolled in schools in Idaho City, 10 (9.4%) attend a private institution, while the remaining 96 (90.6%) are enrolled in public schools. The age group of 15 to 17 year olds has the highest likelihood of being enrolled in private schools, with 10 (52.6% in the age bracket) enrolled. Conversely, the age group of 3 to 4 year olds has the lowest likelihood of being enrolled in a private school, with 14 (100.0% in the age bracket) attending a public institution.
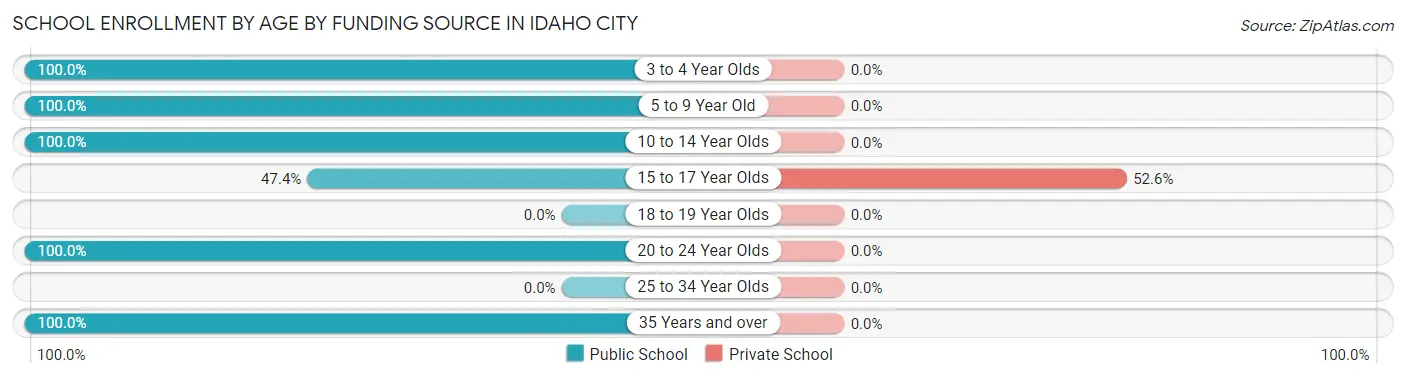
| Age Bracket | Public School | Private School |
| 3 to 4 Year Olds | 14 (100.0%) | 0 (0.0%) |
| 5 to 9 Year Old | 58 (100.0%) | 0 (0.0%) |
| 10 to 14 Year Olds | 12 (100.0%) | 0 (0.0%) |
| 15 to 17 Year Olds | 9 (47.4%) | 10 (52.6%) |
| 18 to 19 Year Olds | 0 (0.0%) | 0 (0.0%) |
| 20 to 24 Year Olds | 1 (100.0%) | 0 (0.0%) |
| 25 to 34 Year Olds | 0 (0.0%) | 0 (0.0%) |
| 35 Years and over | 2 (100.0%) | 0 (0.0%) |
| Total | 96 (90.6%) | 10 (9.4%) |
Educational Attainment by Field of Study in Idaho City
Social sciences (16 | 30.8%), bio, nature & agricultural (10 | 19.2%), science & technology (8 | 15.4%), business (8 | 15.4%), and education (7 | 13.5%) are the most common fields of study among 52 individuals in Idaho City who have obtained a bachelor's degree or higher.
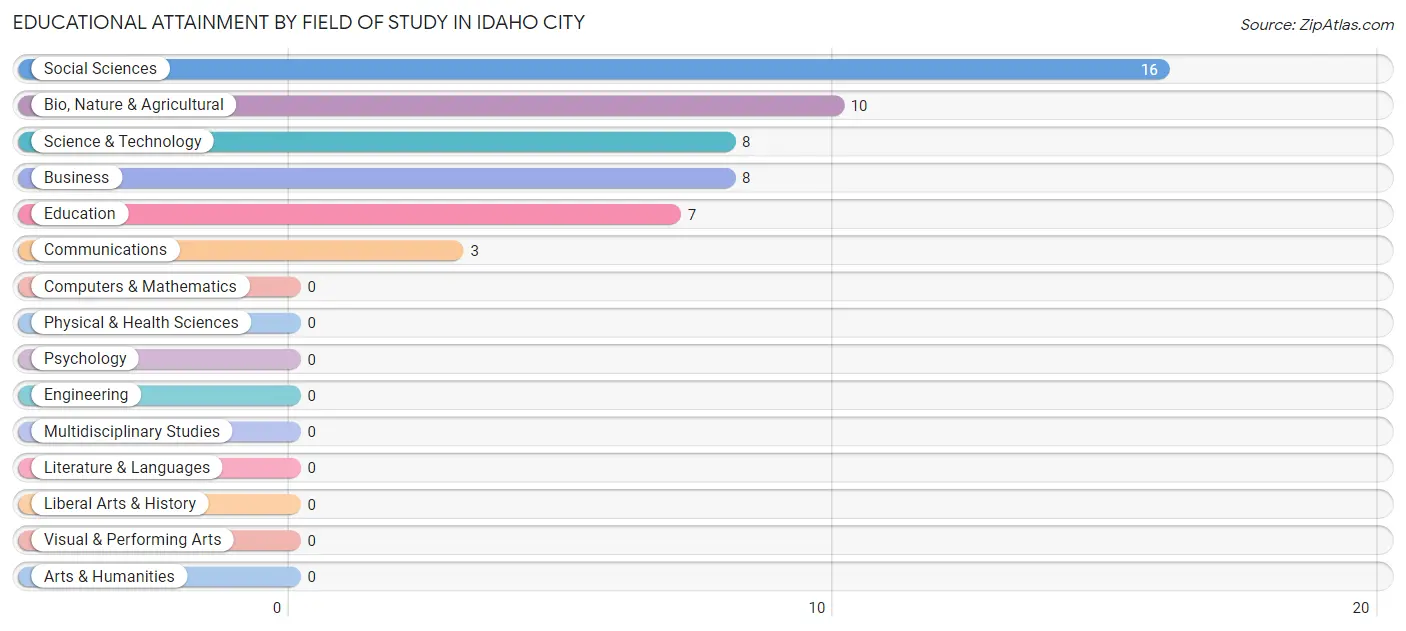
| Field of Study | # Graduates | % Graduates |
| Computers & Mathematics | 0 | 0.0% |
| Bio, Nature & Agricultural | 10 | 19.2% |
| Physical & Health Sciences | 0 | 0.0% |
| Psychology | 0 | 0.0% |
| Social Sciences | 16 | 30.8% |
| Engineering | 0 | 0.0% |
| Multidisciplinary Studies | 0 | 0.0% |
| Science & Technology | 8 | 15.4% |
| Business | 8 | 15.4% |
| Education | 7 | 13.5% |
| Literature & Languages | 0 | 0.0% |
| Liberal Arts & History | 0 | 0.0% |
| Visual & Performing Arts | 0 | 0.0% |
| Communications | 3 | 5.8% |
| Arts & Humanities | 0 | 0.0% |
| Total | 52 | 100.0% |
Transportation & Commute in Idaho City
Vehicle Availability by Sex in Idaho City
The most prevalent vehicle ownership categories in Idaho City are males with 1 vehicle (54, accounting for 44.6%) and females with 1 vehicle (17, making up 55.1%).
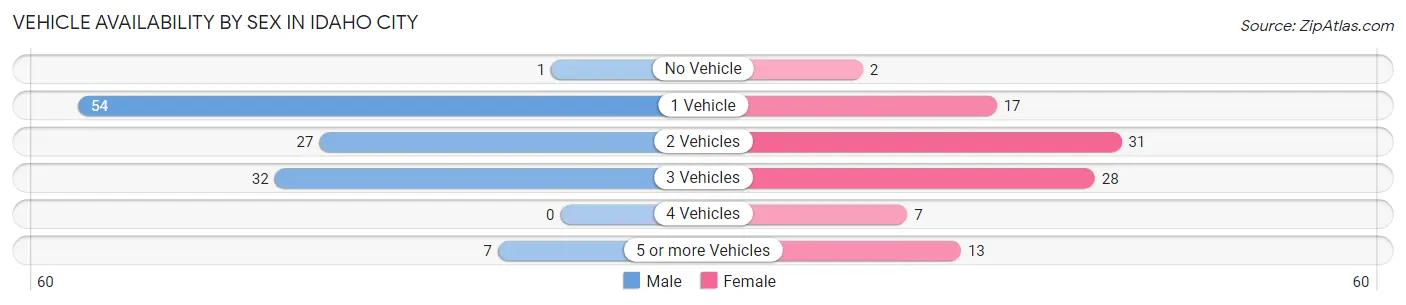
| Vehicles Available | Male | Female |
| No Vehicle | 1 (0.8%) | 2 (2.0%) |
| 1 Vehicle | 54 (44.6%) | 17 (17.3%) |
| 2 Vehicles | 27 (22.3%) | 31 (31.6%) |
| 3 Vehicles | 32 (26.5%) | 28 (28.6%) |
| 4 Vehicles | 0 (0.0%) | 7 (7.1%) |
| 5 or more Vehicles | 7 (5.8%) | 13 (13.3%) |
| Total | 121 (100.0%) | 98 (100.0%) |
Commute Time in Idaho City
The most frequently occuring commute durations in Idaho City are 5 to 9 minutes (78 commuters, 39.2%), 45 to 59 minutes (54 commuters, 27.1%), and 60 to 89 minutes (36 commuters, 18.1%).
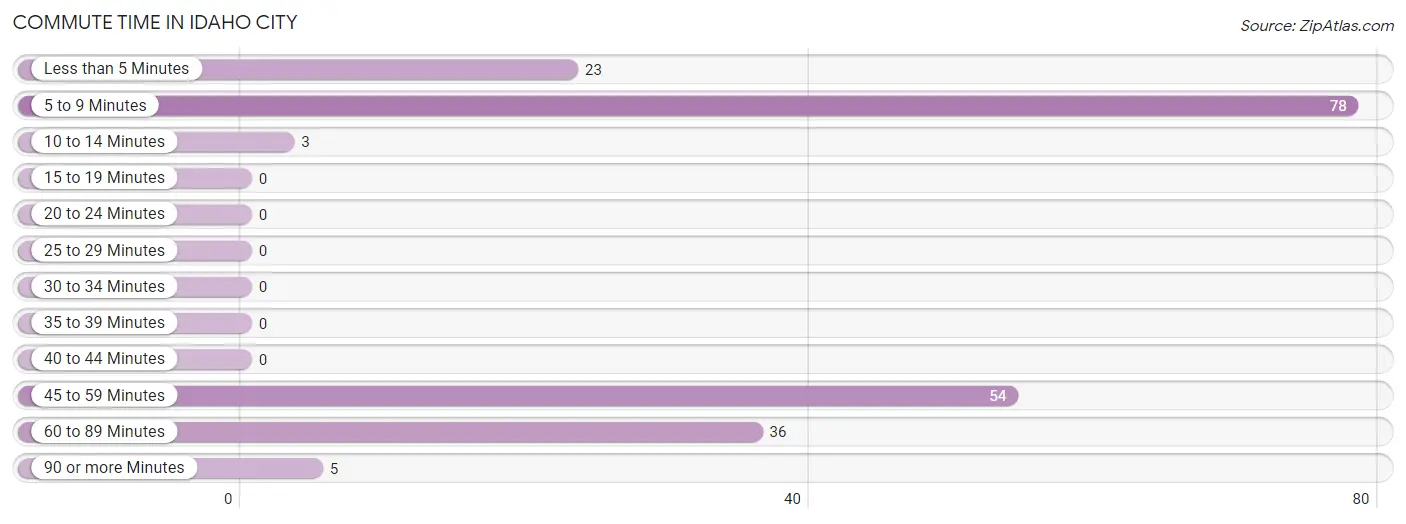
| Commute Time | # Commuters | % Commuters |
| Less than 5 Minutes | 23 | 11.6% |
| 5 to 9 Minutes | 78 | 39.2% |
| 10 to 14 Minutes | 3 | 1.5% |
| 15 to 19 Minutes | 0 | 0.0% |
| 20 to 24 Minutes | 0 | 0.0% |
| 25 to 29 Minutes | 0 | 0.0% |
| 30 to 34 Minutes | 0 | 0.0% |
| 35 to 39 Minutes | 0 | 0.0% |
| 40 to 44 Minutes | 0 | 0.0% |
| 45 to 59 Minutes | 54 | 27.1% |
| 60 to 89 Minutes | 36 | 18.1% |
| 90 or more Minutes | 5 | 2.5% |
Commute Time by Sex in Idaho City
The most common commute times in Idaho City are 5 to 9 minutes (48 commuters, 41.7%) for males and 5 to 9 minutes (30 commuters, 35.7%) for females.
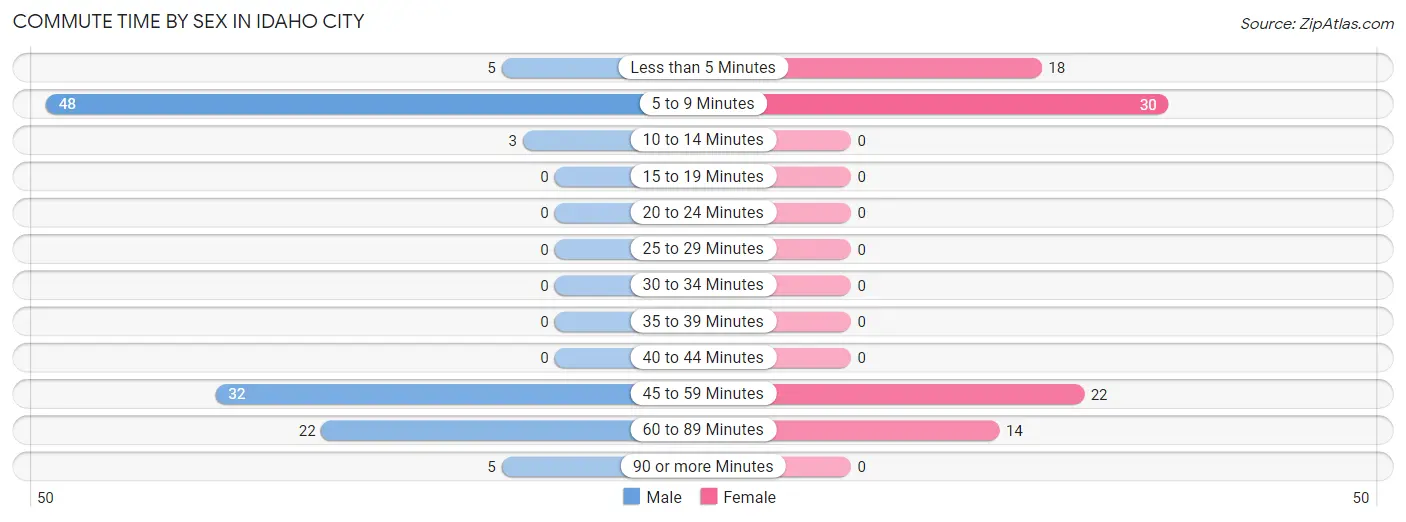
| Commute Time | Male | Female |
| Less than 5 Minutes | 5 (4.3%) | 18 (21.4%) |
| 5 to 9 Minutes | 48 (41.7%) | 30 (35.7%) |
| 10 to 14 Minutes | 3 (2.6%) | 0 (0.0%) |
| 15 to 19 Minutes | 0 (0.0%) | 0 (0.0%) |
| 20 to 24 Minutes | 0 (0.0%) | 0 (0.0%) |
| 25 to 29 Minutes | 0 (0.0%) | 0 (0.0%) |
| 30 to 34 Minutes | 0 (0.0%) | 0 (0.0%) |
| 35 to 39 Minutes | 0 (0.0%) | 0 (0.0%) |
| 40 to 44 Minutes | 0 (0.0%) | 0 (0.0%) |
| 45 to 59 Minutes | 32 (27.8%) | 22 (26.2%) |
| 60 to 89 Minutes | 22 (19.1%) | 14 (16.7%) |
| 90 or more Minutes | 5 (4.3%) | 0 (0.0%) |
Time of Departure to Work by Sex in Idaho City
The most frequent times of departure to work in Idaho City are 7:30 AM to 7:59 AM (41, 35.6%) for males and 7:30 AM to 7:59 AM (40, 47.6%) for females.
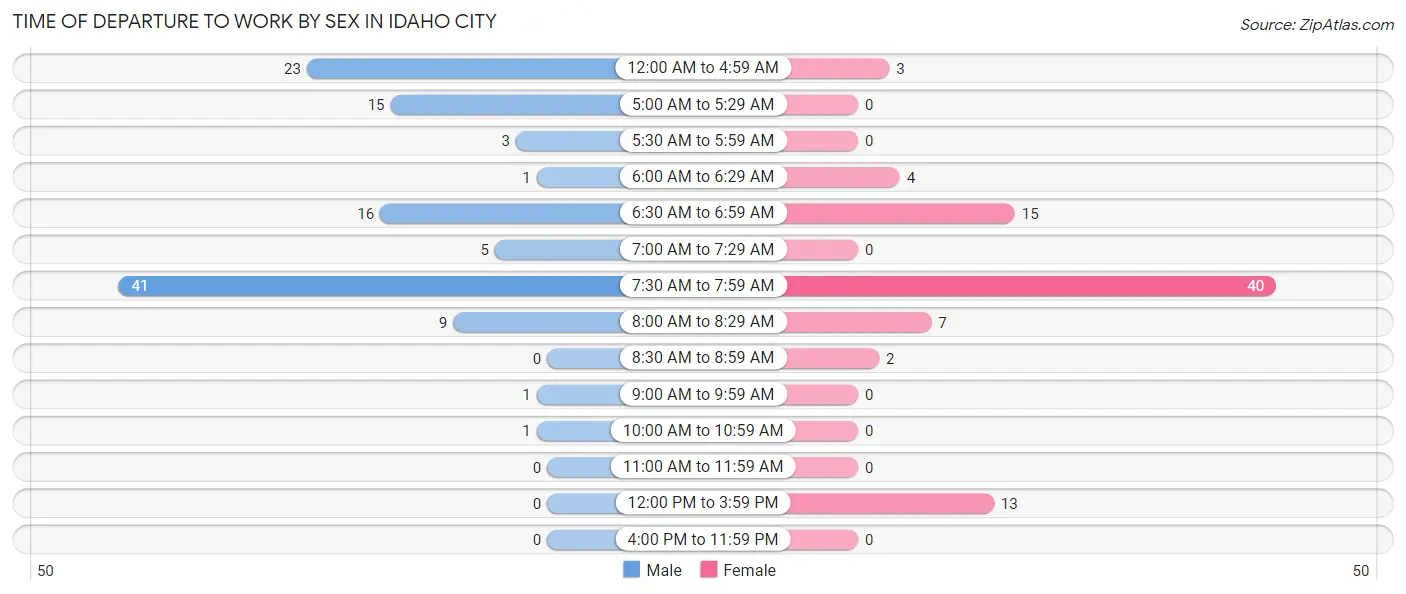
| Time of Departure | Male | Female |
| 12:00 AM to 4:59 AM | 23 (20.0%) | 3 (3.6%) |
| 5:00 AM to 5:29 AM | 15 (13.0%) | 0 (0.0%) |
| 5:30 AM to 5:59 AM | 3 (2.6%) | 0 (0.0%) |
| 6:00 AM to 6:29 AM | 1 (0.9%) | 4 (4.8%) |
| 6:30 AM to 6:59 AM | 16 (13.9%) | 15 (17.9%) |
| 7:00 AM to 7:29 AM | 5 (4.3%) | 0 (0.0%) |
| 7:30 AM to 7:59 AM | 41 (35.6%) | 40 (47.6%) |
| 8:00 AM to 8:29 AM | 9 (7.8%) | 7 (8.3%) |
| 8:30 AM to 8:59 AM | 0 (0.0%) | 2 (2.4%) |
| 9:00 AM to 9:59 AM | 1 (0.9%) | 0 (0.0%) |
| 10:00 AM to 10:59 AM | 1 (0.9%) | 0 (0.0%) |
| 11:00 AM to 11:59 AM | 0 (0.0%) | 0 (0.0%) |
| 12:00 PM to 3:59 PM | 0 (0.0%) | 13 (15.5%) |
| 4:00 PM to 11:59 PM | 0 (0.0%) | 0 (0.0%) |
| Total | 115 (100.0%) | 84 (100.0%) |
Housing Occupancy in Idaho City
Occupancy by Ownership in Idaho City
Of the total 319 dwellings in Idaho City, owner-occupied units account for 220 (69.0%), while renter-occupied units make up 99 (31.0%).
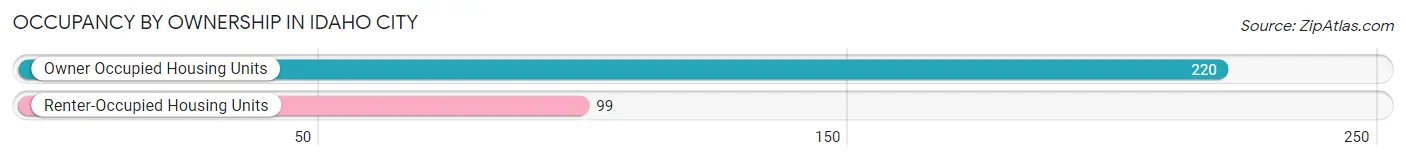
| Occupancy | # Housing Units | % Housing Units |
| Owner Occupied Housing Units | 220 | 69.0% |
| Renter-Occupied Housing Units | 99 | 31.0% |
| Total Occupied Housing Units | 319 | 100.0% |
Occupancy by Household Size in Idaho City
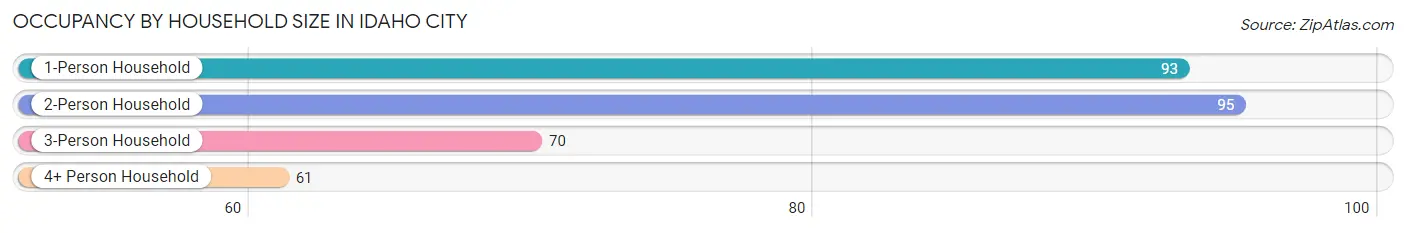
| Household Size | # Housing Units | % Housing Units |
| 1-Person Household | 93 | 29.1% |
| 2-Person Household | 95 | 29.8% |
| 3-Person Household | 70 | 21.9% |
| 4+ Person Household | 61 | 19.1% |
| Total Housing Units | 319 | 100.0% |
Occupancy by Ownership by Household Size in Idaho City
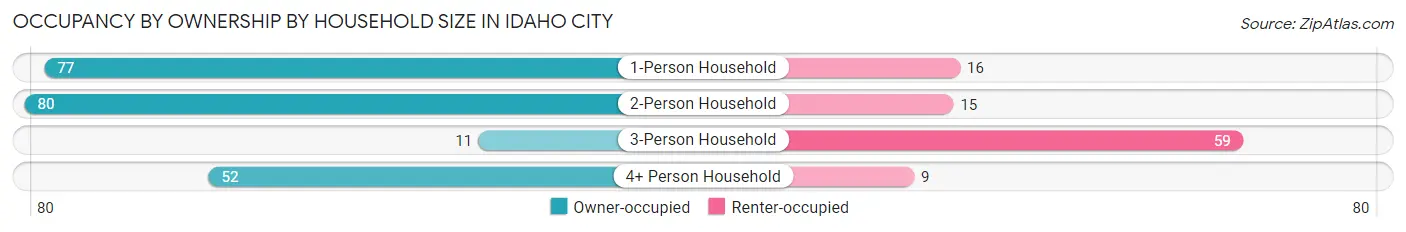
| Household Size | Owner-occupied | Renter-occupied |
| 1-Person Household | 77 (82.8%) | 16 (17.2%) |
| 2-Person Household | 80 (84.2%) | 15 (15.8%) |
| 3-Person Household | 11 (15.7%) | 59 (84.3%) |
| 4+ Person Household | 52 (85.3%) | 9 (14.7%) |
| Total Housing Units | 220 (69.0%) | 99 (31.0%) |
Occupancy by Educational Attainment in Idaho City
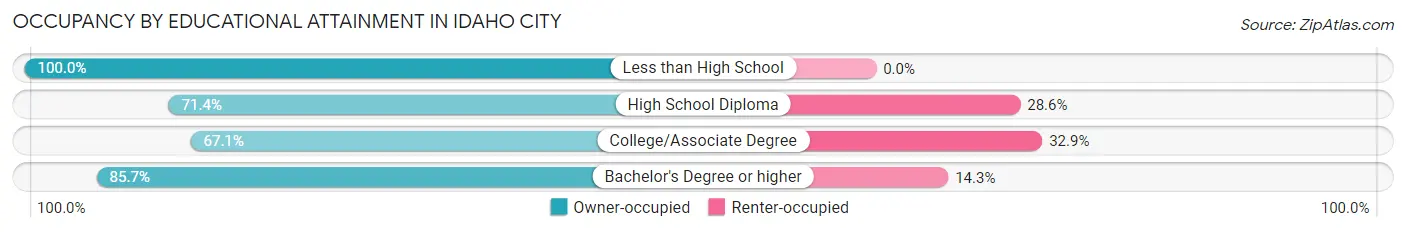
| Household Size | Owner-occupied | Renter-occupied |
| Less than High School | 6 (100.0%) | 0 (0.0%) |
| High School Diploma | 45 (71.4%) | 18 (28.6%) |
| College/Associate Degree | 163 (67.1%) | 80 (32.9%) |
| Bachelor's Degree or higher | 6 (85.7%) | 1 (14.3%) |
Occupancy by Age of Householder in Idaho City
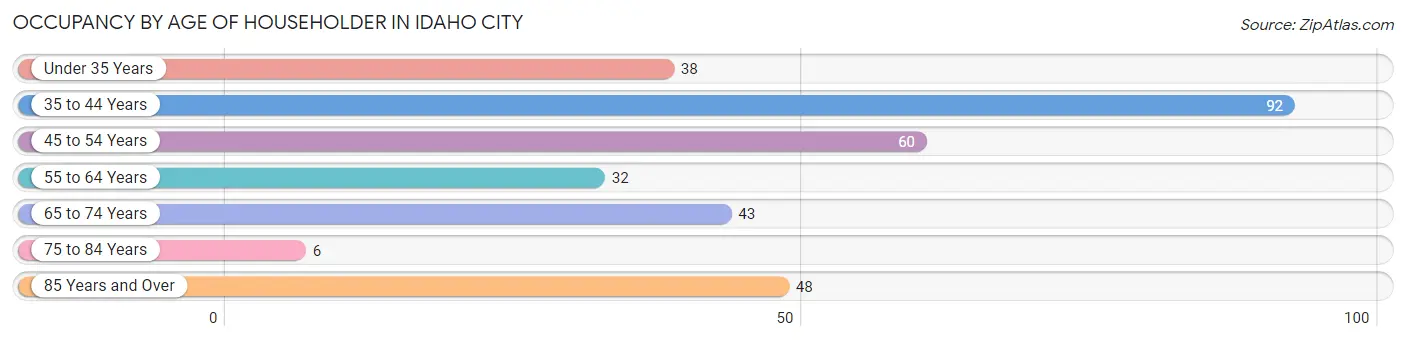
| Age Bracket | # Households | % Households |
| Under 35 Years | 38 | 11.9% |
| 35 to 44 Years | 92 | 28.8% |
| 45 to 54 Years | 60 | 18.8% |
| 55 to 64 Years | 32 | 10.0% |
| 65 to 74 Years | 43 | 13.5% |
| 75 to 84 Years | 6 | 1.9% |
| 85 Years and Over | 48 | 15.0% |
| Total | 319 | 100.0% |
Housing Finances in Idaho City
Median Income by Occupancy in Idaho City
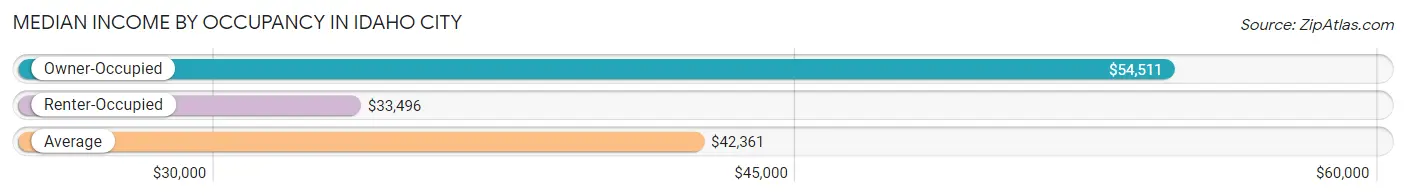
| Occupancy Type | # Households | Median Income |
| Owner-Occupied | 220 (69.0%) | $54,511 |
| Renter-Occupied | 99 (31.0%) | $33,496 |
| Average | 319 (100.0%) | $42,361 |
Occupancy by Householder Income Bracket in Idaho City
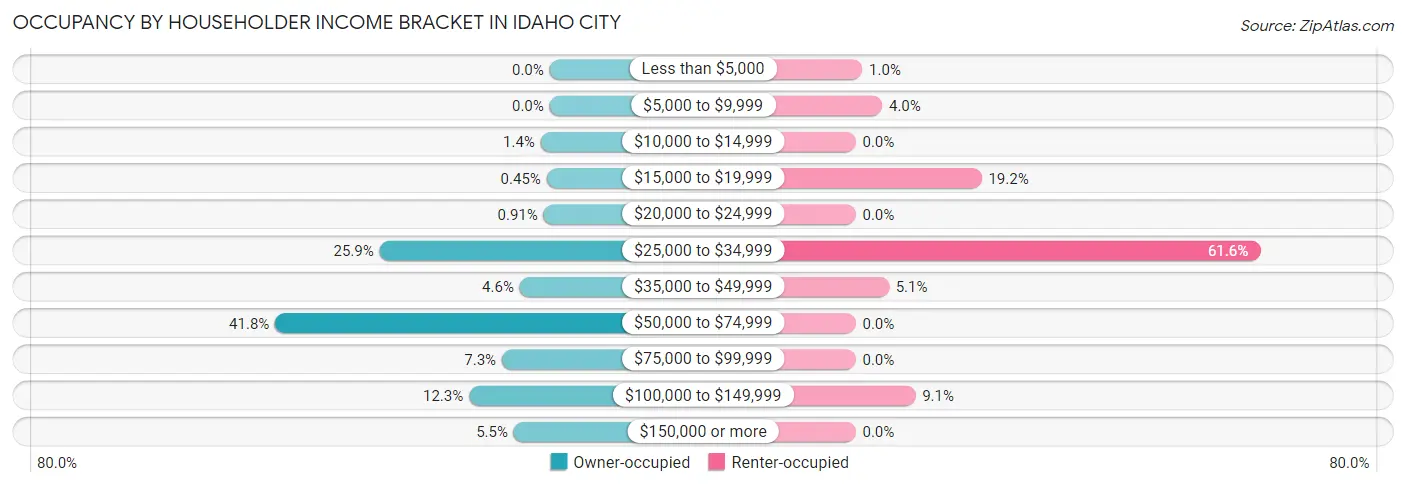
| Income Bracket | Owner-occupied | Renter-occupied |
| Less than $5,000 | 0 (0.0%) | 1 (1.0%) |
| $5,000 to $9,999 | 0 (0.0%) | 4 (4.0%) |
| $10,000 to $14,999 | 3 (1.4%) | 0 (0.0%) |
| $15,000 to $19,999 | 1 (0.4%) | 19 (19.2%) |
| $20,000 to $24,999 | 2 (0.9%) | 0 (0.0%) |
| $25,000 to $34,999 | 57 (25.9%) | 61 (61.6%) |
| $35,000 to $49,999 | 10 (4.5%) | 5 (5.1%) |
| $50,000 to $74,999 | 92 (41.8%) | 0 (0.0%) |
| $75,000 to $99,999 | 16 (7.3%) | 0 (0.0%) |
| $100,000 to $149,999 | 27 (12.3%) | 9 (9.1%) |
| $150,000 or more | 12 (5.4%) | 0 (0.0%) |
| Total | 220 (100.0%) | 99 (100.0%) |
Monthly Housing Cost Tiers in Idaho City
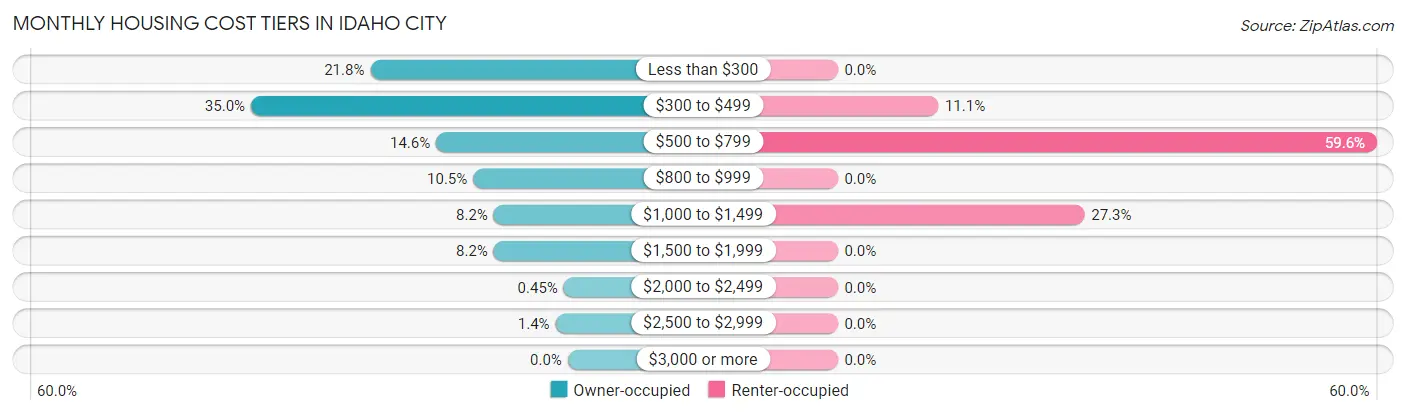
| Monthly Cost | Owner-occupied | Renter-occupied |
| Less than $300 | 48 (21.8%) | 0 (0.0%) |
| $300 to $499 | 77 (35.0%) | 11 (11.1%) |
| $500 to $799 | 32 (14.5%) | 59 (59.6%) |
| $800 to $999 | 23 (10.4%) | 0 (0.0%) |
| $1,000 to $1,499 | 18 (8.2%) | 27 (27.3%) |
| $1,500 to $1,999 | 18 (8.2%) | 0 (0.0%) |
| $2,000 to $2,499 | 1 (0.4%) | 0 (0.0%) |
| $2,500 to $2,999 | 3 (1.4%) | 0 (0.0%) |
| $3,000 or more | 0 (0.0%) | 0 (0.0%) |
| Total | 220 (100.0%) | 99 (100.0%) |
Physical Housing Characteristics in Idaho City
Housing Structures in Idaho City
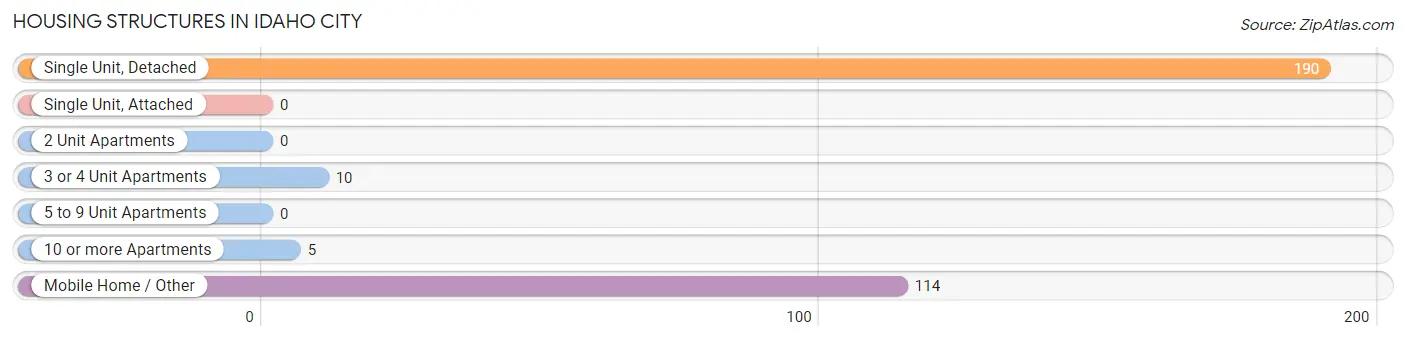
| Structure Type | # Housing Units | % Housing Units |
| Single Unit, Detached | 190 | 59.6% |
| Single Unit, Attached | 0 | 0.0% |
| 2 Unit Apartments | 0 | 0.0% |
| 3 or 4 Unit Apartments | 10 | 3.1% |
| 5 to 9 Unit Apartments | 0 | 0.0% |
| 10 or more Apartments | 5 | 1.6% |
| Mobile Home / Other | 114 | 35.7% |
| Total | 319 | 100.0% |
Housing Structures by Occupancy in Idaho City
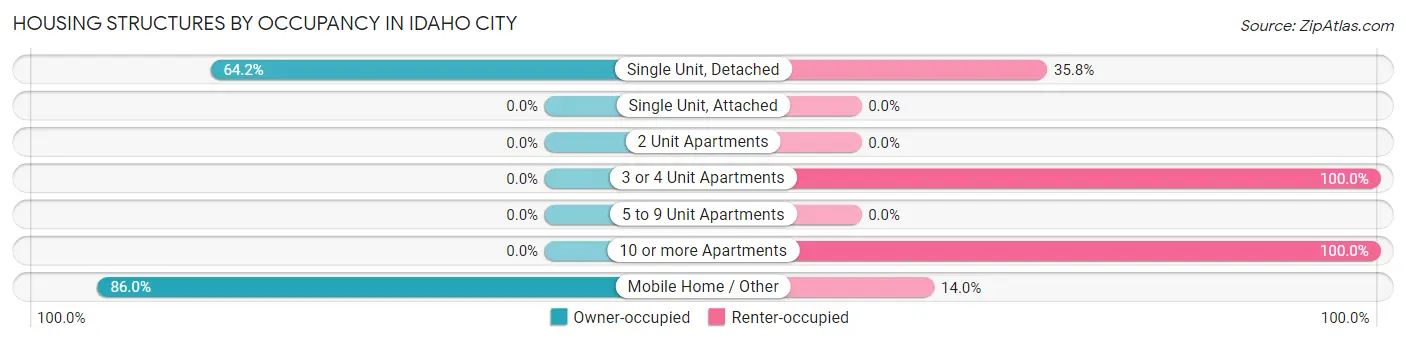
| Structure Type | Owner-occupied | Renter-occupied |
| Single Unit, Detached | 122 (64.2%) | 68 (35.8%) |
| Single Unit, Attached | 0 (0.0%) | 0 (0.0%) |
| 2 Unit Apartments | 0 (0.0%) | 0 (0.0%) |
| 3 or 4 Unit Apartments | 0 (0.0%) | 10 (100.0%) |
| 5 to 9 Unit Apartments | 0 (0.0%) | 0 (0.0%) |
| 10 or more Apartments | 0 (0.0%) | 5 (100.0%) |
| Mobile Home / Other | 98 (86.0%) | 16 (14.0%) |
| Total | 220 (69.0%) | 99 (31.0%) |
Housing Structures by Number of Rooms in Idaho City
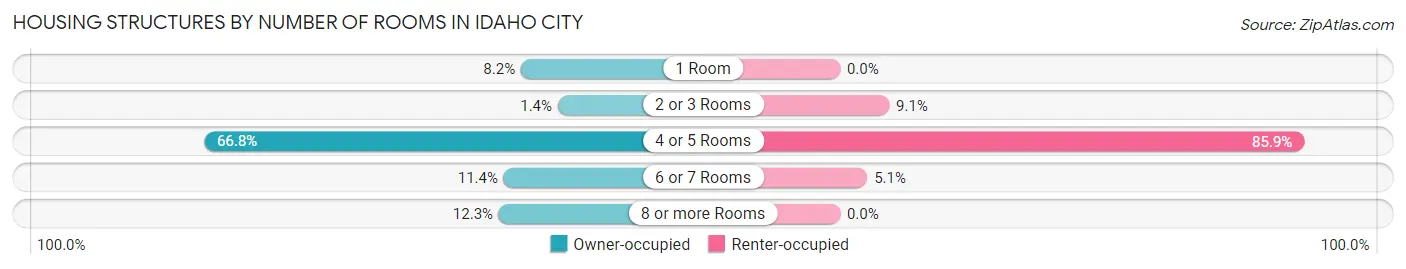
| Number of Rooms | Owner-occupied | Renter-occupied |
| 1 Room | 18 (8.2%) | 0 (0.0%) |
| 2 or 3 Rooms | 3 (1.4%) | 9 (9.1%) |
| 4 or 5 Rooms | 147 (66.8%) | 85 (85.9%) |
| 6 or 7 Rooms | 25 (11.4%) | 5 (5.1%) |
| 8 or more Rooms | 27 (12.3%) | 0 (0.0%) |
| Total | 220 (100.0%) | 99 (100.0%) |
Housing Structure by Heating Type in Idaho City
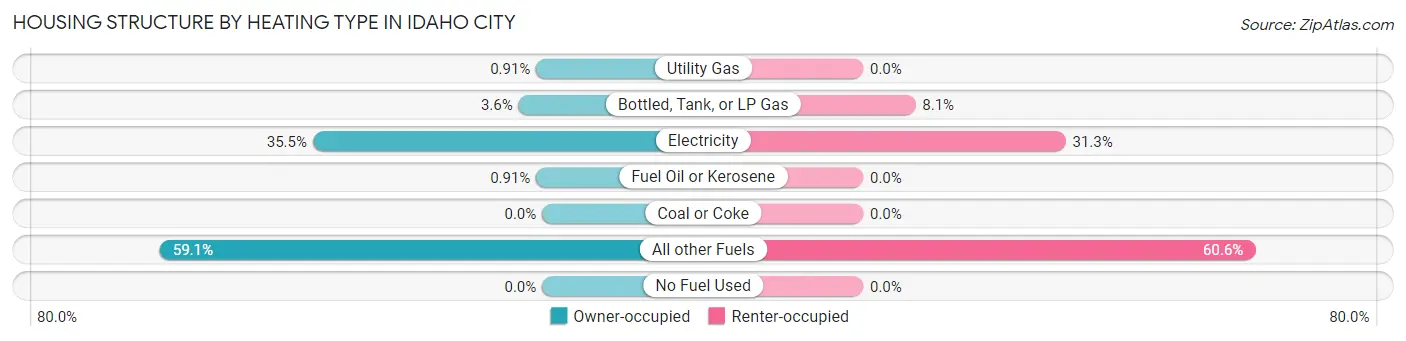
| Heating Type | Owner-occupied | Renter-occupied |
| Utility Gas | 2 (0.9%) | 0 (0.0%) |
| Bottled, Tank, or LP Gas | 8 (3.6%) | 8 (8.1%) |
| Electricity | 78 (35.4%) | 31 (31.3%) |
| Fuel Oil or Kerosene | 2 (0.9%) | 0 (0.0%) |
| Coal or Coke | 0 (0.0%) | 0 (0.0%) |
| All other Fuels | 130 (59.1%) | 60 (60.6%) |
| No Fuel Used | 0 (0.0%) | 0 (0.0%) |
| Total | 220 (100.0%) | 99 (100.0%) |
Household Vehicle Usage in Idaho City
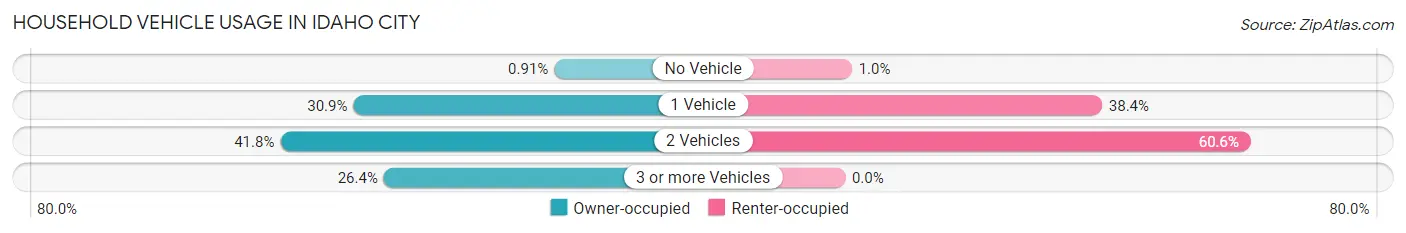
| Vehicles per Household | Owner-occupied | Renter-occupied |
| No Vehicle | 2 (0.9%) | 1 (1.0%) |
| 1 Vehicle | 68 (30.9%) | 38 (38.4%) |
| 2 Vehicles | 92 (41.8%) | 60 (60.6%) |
| 3 or more Vehicles | 58 (26.4%) | 0 (0.0%) |
| Total | 220 (100.0%) | 99 (100.0%) |
Real Estate & Mortgages in Idaho City
Real Estate and Mortgage Overview in Idaho City
| Characteristic | Without Mortgage | With Mortgage |
| Housing Units | 149 | 71 |
| Median Property Value | - | - |
| Median Household Income | $53,451 | $4 |
| Monthly Housing Costs | $321 | $0 |
| Real Estate Taxes | - | - |
Property Value by Mortgage Status in Idaho City
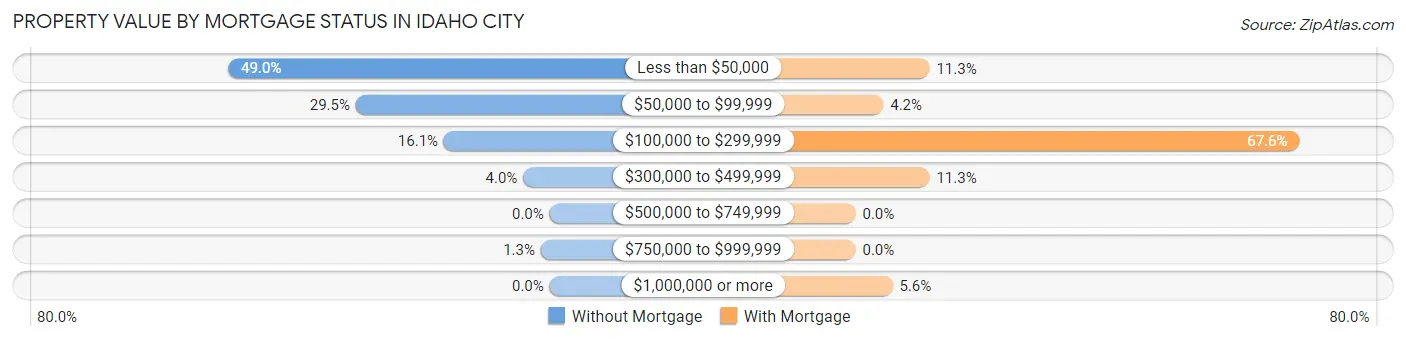
| Property Value | Without Mortgage | With Mortgage |
| Less than $50,000 | 73 (49.0%) | 8 (11.3%) |
| $50,000 to $99,999 | 44 (29.5%) | 3 (4.2%) |
| $100,000 to $299,999 | 24 (16.1%) | 48 (67.6%) |
| $300,000 to $499,999 | 6 (4.0%) | 8 (11.3%) |
| $500,000 to $749,999 | 0 (0.0%) | 0 (0.0%) |
| $750,000 to $999,999 | 2 (1.3%) | 0 (0.0%) |
| $1,000,000 or more | 0 (0.0%) | 4 (5.6%) |
| Total | 149 (100.0%) | 71 (100.0%) |
Household Income by Mortgage Status in Idaho City
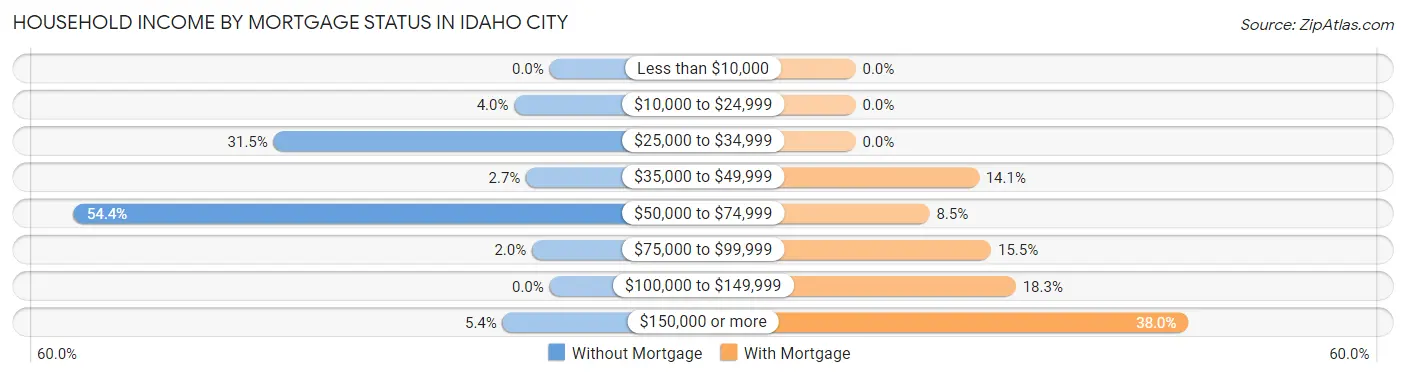
| Household Income | Without Mortgage | With Mortgage |
| Less than $10,000 | 0 (0.0%) | 0 (0.0%) |
| $10,000 to $24,999 | 6 (4.0%) | 0 (0.0%) |
| $25,000 to $34,999 | 47 (31.5%) | 0 (0.0%) |
| $35,000 to $49,999 | 4 (2.7%) | 10 (14.1%) |
| $50,000 to $74,999 | 81 (54.4%) | 6 (8.5%) |
| $75,000 to $99,999 | 3 (2.0%) | 11 (15.5%) |
| $100,000 to $149,999 | 0 (0.0%) | 13 (18.3%) |
| $150,000 or more | 8 (5.4%) | 27 (38.0%) |
| Total | 149 (100.0%) | 71 (100.0%) |
Property Value to Household Income Ratio in Idaho City
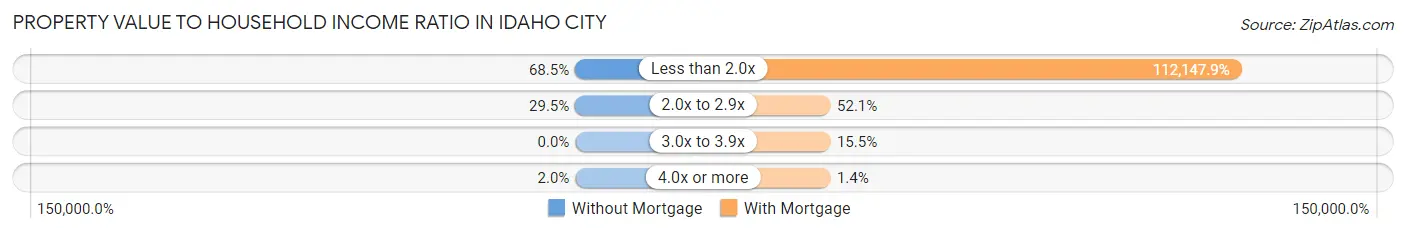
| Value-to-Income Ratio | Without Mortgage | With Mortgage |
| Less than 2.0x | 102 (68.5%) | 79,625 (112,147.9%) |
| 2.0x to 2.9x | 44 (29.5%) | 37 (52.1%) |
| 3.0x to 3.9x | 0 (0.0%) | 11 (15.5%) |
| 4.0x or more | 3 (2.0%) | 1 (1.4%) |
| Total | 149 (100.0%) | 71 (100.0%) |
Real Estate Taxes by Mortgage Status in Idaho City
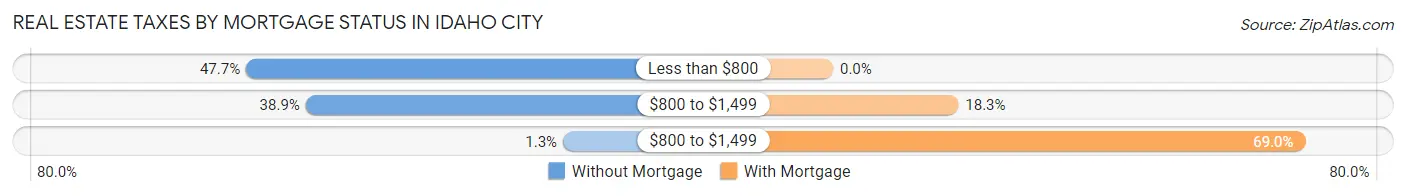
| Property Taxes | Without Mortgage | With Mortgage |
| Less than $800 | 71 (47.6%) | 0 (0.0%) |
| $800 to $1,499 | 58 (38.9%) | 13 (18.3%) |
| $800 to $1,499 | 2 (1.3%) | 49 (69.0%) |
| Total | 149 (100.0%) | 71 (100.0%) |
Health & Disability in Idaho City
Health Insurance Coverage by Age in Idaho City
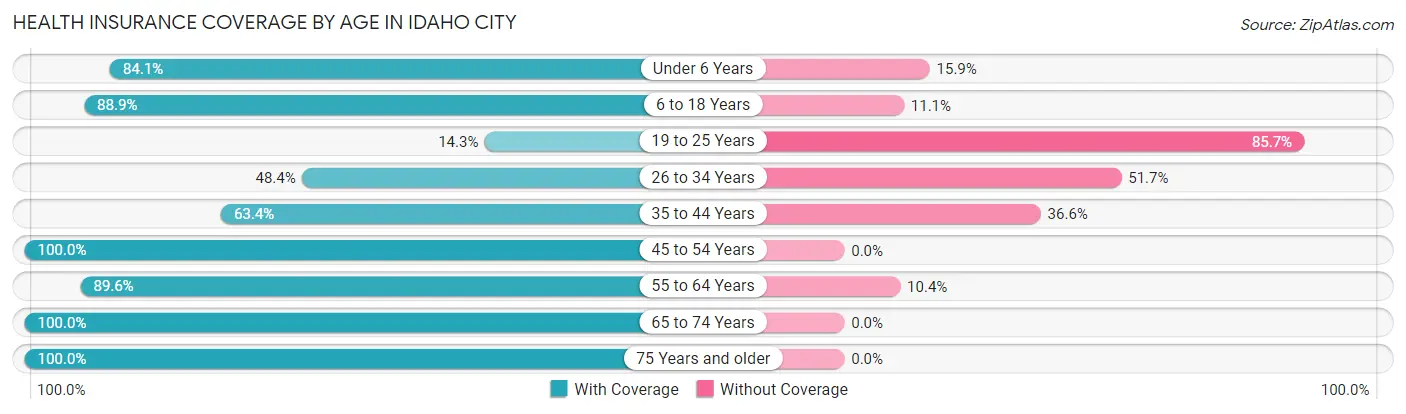
| Age Bracket | With Coverage | Without Coverage |
| Under 6 Years | 74 (84.1%) | 14 (15.9%) |
| 6 to 18 Years | 80 (88.9%) | 10 (11.1%) |
| 19 to 25 Years | 1 (14.3%) | 6 (85.7%) |
| 26 to 34 Years | 44 (48.3%) | 47 (51.6%) |
| 35 to 44 Years | 90 (63.4%) | 52 (36.6%) |
| 45 to 54 Years | 68 (100.0%) | 0 (0.0%) |
| 55 to 64 Years | 43 (89.6%) | 5 (10.4%) |
| 65 to 74 Years | 53 (100.0%) | 0 (0.0%) |
| 75 Years and older | 86 (100.0%) | 0 (0.0%) |
| Total | 539 (80.1%) | 134 (19.9%) |
Health Insurance Coverage by Citizenship Status in Idaho City
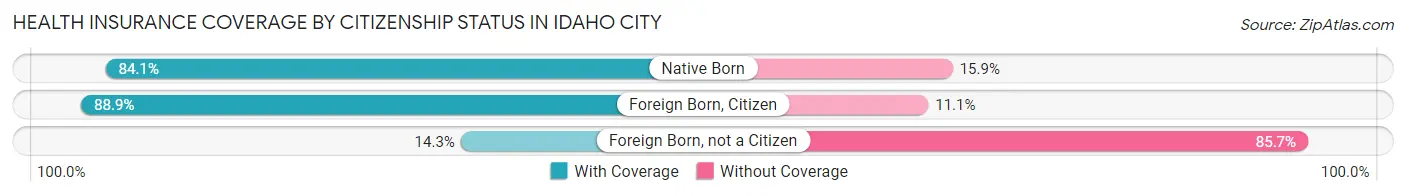
| Citizenship Status | With Coverage | Without Coverage |
| Native Born | 74 (84.1%) | 14 (15.9%) |
| Foreign Born, Citizen | 80 (88.9%) | 10 (11.1%) |
| Foreign Born, not a Citizen | 1 (14.3%) | 6 (85.7%) |
Health Insurance Coverage by Household Income in Idaho City
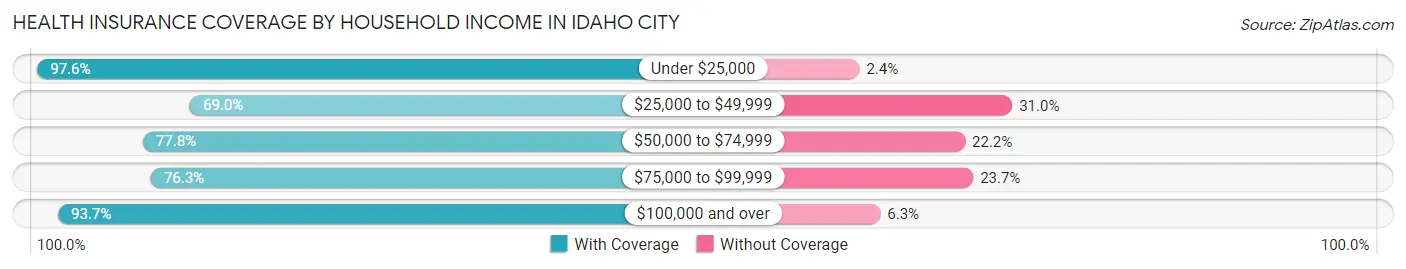
| Household Income | With Coverage | Without Coverage |
| Under $25,000 | 41 (97.6%) | 1 (2.4%) |
| $25,000 to $49,999 | 138 (69.0%) | 62 (31.0%) |
| $50,000 to $74,999 | 179 (77.8%) | 51 (22.2%) |
| $75,000 to $99,999 | 29 (76.3%) | 9 (23.7%) |
| $100,000 and over | 149 (93.7%) | 10 (6.3%) |
Public vs Private Health Insurance Coverage by Age in Idaho City
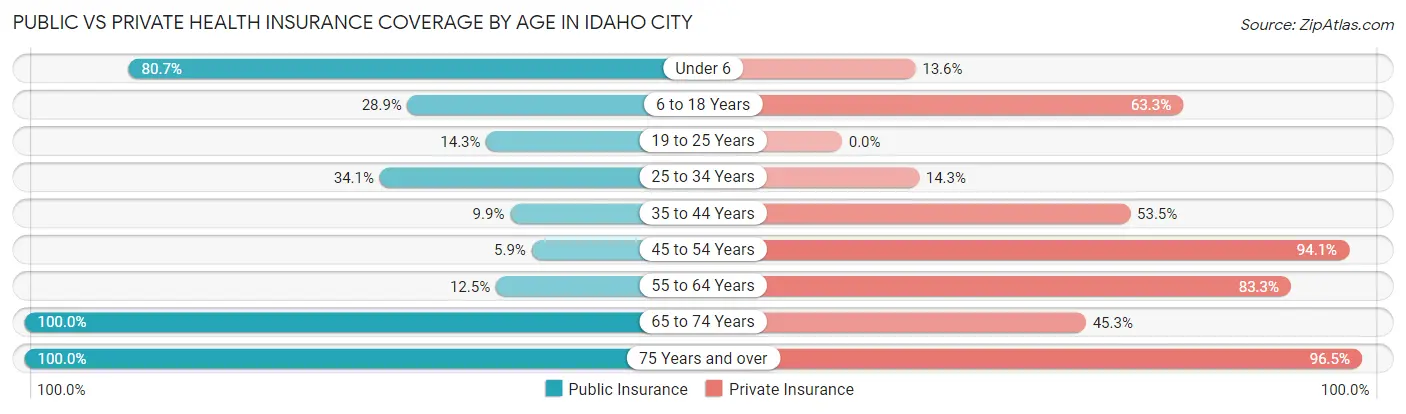
| Age Bracket | Public Insurance | Private Insurance |
| Under 6 | 71 (80.7%) | 12 (13.6%) |
| 6 to 18 Years | 26 (28.9%) | 57 (63.3%) |
| 19 to 25 Years | 1 (14.3%) | 0 (0.0%) |
| 25 to 34 Years | 31 (34.1%) | 13 (14.3%) |
| 35 to 44 Years | 14 (9.9%) | 76 (53.5%) |
| 45 to 54 Years | 4 (5.9%) | 64 (94.1%) |
| 55 to 64 Years | 6 (12.5%) | 40 (83.3%) |
| 65 to 74 Years | 53 (100.0%) | 24 (45.3%) |
| 75 Years and over | 86 (100.0%) | 83 (96.5%) |
| Total | 292 (43.4%) | 369 (54.8%) |
Disability Status by Sex by Age in Idaho City
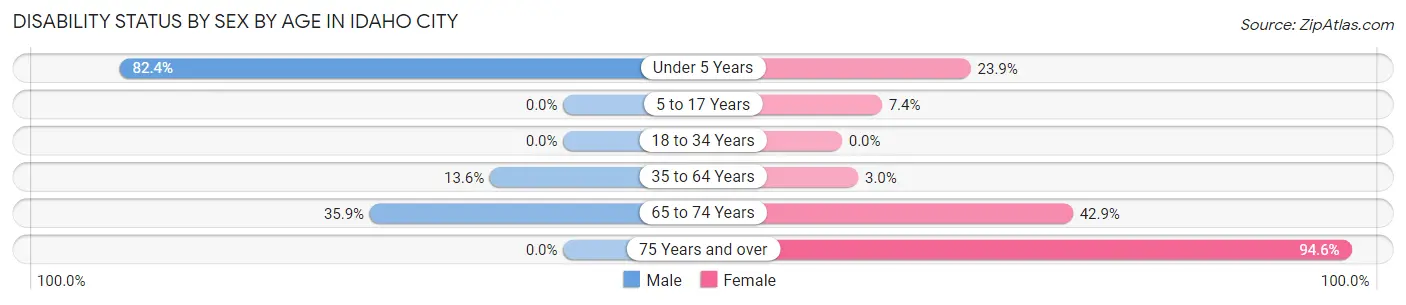
| Age Bracket | Male | Female |
| Under 5 Years | 14 (82.4%) | 11 (23.9%) |
| 5 to 17 Years | 0 (0.0%) | 6 (7.4%) |
| 18 to 34 Years | 0 (0.0%) | 0 (0.0%) |
| 35 to 64 Years | 17 (13.6%) | 4 (3.0%) |
| 65 to 74 Years | 14 (35.9%) | 6 (42.9%) |
| 75 Years and over | 0 (0.0%) | 35 (94.6%) |
Disability Class by Sex by Age in Idaho City
Disability Class: Hearing Difficulty
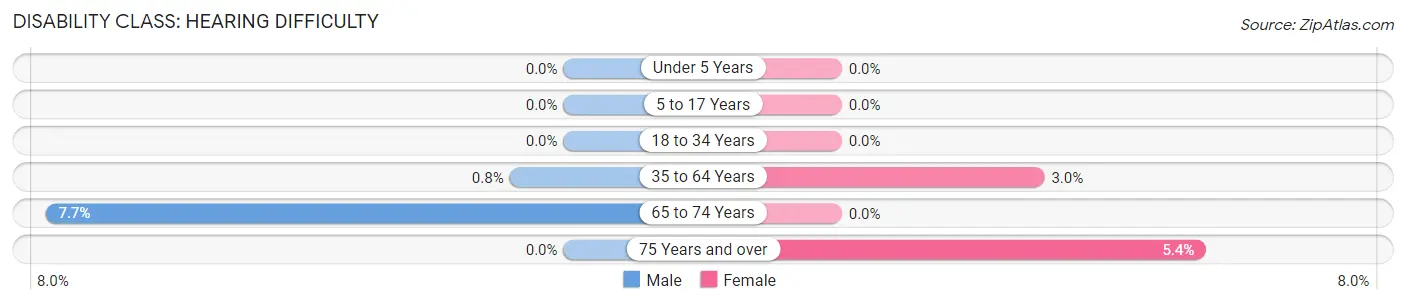
| Age Bracket | Male | Female |
| Under 5 Years | 0 (0.0%) | 0 (0.0%) |
| 5 to 17 Years | 0 (0.0%) | 0 (0.0%) |
| 18 to 34 Years | 0 (0.0%) | 0 (0.0%) |
| 35 to 64 Years | 1 (0.8%) | 4 (3.0%) |
| 65 to 74 Years | 3 (7.7%) | 0 (0.0%) |
| 75 Years and over | 0 (0.0%) | 2 (5.4%) |
Disability Class: Vision Difficulty
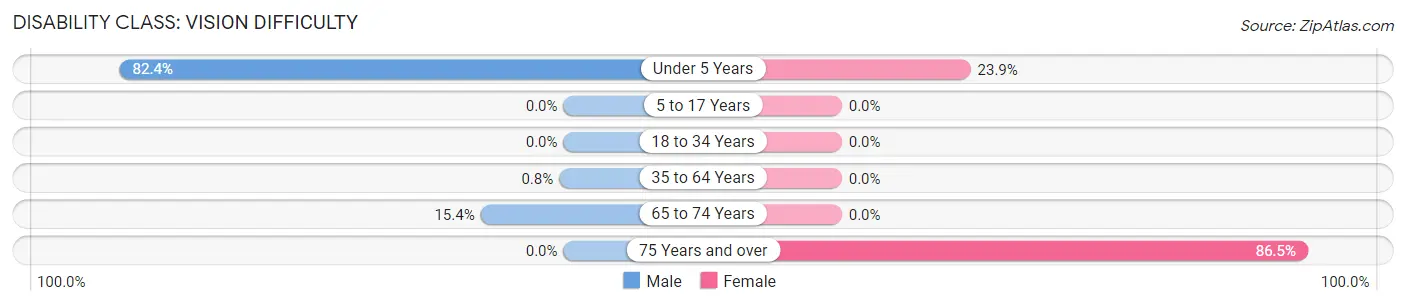
| Age Bracket | Male | Female |
| Under 5 Years | 14 (82.4%) | 11 (23.9%) |
| 5 to 17 Years | 0 (0.0%) | 0 (0.0%) |
| 18 to 34 Years | 0 (0.0%) | 0 (0.0%) |
| 35 to 64 Years | 1 (0.8%) | 0 (0.0%) |
| 65 to 74 Years | 6 (15.4%) | 0 (0.0%) |
| 75 Years and over | 0 (0.0%) | 32 (86.5%) |
Disability Class: Cognitive Difficulty
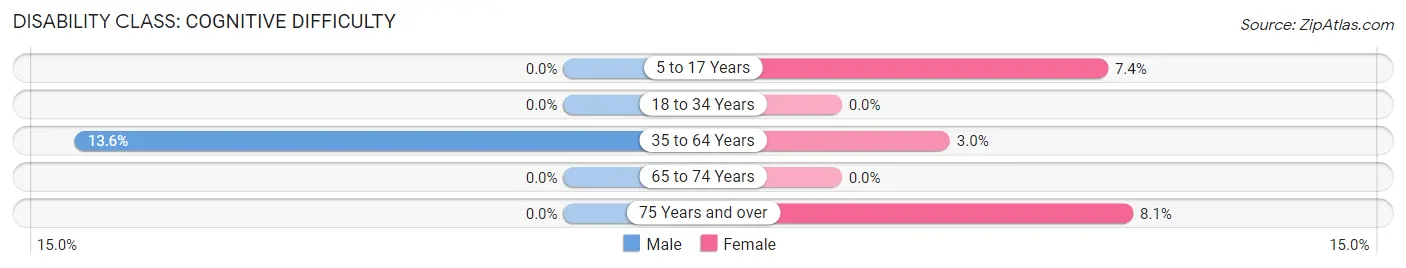
| Age Bracket | Male | Female |
| 5 to 17 Years | 0 (0.0%) | 6 (7.4%) |
| 18 to 34 Years | 0 (0.0%) | 0 (0.0%) |
| 35 to 64 Years | 17 (13.6%) | 4 (3.0%) |
| 65 to 74 Years | 0 (0.0%) | 0 (0.0%) |
| 75 Years and over | 0 (0.0%) | 3 (8.1%) |
Disability Class: Ambulatory Difficulty
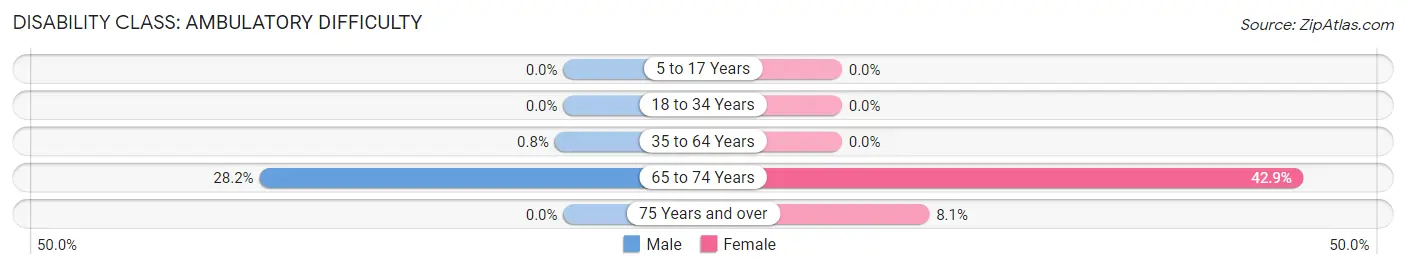
| Age Bracket | Male | Female |
| 5 to 17 Years | 0 (0.0%) | 0 (0.0%) |
| 18 to 34 Years | 0 (0.0%) | 0 (0.0%) |
| 35 to 64 Years | 1 (0.8%) | 0 (0.0%) |
| 65 to 74 Years | 11 (28.2%) | 6 (42.9%) |
| 75 Years and over | 0 (0.0%) | 3 (8.1%) |
Disability Class: Self-Care Difficulty
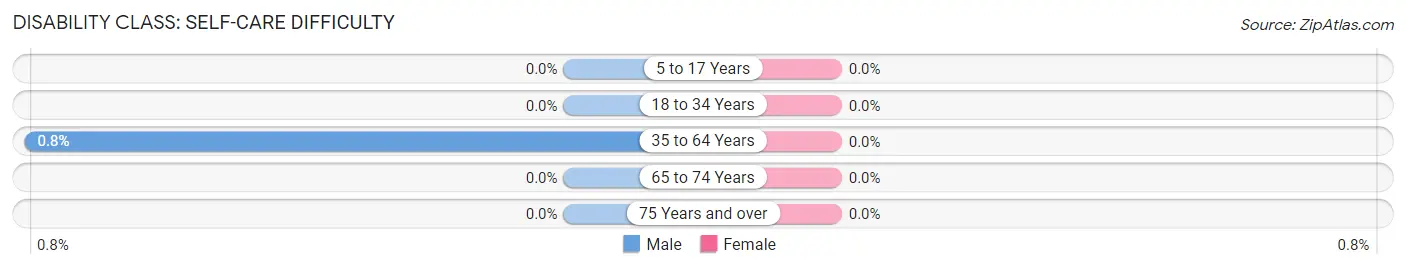
| Age Bracket | Male | Female |
| 5 to 17 Years | 0 (0.0%) | 0 (0.0%) |
| 18 to 34 Years | 0 (0.0%) | 0 (0.0%) |
| 35 to 64 Years | 1 (0.8%) | 0 (0.0%) |
| 65 to 74 Years | 0 (0.0%) | 0 (0.0%) |
| 75 Years and over | 0 (0.0%) | 0 (0.0%) |
Technology Access in Idaho City
Computing Device Access in Idaho City
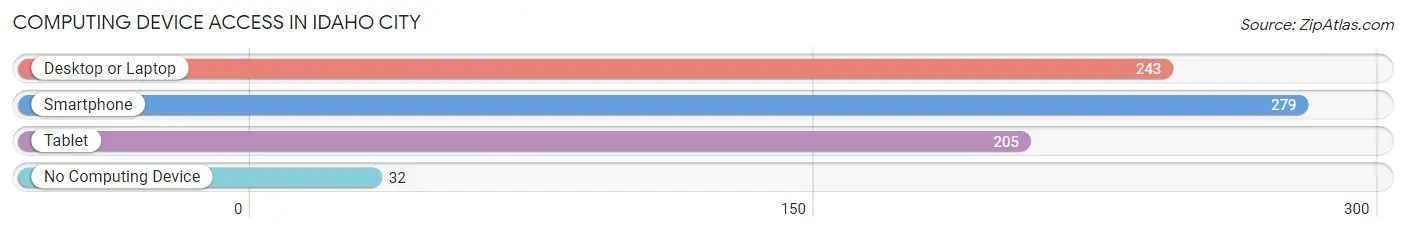
| Device Type | # Households | % Households |
| Desktop or Laptop | 243 | 76.2% |
| Smartphone | 279 | 87.5% |
| Tablet | 205 | 64.3% |
| No Computing Device | 32 | 10.0% |
| Total | 319 | 100.0% |
Internet Access in Idaho City
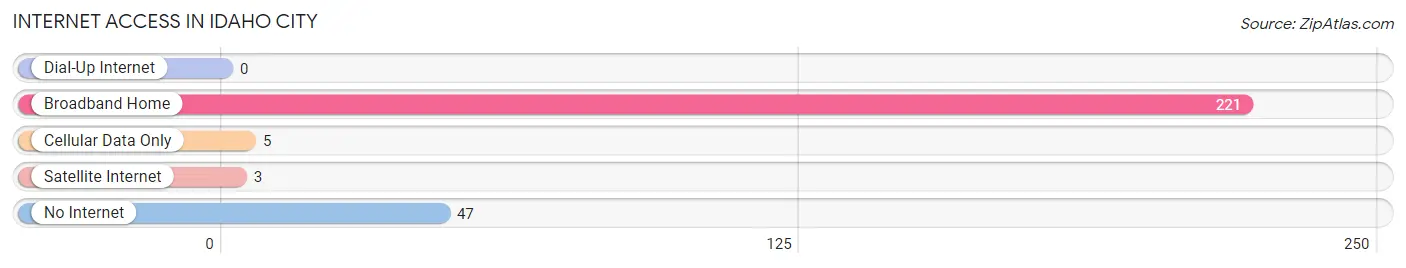
| Internet Type | # Households | % Households |
| Dial-Up Internet | 0 | 0.0% |
| Broadband Home | 221 | 69.3% |
| Cellular Data Only | 5 | 1.6% |
| Satellite Internet | 3 | 0.9% |
| No Internet | 47 | 14.7% |
| Total | 319 | 100.0% |
Idaho City Summary
Idaho City is a small city located in the western part of the state of Idaho, in the United States. It is the county seat of Boise County, and is located in the Boise National Forest. The city is situated at an elevation of 4,845 feet (1,477 m) above sea level, and is located approximately 40 miles (64 km) northeast of the state capital, Boise. As of the 2010 census, the population of Idaho City was 1,212.
History
Idaho City was founded in 1863, during the height of the gold rush in the area. The city was originally known as Bannock, but was renamed Idaho City in 1864. The city quickly grew to become the largest city in the Idaho Territory, and was the largest city in the Pacific Northwest until the late 1880s. During its heyday, Idaho City was home to over 10,000 people, and was the center of commerce and government in the region.
The city was devastated by a series of fires in the late 19th century, and its population declined significantly. By the early 20th century, the city had become a small, rural community. In the 1950s, the city began to experience a resurgence, as it became a popular destination for tourists and outdoor enthusiasts.
Geography
Idaho City is located in the western part of the state of Idaho, in the Boise National Forest. The city is situated at an elevation of 4,845 feet (1,477 m) above sea level, and is located approximately 40 miles (64 km) northeast of the state capital, Boise. The city is surrounded by mountains and forests, and is located near several popular recreational areas, including the Boise River, the Payette River, and the Sawtooth National Forest.
Economy
The economy of Idaho City is largely based on tourism and outdoor recreation. The city is home to several popular tourist attractions, including the Idaho City Historic District, the Boise River, and the Payette River. The city is also home to several outdoor recreation businesses, including rafting companies, fishing guides, and hunting outfitters.
In addition to tourism and outdoor recreation, Idaho City is also home to several small businesses, including restaurants, retail stores, and service providers. The city is also home to several small manufacturing companies, including a woodworking shop and a metal fabrication shop.
Demographics
As of the 2010 census, the population of Idaho City was 1,212. The racial makeup of the city was 95.3% White, 0.3% African American, 0.7% Native American, 0.3% Asian, 0.1% Pacific Islander, 0.7% from other races, and 2.0% from two or more races. Hispanic or Latino of any race were 2.7% of the population.
The median income for a household in Idaho City was $37,917, and the median income for a family was $45,625. Males had a median income of $35,000 versus $25,000 for females. The per capita income for the city was $19,945. About 11.2% of families and 14.2% of the population were below the poverty line, including 18.2% of those under age 18 and 8.3% of those age 65 or over.
Common Questions
What is Per Capita Income in Idaho City?
Per Capita income in Idaho City is $27,091.
What is the Median Family Income in Idaho City?
Median Family Income in Idaho City is $53,967.
What is the Median Household income in Idaho City?
Median Household Income in Idaho City is $42,361.
What is Income or Wage Gap in Idaho City?
Income or Wage Gap in Idaho City is 10.1%.
Women in Idaho City earn 89.9 cents for every dollar earned by a man.
What is Inequality or Gini Index in Idaho City?
Inequality or Gini Index in Idaho City is 0.34.
What is the Total Population of Idaho City?
Total Population of Idaho City is 673.
What is the Total Male Population of Idaho City?
Total Male Population of Idaho City is 309.
What is the Total Female Population of Idaho City?
Total Female Population of Idaho City is 364.
What is the Ratio of Males per 100 Females in Idaho City?
There are 84.89 Males per 100 Females in Idaho City.
What is the Ratio of Females per 100 Males in Idaho City?
There are 117.80 Females per 100 Males in Idaho City.
What is the Median Population Age in Idaho City?
Median Population Age in Idaho City is 38.3 Years.
What is the Average Family Size in Idaho City
Average Family Size in Idaho City is 2.4 People.
What is the Average Household Size in Idaho City
Average Household Size in Idaho City is 2.1 People.
How Large is the Labor Force in Idaho City?
There are 315 People in the Labor Forcein in Idaho City.
What is the Percentage of People in the Labor Force in Idaho City?
62.4% of People are in the Labor Force in Idaho City.
What is the Unemployment Rate in Idaho City?
Unemployment Rate in Idaho City is 6.0%.