Hailey, ID
Hailey Map
Hailey Overview
9,238
TOTAL POPULATION
4,496
MALE POPULATION
4,742
FEMALE POPULATION
94.81
MALES / 100 FEMALES
105.47
FEMALES / 100 MALES
40.8
MEDIAN AGE
3.4
AVG FAMILY SIZE
2.8
AVG HOUSEHOLD SIZE
$34,710
PER CAPITA INCOME
$81,849
AVG FAMILY INCOME
$77,035
AVG HOUSEHOLD INCOME
11.0%
WAGE / INCOME GAP [ % ]
89.0¢/ $1
WAGE / INCOME GAP [ $ ]
0.38
INEQUALITY / GINI INDEX
5,387
LABOR FORCE [ PEOPLE ]
76.5%
PERCENT IN LABOR FORCE
3.2%
UNEMPLOYMENT RATE
Hailey Zip Codes
Hailey Area Codes
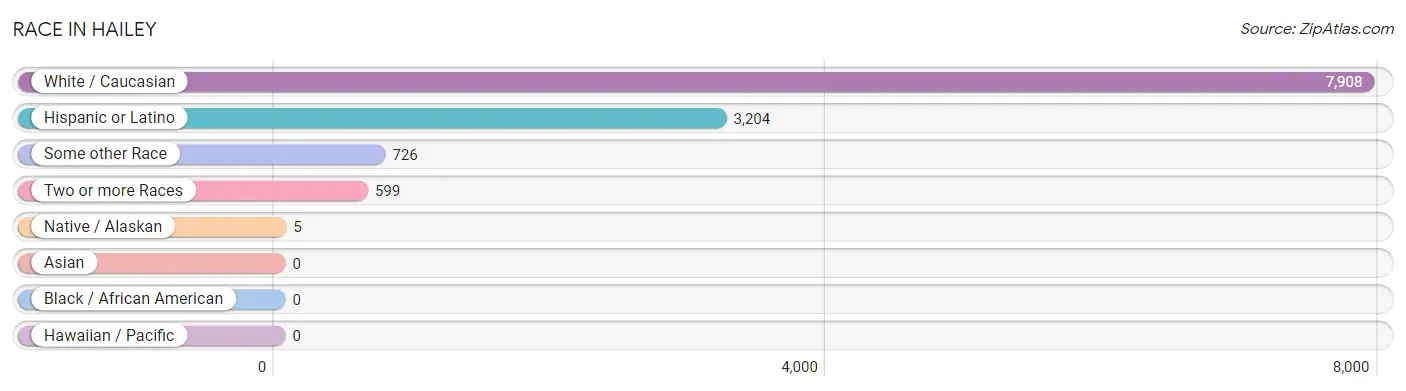
Race in Hailey
The most populous races in Hailey are White / Caucasian (7,908 | 85.6%), Hispanic or Latino (3,204 | 34.7%), and Some other Race (726 | 7.9%).
| Race | # Population | % Population |
| Asian | 0 | 0.0% |
| Black / African American | 0 | 0.0% |
| Hawaiian / Pacific | 0 | 0.0% |
| Hispanic or Latino | 3,204 | 34.7% |
| Native / Alaskan | 5 | 0.1% |
| White / Caucasian | 7,908 | 85.6% |
| Two or more Races | 599 | 6.5% |
| Some other Race | 726 | 7.9% |
| Total | 9,238 | 100.0% |
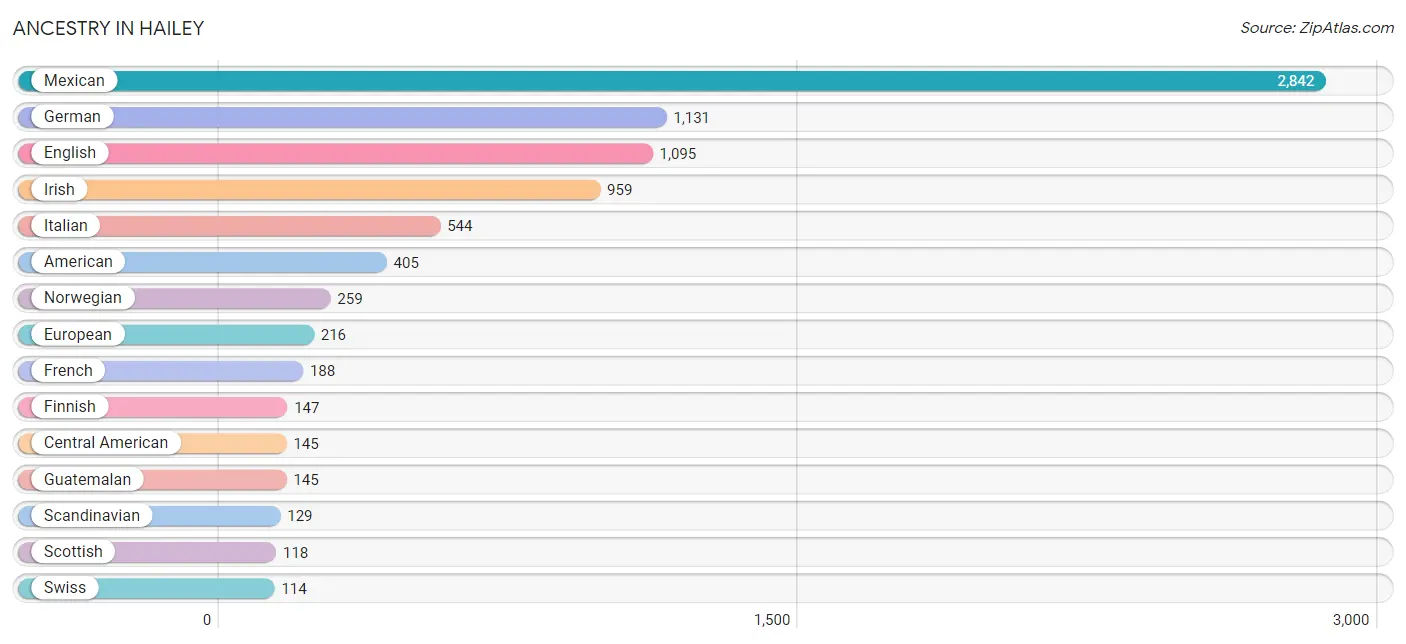
Ancestry in Hailey
The most populous ancestries reported in Hailey are Mexican (2,842 | 30.8%), German (1,131 | 12.2%), English (1,095 | 11.8%), Irish (959 | 10.4%), and Italian (544 | 5.9%), together accounting for 71.1% of all Hailey residents.
| Ancestry | # Population | % Population |
| American | 405 | 4.4% |
| Austrian | 76 | 0.8% |
| Basque | 14 | 0.2% |
| British | 59 | 0.6% |
| Central American | 145 | 1.6% |
| Cherokee | 17 | 0.2% |
| Danish | 53 | 0.6% |
| Dutch | 35 | 0.4% |
| Eastern European | 27 | 0.3% |
| English | 1,095 | 11.8% |
| European | 216 | 2.3% |
| Finnish | 147 | 1.6% |
| French | 188 | 2.0% |
| German | 1,131 | 12.2% |
| Greek | 71 | 0.8% |
| Guatemalan | 145 | 1.6% |
| Irish | 959 | 10.4% |
| Italian | 544 | 5.9% |
| Macedonian | 7 | 0.1% |
| Mexican | 2,842 | 30.8% |
| Northern European | 61 | 0.7% |
| Norwegian | 259 | 2.8% |
| Peruvian | 75 | 0.8% |
| Polish | 39 | 0.4% |
| Puerto Rican | 50 | 0.5% |
| Russian | 36 | 0.4% |
| Scandinavian | 129 | 1.4% |
| Scotch-Irish | 37 | 0.4% |
| Scottish | 118 | 1.3% |
| Slavic | 24 | 0.3% |
| South American | 75 | 0.8% |
| Spanish | 35 | 0.4% |
| Swedish | 37 | 0.4% |
| Swiss | 114 | 1.2% | View All 34 Rows |
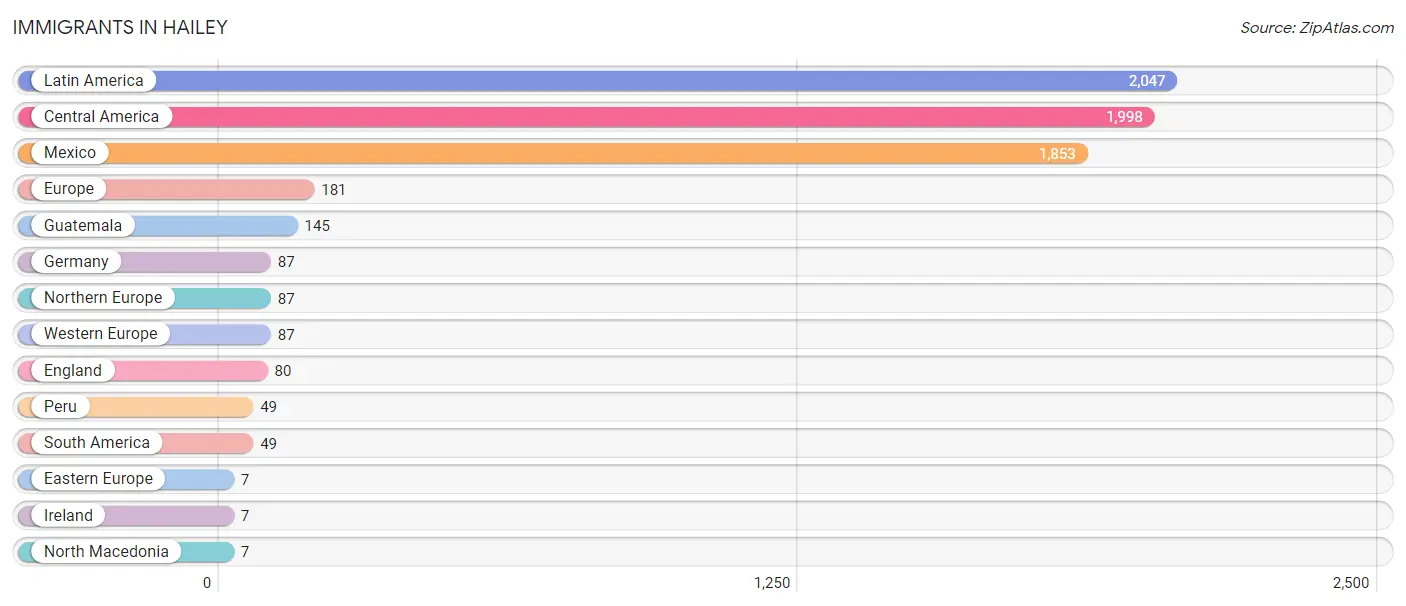
Immigrants in Hailey
The most numerous immigrant groups reported in Hailey came from Latin America (2,047 | 22.2%), Central America (1,998 | 21.6%), Mexico (1,853 | 20.1%), Europe (181 | 2.0%), and Guatemala (145 | 1.6%), together accounting for 67.4% of all Hailey residents.
| Immigration Origin | # Population | % Population |
| Central America | 1,998 | 21.6% |
| Eastern Europe | 7 | 0.1% |
| England | 80 | 0.9% |
| Europe | 181 | 2.0% |
| Germany | 87 | 0.9% |
| Guatemala | 145 | 1.6% |
| Ireland | 7 | 0.1% |
| Latin America | 2,047 | 22.2% |
| Mexico | 1,853 | 20.1% |
| North Macedonia | 7 | 0.1% |
| Northern Europe | 87 | 0.9% |
| Peru | 49 | 0.5% |
| South America | 49 | 0.5% |
| Western Europe | 87 | 0.9% | View All 14 Rows |
Sex and Age in Hailey
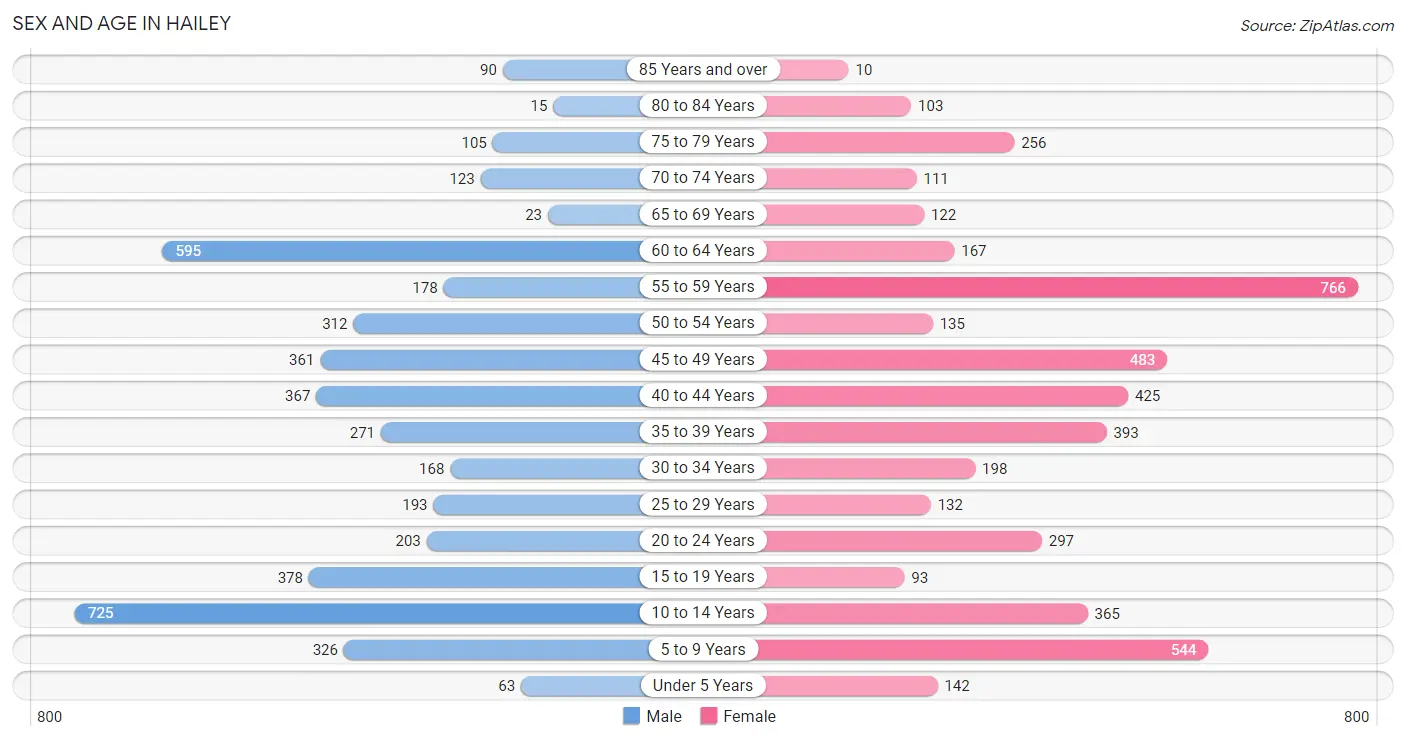
Sex and Age in Hailey
The most populous age groups in Hailey are 10 to 14 Years (725 | 16.1%) for men and 55 to 59 Years (766 | 16.2%) for women.
| Age Bracket | Male | Female |
| Under 5 Years | 63 (1.4%) | 142 (3.0%) |
| 5 to 9 Years | 326 (7.2%) | 544 (11.5%) |
| 10 to 14 Years | 725 (16.1%) | 365 (7.7%) |
| 15 to 19 Years | 378 (8.4%) | 93 (2.0%) |
| 20 to 24 Years | 203 (4.5%) | 297 (6.3%) |
| 25 to 29 Years | 193 (4.3%) | 132 (2.8%) |
| 30 to 34 Years | 168 (3.7%) | 198 (4.2%) |
| 35 to 39 Years | 271 (6.0%) | 393 (8.3%) |
| 40 to 44 Years | 367 (8.2%) | 425 (9.0%) |
| 45 to 49 Years | 361 (8.0%) | 483 (10.2%) |
| 50 to 54 Years | 312 (6.9%) | 135 (2.9%) |
| 55 to 59 Years | 178 (4.0%) | 766 (16.2%) |
| 60 to 64 Years | 595 (13.2%) | 167 (3.5%) |
| 65 to 69 Years | 23 (0.5%) | 122 (2.6%) |
| 70 to 74 Years | 123 (2.7%) | 111 (2.3%) |
| 75 to 79 Years | 105 (2.3%) | 256 (5.4%) |
| 80 to 84 Years | 15 (0.3%) | 103 (2.2%) |
| 85 Years and over | 90 (2.0%) | 10 (0.2%) |
| Total | 4,496 (100.0%) | 4,742 (100.0%) |
Families and Households in Hailey
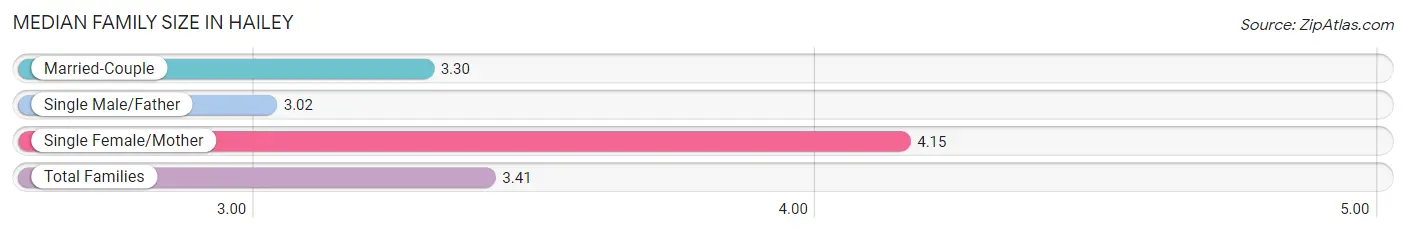
Median Family Size in Hailey
The median family size in Hailey is 3.41 persons per family, with single female/mother families (353 | 15.2%) accounting for the largest median family size of 4.15 persons per family. On the other hand, single male/father families (148 | 6.4%) represent the smallest median family size with 3.02 persons per family.
| Family Type | # Families | Family Size |
| Married-Couple | 1,814 (78.4%) | 3.30 |
| Single Male/Father | 148 (6.4%) | 3.02 |
| Single Female/Mother | 353 (15.2%) | 4.15 |
| Total Families | 2,315 (100.0%) | 3.41 |
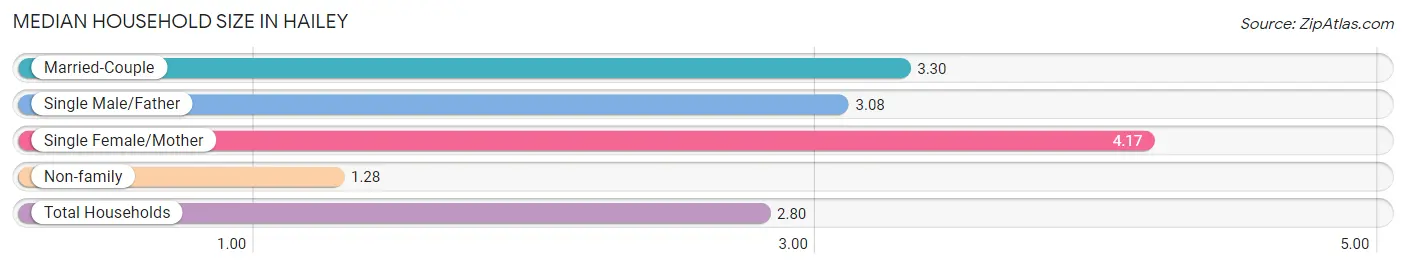
Median Household Size in Hailey
The median household size in Hailey is 2.80 persons per household, with single female/mother households (353 | 10.9%) accounting for the largest median household size of 4.17 persons per household. non-family households (935 | 28.8%) represent the smallest median household size with 1.28 persons per household.
| Household Type | # Households | Household Size |
| Married-Couple | 1,814 (55.8%) | 3.30 |
| Single Male/Father | 148 (4.5%) | 3.08 |
| Single Female/Mother | 353 (10.9%) | 4.17 |
| Non-family | 935 (28.8%) | 1.28 |
| Total Households | 3,250 (100.0%) | 2.80 |
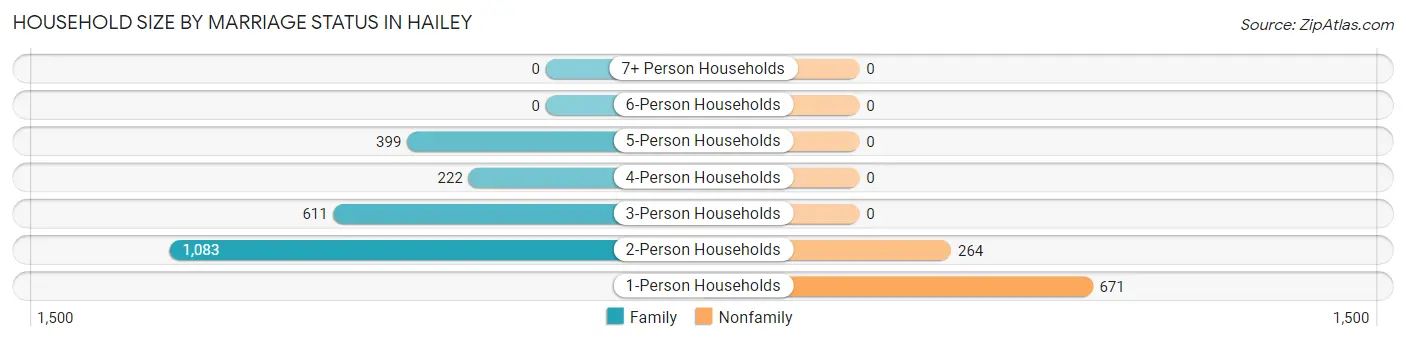
Household Size by Marriage Status in Hailey
Out of a total of 3,250 households in Hailey, 2,315 (71.2%) are family households, while 935 (28.8%) are nonfamily households. The most numerous type of family households are 2-person households, comprising 1,083, and the most common type of nonfamily households are 1-person households, comprising 671.
| Household Size | Family Households | Nonfamily Households |
| 1-Person Households | - | 671 (20.6%) |
| 2-Person Households | 1,083 (33.3%) | 264 (8.1%) |
| 3-Person Households | 611 (18.8%) | 0 (0.0%) |
| 4-Person Households | 222 (6.8%) | 0 (0.0%) |
| 5-Person Households | 399 (12.3%) | 0 (0.0%) |
| 6-Person Households | 0 (0.0%) | 0 (0.0%) |
| 7+ Person Households | 0 (0.0%) | 0 (0.0%) |
| Total | 2,315 (71.2%) | 935 (28.8%) |
Female Fertility in Hailey
Fertility by Age in Hailey
Average fertility rate in Hailey is 45.0 births per 1,000 women. Women in the age bracket of 35 to 50 years have the highest fertility rate with 48.0 births per 1,000 women. Women in the age bracket of 35 to 50 years acount for 68.5% of all women with births.
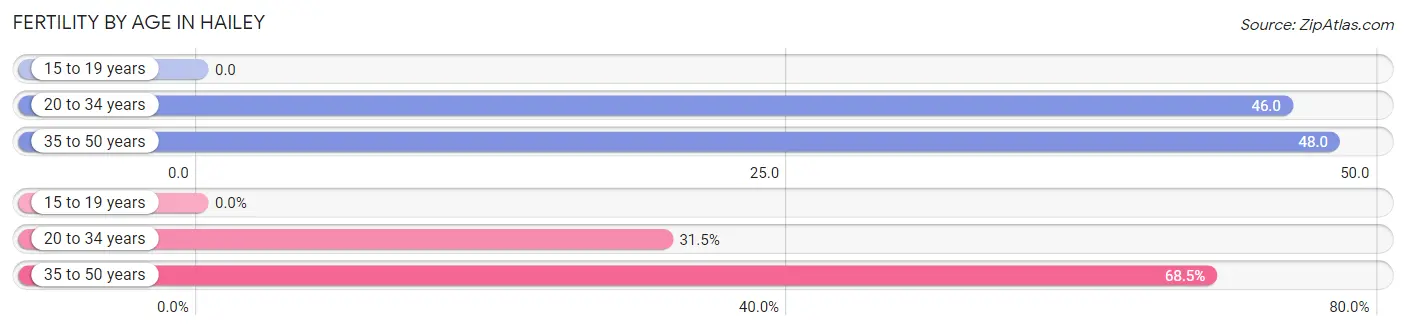
| Age Bracket | Women with Births | Births / 1,000 Women |
| 15 to 19 years | 0 (0.0%) | 0.0 |
| 20 to 34 years | 29 (31.5%) | 46.0 |
| 35 to 50 years | 63 (68.5%) | 48.0 |
| Total | 92 (100.0%) | 45.0 |
Fertility by Age by Marriage Status in Hailey
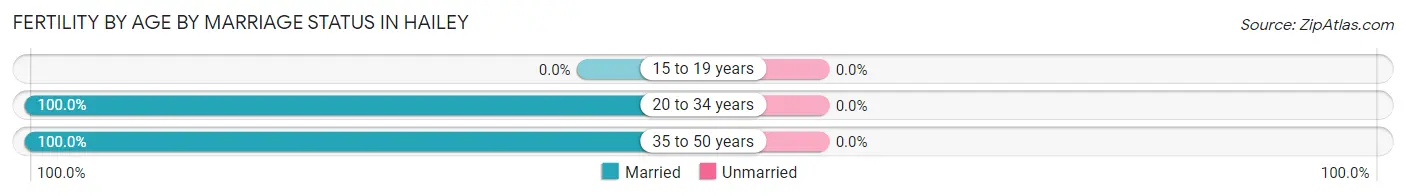
| Age Bracket | Married | Unmarried |
| 15 to 19 years | 0 (0.0%) | 0 (0.0%) |
| 20 to 34 years | 29 (100.0%) | 0 (0.0%) |
| 35 to 50 years | 63 (100.0%) | 0 (0.0%) |
| Total | 92 (100.0%) | 0 (0.0%) |
Fertility by Education in Hailey
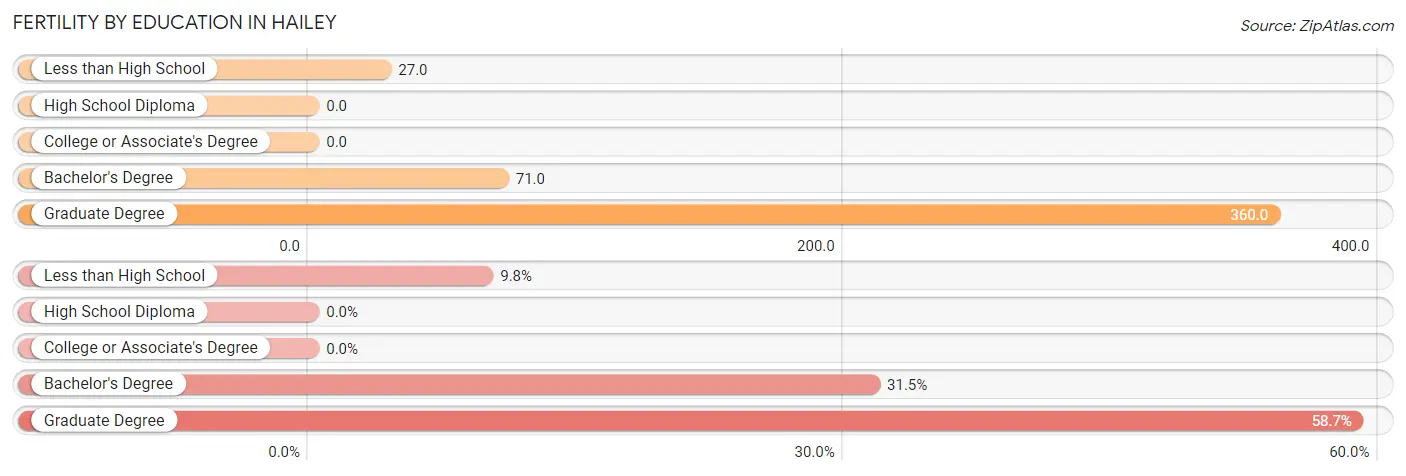
| Educational Attainment | Women with Births | Births / 1,000 Women |
| Less than High School | 9 (9.8%) | 27.0 |
| High School Diploma | 0 (0.0%) | 0.0 |
| College or Associate's Degree | 0 (0.0%) | 0.0 |
| Bachelor's Degree | 29 (31.5%) | 71.0 |
| Graduate Degree | 54 (58.7%) | 360.0 |
| Total | 92 (100.0%) | 45.0 |
Fertility by Education by Marriage Status in Hailey
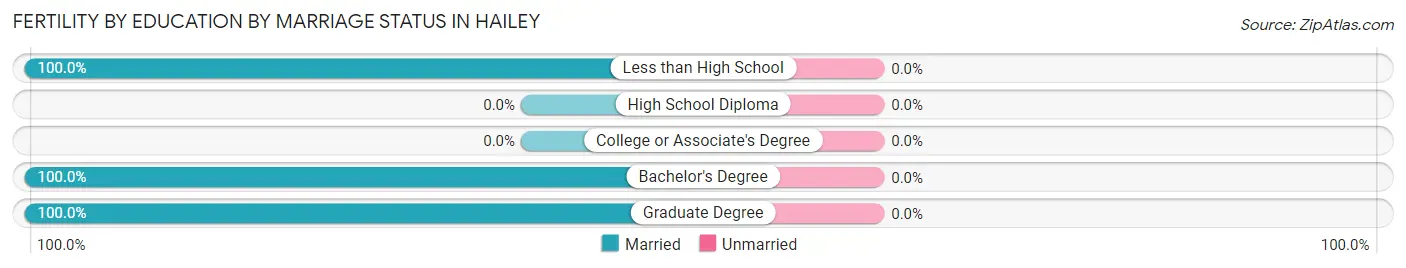
| Educational Attainment | Married | Unmarried |
| Less than High School | 9 (100.0%) | 0 (0.0%) |
| High School Diploma | 0 (0.0%) | 0 (0.0%) |
| College or Associate's Degree | 0 (0.0%) | 0 (0.0%) |
| Bachelor's Degree | 29 (100.0%) | 0 (0.0%) |
| Graduate Degree | 54 (100.0%) | 0 (0.0%) |
| Total | 92 (100.0%) | 0 (0.0%) |
Income in Hailey
Income Overview in Hailey
Per Capita Income in Hailey is $34,710, while median incomes of families and households are $81,849 and $77,035 respectively.
| Characteristic | Number | Measure |
| Per Capita Income | 9,238 | $34,710 |
| Median Family Income | 2,315 | $81,849 |
| Mean Family Income | 2,315 | $99,745 |
| Median Household Income | 3,250 | $77,035 |
| Mean Household Income | 3,250 | $93,853 |
| Income Deficit | 2,315 | $0 |
| Wage / Income Gap (%) | 9,238 | 11.05% |
| Wage / Income Gap ($) | 9,238 | 88.95¢ per $1 |
| Gini / Inequality Index | 9,238 | 0.38 |
Earnings by Sex in Hailey
Average Earnings in Hailey are $39,207, $42,377 for men and $37,695 for women, a difference of 11.1%.
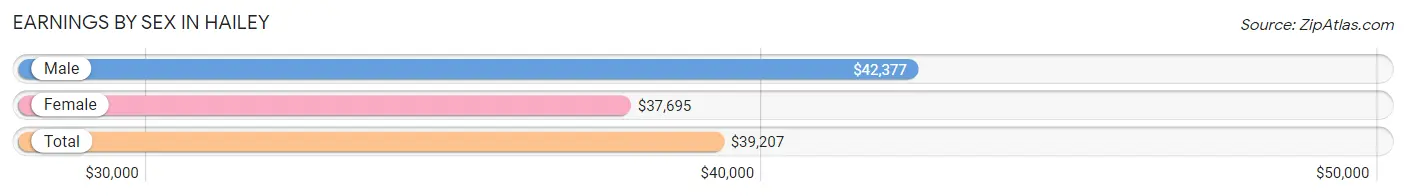
| Sex | Number | Average Earnings |
| Male | 2,936 (54.5%) | $42,377 |
| Female | 2,448 (45.5%) | $37,695 |
| Total | 5,384 (100.0%) | $39,207 |
Earnings by Sex by Income Bracket in Hailey
The most common earnings brackets in Hailey are $75,000 to $99,999 for men (500 | 17.0%) and $65,000 to $74,999 for women (305 | 12.5%).
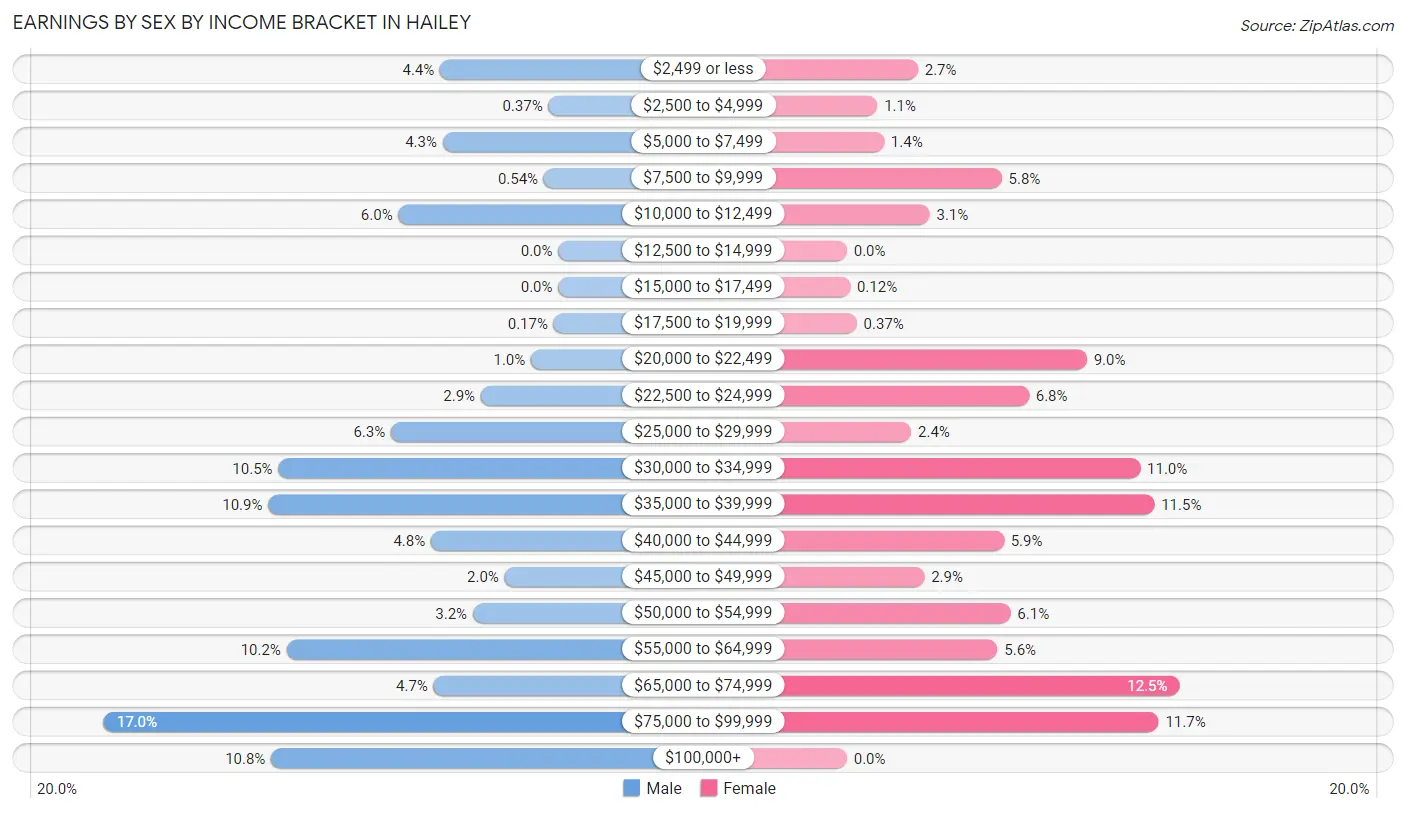
| Income | Male | Female |
| $2,499 or less | 130 (4.4%) | 65 (2.7%) |
| $2,500 to $4,999 | 11 (0.4%) | 28 (1.1%) |
| $5,000 to $7,499 | 127 (4.3%) | 34 (1.4%) |
| $7,500 to $9,999 | 16 (0.5%) | 142 (5.8%) |
| $10,000 to $12,499 | 176 (6.0%) | 76 (3.1%) |
| $12,500 to $14,999 | 0 (0.0%) | 0 (0.0%) |
| $15,000 to $17,499 | 0 (0.0%) | 3 (0.1%) |
| $17,500 to $19,999 | 5 (0.2%) | 9 (0.4%) |
| $20,000 to $22,499 | 30 (1.0%) | 220 (9.0%) |
| $22,500 to $24,999 | 85 (2.9%) | 167 (6.8%) |
| $25,000 to $29,999 | 184 (6.3%) | 59 (2.4%) |
| $30,000 to $34,999 | 308 (10.5%) | 269 (11.0%) |
| $35,000 to $39,999 | 319 (10.9%) | 282 (11.5%) |
| $40,000 to $44,999 | 140 (4.8%) | 144 (5.9%) |
| $45,000 to $49,999 | 59 (2.0%) | 71 (2.9%) |
| $50,000 to $54,999 | 94 (3.2%) | 150 (6.1%) |
| $55,000 to $64,999 | 299 (10.2%) | 138 (5.6%) |
| $65,000 to $74,999 | 137 (4.7%) | 305 (12.5%) |
| $75,000 to $99,999 | 500 (17.0%) | 286 (11.7%) |
| $100,000+ | 316 (10.8%) | 0 (0.0%) |
| Total | 2,936 (100.0%) | 2,448 (100.0%) |
Earnings by Sex by Educational Attainment in Hailey
Average earnings in Hailey are $54,342 for men and $41,128 for women, a difference of 24.3%. Men with an educational attainment of graduate degree enjoy the highest average annual earnings of $100,758, while those with high school diploma education earn the least with $36,921. Women with an educational attainment of bachelor's degree earn the most with the average annual earnings of $59,196, while those with college or associate's degree education have the smallest earnings of $36,901.
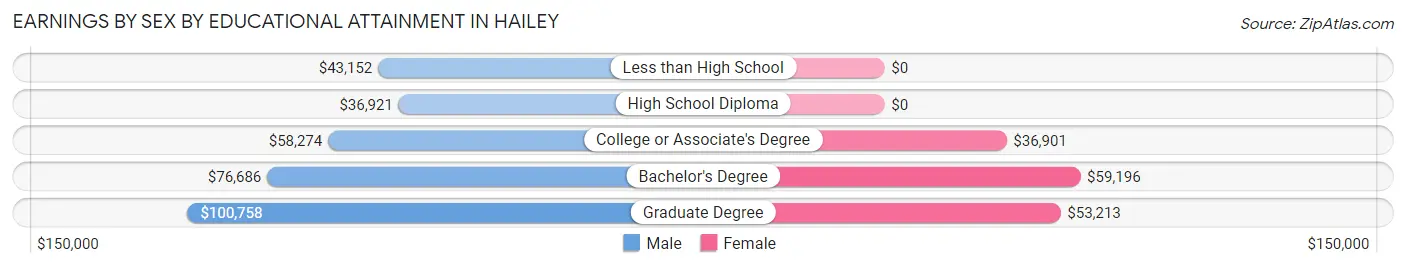
| Educational Attainment | Male Income | Female Income |
| Less than High School | $43,152 | $0 |
| High School Diploma | $36,921 | $0 |
| College or Associate's Degree | $58,274 | $36,901 |
| Bachelor's Degree | $76,686 | $59,196 |
| Graduate Degree | $100,758 | $53,213 |
| Total | $54,342 | $41,128 |
Family Income in Hailey
Family Income Brackets in Hailey
According to the Hailey family income data, there are 595 families falling into the $50,000 to $74,999 income range, which is the most common income bracket and makes up 25.7% of all families.
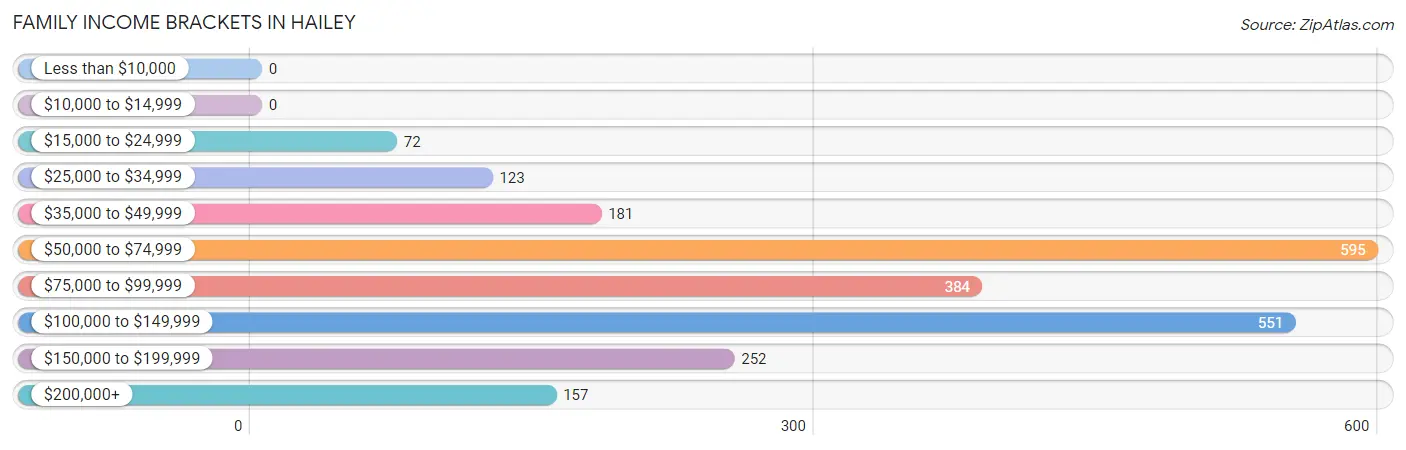
| Income Bracket | # Families | % Families |
| Less than $10,000 | 0 | 0.0% |
| $10,000 to $14,999 | 0 | 0.0% |
| $15,000 to $24,999 | 72 | 3.1% |
| $25,000 to $34,999 | 123 | 5.3% |
| $35,000 to $49,999 | 181 | 7.8% |
| $50,000 to $74,999 | 595 | 25.7% |
| $75,000 to $99,999 | 384 | 16.6% |
| $100,000 to $149,999 | 551 | 23.8% |
| $150,000 to $199,999 | 252 | 10.9% |
| $200,000+ | 157 | 6.8% |
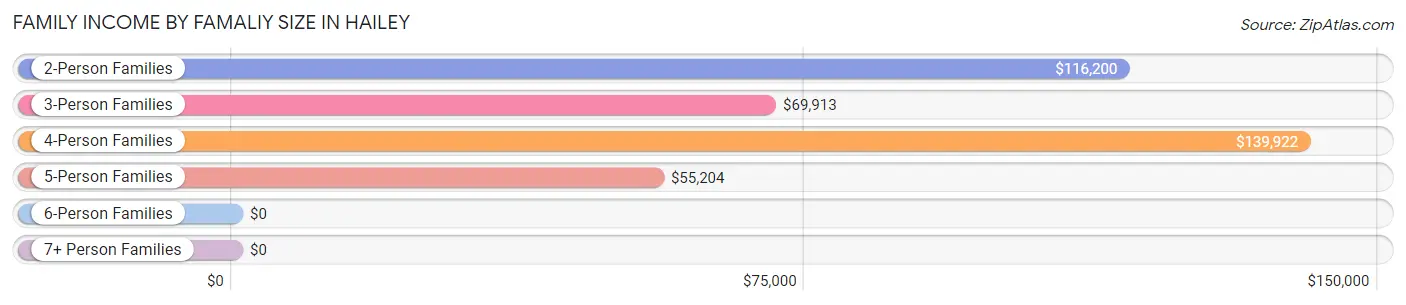
Family Income by Famaliy Size in Hailey
4-person families (202 | 8.7%) account for the highest median family income in Hailey with $139,922 per family, while 2-person families (1,083 | 46.8%) have the highest median income of $58,100 per family member.
| Income Bracket | # Families | Median Income |
| 2-Person Families | 1,083 (46.8%) | $116,200 |
| 3-Person Families | 631 (27.3%) | $69,913 |
| 4-Person Families | 202 (8.7%) | $139,922 |
| 5-Person Families | 399 (17.2%) | $55,204 |
| 6-Person Families | 0 (0.0%) | $0 |
| 7+ Person Families | 0 (0.0%) | $0 |
| Total | 2,315 (100.0%) | $81,849 |
Family Income by Number of Earners in Hailey
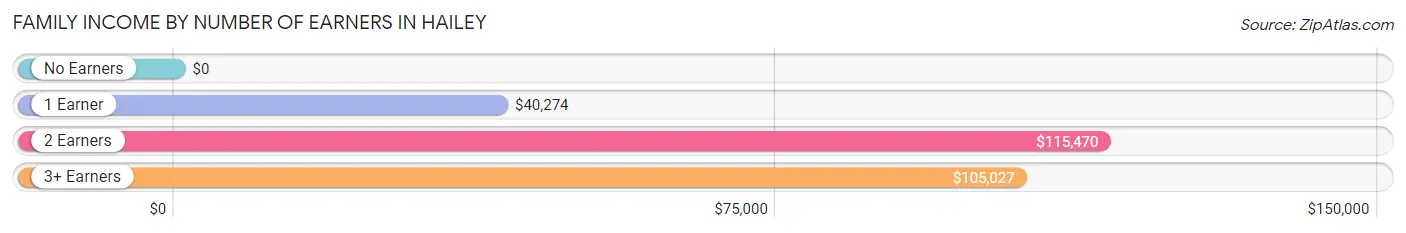
| Number of Earners | # Families | Median Income |
| No Earners | 156 (6.7%) | $0 |
| 1 Earner | 490 (21.2%) | $40,274 |
| 2 Earners | 1,554 (67.1%) | $115,470 |
| 3+ Earners | 115 (5.0%) | $105,027 |
| Total | 2,315 (100.0%) | $81,849 |
Household Income in Hailey
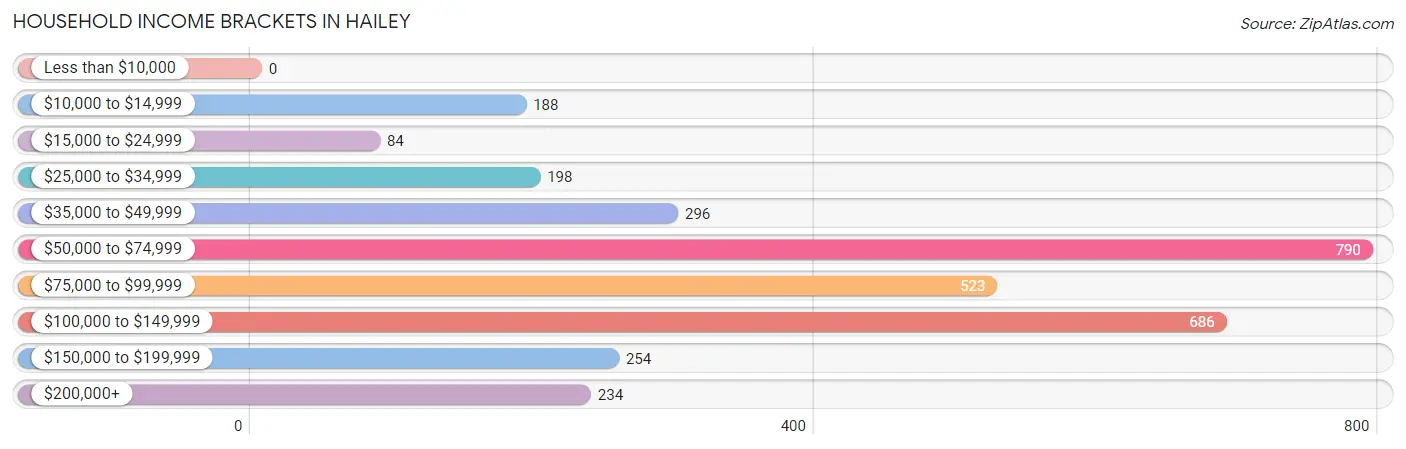
Household Income Brackets in Hailey
With 790 households falling in the category, the $50,000 to $74,999 income range is the most frequent in Hailey, accounting for 24.3% of all households.
| Income Bracket | # Households | % Households |
| Less than $10,000 | 0 | 0.0% |
| $10,000 to $14,999 | 188 | 5.8% |
| $15,000 to $24,999 | 84 | 2.6% |
| $25,000 to $34,999 | 198 | 6.1% |
| $35,000 to $49,999 | 296 | 9.1% |
| $50,000 to $74,999 | 790 | 24.3% |
| $75,000 to $99,999 | 523 | 16.1% |
| $100,000 to $149,999 | 686 | 21.1% |
| $150,000 to $199,999 | 254 | 7.8% |
| $200,000+ | 234 | 7.2% |
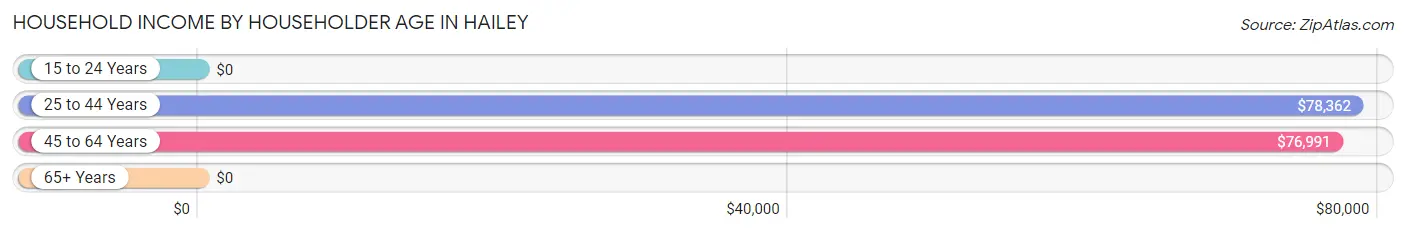
Household Income by Householder Age in Hailey
The median household income in Hailey is $77,035, with the highest median household income of $78,362 found in the 25 to 44 years age bracket for the primary householder. A total of 1,114 households (34.3%) fall into this category. Meanwhile, the 15 to 24 years age bracket for the primary householder has the lowest median household income of $0, with 50 households (1.5%) in this group.
| Income Bracket | # Households | Median Income |
| 15 to 24 Years | 50 (1.5%) | $0 |
| 25 to 44 Years | 1,114 (34.3%) | $78,362 |
| 45 to 64 Years | 1,487 (45.8%) | $76,991 |
| 65+ Years | 599 (18.4%) | $0 |
| Total | 3,250 (100.0%) | $77,035 |
Poverty in Hailey
Income Below Poverty by Sex and Age in Hailey
With 6.6% poverty level for males and 8.6% for females among the residents of Hailey, 25 to 34 year old males and 5 year old females are the most vulnerable to poverty, with 111 males (30.7%) and 70 females (89.7%) in their respective age groups living below the poverty level.
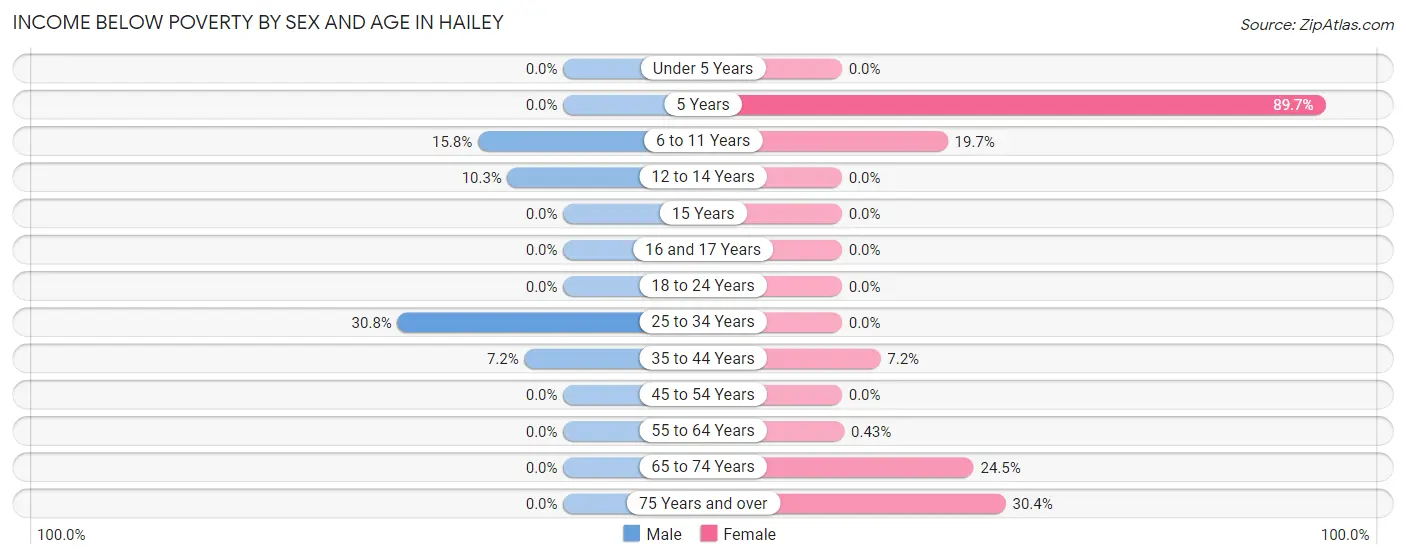
| Age Bracket | Male | Female |
| Under 5 Years | 0 (0.0%) | 0 (0.0%) |
| 5 Years | 0 (0.0%) | 70 (89.7%) |
| 6 to 11 Years | 79 (15.8%) | 112 (19.7%) |
| 12 to 14 Years | 57 (10.3%) | 0 (0.0%) |
| 15 Years | 0 (0.0%) | 0 (0.0%) |
| 16 and 17 Years | 0 (0.0%) | 0 (0.0%) |
| 18 to 24 Years | 0 (0.0%) | 0 (0.0%) |
| 25 to 34 Years | 111 (30.7%) | 0 (0.0%) |
| 35 to 44 Years | 46 (7.2%) | 58 (7.2%) |
| 45 to 54 Years | 0 (0.0%) | 0 (0.0%) |
| 55 to 64 Years | 0 (0.0%) | 4 (0.4%) |
| 65 to 74 Years | 0 (0.0%) | 57 (24.5%) |
| 75 Years and over | 0 (0.0%) | 107 (30.4%) |
| Total | 293 (6.6%) | 408 (8.6%) |
Income Above Poverty by Sex and Age in Hailey
According to the poverty statistics in Hailey, males aged under 5 years and females aged under 5 years are the age groups that are most secure financially, with 100.0% of males and 100.0% of females in these age groups living above the poverty line.
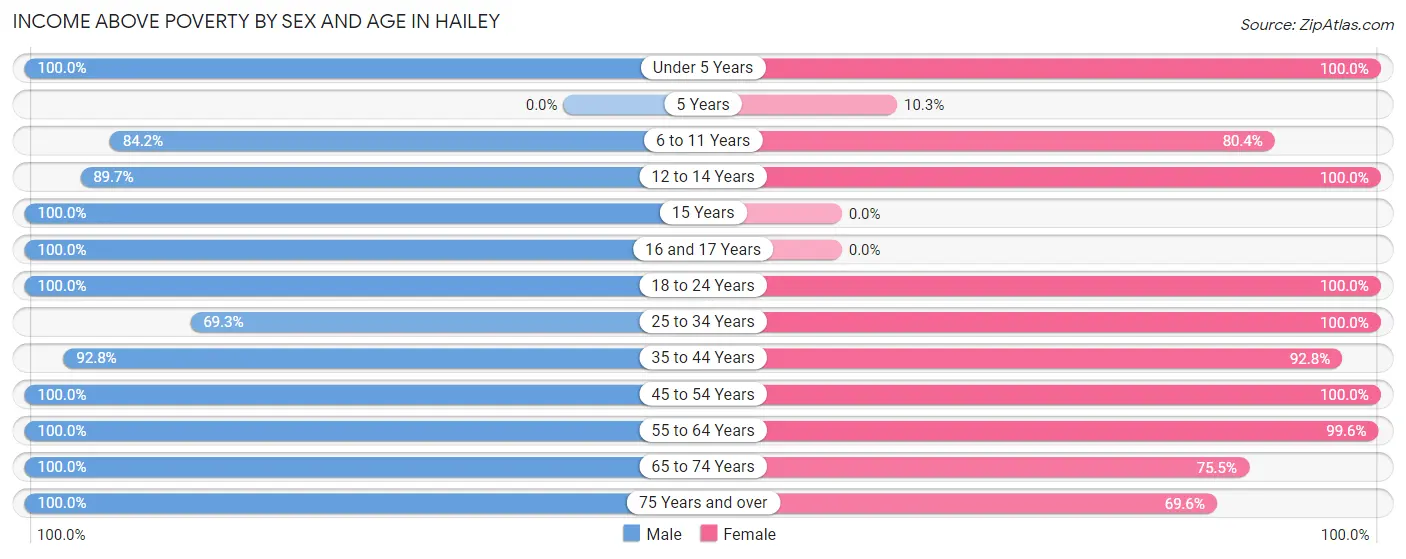
| Age Bracket | Male | Female |
| Under 5 Years | 63 (100.0%) | 142 (100.0%) |
| 5 Years | 0 (0.0%) | 8 (10.3%) |
| 6 to 11 Years | 420 (84.2%) | 458 (80.3%) |
| 12 to 14 Years | 495 (89.7%) | 261 (100.0%) |
| 15 Years | 31 (100.0%) | 0 (0.0%) |
| 16 and 17 Years | 347 (100.0%) | 0 (0.0%) |
| 18 to 24 Years | 203 (100.0%) | 390 (100.0%) |
| 25 to 34 Years | 250 (69.3%) | 330 (100.0%) |
| 35 to 44 Years | 592 (92.8%) | 752 (92.8%) |
| 45 to 54 Years | 666 (100.0%) | 618 (100.0%) |
| 55 to 64 Years | 770 (100.0%) | 929 (99.6%) |
| 65 to 74 Years | 139 (100.0%) | 176 (75.5%) |
| 75 Years and over | 202 (100.0%) | 245 (69.6%) |
| Total | 4,178 (93.4%) | 4,309 (91.3%) |
Income Below Poverty Among Married-Couple Families in Hailey
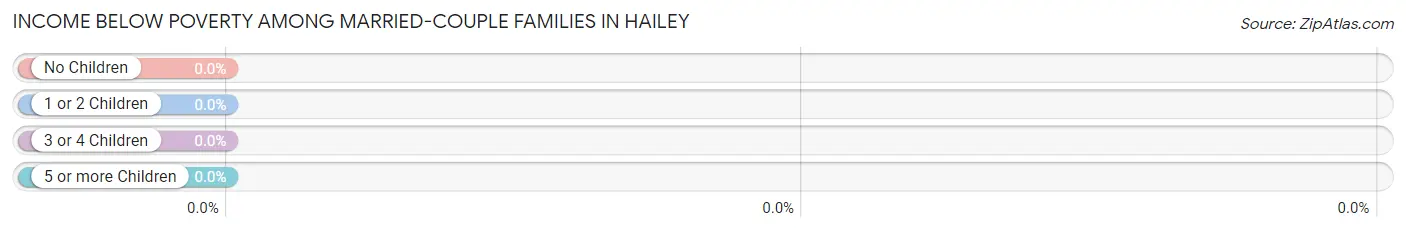
| Children | Above Poverty | Below Poverty |
| No Children | 1,088 (100.0%) | 0 (0.0%) |
| 1 or 2 Children | 434 (100.0%) | 0 (0.0%) |
| 3 or 4 Children | 292 (100.0%) | 0 (0.0%) |
| 5 or more Children | 0 (0.0%) | 0 (0.0%) |
| Total | 1,814 (100.0%) | 0 (0.0%) |
Income Below Poverty Among Single-Parent Households in Hailey
According to the poverty data in Hailey, 31.1% or 46 single-father households and 16.4% or 58 single-mother households are living below the poverty line. Among single-father households, those with 3 or 4 children have the highest poverty rate, with 46 households (100.0%) experiencing poverty. Likewise, among single-mother households, those with 1 or 2 children have the highest poverty rate, with 58 households (18.0%) falling below the poverty line.
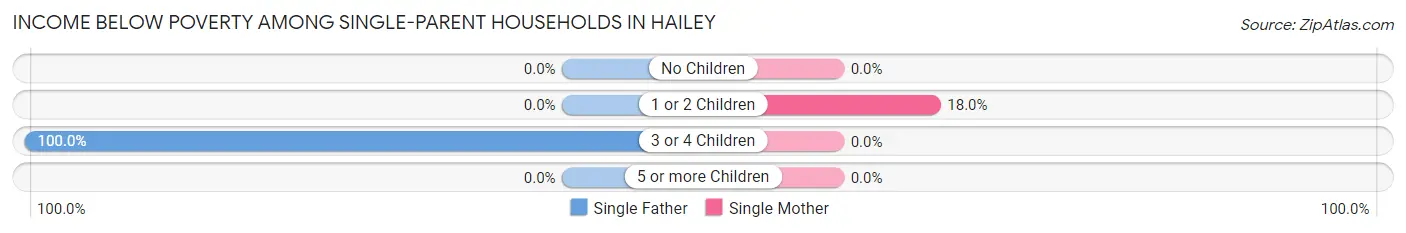
| Children | Single Father | Single Mother |
| No Children | 0 (0.0%) | 0 (0.0%) |
| 1 or 2 Children | 0 (0.0%) | 58 (18.0%) |
| 3 or 4 Children | 46 (100.0%) | 0 (0.0%) |
| 5 or more Children | 0 (0.0%) | 0 (0.0%) |
| Total | 46 (31.1%) | 58 (16.4%) |
Income Below Poverty Among Married-Couple vs Single-Parent Households in Hailey
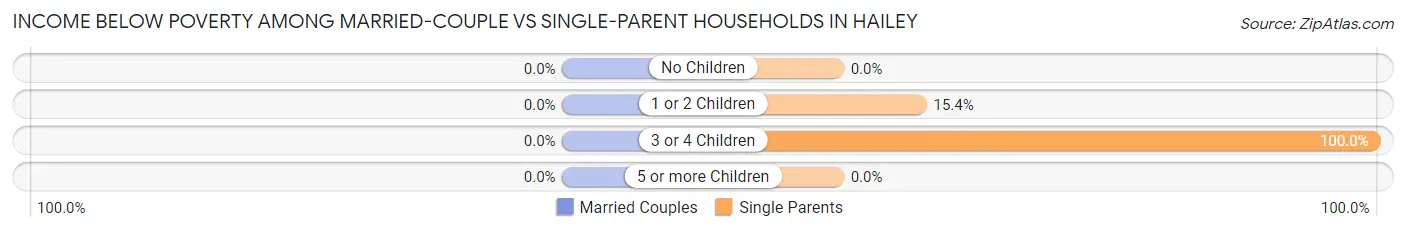
| Children | Married-Couple Families | Single-Parent Households |
| No Children | 0 (0.0%) | 0 (0.0%) |
| 1 or 2 Children | 0 (0.0%) | 58 (15.4%) |
| 3 or 4 Children | 0 (0.0%) | 46 (100.0%) |
| 5 or more Children | 0 (0.0%) | 0 (0.0%) |
| Total | 0 (0.0%) | 104 (20.8%) |
Employment Characteristics in Hailey
Employment by Class of Employer in Hailey
Among the 4,982 employed individuals in Hailey, private company employees (3,316 | 66.6%), local government employees (648 | 13.0%), and self-employed (incorporated) (481 | 9.7%) make up the most common classes of employment.
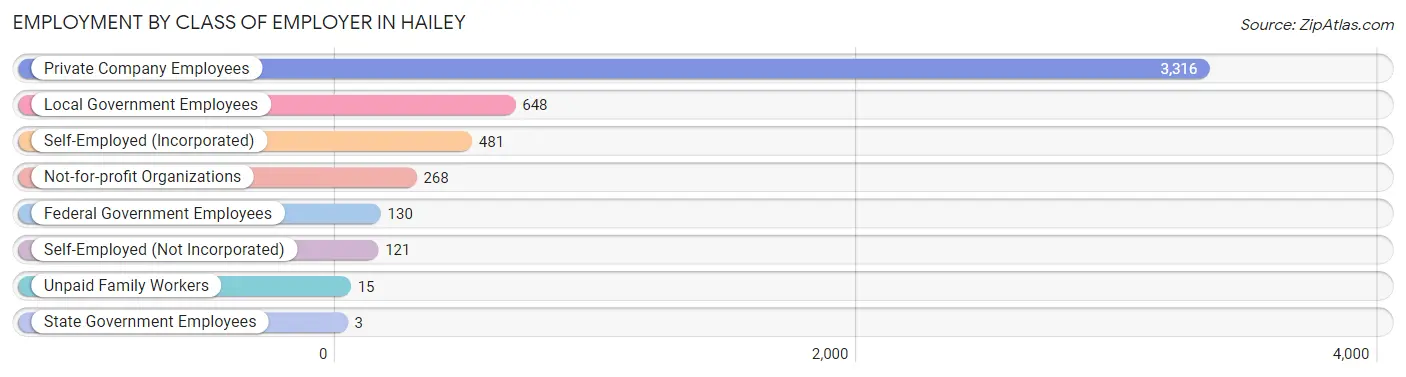
| Employer Class | # Employees | % Employees |
| Private Company Employees | 3,316 | 66.6% |
| Self-Employed (Incorporated) | 481 | 9.7% |
| Self-Employed (Not Incorporated) | 121 | 2.4% |
| Not-for-profit Organizations | 268 | 5.4% |
| Local Government Employees | 648 | 13.0% |
| State Government Employees | 3 | 0.1% |
| Federal Government Employees | 130 | 2.6% |
| Unpaid Family Workers | 15 | 0.3% |
| Total | 4,982 | 100.0% |
Employment Status by Age in Hailey
According to the labor force statistics for Hailey, out of the total population over 16 years of age (7,042), 76.5% or 5,387 individuals are in the labor force, with 3.2% or 172 of them unemployed. The age group with the highest labor force participation rate is 25 to 29 years, with 100.0% or 325 individuals in the labor force. Within the labor force, the 45 to 54 years age range has the highest percentage of unemployed individuals, with 9.1% or 107 of them being unemployed.
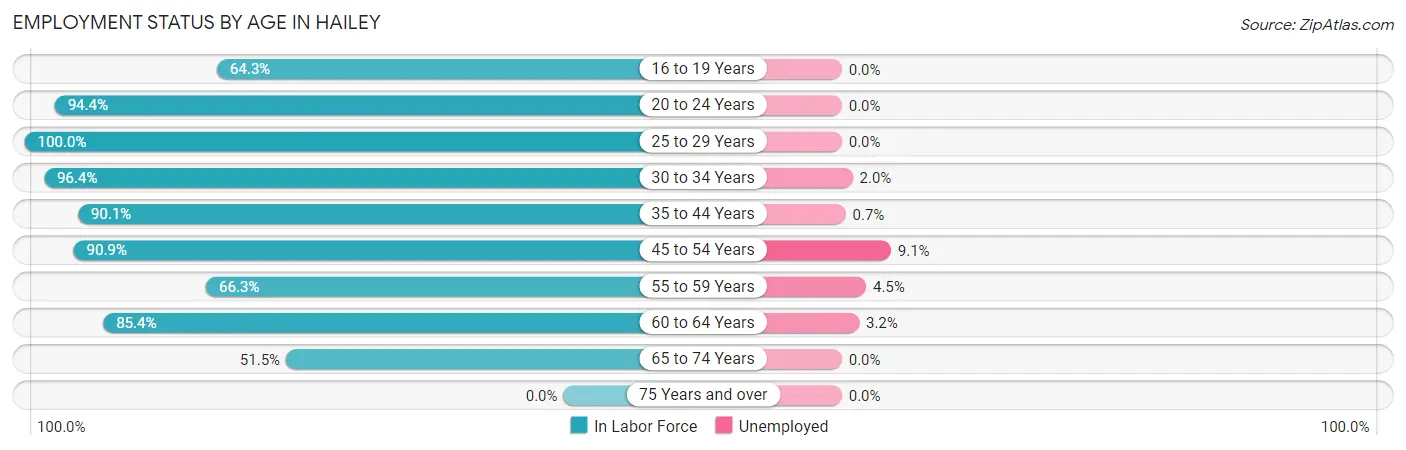
| Age Bracket | In Labor Force | Unemployed |
| 16 to 19 Years | 283 (64.3%) | 0 (0.0%) |
| 20 to 24 Years | 472 (94.4%) | 0 (0.0%) |
| 25 to 29 Years | 325 (100.0%) | 0 (0.0%) |
| 30 to 34 Years | 353 (96.4%) | 7 (2.0%) |
| 35 to 44 Years | 1,312 (90.1%) | 9 (0.7%) |
| 45 to 54 Years | 1,174 (90.9%) | 107 (9.1%) |
| 55 to 59 Years | 626 (66.3%) | 28 (4.5%) |
| 60 to 64 Years | 651 (85.4%) | 21 (3.2%) |
| 65 to 74 Years | 195 (51.5%) | 0 (0.0%) |
| 75 Years and over | 0 (0.0%) | 0 (0.0%) |
| Total | 5,387 (76.5%) | 172 (3.2%) |
Employment Status by Educational Attainment in Hailey
According to labor force statistics for Hailey, 86.3% of individuals (4,439) out of the total population between 25 and 64 years of age (5,144) are in the labor force, with 3.9% or 173 of them being unemployed. The group with the highest labor force participation rate are those with the educational attainment of bachelor's degree or higher, with 93.0% or 1,740 individuals in the labor force. Within the labor force, individuals with high school diploma education have the highest percentage of unemployment, with 10.1% or 135 of them being unemployed.
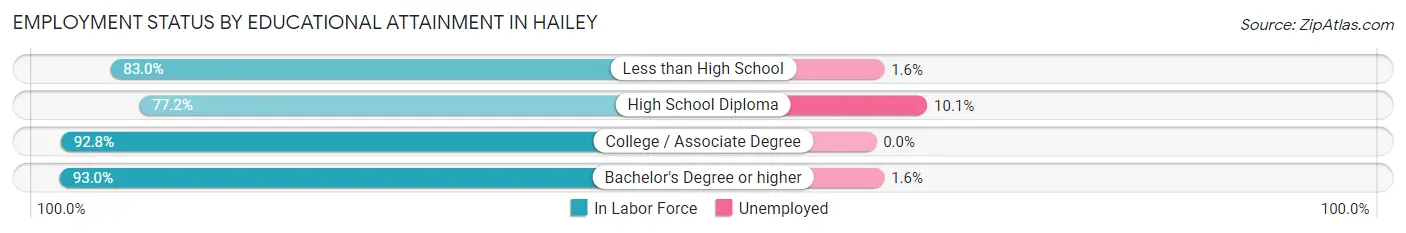
| Educational Attainment | In Labor Force | Unemployed |
| Less than High School | 570 (83.0%) | 11 (1.6%) |
| High School Diploma | 1,335 (77.2%) | 175 (10.1%) |
| College / Associate Degree | 795 (92.8%) | 0 (0.0%) |
| Bachelor's Degree or higher | 1,740 (93.0%) | 30 (1.6%) |
| Total | 4,439 (86.3%) | 201 (3.9%) |
Employment Occupations by Sex in Hailey
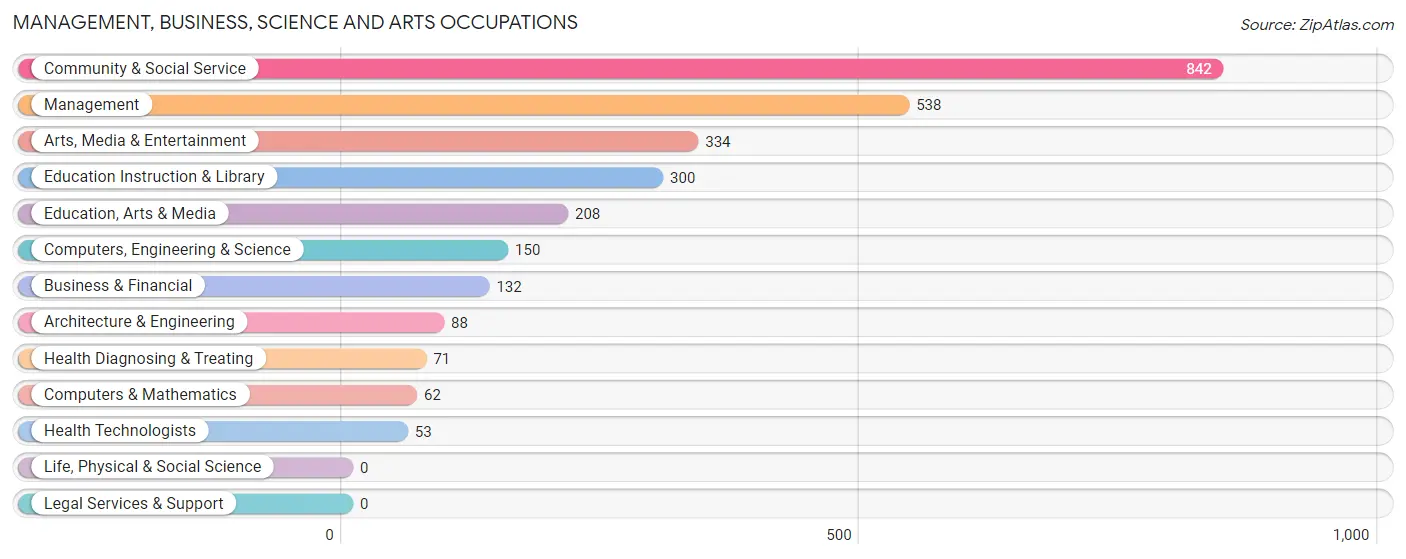
Management, Business, Science and Arts Occupations
The most common Management, Business, Science and Arts occupations in Hailey are Community & Social Service (842 | 16.1%), Management (538 | 10.3%), Arts, Media & Entertainment (334 | 6.4%), Education Instruction & Library (300 | 5.8%), and Education, Arts & Media (208 | 4.0%).
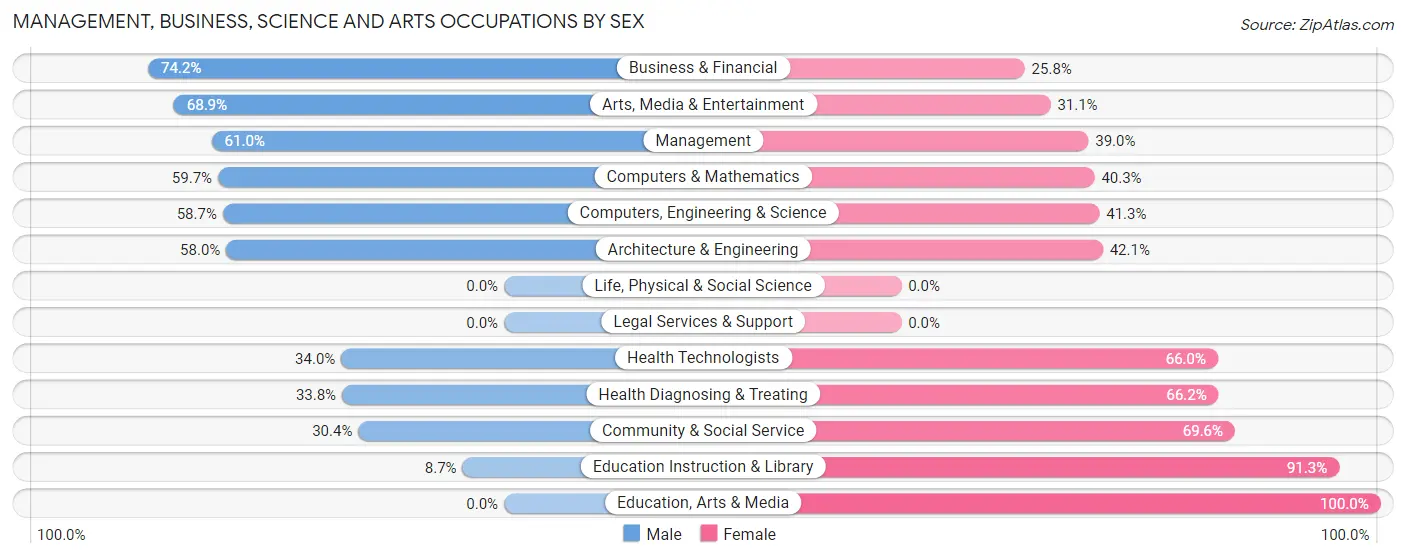
Management, Business, Science and Arts Occupations by Sex
Within the Management, Business, Science and Arts occupations in Hailey, the most male-oriented occupations are Business & Financial (74.2%), Arts, Media & Entertainment (68.9%), and Management (61.0%), while the most female-oriented occupations are Education, Arts & Media (100.0%), Education Instruction & Library (91.3%), and Community & Social Service (69.6%).
| Occupation | Male | Female |
| Management | 328 (61.0%) | 210 (39.0%) |
| Business & Financial | 98 (74.2%) | 34 (25.8%) |
| Computers, Engineering & Science | 88 (58.7%) | 62 (41.3%) |
| Computers & Mathematics | 37 (59.7%) | 25 (40.3%) |
| Architecture & Engineering | 51 (58.0%) | 37 (42.0%) |
| Life, Physical & Social Science | 0 (0.0%) | 0 (0.0%) |
| Community & Social Service | 256 (30.4%) | 586 (69.6%) |
| Education, Arts & Media | 0 (0.0%) | 208 (100.0%) |
| Legal Services & Support | 0 (0.0%) | 0 (0.0%) |
| Education Instruction & Library | 26 (8.7%) | 274 (91.3%) |
| Arts, Media & Entertainment | 230 (68.9%) | 104 (31.1%) |
| Health Diagnosing & Treating | 24 (33.8%) | 47 (66.2%) |
| Health Technologists | 18 (34.0%) | 35 (66.0%) |
| Total (Category) | 794 (45.8%) | 939 (54.2%) |
| Total (Overall) | 2,833 (54.3%) | 2,385 (45.7%) |
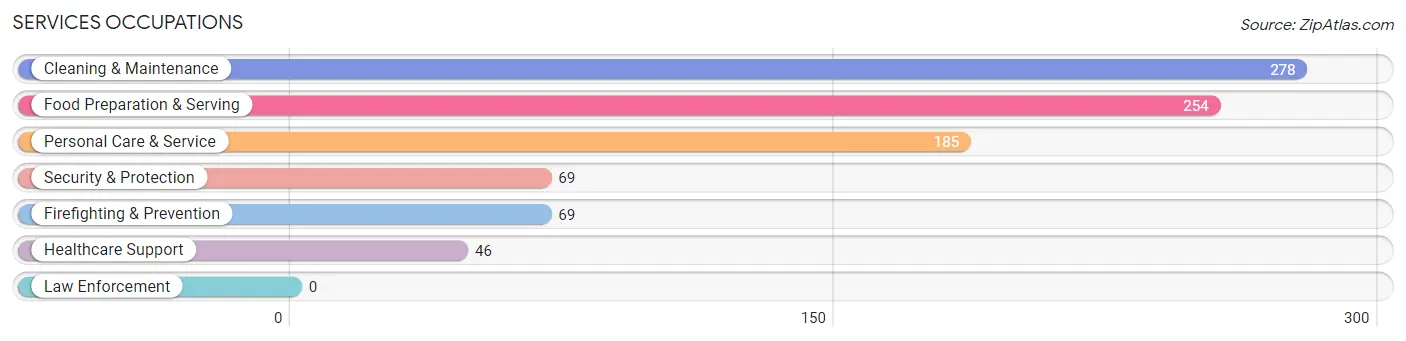
Services Occupations
The most common Services occupations in Hailey are Cleaning & Maintenance (278 | 5.3%), Food Preparation & Serving (254 | 4.9%), Personal Care & Service (185 | 3.5%), Security & Protection (69 | 1.3%), and Firefighting & Prevention (69 | 1.3%).
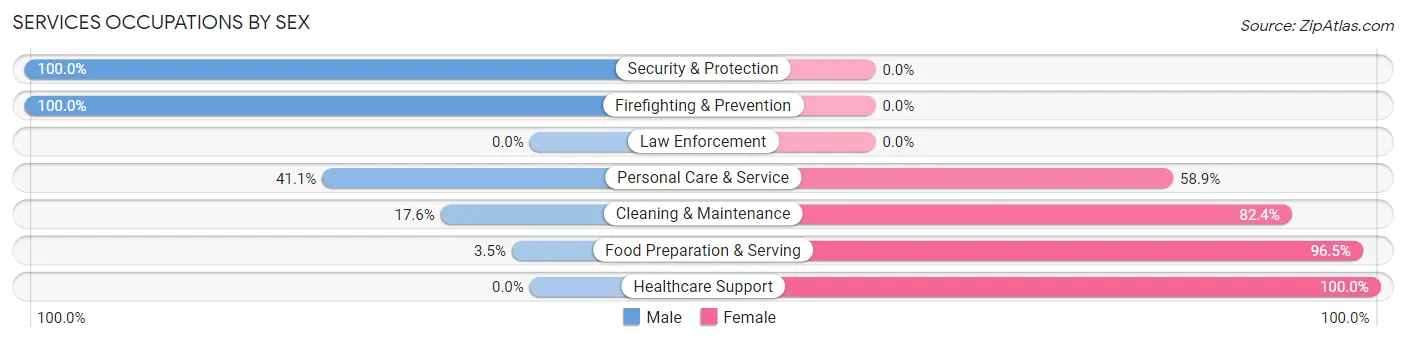
Services Occupations by Sex
Within the Services occupations in Hailey, the most male-oriented occupations are Security & Protection (100.0%), Firefighting & Prevention (100.0%), and Personal Care & Service (41.1%), while the most female-oriented occupations are Healthcare Support (100.0%), Food Preparation & Serving (96.5%), and Cleaning & Maintenance (82.4%).
| Occupation | Male | Female |
| Healthcare Support | 0 (0.0%) | 46 (100.0%) |
| Security & Protection | 69 (100.0%) | 0 (0.0%) |
| Firefighting & Prevention | 69 (100.0%) | 0 (0.0%) |
| Law Enforcement | 0 (0.0%) | 0 (0.0%) |
| Food Preparation & Serving | 9 (3.5%) | 245 (96.5%) |
| Cleaning & Maintenance | 49 (17.6%) | 229 (82.4%) |
| Personal Care & Service | 76 (41.1%) | 109 (58.9%) |
| Total (Category) | 203 (24.4%) | 629 (75.6%) |
| Total (Overall) | 2,833 (54.3%) | 2,385 (45.7%) |
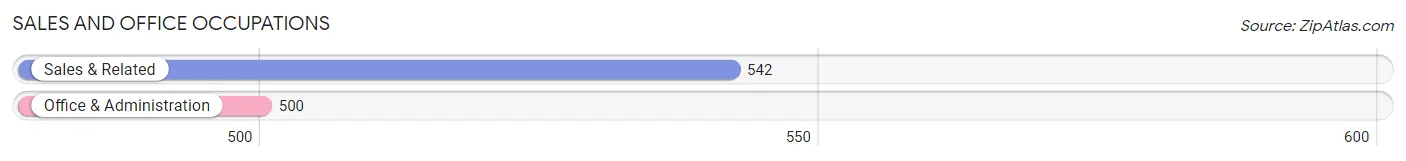
Sales and Office Occupations
The most common Sales and Office occupations in Hailey are Sales & Related (542 | 10.4%), and Office & Administration (500 | 9.6%).
Sales and Office Occupations by Sex
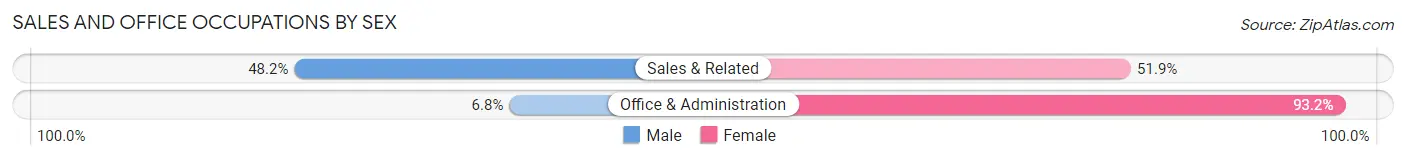
| Occupation | Male | Female |
| Sales & Related | 261 (48.1%) | 281 (51.8%) |
| Office & Administration | 34 (6.8%) | 466 (93.2%) |
| Total (Category) | 295 (28.3%) | 747 (71.7%) |
| Total (Overall) | 2,833 (54.3%) | 2,385 (45.7%) |
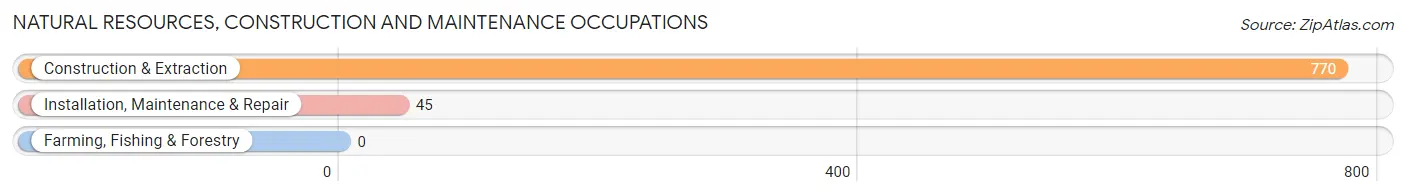
Natural Resources, Construction and Maintenance Occupations
The most common Natural Resources, Construction and Maintenance occupations in Hailey are Construction & Extraction (770 | 14.8%), and Installation, Maintenance & Repair (45 | 0.9%).
Natural Resources, Construction and Maintenance Occupations by Sex
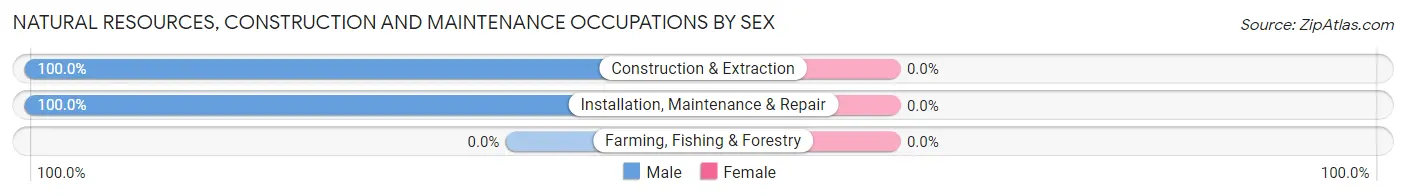
| Occupation | Male | Female |
| Farming, Fishing & Forestry | 0 (0.0%) | 0 (0.0%) |
| Construction & Extraction | 770 (100.0%) | 0 (0.0%) |
| Installation, Maintenance & Repair | 45 (100.0%) | 0 (0.0%) |
| Total (Category) | 815 (100.0%) | 0 (0.0%) |
| Total (Overall) | 2,833 (54.3%) | 2,385 (45.7%) |
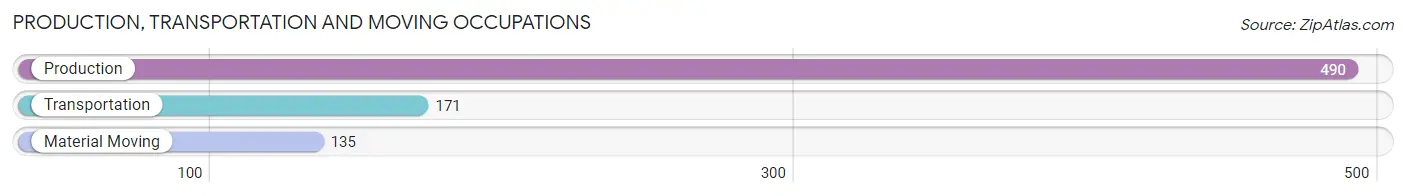
Production, Transportation and Moving Occupations
The most common Production, Transportation and Moving occupations in Hailey are Production (490 | 9.4%), Transportation (171 | 3.3%), and Material Moving (135 | 2.6%).
Production, Transportation and Moving Occupations by Sex
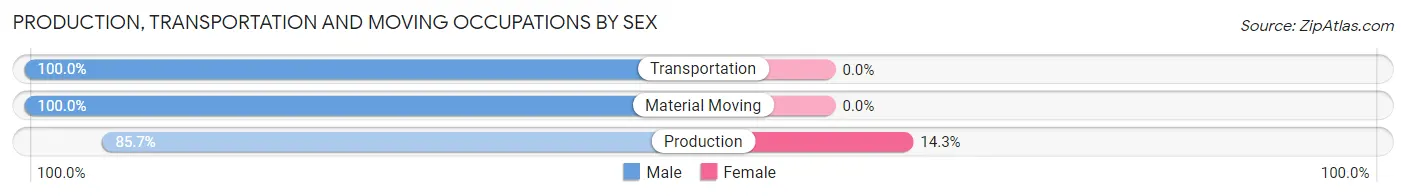
| Occupation | Male | Female |
| Production | 420 (85.7%) | 70 (14.3%) |
| Transportation | 171 (100.0%) | 0 (0.0%) |
| Material Moving | 135 (100.0%) | 0 (0.0%) |
| Total (Category) | 726 (91.2%) | 70 (8.8%) |
| Total (Overall) | 2,833 (54.3%) | 2,385 (45.7%) |
Employment Industries by Sex in Hailey
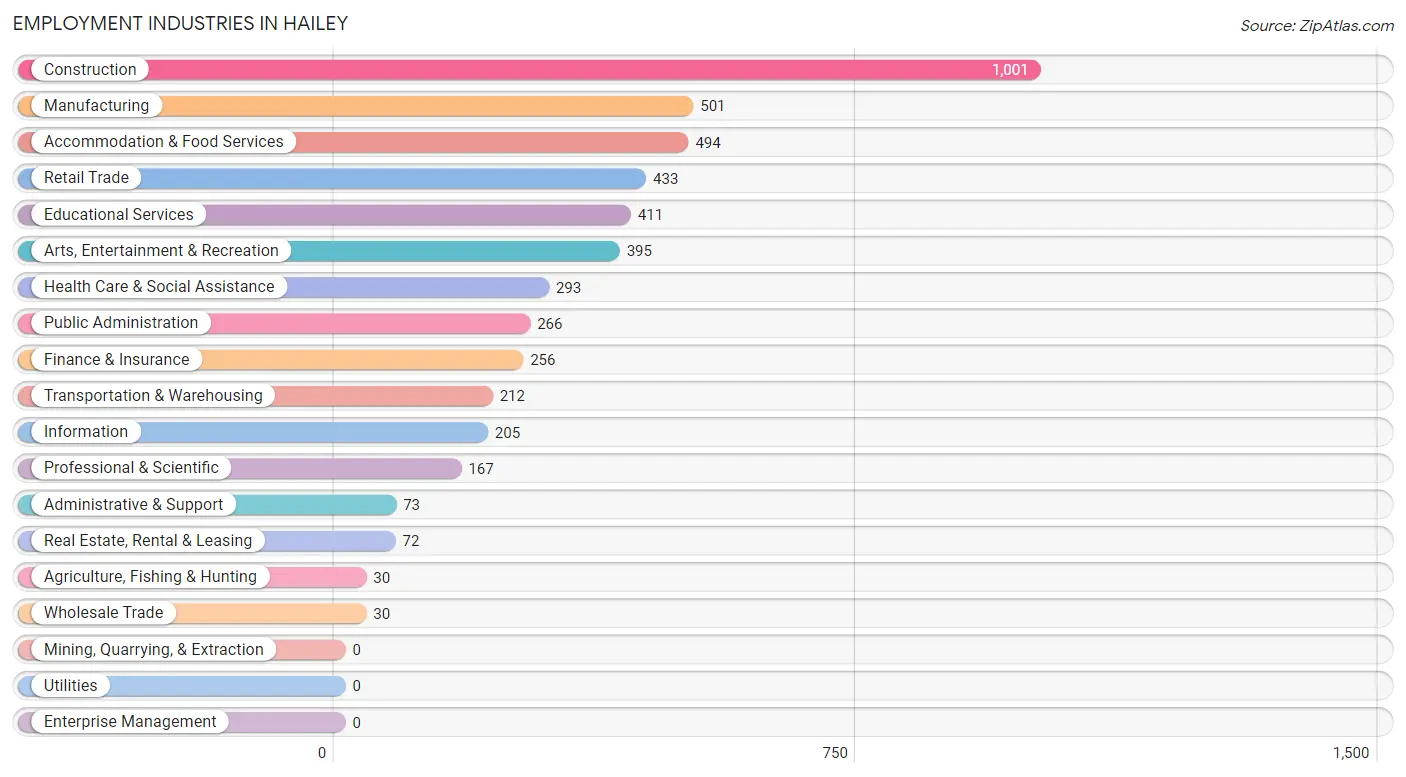
Employment Industries in Hailey
The major employment industries in Hailey include Construction (1,001 | 19.2%), Manufacturing (501 | 9.6%), Accommodation & Food Services (494 | 9.5%), Retail Trade (433 | 8.3%), and Educational Services (411 | 7.9%).
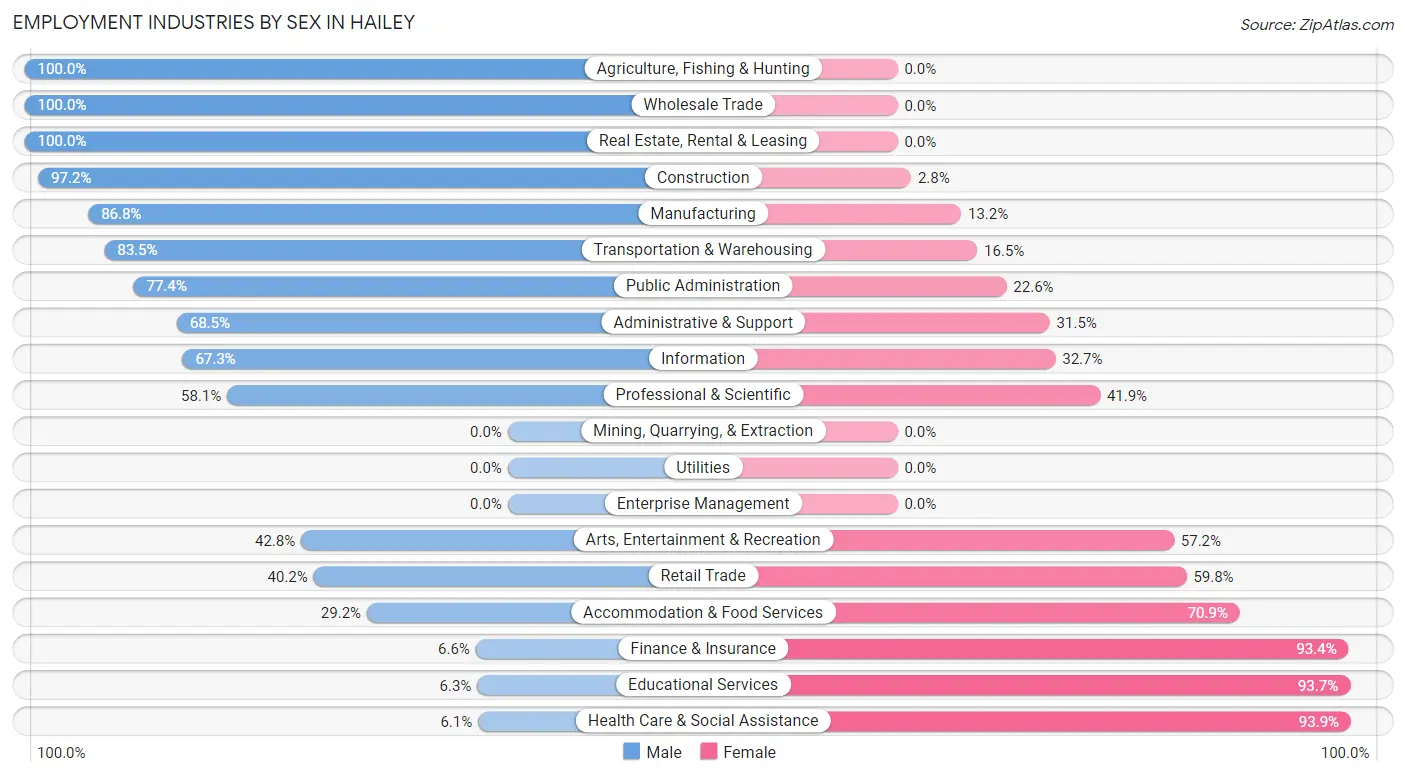
Employment Industries by Sex in Hailey
The Hailey industries that see more men than women are Agriculture, Fishing & Hunting (100.0%), Wholesale Trade (100.0%), and Real Estate, Rental & Leasing (100.0%), whereas the industries that tend to have a higher number of women are Health Care & Social Assistance (93.9%), Educational Services (93.7%), and Finance & Insurance (93.4%).
| Industry | Male | Female |
| Agriculture, Fishing & Hunting | 30 (100.0%) | 0 (0.0%) |
| Mining, Quarrying, & Extraction | 0 (0.0%) | 0 (0.0%) |
| Construction | 973 (97.2%) | 28 (2.8%) |
| Manufacturing | 435 (86.8%) | 66 (13.2%) |
| Wholesale Trade | 30 (100.0%) | 0 (0.0%) |
| Retail Trade | 174 (40.2%) | 259 (59.8%) |
| Transportation & Warehousing | 177 (83.5%) | 35 (16.5%) |
| Utilities | 0 (0.0%) | 0 (0.0%) |
| Information | 138 (67.3%) | 67 (32.7%) |
| Finance & Insurance | 17 (6.6%) | 239 (93.4%) |
| Real Estate, Rental & Leasing | 72 (100.0%) | 0 (0.0%) |
| Professional & Scientific | 97 (58.1%) | 70 (41.9%) |
| Enterprise Management | 0 (0.0%) | 0 (0.0%) |
| Administrative & Support | 50 (68.5%) | 23 (31.5%) |
| Educational Services | 26 (6.3%) | 385 (93.7%) |
| Health Care & Social Assistance | 18 (6.1%) | 275 (93.9%) |
| Arts, Entertainment & Recreation | 169 (42.8%) | 226 (57.2%) |
| Accommodation & Food Services | 144 (29.1%) | 350 (70.9%) |
| Public Administration | 206 (77.4%) | 60 (22.6%) |
| Total | 2,833 (54.3%) | 2,385 (45.7%) |
Education in Hailey
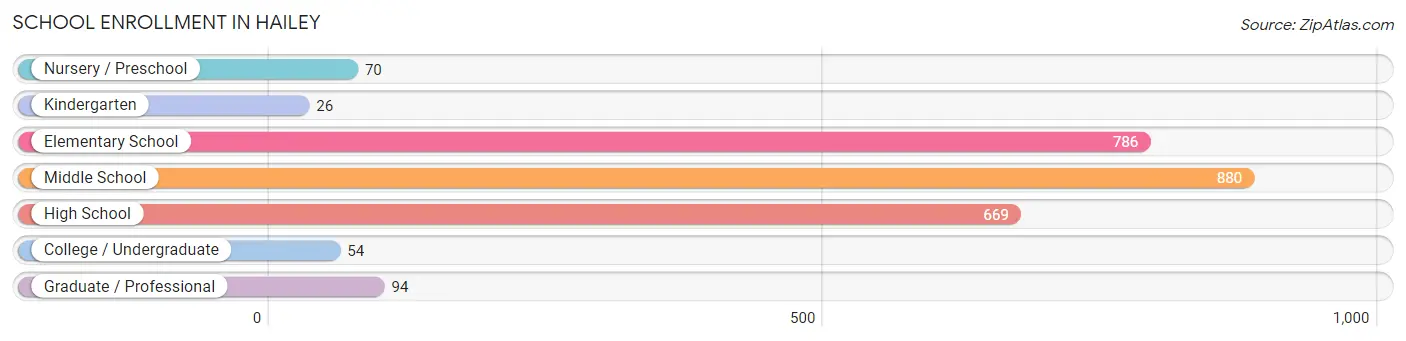
School Enrollment in Hailey
The most common levels of schooling among the 2,579 students in Hailey are middle school (880 | 34.1%), elementary school (786 | 30.5%), and high school (669 | 25.9%).
| School Level | # Students | % Students |
| Nursery / Preschool | 70 | 2.7% |
| Kindergarten | 26 | 1.0% |
| Elementary School | 786 | 30.5% |
| Middle School | 880 | 34.1% |
| High School | 669 | 25.9% |
| College / Undergraduate | 54 | 2.1% |
| Graduate / Professional | 94 | 3.6% |
| Total | 2,579 | 100.0% |
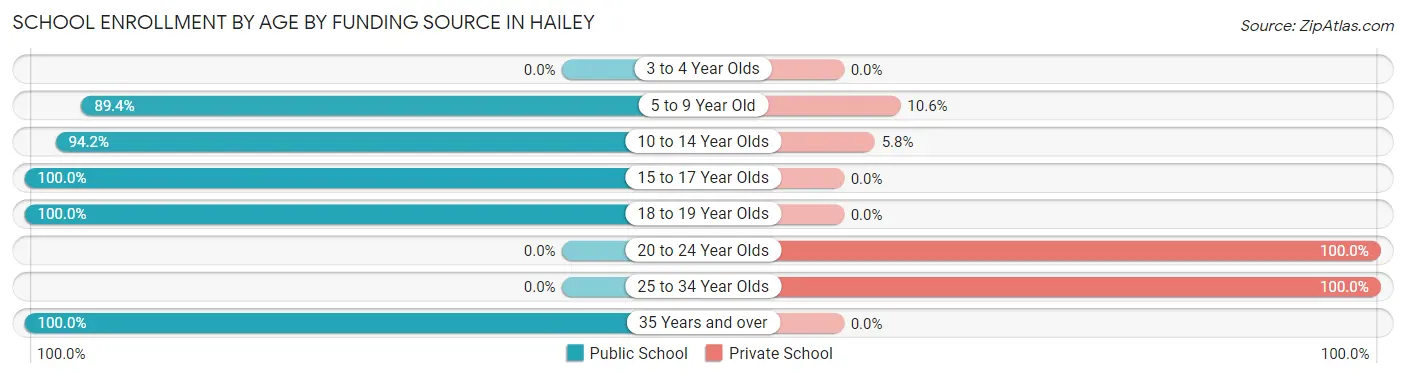
School Enrollment by Age by Funding Source in Hailey
Out of a total of 2,579 students who are enrolled in schools in Hailey, 263 (10.2%) attend a private institution, while the remaining 2,316 (89.8%) are enrolled in public schools. The age group of 20 to 24 year olds has the highest likelihood of being enrolled in private schools, with 27 (100.0% in the age bracket) enrolled. Conversely, the age group of 15 to 17 year olds has the lowest likelihood of being enrolled in a private school, with 378 (100.0% in the age bracket) attending a public institution.
| Age Bracket | Public School | Private School |
| 3 to 4 Year Olds | 0 (0.0%) | 0 (0.0%) |
| 5 to 9 Year Old | 778 (89.4%) | 92 (10.6%) |
| 10 to 14 Year Olds | 1,027 (94.2%) | 63 (5.8%) |
| 15 to 17 Year Olds | 378 (100.0%) | 0 (0.0%) |
| 18 to 19 Year Olds | 93 (100.0%) | 0 (0.0%) |
| 20 to 24 Year Olds | 0 (0.0%) | 27 (100.0%) |
| 25 to 34 Year Olds | 0 (0.0%) | 81 (100.0%) |
| 35 Years and over | 40 (100.0%) | 0 (0.0%) |
| Total | 2,316 (89.8%) | 263 (10.2%) |
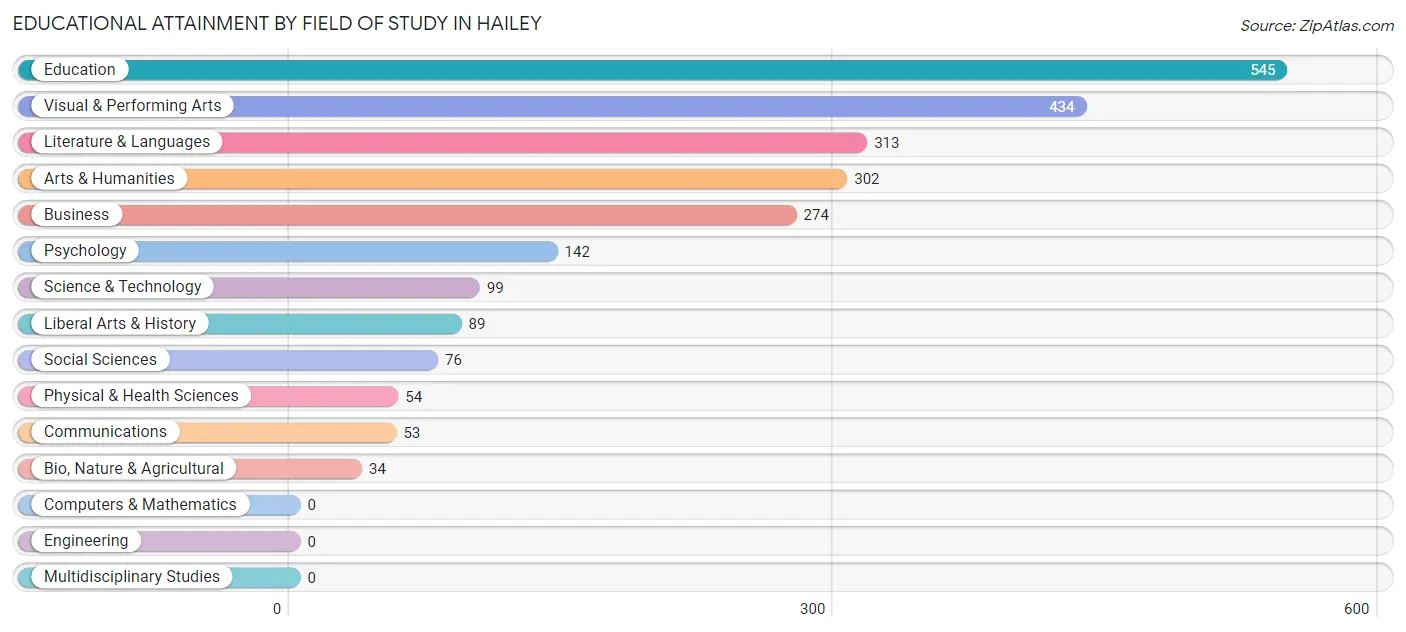
Educational Attainment by Field of Study in Hailey
Education (545 | 22.6%), visual & performing arts (434 | 18.0%), literature & languages (313 | 13.0%), arts & humanities (302 | 12.5%), and business (274 | 11.4%) are the most common fields of study among 2,415 individuals in Hailey who have obtained a bachelor's degree or higher.
| Field of Study | # Graduates | % Graduates |
| Computers & Mathematics | 0 | 0.0% |
| Bio, Nature & Agricultural | 34 | 1.4% |
| Physical & Health Sciences | 54 | 2.2% |
| Psychology | 142 | 5.9% |
| Social Sciences | 76 | 3.2% |
| Engineering | 0 | 0.0% |
| Multidisciplinary Studies | 0 | 0.0% |
| Science & Technology | 99 | 4.1% |
| Business | 274 | 11.4% |
| Education | 545 | 22.6% |
| Literature & Languages | 313 | 13.0% |
| Liberal Arts & History | 89 | 3.7% |
| Visual & Performing Arts | 434 | 18.0% |
| Communications | 53 | 2.2% |
| Arts & Humanities | 302 | 12.5% |
| Total | 2,415 | 100.0% |
Transportation & Commute in Hailey
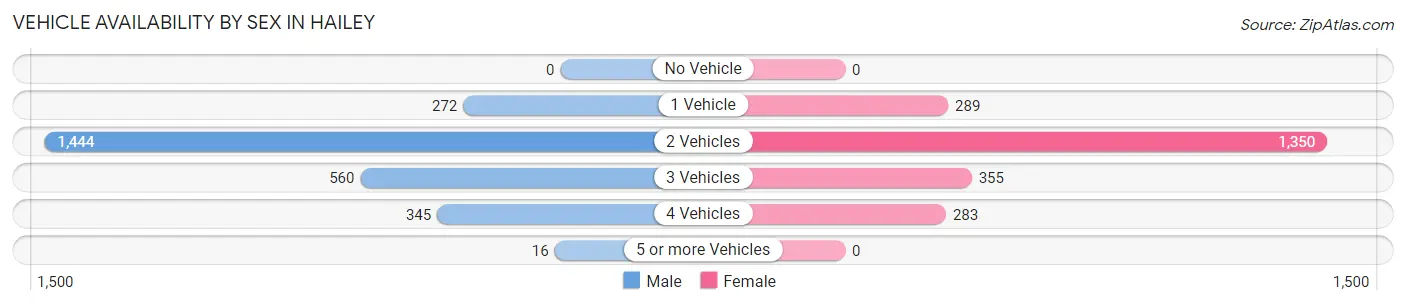
Vehicle Availability by Sex in Hailey
The most prevalent vehicle ownership categories in Hailey are males with 2 vehicles (1,444, accounting for 54.8%) and females with 2 vehicles (1,350, making up 63.4%).
| Vehicles Available | Male | Female |
| No Vehicle | 0 (0.0%) | 0 (0.0%) |
| 1 Vehicle | 272 (10.3%) | 289 (12.7%) |
| 2 Vehicles | 1,444 (54.8%) | 1,350 (59.3%) |
| 3 Vehicles | 560 (21.2%) | 355 (15.6%) |
| 4 Vehicles | 345 (13.1%) | 283 (12.4%) |
| 5 or more Vehicles | 16 (0.6%) | 0 (0.0%) |
| Total | 2,637 (100.0%) | 2,277 (100.0%) |
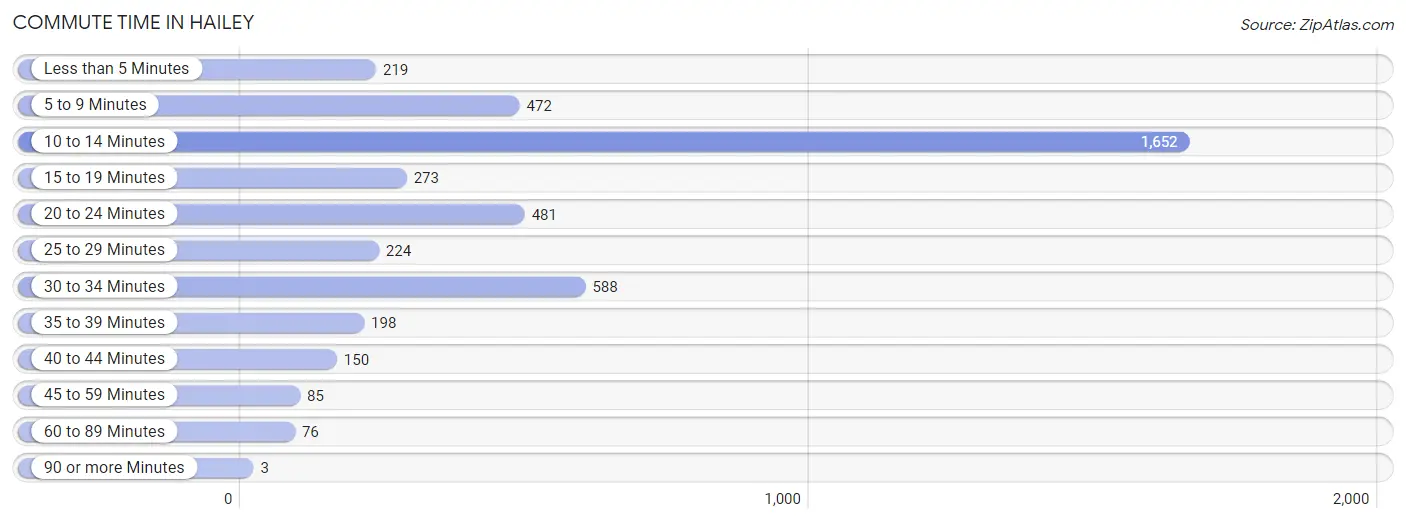
Commute Time in Hailey
The most frequently occuring commute durations in Hailey are 10 to 14 minutes (1,652 commuters, 37.4%), 30 to 34 minutes (588 commuters, 13.3%), and 20 to 24 minutes (481 commuters, 10.9%).
| Commute Time | # Commuters | % Commuters |
| Less than 5 Minutes | 219 | 5.0% |
| 5 to 9 Minutes | 472 | 10.7% |
| 10 to 14 Minutes | 1,652 | 37.4% |
| 15 to 19 Minutes | 273 | 6.2% |
| 20 to 24 Minutes | 481 | 10.9% |
| 25 to 29 Minutes | 224 | 5.1% |
| 30 to 34 Minutes | 588 | 13.3% |
| 35 to 39 Minutes | 198 | 4.5% |
| 40 to 44 Minutes | 150 | 3.4% |
| 45 to 59 Minutes | 85 | 1.9% |
| 60 to 89 Minutes | 76 | 1.7% |
| 90 or more Minutes | 3 | 0.1% |
Commute Time by Sex in Hailey
The most common commute times in Hailey are 10 to 14 minutes (928 commuters, 37.5%) for males and 10 to 14 minutes (724 commuters, 37.2%) for females.
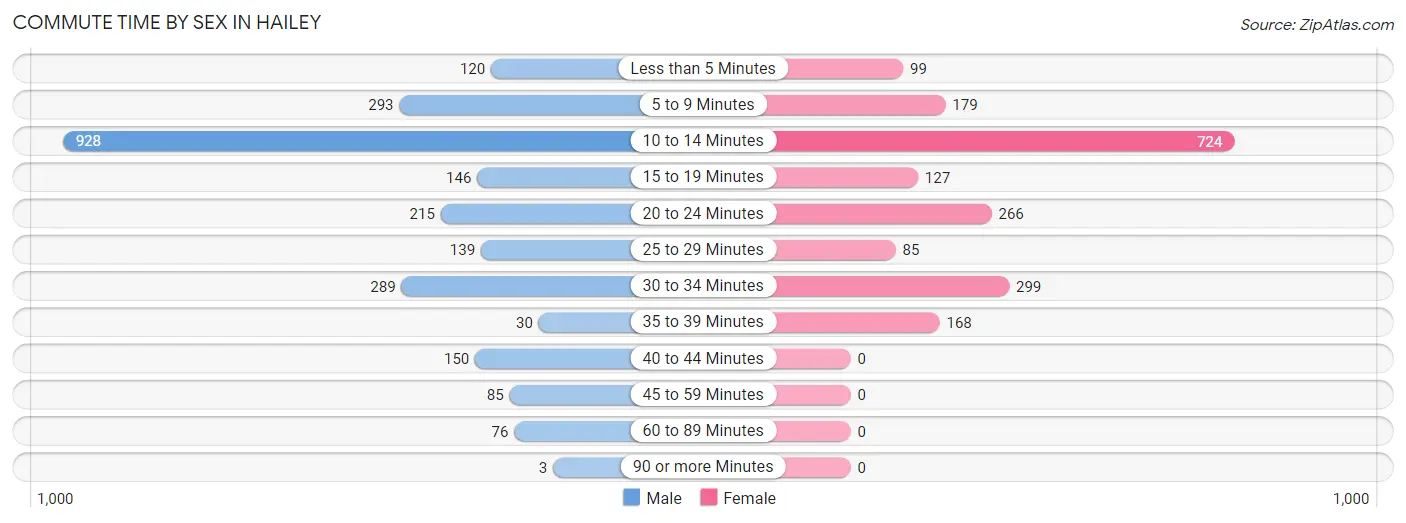
| Commute Time | Male | Female |
| Less than 5 Minutes | 120 (4.9%) | 99 (5.1%) |
| 5 to 9 Minutes | 293 (11.8%) | 179 (9.2%) |
| 10 to 14 Minutes | 928 (37.5%) | 724 (37.2%) |
| 15 to 19 Minutes | 146 (5.9%) | 127 (6.5%) |
| 20 to 24 Minutes | 215 (8.7%) | 266 (13.7%) |
| 25 to 29 Minutes | 139 (5.6%) | 85 (4.4%) |
| 30 to 34 Minutes | 289 (11.7%) | 299 (15.4%) |
| 35 to 39 Minutes | 30 (1.2%) | 168 (8.6%) |
| 40 to 44 Minutes | 150 (6.1%) | 0 (0.0%) |
| 45 to 59 Minutes | 85 (3.4%) | 0 (0.0%) |
| 60 to 89 Minutes | 76 (3.1%) | 0 (0.0%) |
| 90 or more Minutes | 3 (0.1%) | 0 (0.0%) |
Time of Departure to Work by Sex in Hailey
The most frequent times of departure to work in Hailey are 7:00 AM to 7:29 AM (746, 30.1%) for males and 9:00 AM to 9:59 AM (549, 28.2%) for females.
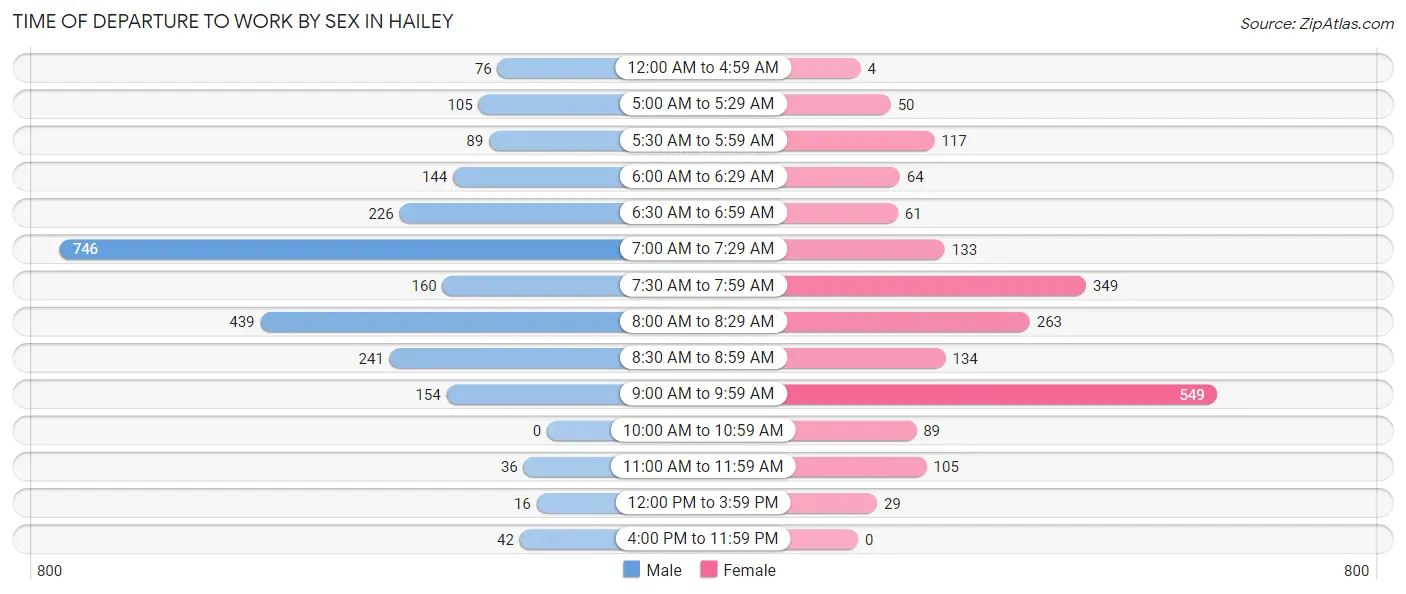
| Time of Departure | Male | Female |
| 12:00 AM to 4:59 AM | 76 (3.1%) | 4 (0.2%) |
| 5:00 AM to 5:29 AM | 105 (4.2%) | 50 (2.6%) |
| 5:30 AM to 5:59 AM | 89 (3.6%) | 117 (6.0%) |
| 6:00 AM to 6:29 AM | 144 (5.8%) | 64 (3.3%) |
| 6:30 AM to 6:59 AM | 226 (9.1%) | 61 (3.1%) |
| 7:00 AM to 7:29 AM | 746 (30.1%) | 133 (6.8%) |
| 7:30 AM to 7:59 AM | 160 (6.5%) | 349 (17.9%) |
| 8:00 AM to 8:29 AM | 439 (17.7%) | 263 (13.5%) |
| 8:30 AM to 8:59 AM | 241 (9.7%) | 134 (6.9%) |
| 9:00 AM to 9:59 AM | 154 (6.2%) | 549 (28.2%) |
| 10:00 AM to 10:59 AM | 0 (0.0%) | 89 (4.6%) |
| 11:00 AM to 11:59 AM | 36 (1.5%) | 105 (5.4%) |
| 12:00 PM to 3:59 PM | 16 (0.6%) | 29 (1.5%) |
| 4:00 PM to 11:59 PM | 42 (1.7%) | 0 (0.0%) |
| Total | 2,474 (100.0%) | 1,947 (100.0%) |
Housing Occupancy in Hailey
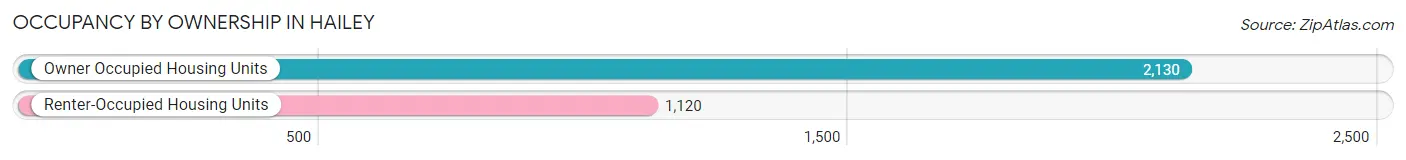
Occupancy by Ownership in Hailey
Of the total 3,250 dwellings in Hailey, owner-occupied units account for 2,130 (65.5%), while renter-occupied units make up 1,120 (34.5%).
| Occupancy | # Housing Units | % Housing Units |
| Owner Occupied Housing Units | 2,130 | 65.5% |
| Renter-Occupied Housing Units | 1,120 | 34.5% |
| Total Occupied Housing Units | 3,250 | 100.0% |
Occupancy by Household Size in Hailey
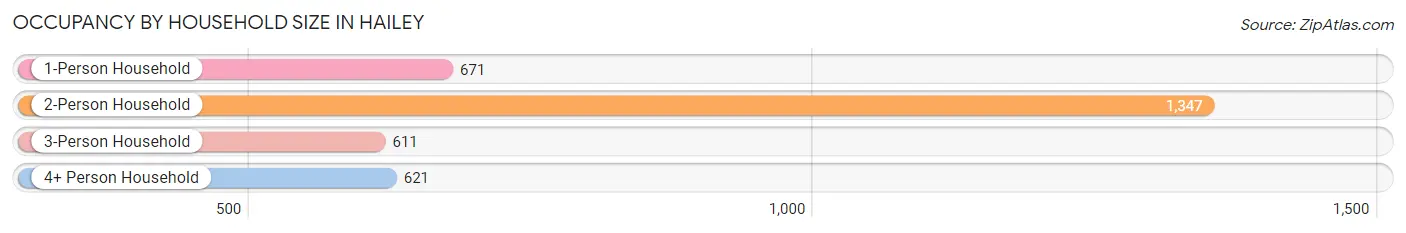
| Household Size | # Housing Units | % Housing Units |
| 1-Person Household | 671 | 20.6% |
| 2-Person Household | 1,347 | 41.4% |
| 3-Person Household | 611 | 18.8% |
| 4+ Person Household | 621 | 19.1% |
| Total Housing Units | 3,250 | 100.0% |
Occupancy by Ownership by Household Size in Hailey
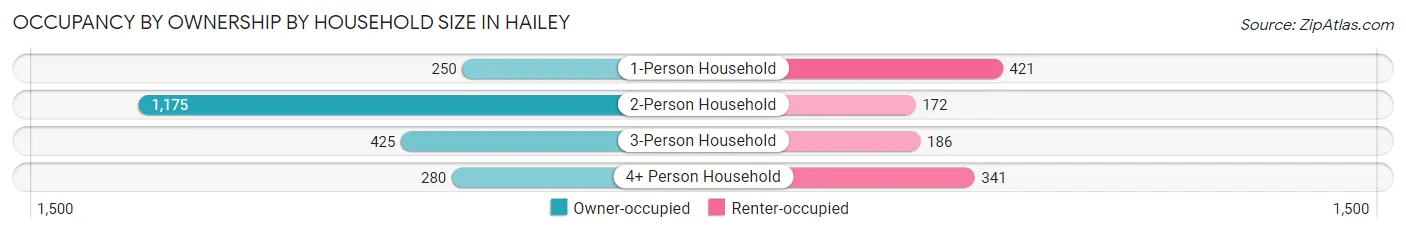
| Household Size | Owner-occupied | Renter-occupied |
| 1-Person Household | 250 (37.3%) | 421 (62.7%) |
| 2-Person Household | 1,175 (87.2%) | 172 (12.8%) |
| 3-Person Household | 425 (69.6%) | 186 (30.4%) |
| 4+ Person Household | 280 (45.1%) | 341 (54.9%) |
| Total Housing Units | 2,130 (65.5%) | 1,120 (34.5%) |
Occupancy by Educational Attainment in Hailey
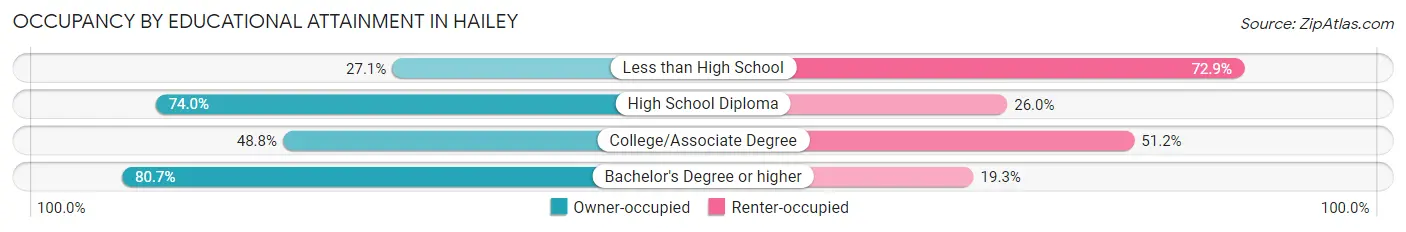
| Household Size | Owner-occupied | Renter-occupied |
| Less than High School | 124 (27.1%) | 333 (72.9%) |
| High School Diploma | 538 (74.0%) | 189 (26.0%) |
| College/Associate Degree | 304 (48.8%) | 319 (51.2%) |
| Bachelor's Degree or higher | 1,164 (80.7%) | 279 (19.3%) |
Occupancy by Age of Householder in Hailey
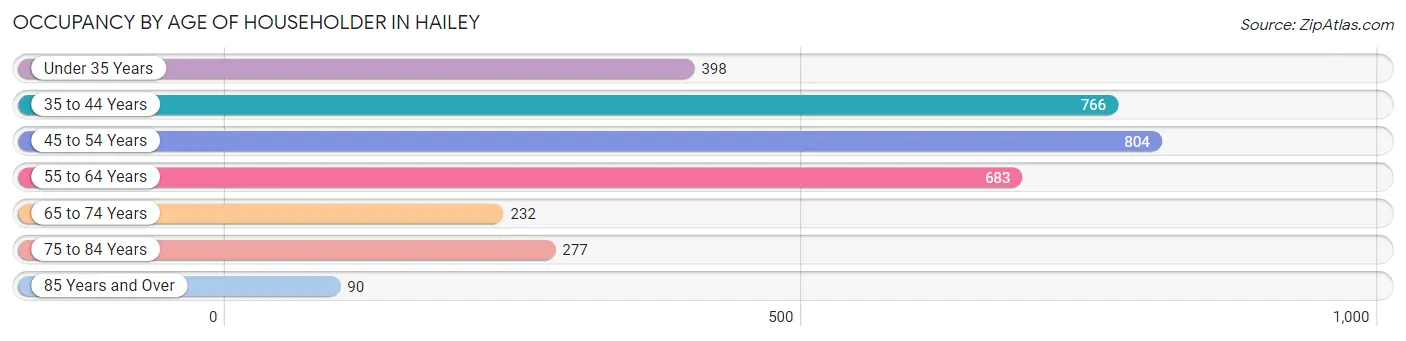
| Age Bracket | # Households | % Households |
| Under 35 Years | 398 | 12.2% |
| 35 to 44 Years | 766 | 23.6% |
| 45 to 54 Years | 804 | 24.7% |
| 55 to 64 Years | 683 | 21.0% |
| 65 to 74 Years | 232 | 7.1% |
| 75 to 84 Years | 277 | 8.5% |
| 85 Years and Over | 90 | 2.8% |
| Total | 3,250 | 100.0% |
Housing Finances in Hailey
Median Income by Occupancy in Hailey
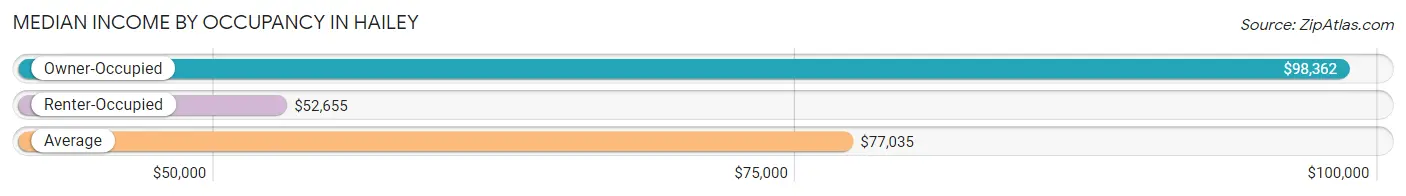
| Occupancy Type | # Households | Median Income |
| Owner-Occupied | 2,130 (65.5%) | $98,362 |
| Renter-Occupied | 1,120 (34.5%) | $52,655 |
| Average | 3,250 (100.0%) | $77,035 |
Occupancy by Householder Income Bracket in Hailey
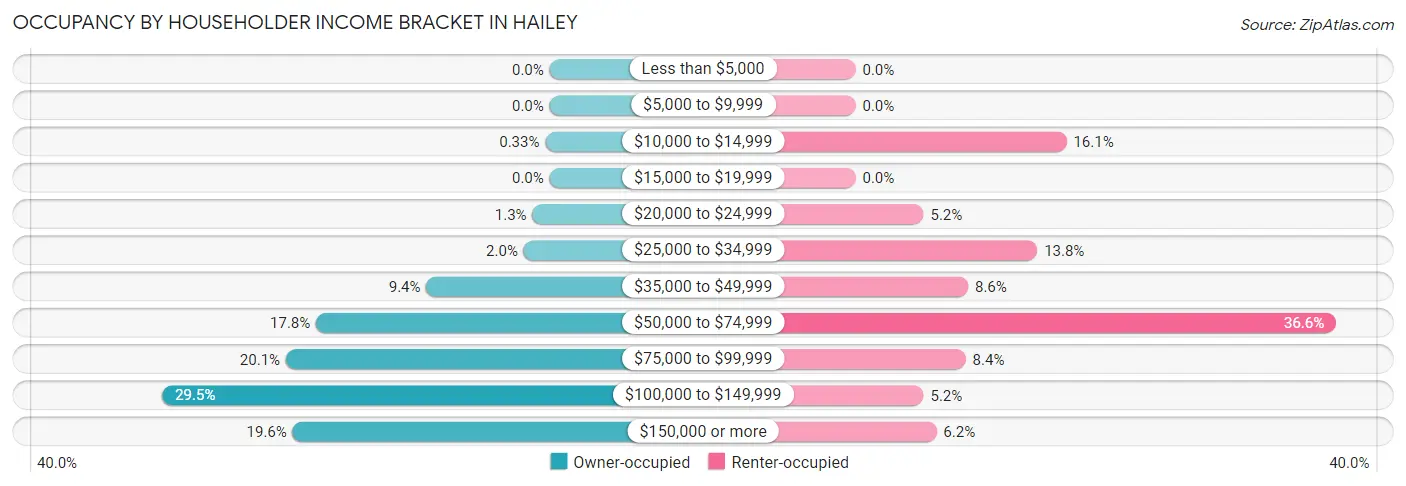
| Income Bracket | Owner-occupied | Renter-occupied |
| Less than $5,000 | 0 (0.0%) | 0 (0.0%) |
| $5,000 to $9,999 | 0 (0.0%) | 0 (0.0%) |
| $10,000 to $14,999 | 7 (0.3%) | 180 (16.1%) |
| $15,000 to $19,999 | 0 (0.0%) | 0 (0.0%) |
| $20,000 to $24,999 | 28 (1.3%) | 58 (5.2%) |
| $25,000 to $34,999 | 42 (2.0%) | 155 (13.8%) |
| $35,000 to $49,999 | 200 (9.4%) | 96 (8.6%) |
| $50,000 to $74,999 | 379 (17.8%) | 410 (36.6%) |
| $75,000 to $99,999 | 428 (20.1%) | 94 (8.4%) |
| $100,000 to $149,999 | 629 (29.5%) | 58 (5.2%) |
| $150,000 or more | 417 (19.6%) | 69 (6.2%) |
| Total | 2,130 (100.0%) | 1,120 (100.0%) |
Monthly Housing Cost Tiers in Hailey
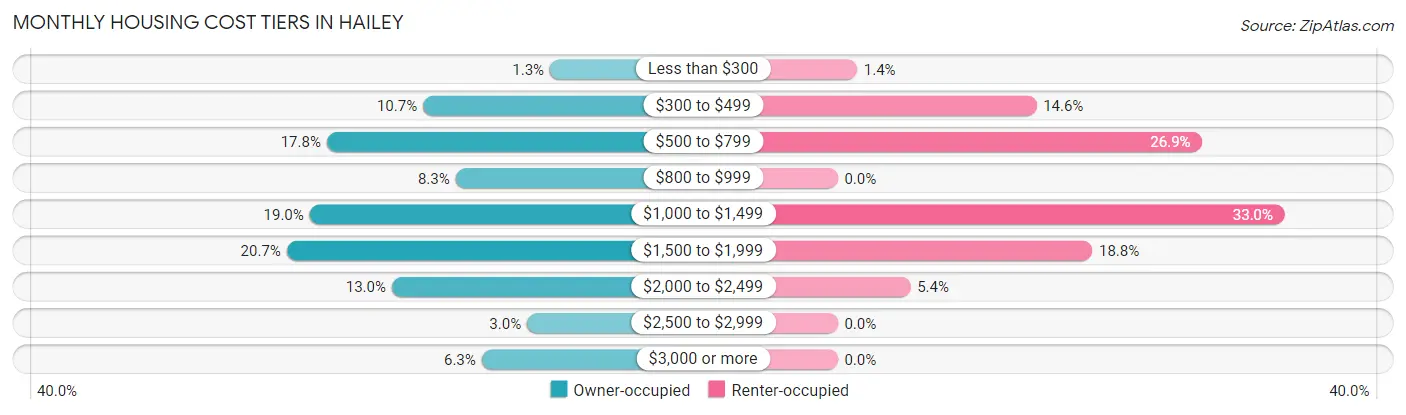
| Monthly Cost | Owner-occupied | Renter-occupied |
| Less than $300 | 28 (1.3%) | 16 (1.4%) |
| $300 to $499 | 227 (10.7%) | 164 (14.6%) |
| $500 to $799 | 378 (17.7%) | 301 (26.9%) |
| $800 to $999 | 176 (8.3%) | 0 (0.0%) |
| $1,000 to $1,499 | 405 (19.0%) | 369 (33.0%) |
| $1,500 to $1,999 | 441 (20.7%) | 210 (18.8%) |
| $2,000 to $2,499 | 276 (13.0%) | 60 (5.4%) |
| $2,500 to $2,999 | 64 (3.0%) | 0 (0.0%) |
| $3,000 or more | 135 (6.3%) | 0 (0.0%) |
| Total | 2,130 (100.0%) | 1,120 (100.0%) |
Physical Housing Characteristics in Hailey
Housing Structures in Hailey
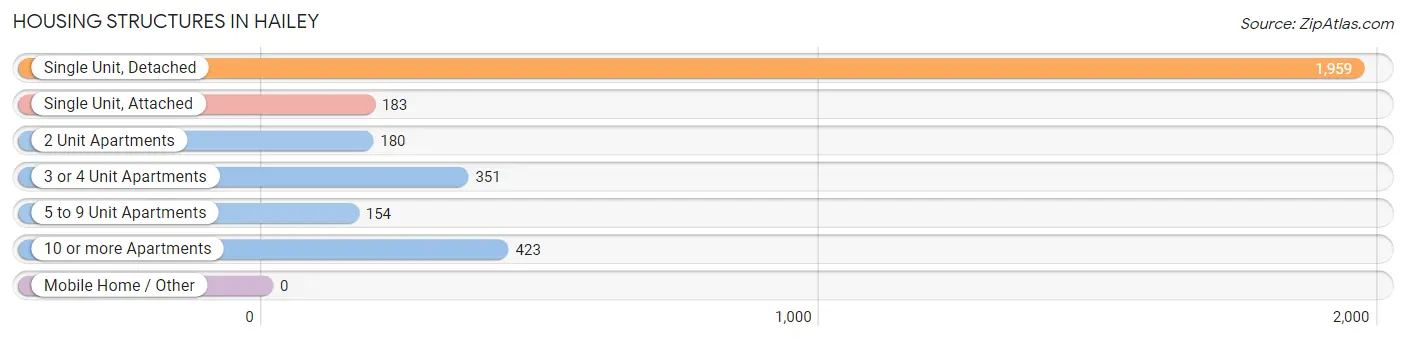
| Structure Type | # Housing Units | % Housing Units |
| Single Unit, Detached | 1,959 | 60.3% |
| Single Unit, Attached | 183 | 5.6% |
| 2 Unit Apartments | 180 | 5.5% |
| 3 or 4 Unit Apartments | 351 | 10.8% |
| 5 to 9 Unit Apartments | 154 | 4.7% |
| 10 or more Apartments | 423 | 13.0% |
| Mobile Home / Other | 0 | 0.0% |
| Total | 3,250 | 100.0% |
Housing Structures by Occupancy in Hailey
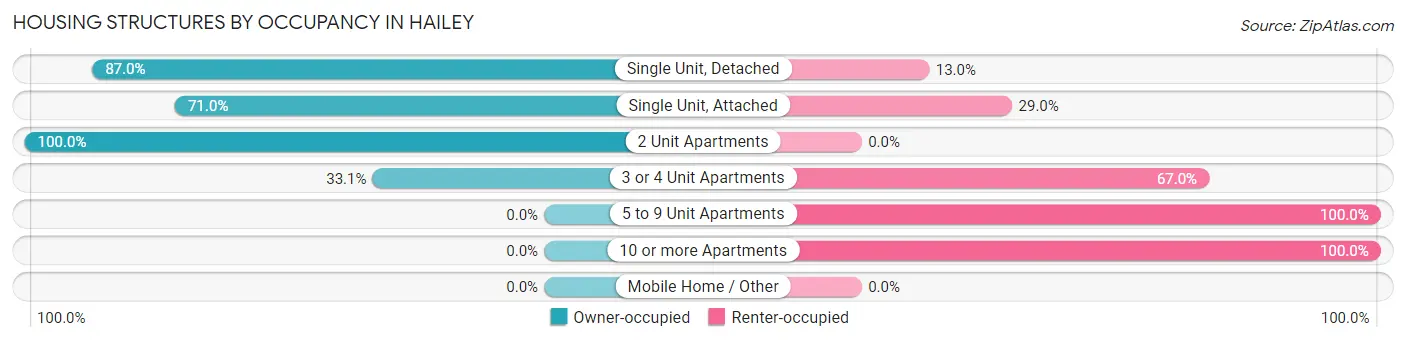
| Structure Type | Owner-occupied | Renter-occupied |
| Single Unit, Detached | 1,704 (87.0%) | 255 (13.0%) |
| Single Unit, Attached | 130 (71.0%) | 53 (29.0%) |
| 2 Unit Apartments | 180 (100.0%) | 0 (0.0%) |
| 3 or 4 Unit Apartments | 116 (33.1%) | 235 (66.9%) |
| 5 to 9 Unit Apartments | 0 (0.0%) | 154 (100.0%) |
| 10 or more Apartments | 0 (0.0%) | 423 (100.0%) |
| Mobile Home / Other | 0 (0.0%) | 0 (0.0%) |
| Total | 2,130 (65.5%) | 1,120 (34.5%) |
Housing Structures by Number of Rooms in Hailey
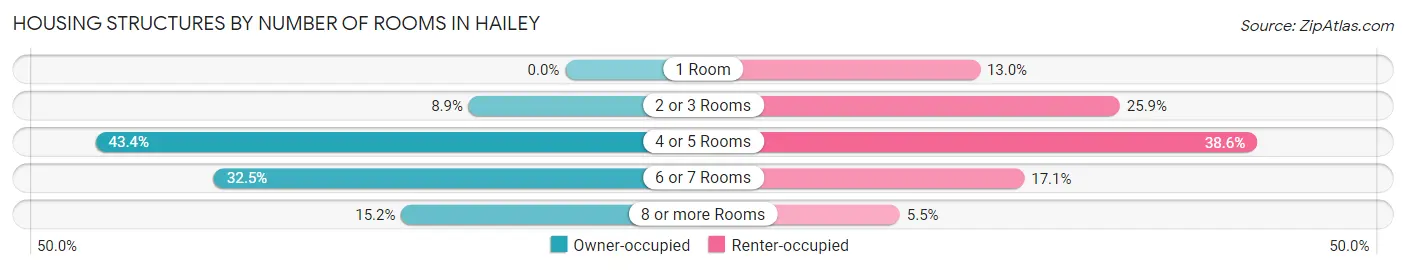
| Number of Rooms | Owner-occupied | Renter-occupied |
| 1 Room | 0 (0.0%) | 145 (13.0%) |
| 2 or 3 Rooms | 190 (8.9%) | 290 (25.9%) |
| 4 or 5 Rooms | 925 (43.4%) | 432 (38.6%) |
| 6 or 7 Rooms | 692 (32.5%) | 191 (17.1%) |
| 8 or more Rooms | 323 (15.2%) | 62 (5.5%) |
| Total | 2,130 (100.0%) | 1,120 (100.0%) |
Housing Structure by Heating Type in Hailey
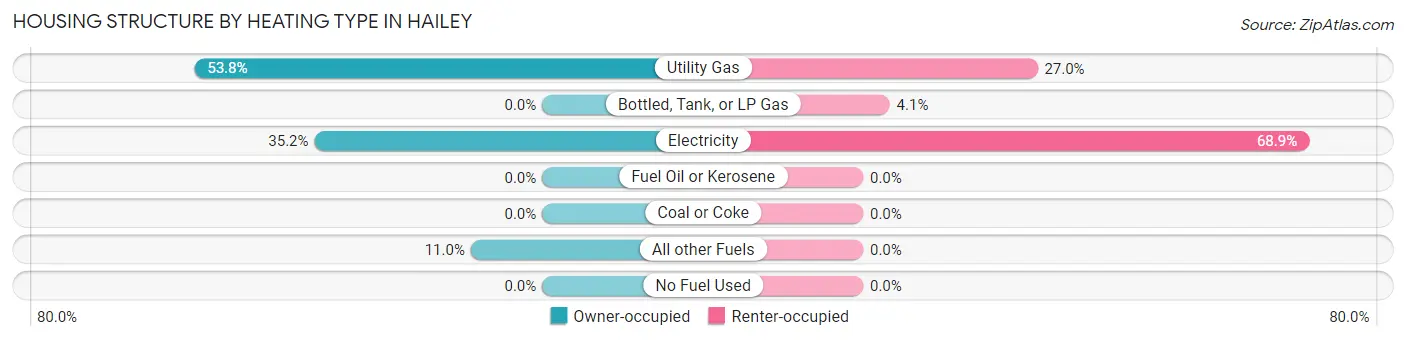
| Heating Type | Owner-occupied | Renter-occupied |
| Utility Gas | 1,145 (53.8%) | 302 (27.0%) |
| Bottled, Tank, or LP Gas | 0 (0.0%) | 46 (4.1%) |
| Electricity | 750 (35.2%) | 772 (68.9%) |
| Fuel Oil or Kerosene | 0 (0.0%) | 0 (0.0%) |
| Coal or Coke | 0 (0.0%) | 0 (0.0%) |
| All other Fuels | 235 (11.0%) | 0 (0.0%) |
| No Fuel Used | 0 (0.0%) | 0 (0.0%) |
| Total | 2,130 (100.0%) | 1,120 (100.0%) |
Household Vehicle Usage in Hailey
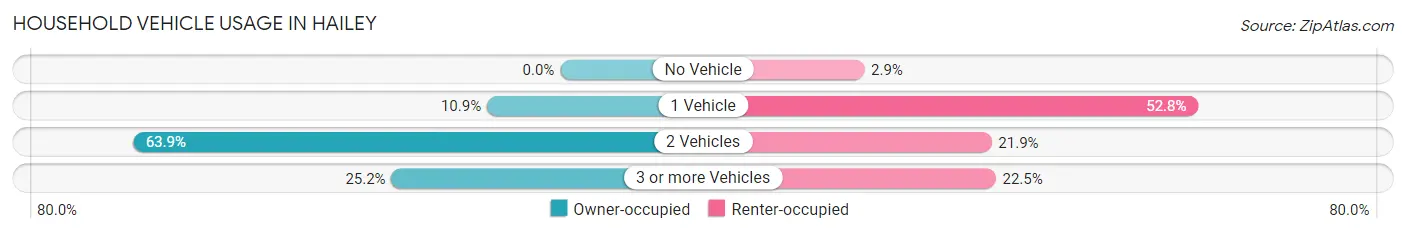
| Vehicles per Household | Owner-occupied | Renter-occupied |
| No Vehicle | 0 (0.0%) | 32 (2.9%) |
| 1 Vehicle | 233 (10.9%) | 591 (52.8%) |
| 2 Vehicles | 1,360 (63.8%) | 245 (21.9%) |
| 3 or more Vehicles | 537 (25.2%) | 252 (22.5%) |
| Total | 2,130 (100.0%) | 1,120 (100.0%) |
Real Estate & Mortgages in Hailey
Real Estate and Mortgage Overview in Hailey
| Characteristic | Without Mortgage | With Mortgage |
| Housing Units | 570 | 1,560 |
| Median Property Value | $496,200 | $411,900 |
| Median Household Income | $84,252 | $328 |
| Monthly Housing Costs | $581 | $135 |
| Real Estate Taxes | $1,934 | $0 |
Property Value by Mortgage Status in Hailey
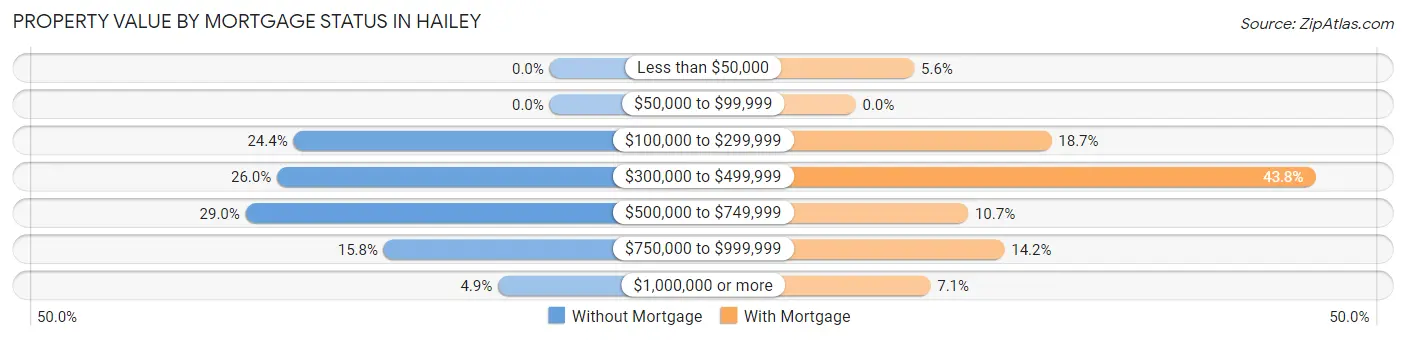
| Property Value | Without Mortgage | With Mortgage |
| Less than $50,000 | 0 (0.0%) | 87 (5.6%) |
| $50,000 to $99,999 | 0 (0.0%) | 0 (0.0%) |
| $100,000 to $299,999 | 139 (24.4%) | 291 (18.6%) |
| $300,000 to $499,999 | 148 (26.0%) | 683 (43.8%) |
| $500,000 to $749,999 | 165 (28.9%) | 167 (10.7%) |
| $750,000 to $999,999 | 90 (15.8%) | 221 (14.2%) |
| $1,000,000 or more | 28 (4.9%) | 111 (7.1%) |
| Total | 570 (100.0%) | 1,560 (100.0%) |
Household Income by Mortgage Status in Hailey
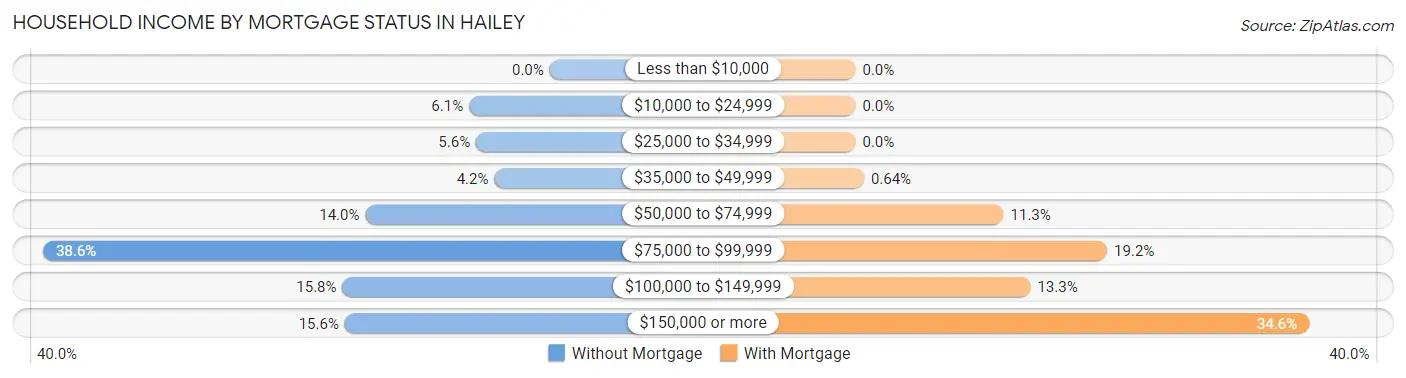
| Household Income | Without Mortgage | With Mortgage |
| Less than $10,000 | 0 (0.0%) | 0 (0.0%) |
| $10,000 to $24,999 | 35 (6.1%) | 0 (0.0%) |
| $25,000 to $34,999 | 32 (5.6%) | 0 (0.0%) |
| $35,000 to $49,999 | 24 (4.2%) | 10 (0.6%) |
| $50,000 to $74,999 | 80 (14.0%) | 176 (11.3%) |
| $75,000 to $99,999 | 220 (38.6%) | 299 (19.2%) |
| $100,000 to $149,999 | 90 (15.8%) | 208 (13.3%) |
| $150,000 or more | 89 (15.6%) | 539 (34.5%) |
| Total | 570 (100.0%) | 1,560 (100.0%) |
Property Value to Household Income Ratio in Hailey
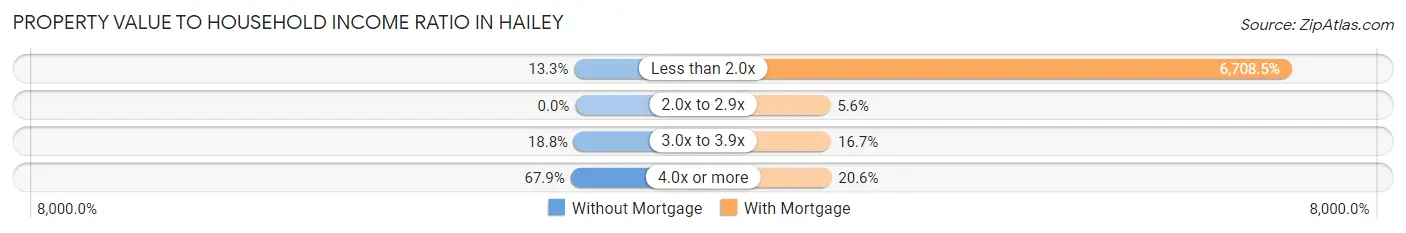
| Value-to-Income Ratio | Without Mortgage | With Mortgage |
| Less than 2.0x | 76 (13.3%) | 104,653 (6,708.5%) |
| 2.0x to 2.9x | 0 (0.0%) | 87 (5.6%) |
| 3.0x to 3.9x | 107 (18.8%) | 260 (16.7%) |
| 4.0x or more | 387 (67.9%) | 322 (20.6%) |
| Total | 570 (100.0%) | 1,560 (100.0%) |
Real Estate Taxes by Mortgage Status in Hailey
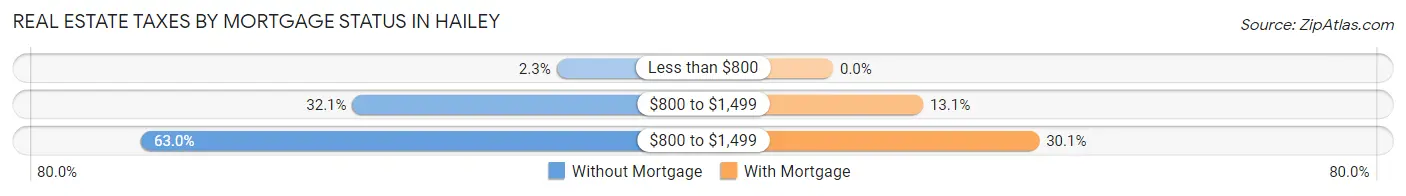
| Property Taxes | Without Mortgage | With Mortgage |
| Less than $800 | 13 (2.3%) | 0 (0.0%) |
| $800 to $1,499 | 183 (32.1%) | 205 (13.1%) |
| $800 to $1,499 | 359 (63.0%) | 470 (30.1%) |
| Total | 570 (100.0%) | 1,560 (100.0%) |
Health & Disability in Hailey
Health Insurance Coverage by Age in Hailey
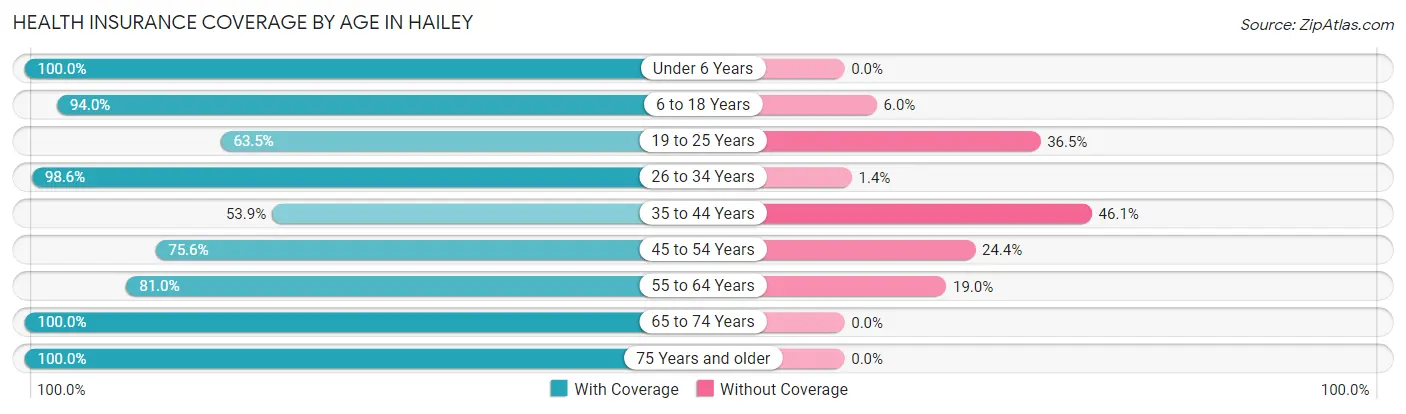
| Age Bracket | With Coverage | Without Coverage |
| Under 6 Years | 283 (100.0%) | 0 (0.0%) |
| 6 to 18 Years | 2,211 (94.0%) | 142 (6.0%) |
| 19 to 25 Years | 337 (63.5%) | 194 (36.5%) |
| 26 to 34 Years | 651 (98.6%) | 9 (1.4%) |
| 35 to 44 Years | 780 (53.9%) | 668 (46.1%) |
| 45 to 54 Years | 971 (75.6%) | 313 (24.4%) |
| 55 to 64 Years | 1,380 (81.0%) | 323 (19.0%) |
| 65 to 74 Years | 372 (100.0%) | 0 (0.0%) |
| 75 Years and older | 554 (100.0%) | 0 (0.0%) |
| Total | 7,539 (82.1%) | 1,649 (17.9%) |
Health Insurance Coverage by Citizenship Status in Hailey
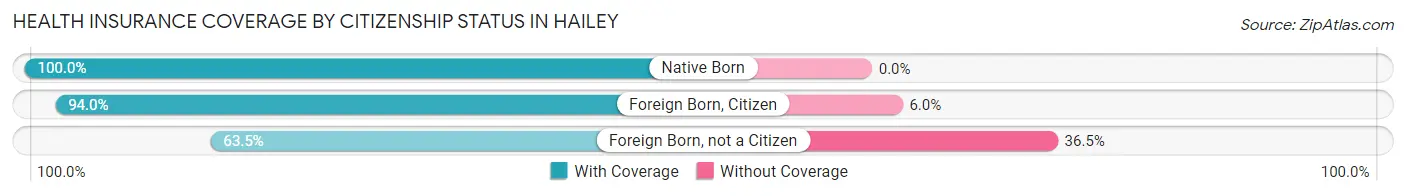
| Citizenship Status | With Coverage | Without Coverage |
| Native Born | 283 (100.0%) | 0 (0.0%) |
| Foreign Born, Citizen | 2,211 (94.0%) | 142 (6.0%) |
| Foreign Born, not a Citizen | 337 (63.5%) | 194 (36.5%) |
Health Insurance Coverage by Household Income in Hailey
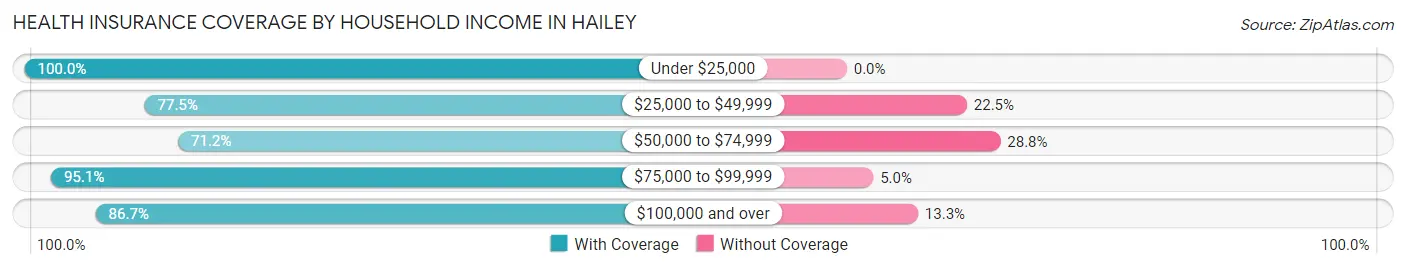
| Household Income | With Coverage | Without Coverage |
| Under $25,000 | 433 (100.0%) | 0 (0.0%) |
| $25,000 to $49,999 | 848 (77.5%) | 246 (22.5%) |
| $50,000 to $74,999 | 2,186 (71.2%) | 883 (28.8%) |
| $75,000 to $99,999 | 1,114 (95.1%) | 58 (5.0%) |
| $100,000 and over | 2,902 (86.7%) | 446 (13.3%) |
Public vs Private Health Insurance Coverage by Age in Hailey
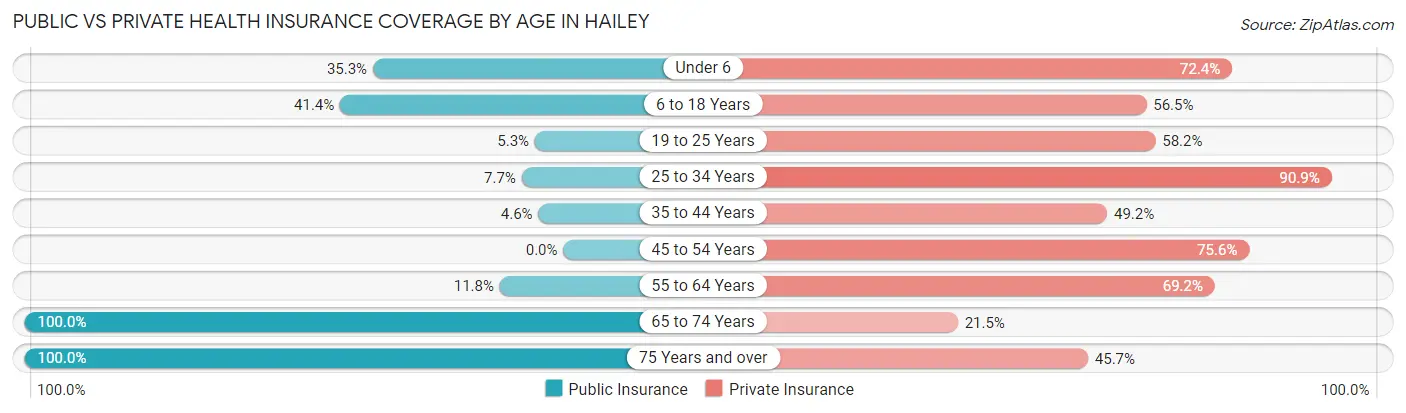
| Age Bracket | Public Insurance | Private Insurance |
| Under 6 | 100 (35.3%) | 205 (72.4%) |
| 6 to 18 Years | 975 (41.4%) | 1,330 (56.5%) |
| 19 to 25 Years | 28 (5.3%) | 309 (58.2%) |
| 25 to 34 Years | 51 (7.7%) | 600 (90.9%) |
| 35 to 44 Years | 67 (4.6%) | 713 (49.2%) |
| 45 to 54 Years | 0 (0.0%) | 971 (75.6%) |
| 55 to 64 Years | 201 (11.8%) | 1,179 (69.2%) |
| 65 to 74 Years | 372 (100.0%) | 80 (21.5%) |
| 75 Years and over | 554 (100.0%) | 253 (45.7%) |
| Total | 2,348 (25.6%) | 5,640 (61.4%) |
Disability Status by Sex by Age in Hailey
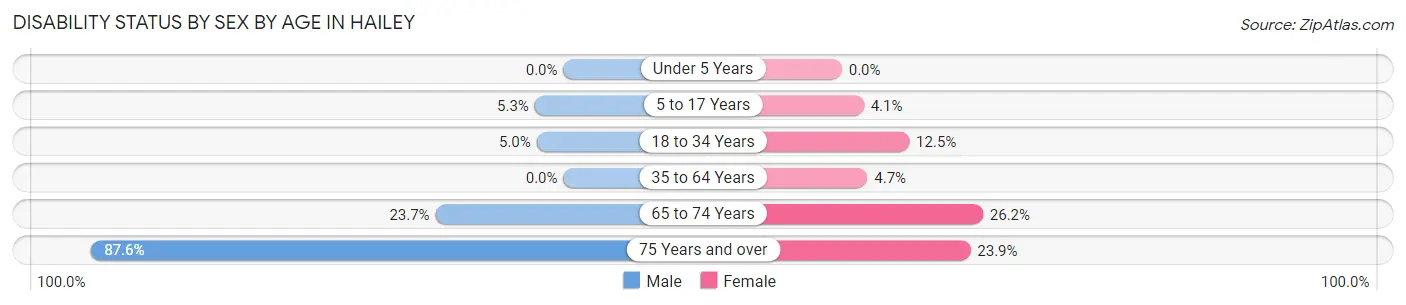
| Age Bracket | Male | Female |
| Under 5 Years | 0 (0.0%) | 0 (0.0%) |
| 5 to 17 Years | 76 (5.3%) | 37 (4.1%) |
| 18 to 34 Years | 28 (5.0%) | 90 (12.5%) |
| 35 to 64 Years | 0 (0.0%) | 112 (4.7%) |
| 65 to 74 Years | 33 (23.7%) | 61 (26.2%) |
| 75 Years and over | 177 (87.6%) | 84 (23.9%) |
Disability Class by Sex by Age in Hailey
Disability Class: Hearing Difficulty
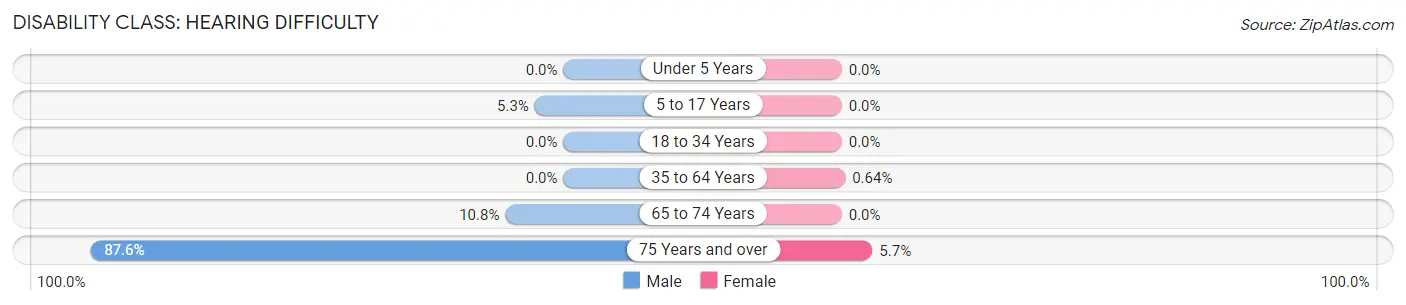
| Age Bracket | Male | Female |
| Under 5 Years | 0 (0.0%) | 0 (0.0%) |
| 5 to 17 Years | 76 (5.3%) | 0 (0.0%) |
| 18 to 34 Years | 0 (0.0%) | 0 (0.0%) |
| 35 to 64 Years | 0 (0.0%) | 15 (0.6%) |
| 65 to 74 Years | 15 (10.8%) | 0 (0.0%) |
| 75 Years and over | 177 (87.6%) | 20 (5.7%) |
Disability Class: Vision Difficulty
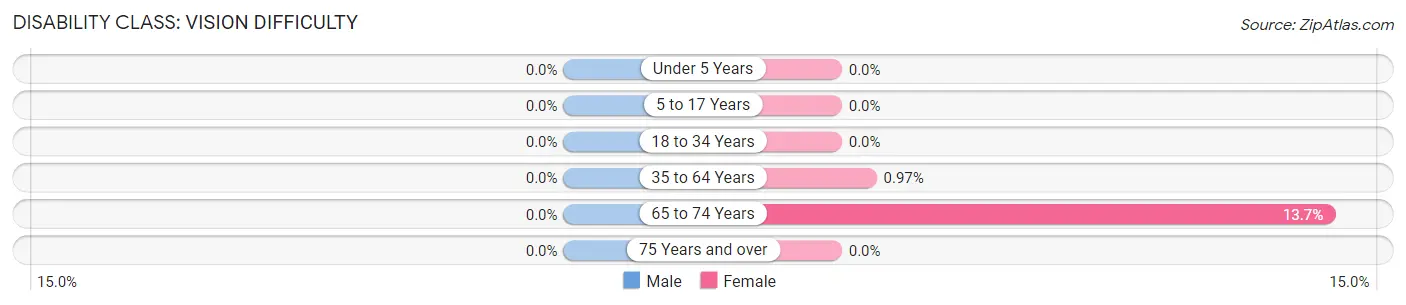
| Age Bracket | Male | Female |
| Under 5 Years | 0 (0.0%) | 0 (0.0%) |
| 5 to 17 Years | 0 (0.0%) | 0 (0.0%) |
| 18 to 34 Years | 0 (0.0%) | 0 (0.0%) |
| 35 to 64 Years | 0 (0.0%) | 23 (1.0%) |
| 65 to 74 Years | 0 (0.0%) | 32 (13.7%) |
| 75 Years and over | 0 (0.0%) | 0 (0.0%) |
Disability Class: Cognitive Difficulty
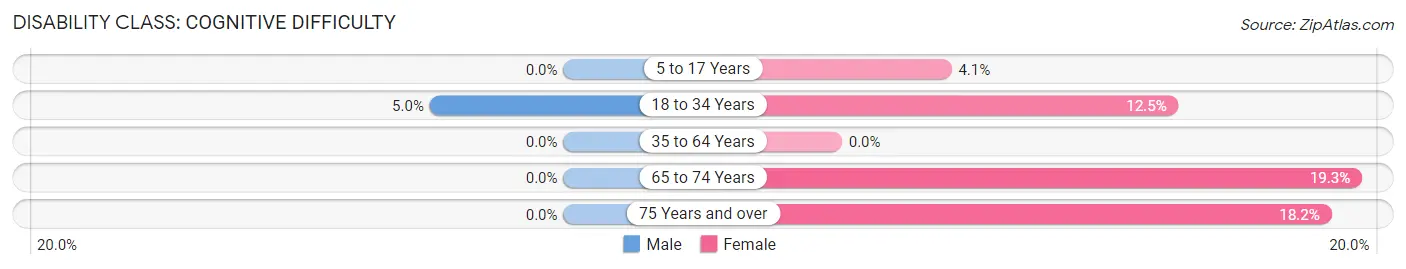
| Age Bracket | Male | Female |
| 5 to 17 Years | 0 (0.0%) | 37 (4.1%) |
| 18 to 34 Years | 28 (5.0%) | 90 (12.5%) |
| 35 to 64 Years | 0 (0.0%) | 0 (0.0%) |
| 65 to 74 Years | 0 (0.0%) | 45 (19.3%) |
| 75 Years and over | 0 (0.0%) | 64 (18.2%) |
Disability Class: Ambulatory Difficulty
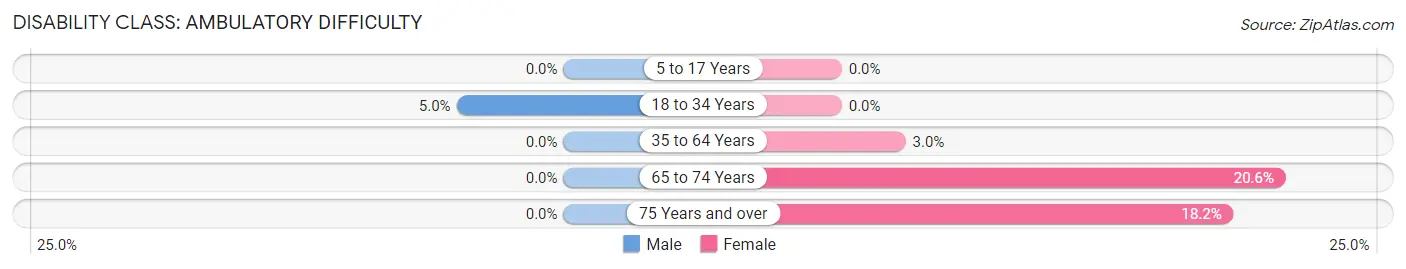
| Age Bracket | Male | Female |
| 5 to 17 Years | 0 (0.0%) | 0 (0.0%) |
| 18 to 34 Years | 28 (5.0%) | 0 (0.0%) |
| 35 to 64 Years | 0 (0.0%) | 70 (3.0%) |
| 65 to 74 Years | 0 (0.0%) | 48 (20.6%) |
| 75 Years and over | 0 (0.0%) | 64 (18.2%) |
Disability Class: Self-Care Difficulty
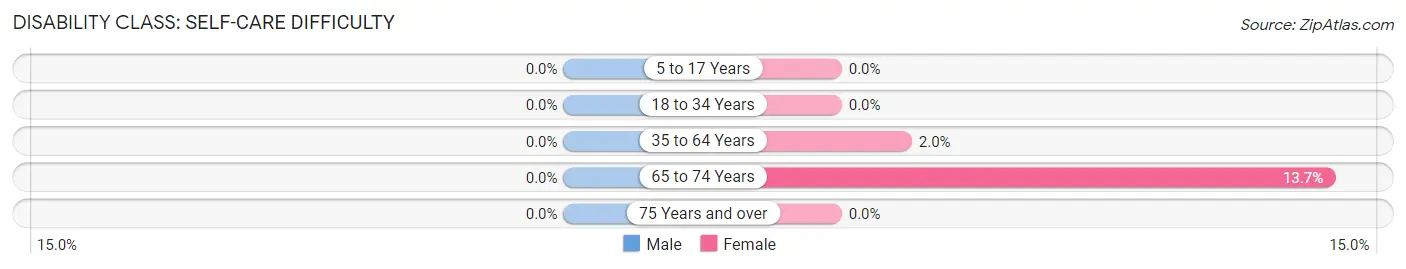
| Age Bracket | Male | Female |
| 5 to 17 Years | 0 (0.0%) | 0 (0.0%) |
| 18 to 34 Years | 0 (0.0%) | 0 (0.0%) |
| 35 to 64 Years | 0 (0.0%) | 46 (1.9%) |
| 65 to 74 Years | 0 (0.0%) | 32 (13.7%) |
| 75 Years and over | 0 (0.0%) | 0 (0.0%) |
Technology Access in Hailey
Computing Device Access in Hailey
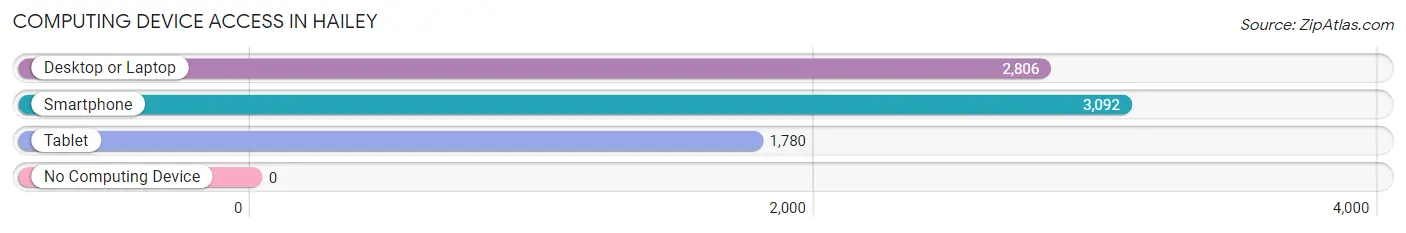
| Device Type | # Households | % Households |
| Desktop or Laptop | 2,806 | 86.3% |
| Smartphone | 3,092 | 95.1% |
| Tablet | 1,780 | 54.8% |
| No Computing Device | 0 | 0.0% |
| Total | 3,250 | 100.0% |
Internet Access in Hailey
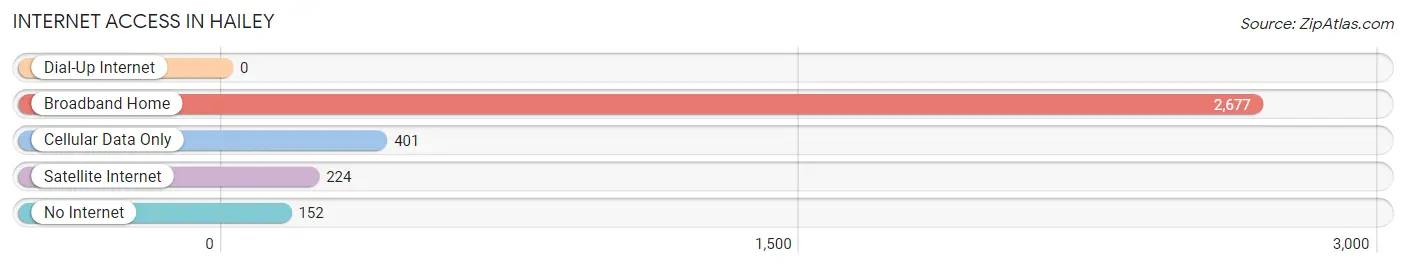
| Internet Type | # Households | % Households |
| Dial-Up Internet | 0 | 0.0% |
| Broadband Home | 2,677 | 82.4% |
| Cellular Data Only | 401 | 12.3% |
| Satellite Internet | 224 | 6.9% |
| No Internet | 152 | 4.7% |
| Total | 3,250 | 100.0% |
Hailey Summary
Hailey, Idaho is a small city located in the Wood River Valley of south-central Idaho. It is the county seat of Blaine County and is situated at an elevation of 5,318 feet. The city is located approximately 20 miles south of Sun Valley and Ketchum, and is part of the greater Sun Valley area. The city has a population of approximately 7,000 people and is the largest city in Blaine County.
History
Hailey was founded in 1881 by John Hailey, a prospector who discovered gold in the area. The city was originally named Haileyville, but the name was changed to Hailey in 1883. The city was incorporated in 1890 and has since grown to become the largest city in Blaine County.
Geography
Hailey is located in the Wood River Valley of south-central Idaho. The city is situated at an elevation of 5,318 feet and is surrounded by the Sawtooth National Forest. The city is located approximately 20 miles south of Sun Valley and Ketchum, and is part of the greater Sun Valley area. The city is located near the Big Wood River, which flows through the city and provides a source of recreation for the area.
Economy
Hailey’s economy is largely based on tourism, as the city is located near the popular Sun Valley ski resort. The city also has a strong agricultural sector, with many local farms producing potatoes, hay, and other crops. The city is also home to several manufacturing companies, including a wood products plant and a metal fabrication plant.
Demographics
As of the 2010 census, Hailey had a population of 7,960 people. The racial makeup of the city was 91.3% White, 0.7% African American, 0.7% Native American, 0.7% Asian, 0.1% Pacific Islander, 4.2% from other races, and 2.1% from two or more races. The median household income in the city was $41,944, and the median family income was $50,944. The per capita income in the city was $25,944.
Hailey is a small city with a rich history and a vibrant economy. The city is located in the beautiful Wood River Valley and is surrounded by the Sawtooth National Forest. The city is home to a diverse population and is a popular tourist destination due to its proximity to the Sun Valley ski resort. The city has a strong agricultural sector and is home to several manufacturing companies. Hailey is a great place to live, work, and play.
Common Questions
What is the Total Population of Hailey?
Total Population of Hailey is 9,238.
What is the Total Male Population of Hailey?
Total Male Population of Hailey is 4,496.
What is the Total Female Population of Hailey?
Total Female Population of Hailey is 4,742.
What is the Ratio of Males per 100 Females in Hailey?
There are 94.81 Males per 100 Females in Hailey.
What is the Ratio of Females per 100 Males in Hailey?
There are 105.47 Females per 100 Males in Hailey.
What is the Median Population Age in Hailey?
Median Population Age in Hailey is 40.8 Years.
What is the Average Family Size in Hailey
Average Family Size in Hailey is 3.4 People.
What is the Average Household Size in Hailey
Average Household Size in Hailey is 2.8 People.
What is Per Capita Income in Hailey?
Per Capita income in Hailey is $34,710.
What is the Median Family Income in Hailey?
Median Family Income in Hailey is $81,849.
What is the Median Household income in Hailey?
Median Household Income in Hailey is $77,035.
What is Income or Wage Gap in Hailey?
Income or Wage Gap in Hailey is 11.0%.
Women in Hailey earn 89.0 cents for every dollar earned by a man.
What is Inequality or Gini Index in Hailey?
Inequality or Gini Index in Hailey is 0.38.
How Large is the Labor Force in Hailey?
There are 5,387 People in the Labor Forcein in Hailey.
What is the Percentage of People in the Labor Force in Hailey?
76.5% of People are in the Labor Force in Hailey.
What is the Unemployment Rate in Hailey?
Unemployment Rate in Hailey is 3.2%.