Gooding, ID Map & Demographics
Gooding Map
Gooding Overview
$22,124
PER CAPITA INCOME
$64,063
AVG FAMILY INCOME
$42,470
AVG HOUSEHOLD INCOME
57.3%
WAGE / INCOME GAP [ % ]
42.7¢/ $1
WAGE / INCOME GAP [ $ ]
0.42
INEQUALITY / GINI INDEX
3,673
TOTAL POPULATION
1,637
MALE POPULATION
2,036
FEMALE POPULATION
80.40
MALES / 100 FEMALES
124.37
FEMALES / 100 MALES
38.6
MEDIAN AGE
3.2
AVG FAMILY SIZE
2.6
AVG HOUSEHOLD SIZE
1,733
LABOR FORCE [ PEOPLE ]
61.0%
PERCENT IN LABOR FORCE
10.3%
UNEMPLOYMENT RATE
Gooding Zip Codes
Gooding Area Codes
Income in Gooding
Income Overview in Gooding
Per Capita Income in Gooding is $22,124, while median incomes of families and households are $64,063 and $42,470 respectively.
| Characteristic | Number | Measure |
| Per Capita Income | 3,673 | $22,124 |
| Median Family Income | 847 | $64,063 |
| Mean Family Income | 847 | $67,695 |
| Median Household Income | 1,387 | $42,470 |
| Mean Household Income | 1,387 | $54,682 |
| Income Deficit | 847 | $0 |
| Wage / Income Gap (%) | 3,673 | 57.30% |
| Wage / Income Gap ($) | 3,673 | 42.70¢ per $1 |
| Gini / Inequality Index | 3,673 | 0.42 |
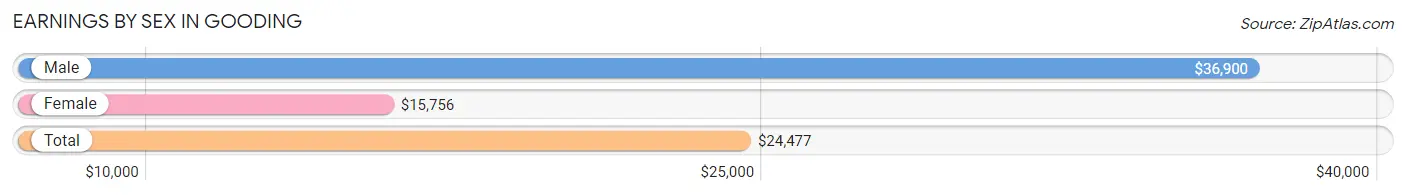
Earnings by Sex in Gooding
Average Earnings in Gooding are $24,477, $36,900 for men and $15,756 for women, a difference of 57.3%.
| Sex | Number | Average Earnings |
| Male | 831 (48.1%) | $36,900 |
| Female | 896 (51.9%) | $15,756 |
| Total | 1,727 (100.0%) | $24,477 |
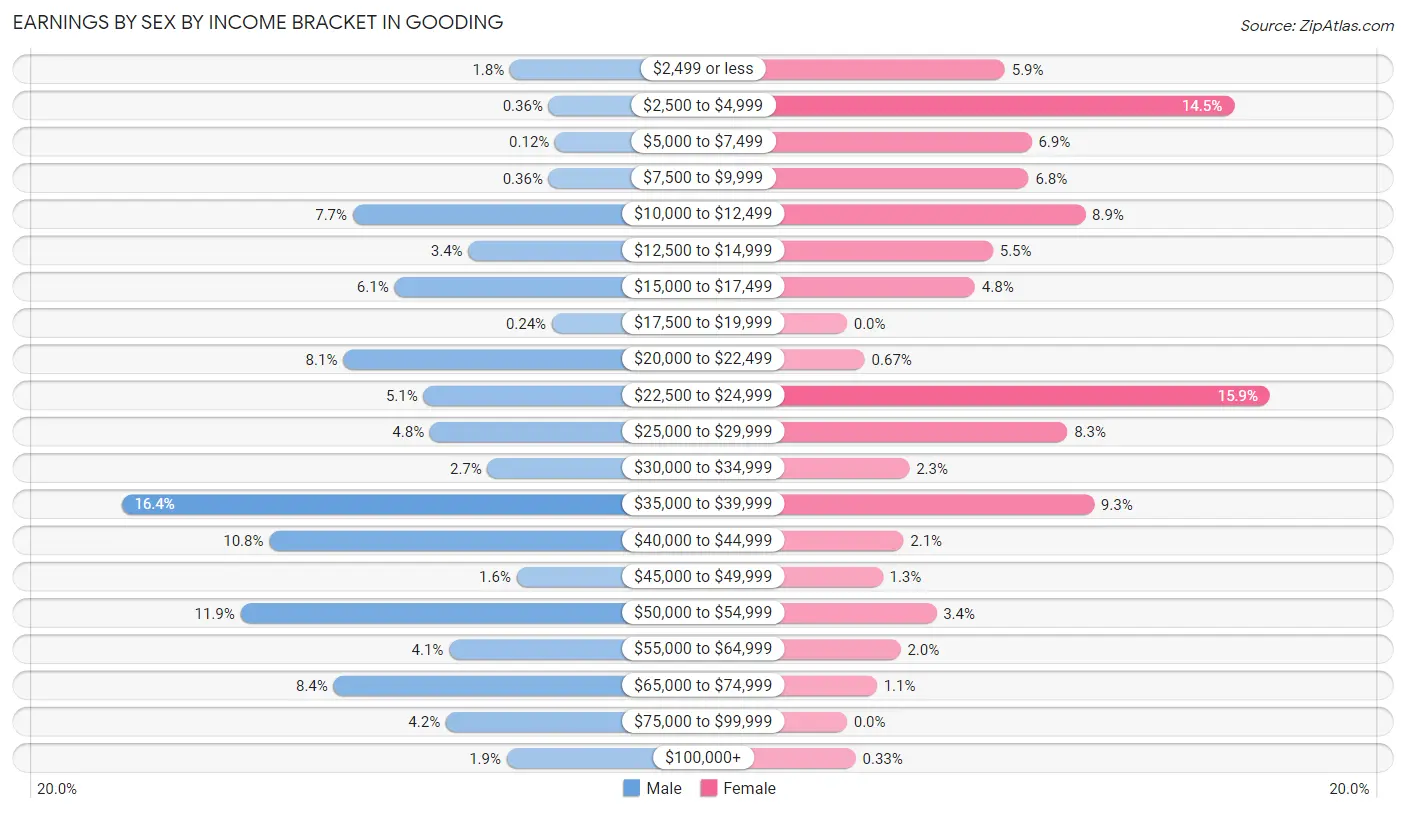
Earnings by Sex by Income Bracket in Gooding
The most common earnings brackets in Gooding are $35,000 to $39,999 for men (136 | 16.4%) and $22,500 to $24,999 for women (142 | 15.9%).
| Income | Male | Female |
| $2,499 or less | 15 (1.8%) | 53 (5.9%) |
| $2,500 to $4,999 | 3 (0.4%) | 130 (14.5%) |
| $5,000 to $7,499 | 1 (0.1%) | 62 (6.9%) |
| $7,500 to $9,999 | 3 (0.4%) | 61 (6.8%) |
| $10,000 to $12,499 | 64 (7.7%) | 80 (8.9%) |
| $12,500 to $14,999 | 28 (3.4%) | 49 (5.5%) |
| $15,000 to $17,499 | 51 (6.1%) | 43 (4.8%) |
| $17,500 to $19,999 | 2 (0.2%) | 0 (0.0%) |
| $20,000 to $22,499 | 67 (8.1%) | 6 (0.7%) |
| $22,500 to $24,999 | 42 (5.1%) | 142 (15.9%) |
| $25,000 to $29,999 | 40 (4.8%) | 74 (8.3%) |
| $30,000 to $34,999 | 22 (2.6%) | 21 (2.3%) |
| $35,000 to $39,999 | 136 (16.4%) | 83 (9.3%) |
| $40,000 to $44,999 | 90 (10.8%) | 19 (2.1%) |
| $45,000 to $49,999 | 13 (1.6%) | 12 (1.3%) |
| $50,000 to $54,999 | 99 (11.9%) | 30 (3.4%) |
| $55,000 to $64,999 | 34 (4.1%) | 18 (2.0%) |
| $65,000 to $74,999 | 70 (8.4%) | 10 (1.1%) |
| $75,000 to $99,999 | 35 (4.2%) | 0 (0.0%) |
| $100,000+ | 16 (1.9%) | 3 (0.3%) |
| Total | 831 (100.0%) | 896 (100.0%) |
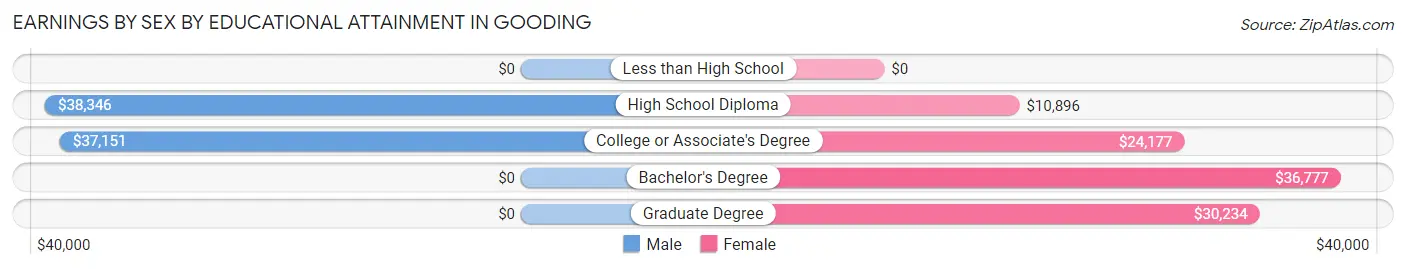
Earnings by Sex by Educational Attainment in Gooding
Average earnings in Gooding are $36,985 for men and $22,897 for women, a difference of 38.1%. Men with an educational attainment of high school diploma enjoy the highest average annual earnings of $38,346, while those with college or associate's degree education earn the least with $37,151. Women with an educational attainment of bachelor's degree earn the most with the average annual earnings of $36,777, while those with high school diploma education have the smallest earnings of $10,896.
| Educational Attainment | Male Income | Female Income |
| Less than High School | - | - |
| High School Diploma | $38,346 | $10,896 |
| College or Associate's Degree | $37,151 | $24,177 |
| Bachelor's Degree | - | - |
| Graduate Degree | - | - |
| Total | $36,985 | $22,897 |
Family Income in Gooding
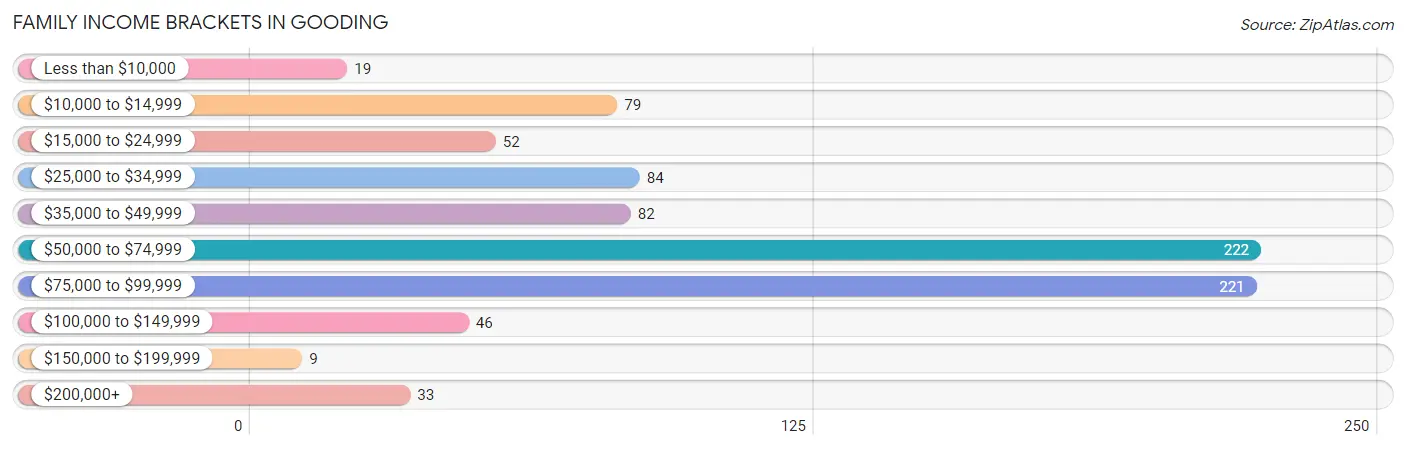
Family Income Brackets in Gooding
According to the Gooding family income data, there are 222 families falling into the $50,000 to $74,999 income range, which is the most common income bracket and makes up 26.2% of all families. Conversely, the $150,000 to $199,999 income bracket is the least frequent group with only 9 families (1.1%) belonging to this category.
| Income Bracket | # Families | % Families |
| Less than $10,000 | 19 | 2.2% |
| $10,000 to $14,999 | 79 | 9.3% |
| $15,000 to $24,999 | 52 | 6.1% |
| $25,000 to $34,999 | 84 | 9.9% |
| $35,000 to $49,999 | 82 | 9.7% |
| $50,000 to $74,999 | 222 | 26.2% |
| $75,000 to $99,999 | 221 | 26.1% |
| $100,000 to $149,999 | 46 | 5.4% |
| $150,000 to $199,999 | 9 | 1.1% |
| $200,000+ | 33 | 3.9% |
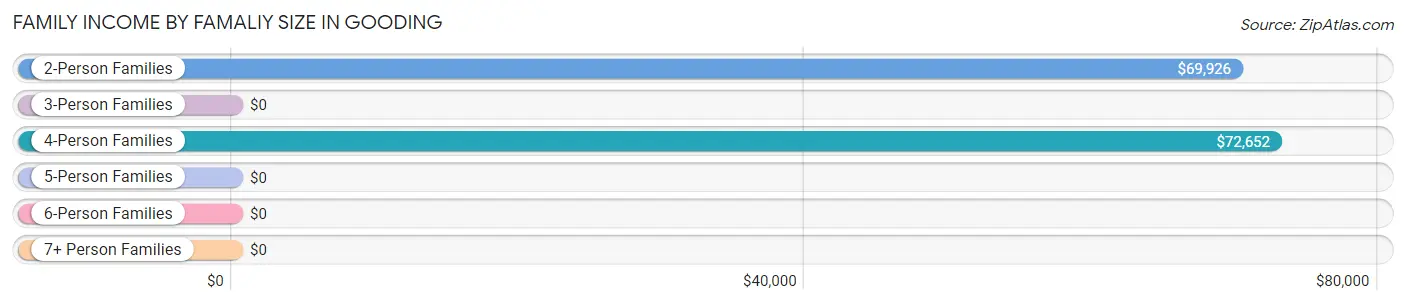
Family Income by Famaliy Size in Gooding
4-person families (157 | 18.5%) account for the highest median family income in Gooding with $72,652 per family, while 2-person families (407 | 48.0%) have the highest median income of $34,963 per family member.
| Income Bracket | # Families | Median Income |
| 2-Person Families | 407 (48.0%) | $69,926 |
| 3-Person Families | 198 (23.4%) | $0 |
| 4-Person Families | 157 (18.5%) | $72,652 |
| 5-Person Families | 82 (9.7%) | $0 |
| 6-Person Families | 0 (0.0%) | $0 |
| 7+ Person Families | 3 (0.4%) | $0 |
| Total | 847 (100.0%) | $64,063 |
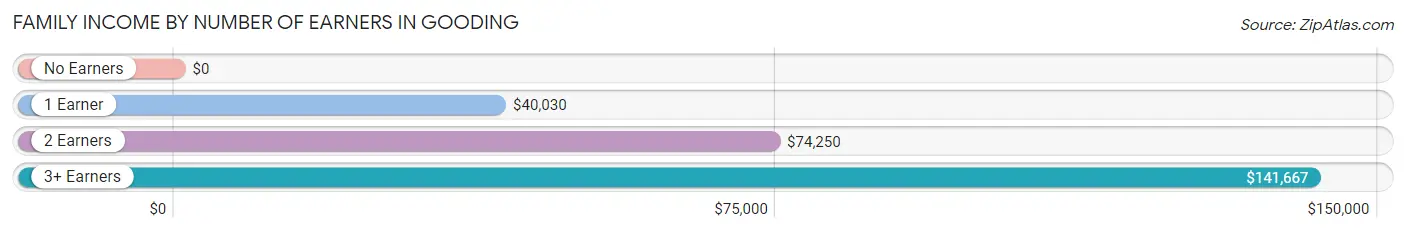
Family Income by Number of Earners in Gooding
| Number of Earners | # Families | Median Income |
| No Earners | 80 (9.5%) | $0 |
| 1 Earner | 337 (39.8%) | $40,030 |
| 2 Earners | 410 (48.4%) | $74,250 |
| 3+ Earners | 20 (2.4%) | $141,667 |
| Total | 847 (100.0%) | $64,063 |
Household Income in Gooding
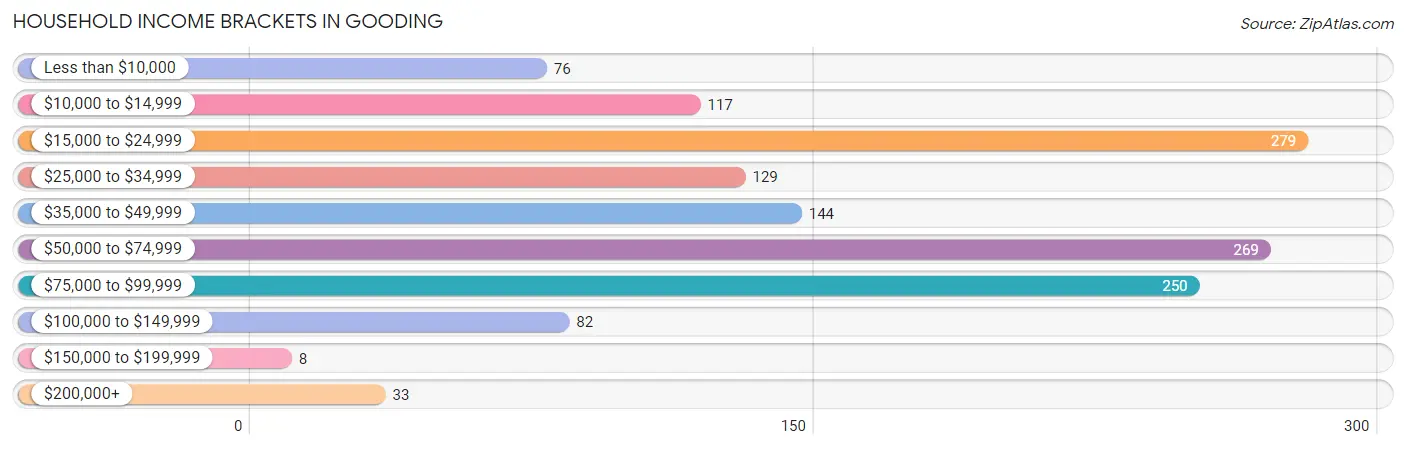
Household Income Brackets in Gooding
With 279 households falling in the category, the $15,000 to $24,999 income range is the most frequent in Gooding, accounting for 20.1% of all households. In contrast, only 8 households (0.6%) fall into the $150,000 to $199,999 income bracket, making it the least populous group.
| Income Bracket | # Households | % Households |
| Less than $10,000 | 76 | 5.5% |
| $10,000 to $14,999 | 117 | 8.4% |
| $15,000 to $24,999 | 279 | 20.1% |
| $25,000 to $34,999 | 129 | 9.3% |
| $35,000 to $49,999 | 144 | 10.4% |
| $50,000 to $74,999 | 269 | 19.4% |
| $75,000 to $99,999 | 250 | 18.0% |
| $100,000 to $149,999 | 82 | 5.9% |
| $150,000 to $199,999 | 8 | 0.6% |
| $200,000+ | 33 | 2.4% |
Household Income by Householder Age in Gooding
The median household income in Gooding is $42,470, with the highest median household income of $62,563 found in the 65+ years age bracket for the primary householder. A total of 465 households (33.5%) fall into this category. Meanwhile, the 15 to 24 years age bracket for the primary householder has the lowest median household income of $2,499, with 55 households (4.0%) in this group.
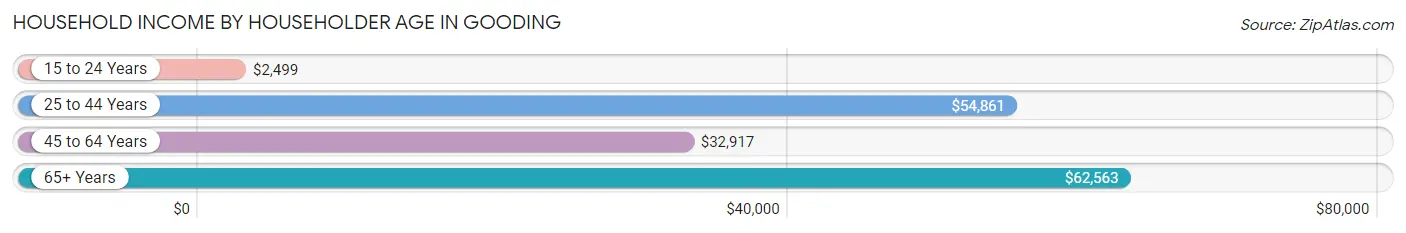
| Income Bracket | # Households | Median Income |
| 15 to 24 Years | 55 (4.0%) | $2,499 |
| 25 to 44 Years | 468 (33.7%) | $54,861 |
| 45 to 64 Years | 399 (28.8%) | $32,917 |
| 65+ Years | 465 (33.5%) | $62,563 |
| Total | 1,387 (100.0%) | $42,470 |
Poverty in Gooding
Income Below Poverty by Sex and Age in Gooding
With 10.5% poverty level for males and 31.4% for females among the residents of Gooding, 18 to 24 year old males and 5 year old females are the most vulnerable to poverty, with 69 males (76.7%) and 47 females (100.0%) in their respective age groups living below the poverty level.
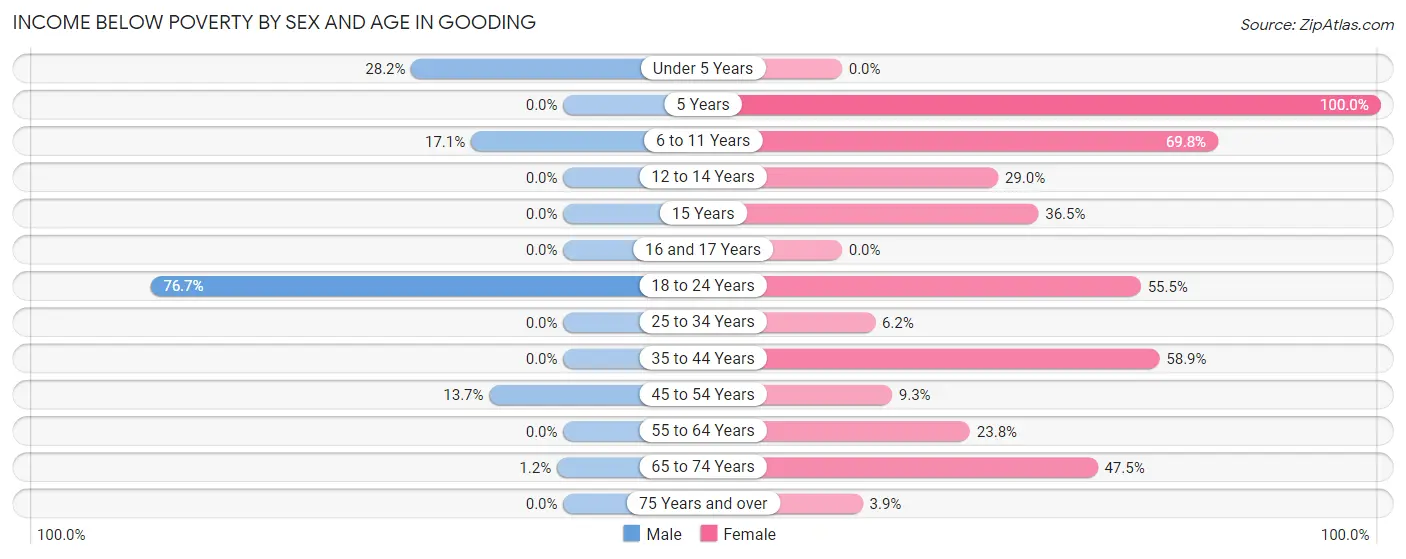
| Age Bracket | Male | Female |
| Under 5 Years | 22 (28.2%) | 0 (0.0%) |
| 5 Years | 0 (0.0%) | 47 (100.0%) |
| 6 to 11 Years | 37 (17.1%) | 111 (69.8%) |
| 12 to 14 Years | 0 (0.0%) | 20 (29.0%) |
| 15 Years | 0 (0.0%) | 31 (36.5%) |
| 16 and 17 Years | 0 (0.0%) | 0 (0.0%) |
| 18 to 24 Years | 69 (76.7%) | 162 (55.5%) |
| 25 to 34 Years | 0 (0.0%) | 13 (6.2%) |
| 35 to 44 Years | 0 (0.0%) | 89 (58.9%) |
| 45 to 54 Years | 32 (13.7%) | 25 (9.3%) |
| 55 to 64 Years | 0 (0.0%) | 68 (23.8%) |
| 65 to 74 Years | 3 (1.2%) | 56 (47.5%) |
| 75 Years and over | 0 (0.0%) | 8 (3.9%) |
| Total | 163 (10.5%) | 630 (31.4%) |
Income Above Poverty by Sex and Age in Gooding
According to the poverty statistics in Gooding, males aged 12 to 14 years and females aged under 5 years are the age groups that are most secure financially, with 100.0% of males and 100.0% of females in these age groups living above the poverty line.
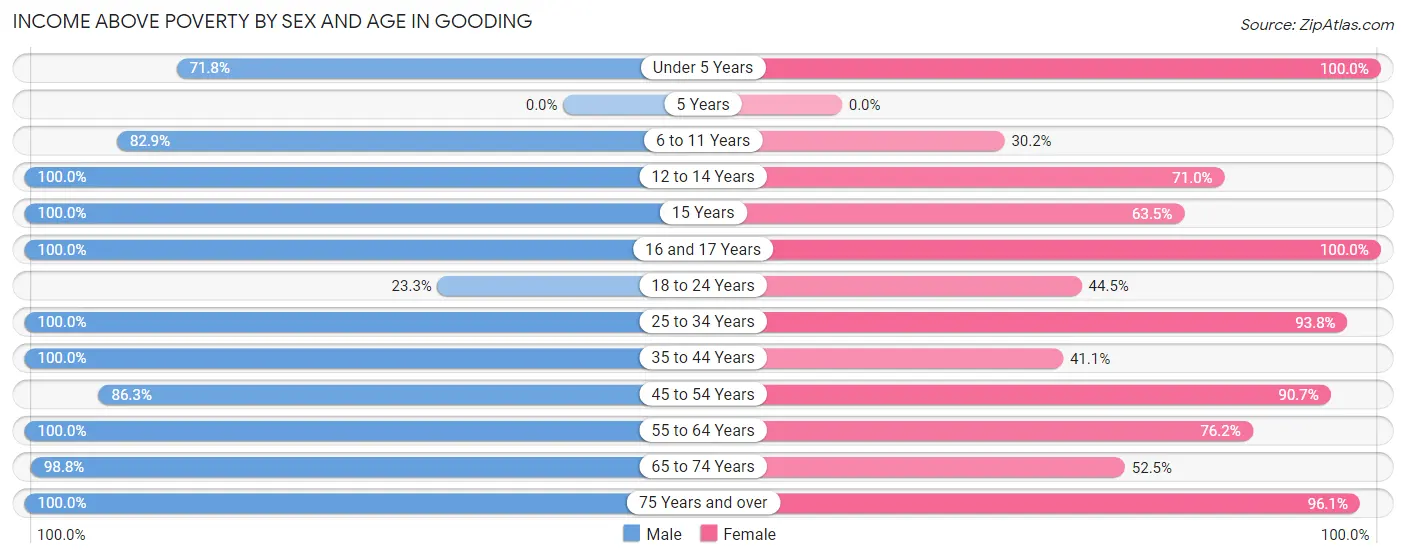
| Age Bracket | Male | Female |
| Under 5 Years | 56 (71.8%) | 97 (100.0%) |
| 5 Years | 0 (0.0%) | 0 (0.0%) |
| 6 to 11 Years | 179 (82.9%) | 48 (30.2%) |
| 12 to 14 Years | 23 (100.0%) | 49 (71.0%) |
| 15 Years | 17 (100.0%) | 54 (63.5%) |
| 16 and 17 Years | 42 (100.0%) | 15 (100.0%) |
| 18 to 24 Years | 21 (23.3%) | 130 (44.5%) |
| 25 to 34 Years | 130 (100.0%) | 198 (93.8%) |
| 35 to 44 Years | 255 (100.0%) | 62 (41.1%) |
| 45 to 54 Years | 201 (86.3%) | 244 (90.7%) |
| 55 to 64 Years | 124 (100.0%) | 218 (76.2%) |
| 65 to 74 Years | 251 (98.8%) | 62 (52.5%) |
| 75 Years and over | 88 (100.0%) | 199 (96.1%) |
| Total | 1,387 (89.5%) | 1,376 (68.6%) |
Income Below Poverty Among Married-Couple Families in Gooding
The poverty statistics for married-couple families in Gooding show that 2.4% or 12 of the total 501 families live below the poverty line. Families with 1 or 2 children have the highest poverty rate of 6.9%, comprising of 12 families. On the other hand, families with no children have the lowest poverty rate of 0.0%, which includes 0 families.
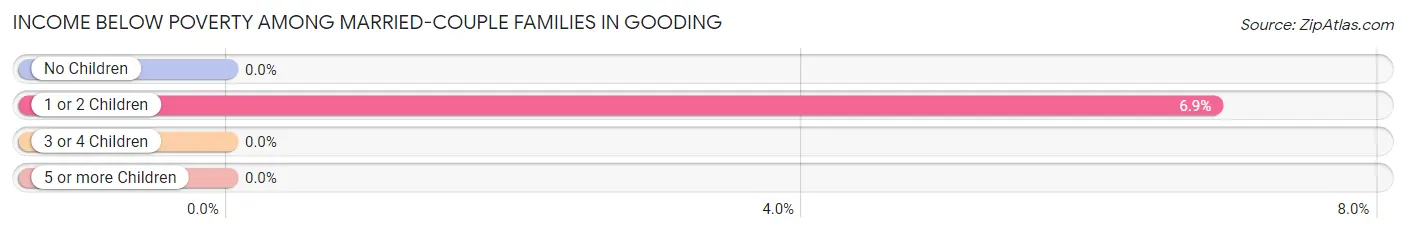
| Children | Above Poverty | Below Poverty |
| No Children | 261 (100.0%) | 0 (0.0%) |
| 1 or 2 Children | 163 (93.1%) | 12 (6.9%) |
| 3 or 4 Children | 65 (100.0%) | 0 (0.0%) |
| 5 or more Children | 0 (0.0%) | 0 (0.0%) |
| Total | 489 (97.6%) | 12 (2.4%) |
Income Below Poverty Among Single-Parent Households in Gooding
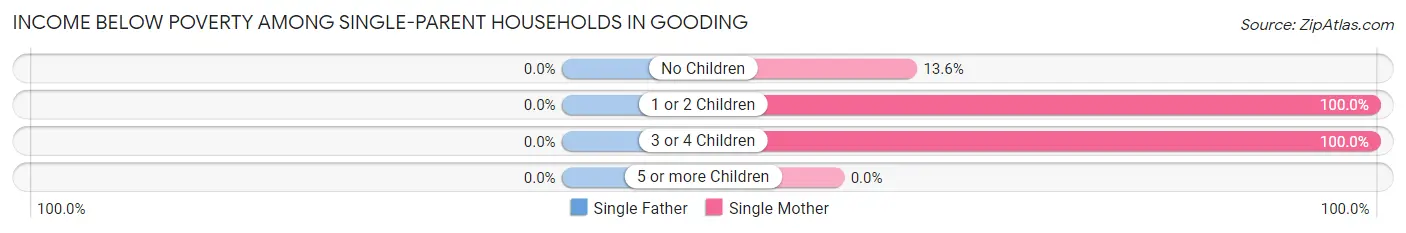
| Children | Single Father | Single Mother |
| No Children | 0 (0.0%) | 8 (13.6%) |
| 1 or 2 Children | 0 (0.0%) | 103 (100.0%) |
| 3 or 4 Children | 0 (0.0%) | 17 (100.0%) |
| 5 or more Children | 0 (0.0%) | 0 (0.0%) |
| Total | 0 (0.0%) | 128 (71.5%) |
Income Below Poverty Among Married-Couple vs Single-Parent Households in Gooding
The poverty data for Gooding shows that 12 of the married-couple family households (2.4%) and 128 of the single-parent households (37.0%) are living below the poverty level. Within the married-couple family households, those with 1 or 2 children have the highest poverty rate, with 12 households (6.9%) falling below the poverty line. Among the single-parent households, those with 3 or 4 children have the highest poverty rate, with 17 household (100.0%) living below poverty.
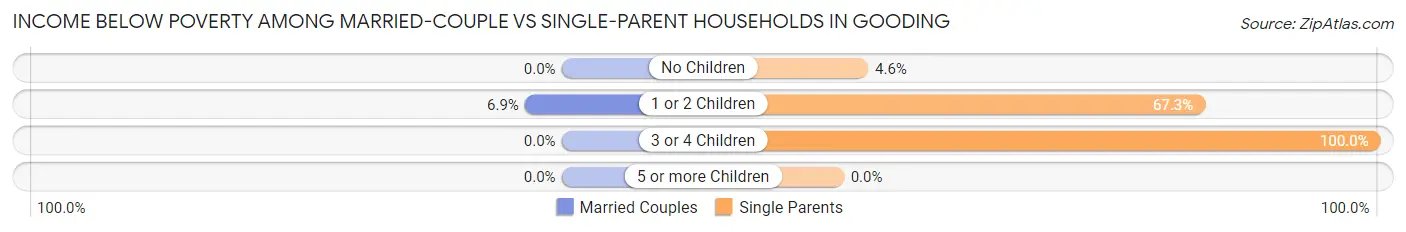
| Children | Married-Couple Families | Single-Parent Households |
| No Children | 0 (0.0%) | 8 (4.5%) |
| 1 or 2 Children | 12 (6.9%) | 103 (67.3%) |
| 3 or 4 Children | 0 (0.0%) | 17 (100.0%) |
| 5 or more Children | 0 (0.0%) | 0 (0.0%) |
| Total | 12 (2.4%) | 128 (37.0%) |
Race in Gooding
The most populous races in Gooding are White / Caucasian (2,840 | 77.3%), Hispanic or Latino (838 | 22.8%), and Some other Race (377 | 10.3%).
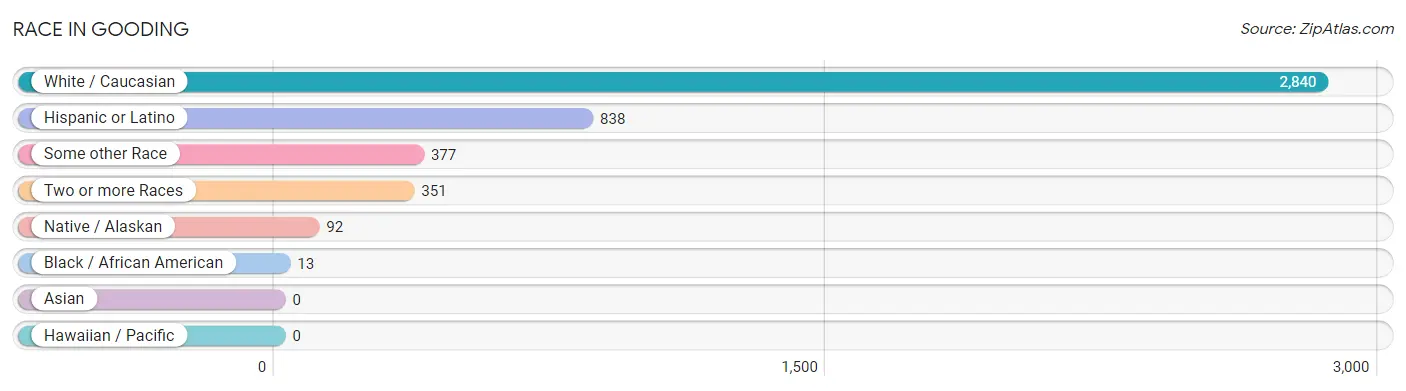
| Race | # Population | % Population |
| Asian | 0 | 0.0% |
| Black / African American | 13 | 0.4% |
| Hawaiian / Pacific | 0 | 0.0% |
| Hispanic or Latino | 838 | 22.8% |
| Native / Alaskan | 92 | 2.5% |
| White / Caucasian | 2,840 | 77.3% |
| Two or more Races | 351 | 9.6% |
| Some other Race | 377 | 10.3% |
| Total | 3,673 | 100.0% |
Ancestry in Gooding
The most populous ancestries reported in Gooding are Mexican (835 | 22.7%), English (595 | 16.2%), Irish (332 | 9.0%), German (282 | 7.7%), and American (208 | 5.7%), together accounting for 61.3% of all Gooding residents.
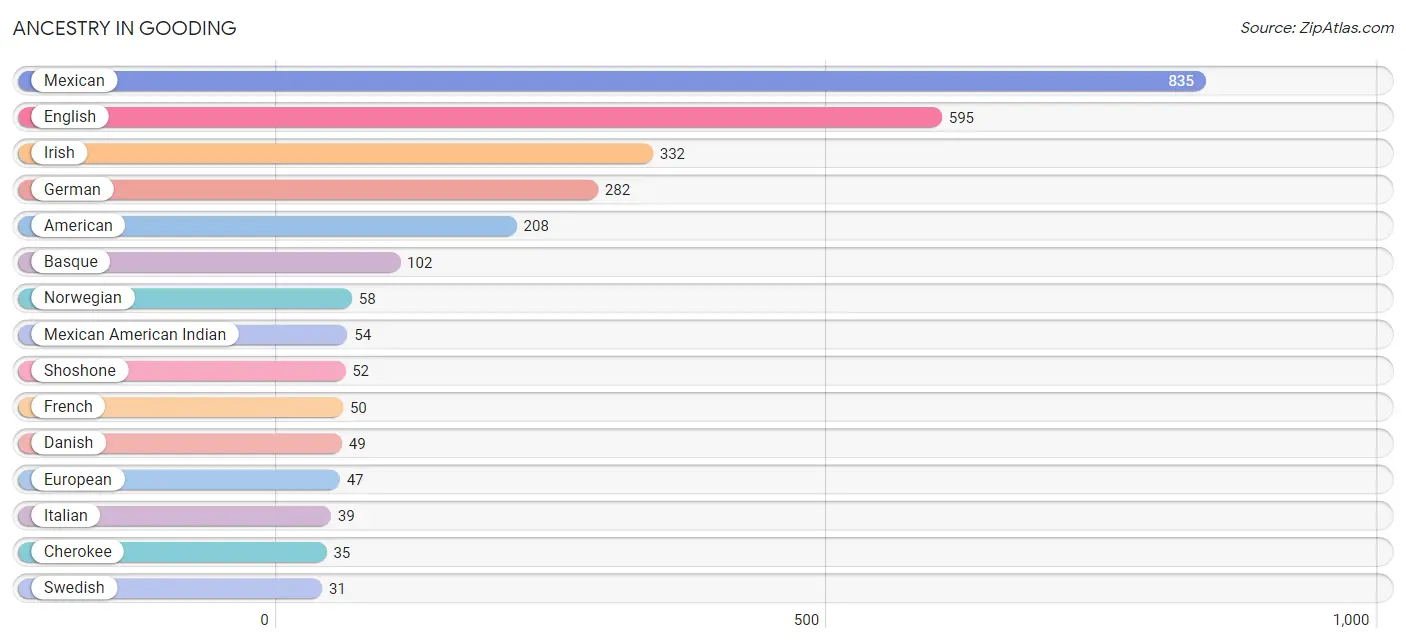
| Ancestry | # Population | % Population |
| American | 208 | 5.7% |
| Basque | 102 | 2.8% |
| Bolivian | 1 | 0.0% |
| British | 15 | 0.4% |
| Cherokee | 35 | 0.9% |
| Czech | 22 | 0.6% |
| Danish | 49 | 1.3% |
| English | 595 | 16.2% |
| European | 47 | 1.3% |
| French | 50 | 1.4% |
| German | 282 | 7.7% |
| Irish | 332 | 9.0% |
| Italian | 39 | 1.1% |
| Mexican | 835 | 22.7% |
| Mexican American Indian | 54 | 1.5% |
| Norwegian | 58 | 1.6% |
| Polish | 16 | 0.4% |
| Portuguese | 2 | 0.1% |
| Scandinavian | 1 | 0.0% |
| Scotch-Irish | 16 | 0.4% |
| Scottish | 28 | 0.8% |
| Shoshone | 52 | 1.4% |
| South American | 1 | 0.0% |
| South American Indian | 1 | 0.0% |
| Subsaharan African | 7 | 0.2% |
| Swedish | 31 | 0.8% |
| Welsh | 24 | 0.6% |
| Yugoslavian | 20 | 0.5% | View All 28 Rows |
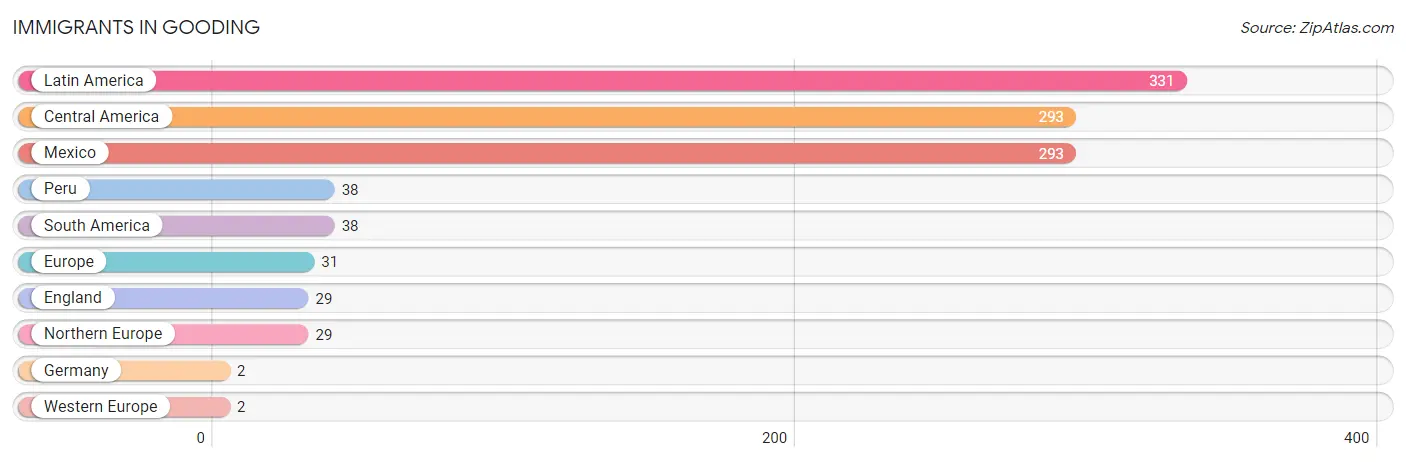
Immigrants in Gooding
The most numerous immigrant groups reported in Gooding came from Latin America (331 | 9.0%), Central America (293 | 8.0%), Mexico (293 | 8.0%), Peru (38 | 1.0%), and South America (38 | 1.0%), together accounting for 27.0% of all Gooding residents.
| Immigration Origin | # Population | % Population |
| Central America | 293 | 8.0% |
| England | 29 | 0.8% |
| Europe | 31 | 0.8% |
| Germany | 2 | 0.1% |
| Latin America | 331 | 9.0% |
| Mexico | 293 | 8.0% |
| Northern Europe | 29 | 0.8% |
| Peru | 38 | 1.0% |
| South America | 38 | 1.0% |
| Western Europe | 2 | 0.1% | View All 10 Rows |
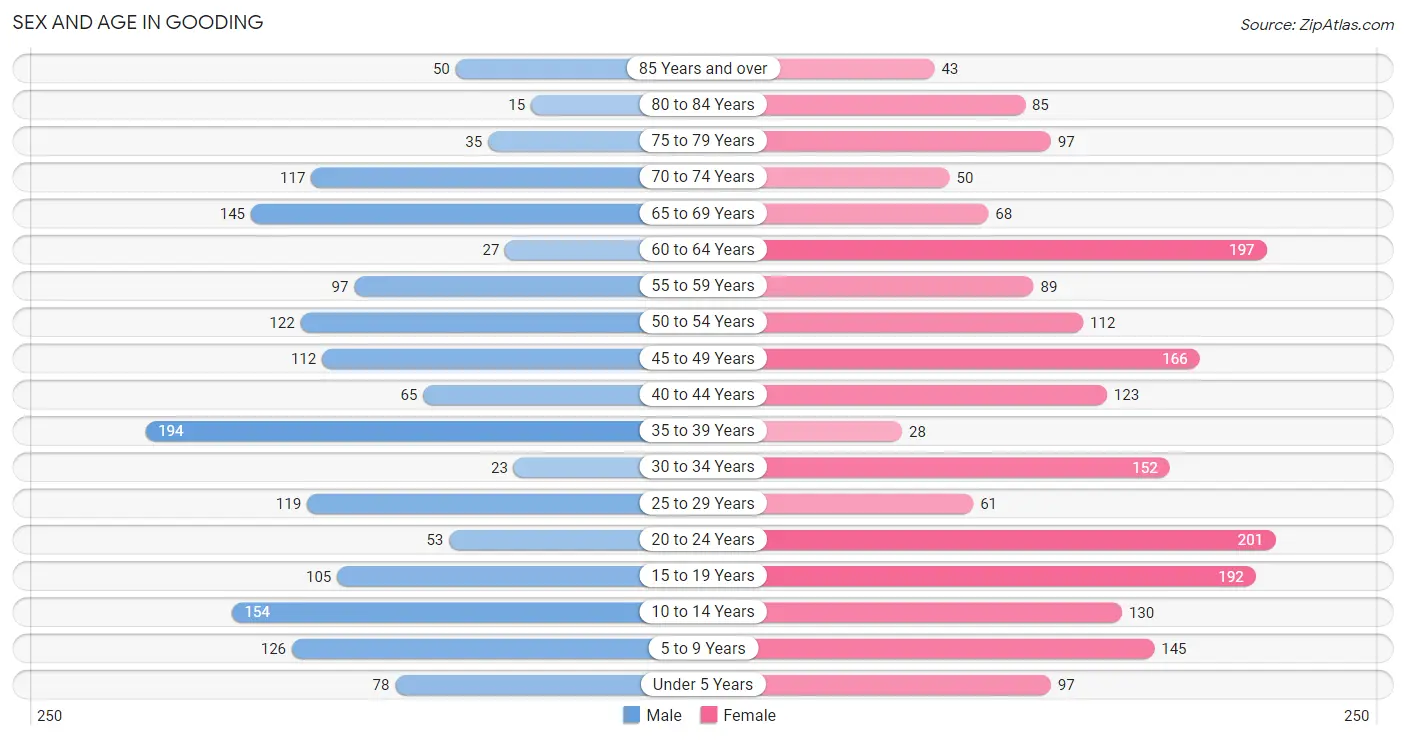
Sex and Age in Gooding
Sex and Age in Gooding
The most populous age groups in Gooding are 35 to 39 Years (194 | 11.8%) for men and 20 to 24 Years (201 | 9.9%) for women.
| Age Bracket | Male | Female |
| Under 5 Years | 78 (4.8%) | 97 (4.8%) |
| 5 to 9 Years | 126 (7.7%) | 145 (7.1%) |
| 10 to 14 Years | 154 (9.4%) | 130 (6.4%) |
| 15 to 19 Years | 105 (6.4%) | 192 (9.4%) |
| 20 to 24 Years | 53 (3.2%) | 201 (9.9%) |
| 25 to 29 Years | 119 (7.3%) | 61 (3.0%) |
| 30 to 34 Years | 23 (1.4%) | 152 (7.5%) |
| 35 to 39 Years | 194 (11.8%) | 28 (1.4%) |
| 40 to 44 Years | 65 (4.0%) | 123 (6.0%) |
| 45 to 49 Years | 112 (6.8%) | 166 (8.2%) |
| 50 to 54 Years | 122 (7.4%) | 112 (5.5%) |
| 55 to 59 Years | 97 (5.9%) | 89 (4.4%) |
| 60 to 64 Years | 27 (1.7%) | 197 (9.7%) |
| 65 to 69 Years | 145 (8.9%) | 68 (3.3%) |
| 70 to 74 Years | 117 (7.1%) | 50 (2.5%) |
| 75 to 79 Years | 35 (2.1%) | 97 (4.8%) |
| 80 to 84 Years | 15 (0.9%) | 85 (4.2%) |
| 85 Years and over | 50 (3.0%) | 43 (2.1%) |
| Total | 1,637 (100.0%) | 2,036 (100.0%) |
Families and Households in Gooding
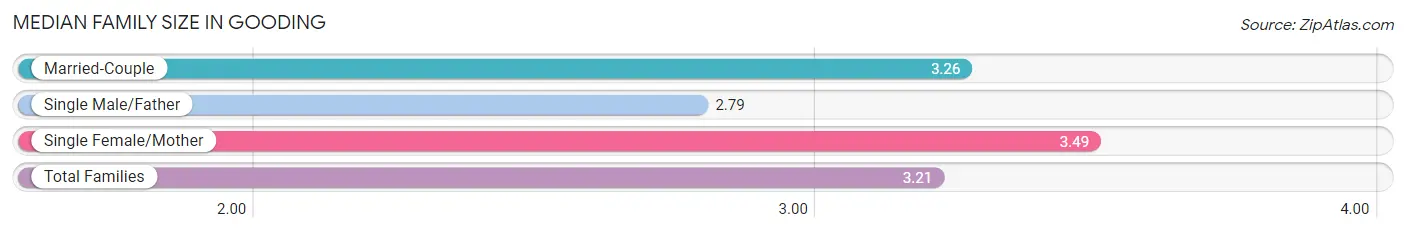
Median Family Size in Gooding
The median family size in Gooding is 3.21 persons per family, with single female/mother families (179 | 21.1%) accounting for the largest median family size of 3.49 persons per family. On the other hand, single male/father families (167 | 19.7%) represent the smallest median family size with 2.79 persons per family.
| Family Type | # Families | Family Size |
| Married-Couple | 501 (59.2%) | 3.26 |
| Single Male/Father | 167 (19.7%) | 2.79 |
| Single Female/Mother | 179 (21.1%) | 3.49 |
| Total Families | 847 (100.0%) | 3.21 |
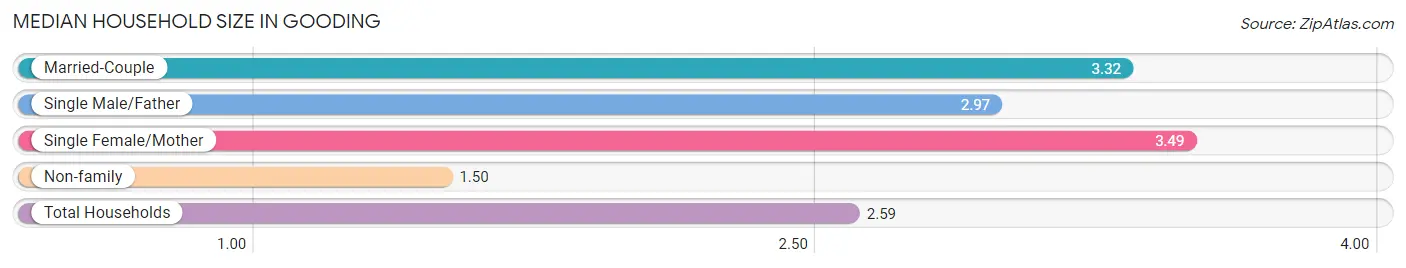
Median Household Size in Gooding
The median household size in Gooding is 2.59 persons per household, with single female/mother households (179 | 12.9%) accounting for the largest median household size of 3.49 persons per household. non-family households (540 | 38.9%) represent the smallest median household size with 1.50 persons per household.
| Household Type | # Households | Household Size |
| Married-Couple | 501 (36.1%) | 3.32 |
| Single Male/Father | 167 (12.0%) | 2.97 |
| Single Female/Mother | 179 (12.9%) | 3.49 |
| Non-family | 540 (38.9%) | 1.50 |
| Total Households | 1,387 (100.0%) | 2.59 |
Household Size by Marriage Status in Gooding
Out of a total of 1,387 households in Gooding, 847 (61.1%) are family households, while 540 (38.9%) are nonfamily households. The most numerous type of family households are 2-person households, comprising 402, and the most common type of nonfamily households are 1-person households, comprising 439.
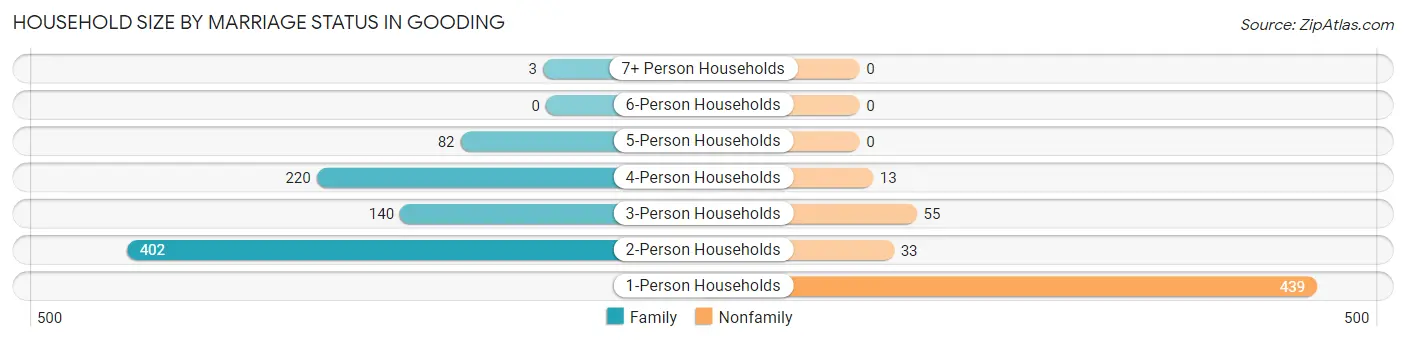
| Household Size | Family Households | Nonfamily Households |
| 1-Person Households | - | 439 (31.7%) |
| 2-Person Households | 402 (29.0%) | 33 (2.4%) |
| 3-Person Households | 140 (10.1%) | 55 (4.0%) |
| 4-Person Households | 220 (15.9%) | 13 (0.9%) |
| 5-Person Households | 82 (5.9%) | 0 (0.0%) |
| 6-Person Households | 0 (0.0%) | 0 (0.0%) |
| 7+ Person Households | 3 (0.2%) | 0 (0.0%) |
| Total | 847 (61.1%) | 540 (38.9%) |
Female Fertility in Gooding
Fertility by Age in Gooding
Average fertility rate in Gooding is 69.0 births per 1,000 women. Women in the age bracket of 20 to 34 years have the highest fertility rate with 126.0 births per 1,000 women. Women in the age bracket of 20 to 34 years acount for 81.2% of all women with births.
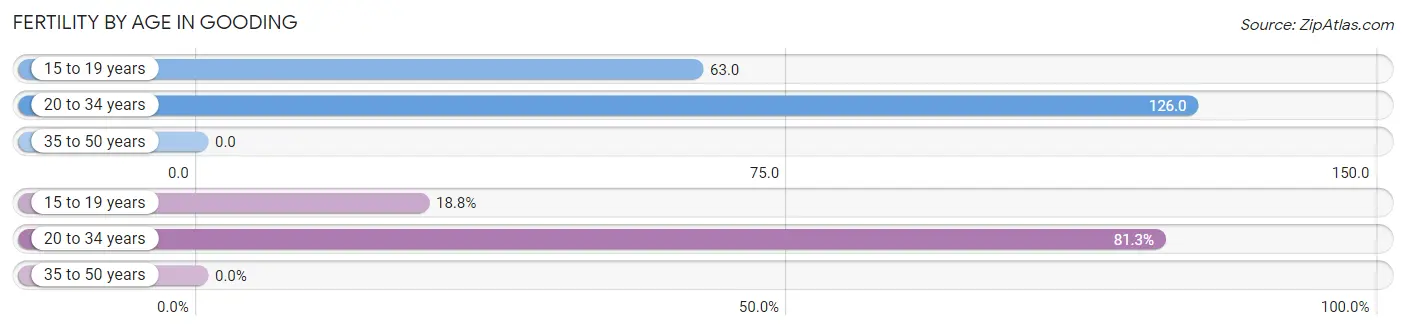
| Age Bracket | Women with Births | Births / 1,000 Women |
| 15 to 19 years | 12 (18.8%) | 63.0 |
| 20 to 34 years | 52 (81.2%) | 126.0 |
| 35 to 50 years | 0 (0.0%) | 0.0 |
| Total | 64 (100.0%) | 69.0 |
Fertility by Age by Marriage Status in Gooding
81.2% of women with births (64) in Gooding are married. The highest percentage of unmarried women with births falls into 15 to 19 years age bracket with 100.0% of them unmarried at the time of birth, while the lowest percentage of unmarried women with births belong to 20 to 34 years age bracket with 0.0% of them unmarried.
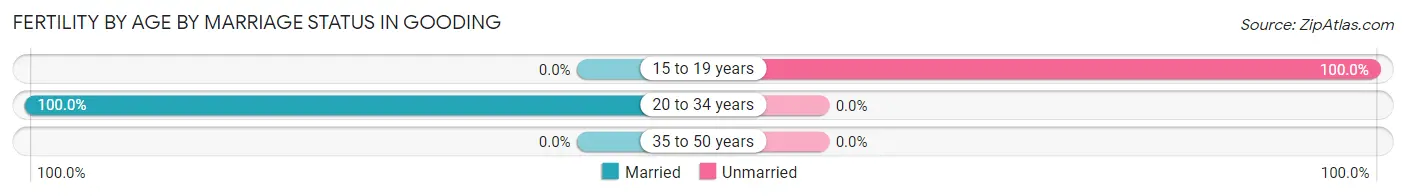
| Age Bracket | Married | Unmarried |
| 15 to 19 years | 0 (0.0%) | 12 (100.0%) |
| 20 to 34 years | 52 (100.0%) | 0 (0.0%) |
| 35 to 50 years | 0 (0.0%) | 0 (0.0%) |
| Total | 52 (81.2%) | 12 (18.8%) |
Fertility by Education in Gooding
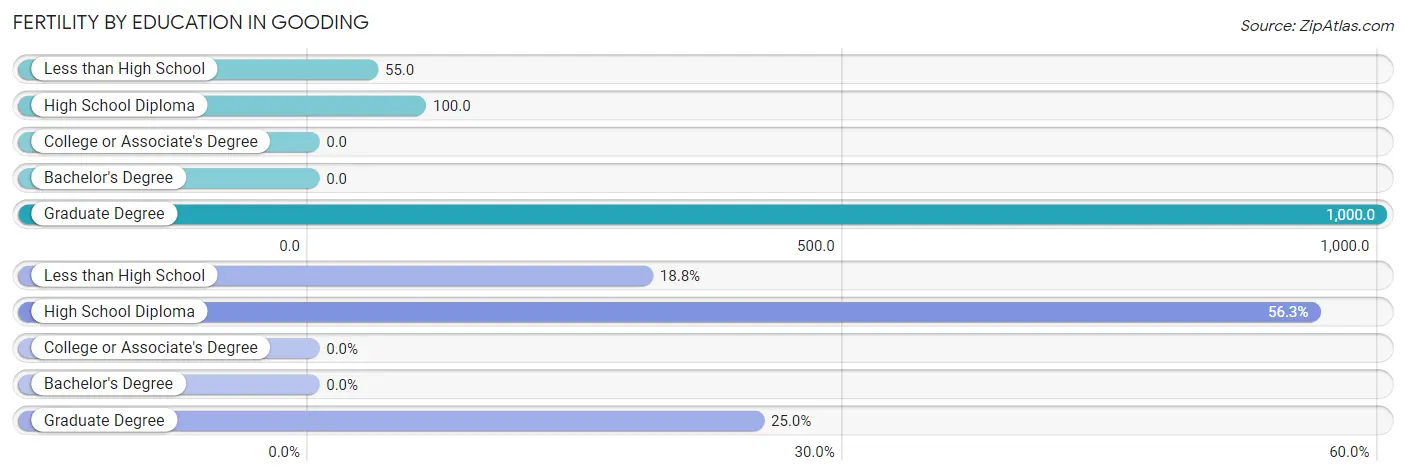
| Educational Attainment | Women with Births | Births / 1,000 Women |
| Less than High School | 12 (18.8%) | 55.0 |
| High School Diploma | 36 (56.2%) | 100.0 |
| College or Associate's Degree | 0 (0.0%) | 0.0 |
| Bachelor's Degree | 0 (0.0%) | 0.0 |
| Graduate Degree | 16 (25.0%) | 1,000.0 |
| Total | 64 (100.0%) | 69.0 |
Fertility by Education by Marriage Status in Gooding
18.8% of women with births in Gooding are unmarried. Women with the educational attainment of high school diploma are most likely to be married with 100.0% of them married at childbirth, while women with the educational attainment of less than high school are least likely to be married with 100.0% of them unmarried at childbirth.
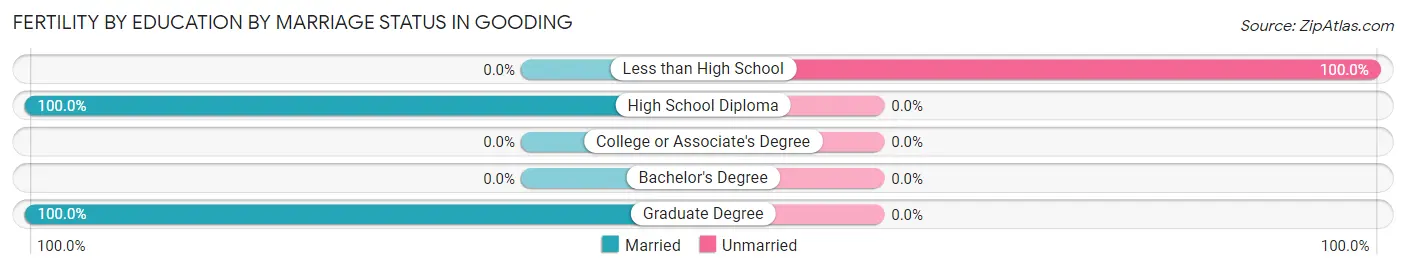
| Educational Attainment | Married | Unmarried |
| Less than High School | 0 (0.0%) | 12 (100.0%) |
| High School Diploma | 36 (100.0%) | 0 (0.0%) |
| College or Associate's Degree | 0 (0.0%) | 0 (0.0%) |
| Bachelor's Degree | 0 (0.0%) | 0 (0.0%) |
| Graduate Degree | 16 (100.0%) | 0 (0.0%) |
| Total | 52 (81.2%) | 12 (18.8%) |
Employment Characteristics in Gooding
Employment by Class of Employer in Gooding
Among the 1,551 employed individuals in Gooding, private company employees (1,001 | 64.5%), state government employees (213 | 13.7%), and self-employed (not incorporated) (117 | 7.5%) make up the most common classes of employment.
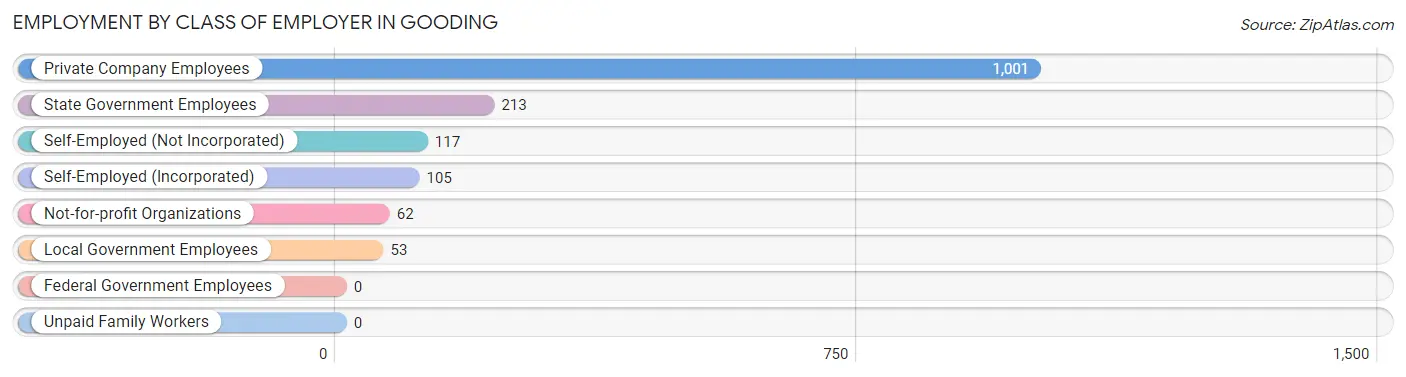
| Employer Class | # Employees | % Employees |
| Private Company Employees | 1,001 | 64.5% |
| Self-Employed (Incorporated) | 105 | 6.8% |
| Self-Employed (Not Incorporated) | 117 | 7.5% |
| Not-for-profit Organizations | 62 | 4.0% |
| Local Government Employees | 53 | 3.4% |
| State Government Employees | 213 | 13.7% |
| Federal Government Employees | 0 | 0.0% |
| Unpaid Family Workers | 0 | 0.0% |
| Total | 1,551 | 100.0% |
Employment Status by Age in Gooding
According to the labor force statistics for Gooding, out of the total population over 16 years of age (2,841), 61.0% or 1,733 individuals are in the labor force, with 10.3% or 178 of them unemployed. The age group with the highest labor force participation rate is 35 to 44 years, with 92.0% or 377 individuals in the labor force. Within the labor force, the 16 to 19 years age range has the highest percentage of unemployed individuals, with 82.8% or 111 of them being unemployed.
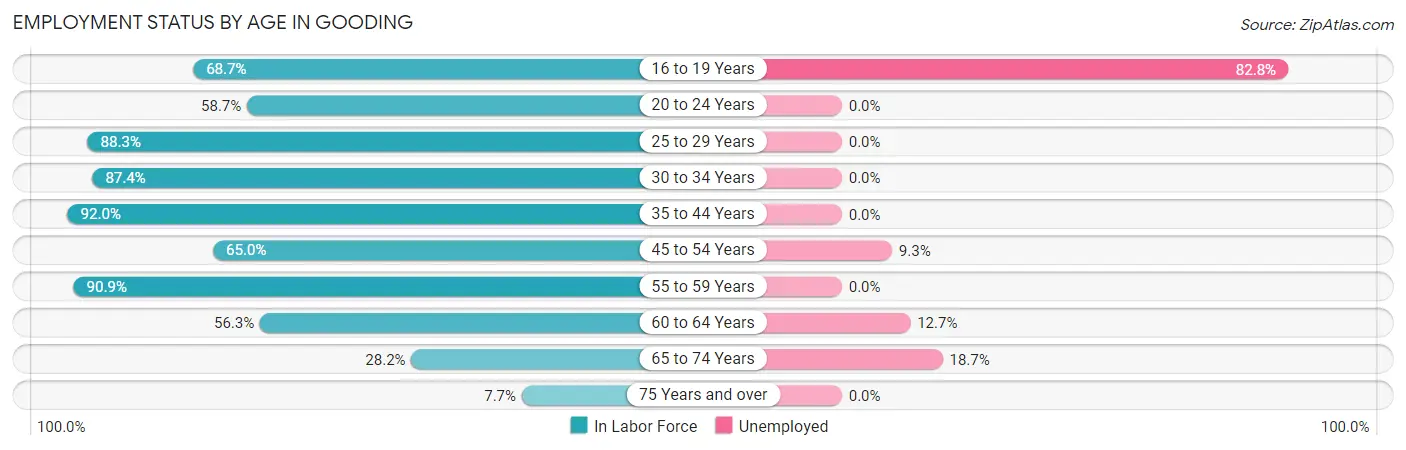
| Age Bracket | In Labor Force | Unemployed |
| 16 to 19 Years | 134 (68.7%) | 111 (82.8%) |
| 20 to 24 Years | 149 (58.7%) | 0 (0.0%) |
| 25 to 29 Years | 159 (88.3%) | 0 (0.0%) |
| 30 to 34 Years | 153 (87.4%) | 0 (0.0%) |
| 35 to 44 Years | 377 (92.0%) | 0 (0.0%) |
| 45 to 54 Years | 333 (65.0%) | 31 (9.3%) |
| 55 to 59 Years | 169 (90.9%) | 0 (0.0%) |
| 60 to 64 Years | 126 (56.3%) | 16 (12.7%) |
| 65 to 74 Years | 107 (28.2%) | 20 (18.7%) |
| 75 Years and over | 25 (7.7%) | 0 (0.0%) |
| Total | 1,733 (61.0%) | 178 (10.3%) |
Employment Status by Educational Attainment in Gooding
According to labor force statistics for Gooding, 78.1% of individuals (1,318) out of the total population between 25 and 64 years of age (1,687) are in the labor force, with 3.6% or 47 of them being unemployed. The group with the highest labor force participation rate are those with the educational attainment of bachelor's degree or higher, with 88.7% or 149 individuals in the labor force. Within the labor force, individuals with high school diploma education have the highest percentage of unemployment, with 8.5% or 37 of them being unemployed.
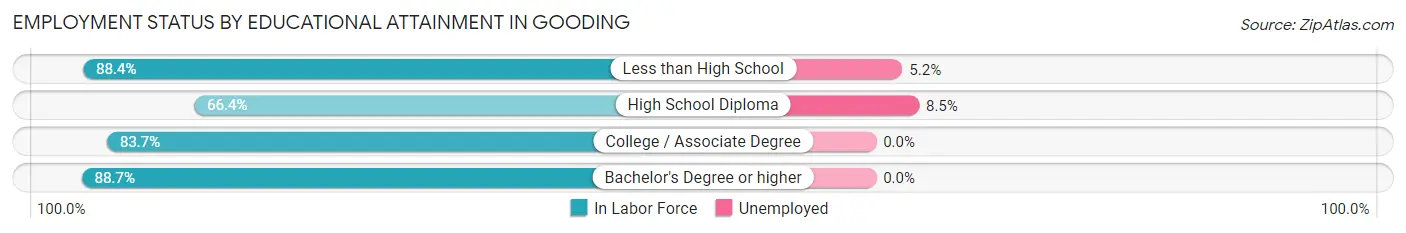
| Educational Attainment | In Labor Force | Unemployed |
| Less than High School | 191 (88.4%) | 11 (5.2%) |
| High School Diploma | 434 (66.4%) | 56 (8.5%) |
| College / Associate Degree | 543 (83.7%) | 0 (0.0%) |
| Bachelor's Degree or higher | 149 (88.7%) | 0 (0.0%) |
| Total | 1,318 (78.1%) | 61 (3.6%) |
Employment Occupations by Sex in Gooding
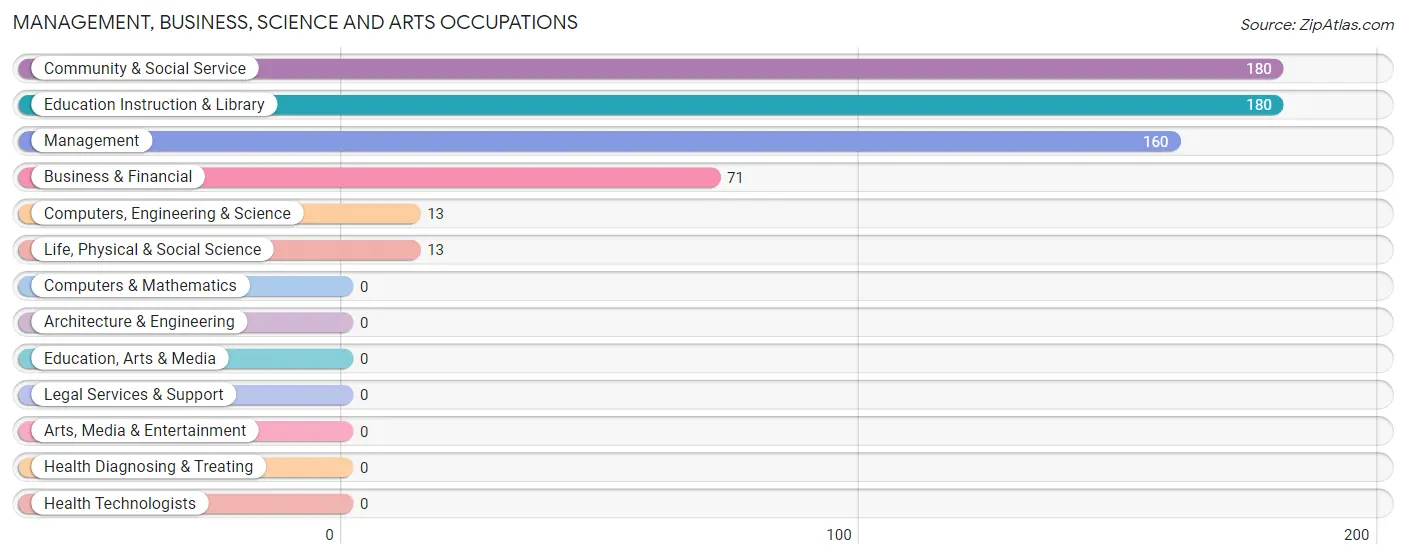
Management, Business, Science and Arts Occupations
The most common Management, Business, Science and Arts occupations in Gooding are Community & Social Service (180 | 11.6%), Education Instruction & Library (180 | 11.6%), Management (160 | 10.3%), Business & Financial (71 | 4.6%), and Computers, Engineering & Science (13 | 0.8%).
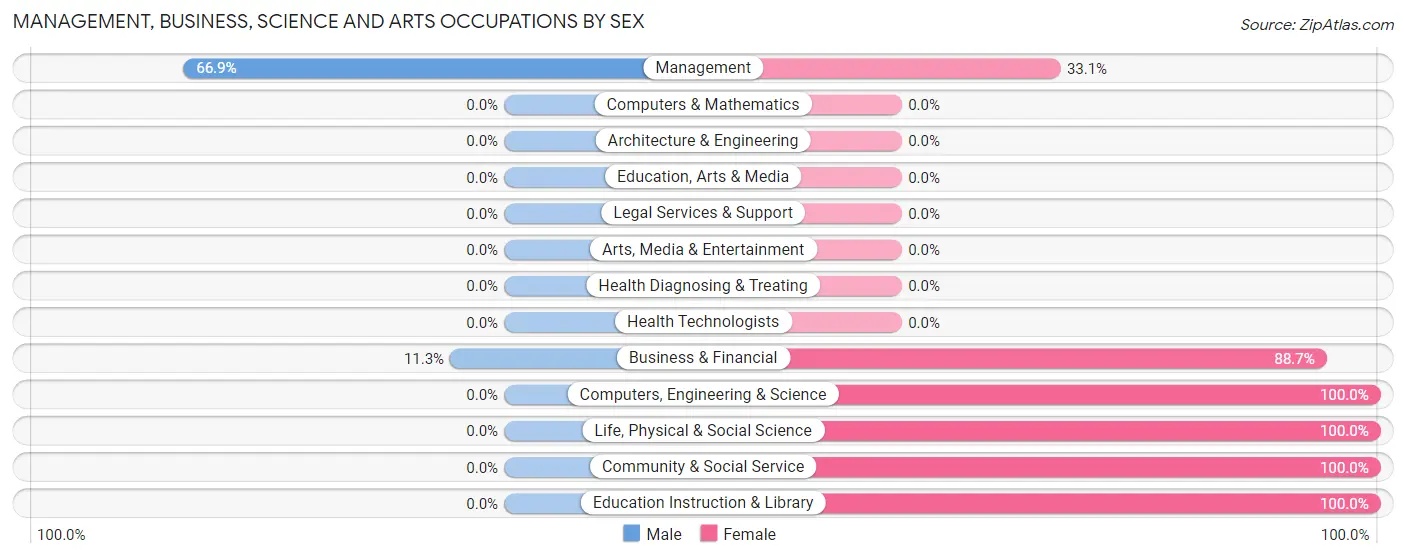
Management, Business, Science and Arts Occupations by Sex
Within the Management, Business, Science and Arts occupations in Gooding, the most male-oriented occupations are Management (66.9%), and Business & Financial (11.3%), while the most female-oriented occupations are Computers, Engineering & Science (100.0%), Life, Physical & Social Science (100.0%), and Community & Social Service (100.0%).
| Occupation | Male | Female |
| Management | 107 (66.9%) | 53 (33.1%) |
| Business & Financial | 8 (11.3%) | 63 (88.7%) |
| Computers, Engineering & Science | 0 (0.0%) | 13 (100.0%) |
| Computers & Mathematics | 0 (0.0%) | 0 (0.0%) |
| Architecture & Engineering | 0 (0.0%) | 0 (0.0%) |
| Life, Physical & Social Science | 0 (0.0%) | 13 (100.0%) |
| Community & Social Service | 0 (0.0%) | 180 (100.0%) |
| Education, Arts & Media | 0 (0.0%) | 0 (0.0%) |
| Legal Services & Support | 0 (0.0%) | 0 (0.0%) |
| Education Instruction & Library | 0 (0.0%) | 180 (100.0%) |
| Arts, Media & Entertainment | 0 (0.0%) | 0 (0.0%) |
| Health Diagnosing & Treating | 0 (0.0%) | 0 (0.0%) |
| Health Technologists | 0 (0.0%) | 0 (0.0%) |
| Total (Category) | 115 (27.1%) | 309 (72.9%) |
| Total (Overall) | 717 (46.1%) | 837 (53.9%) |
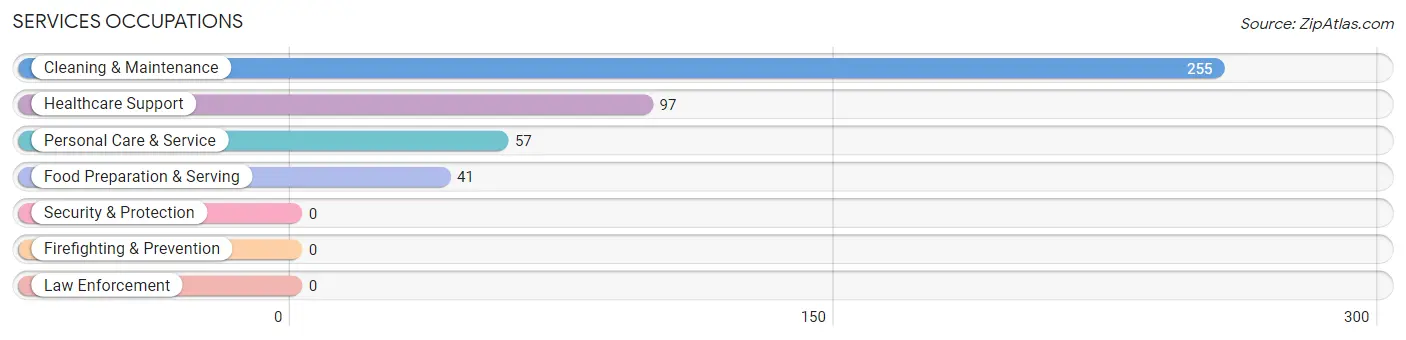
Services Occupations
The most common Services occupations in Gooding are Cleaning & Maintenance (255 | 16.4%), Healthcare Support (97 | 6.2%), Personal Care & Service (57 | 3.7%), and Food Preparation & Serving (41 | 2.6%).
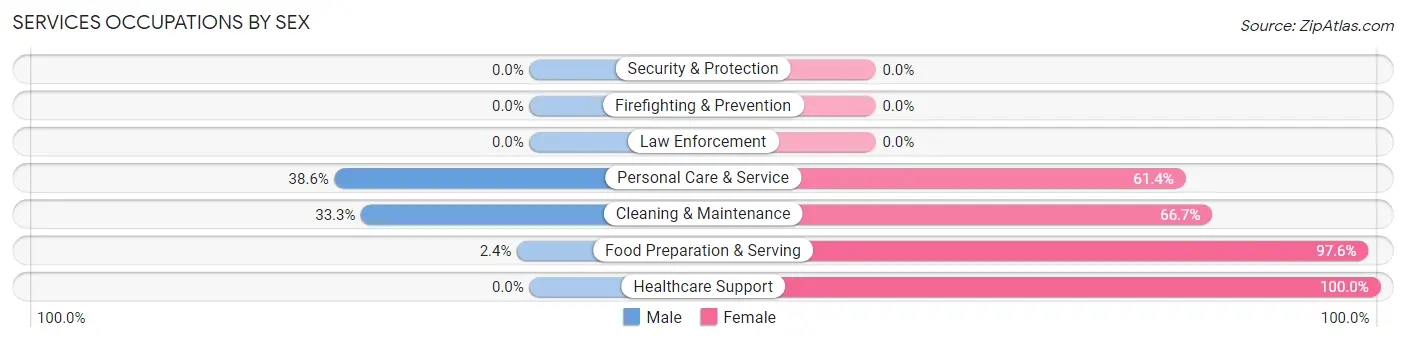
Services Occupations by Sex
Within the Services occupations in Gooding, the most male-oriented occupations are Personal Care & Service (38.6%), Cleaning & Maintenance (33.3%), and Food Preparation & Serving (2.4%), while the most female-oriented occupations are Healthcare Support (100.0%), Food Preparation & Serving (97.6%), and Cleaning & Maintenance (66.7%).
| Occupation | Male | Female |
| Healthcare Support | 0 (0.0%) | 97 (100.0%) |
| Security & Protection | 0 (0.0%) | 0 (0.0%) |
| Firefighting & Prevention | 0 (0.0%) | 0 (0.0%) |
| Law Enforcement | 0 (0.0%) | 0 (0.0%) |
| Food Preparation & Serving | 1 (2.4%) | 40 (97.6%) |
| Cleaning & Maintenance | 85 (33.3%) | 170 (66.7%) |
| Personal Care & Service | 22 (38.6%) | 35 (61.4%) |
| Total (Category) | 108 (24.0%) | 342 (76.0%) |
| Total (Overall) | 717 (46.1%) | 837 (53.9%) |
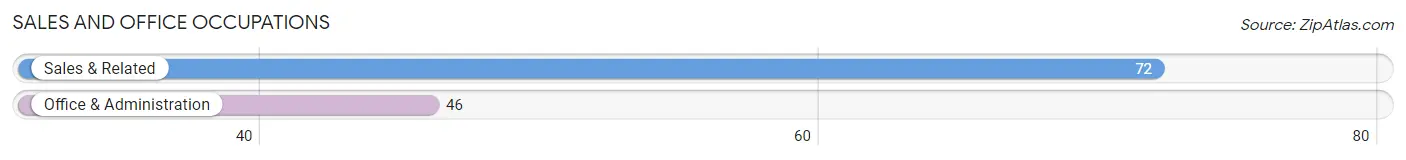
Sales and Office Occupations
The most common Sales and Office occupations in Gooding are Sales & Related (72 | 4.6%), and Office & Administration (46 | 3.0%).
Sales and Office Occupations by Sex
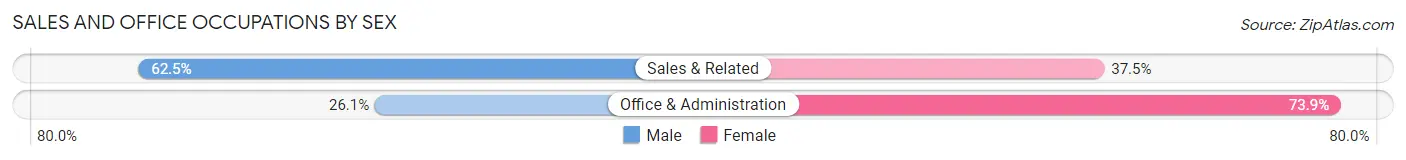
| Occupation | Male | Female |
| Sales & Related | 45 (62.5%) | 27 (37.5%) |
| Office & Administration | 12 (26.1%) | 34 (73.9%) |
| Total (Category) | 57 (48.3%) | 61 (51.7%) |
| Total (Overall) | 717 (46.1%) | 837 (53.9%) |
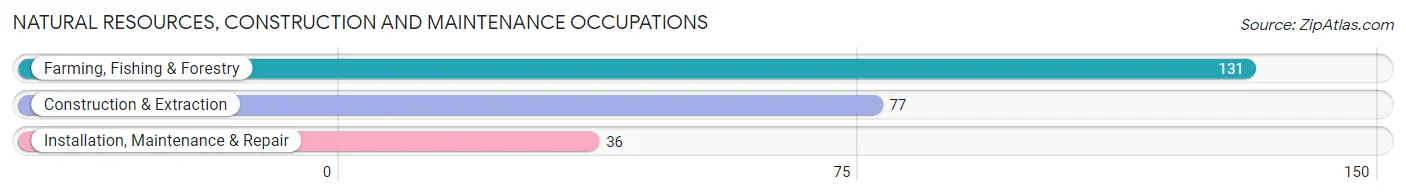
Natural Resources, Construction and Maintenance Occupations
The most common Natural Resources, Construction and Maintenance occupations in Gooding are Farming, Fishing & Forestry (131 | 8.4%), Construction & Extraction (77 | 5.0%), and Installation, Maintenance & Repair (36 | 2.3%).
Natural Resources, Construction and Maintenance Occupations by Sex
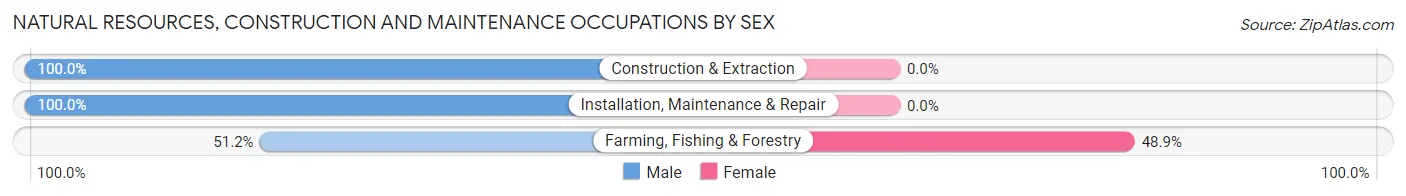
| Occupation | Male | Female |
| Farming, Fishing & Forestry | 67 (51.1%) | 64 (48.8%) |
| Construction & Extraction | 77 (100.0%) | 0 (0.0%) |
| Installation, Maintenance & Repair | 36 (100.0%) | 0 (0.0%) |
| Total (Category) | 180 (73.8%) | 64 (26.2%) |
| Total (Overall) | 717 (46.1%) | 837 (53.9%) |
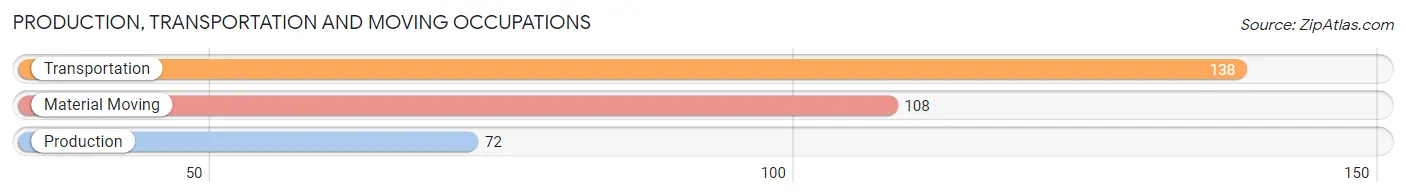
Production, Transportation and Moving Occupations
The most common Production, Transportation and Moving occupations in Gooding are Transportation (138 | 8.9%), Material Moving (108 | 7.0%), and Production (72 | 4.6%).
Production, Transportation and Moving Occupations by Sex
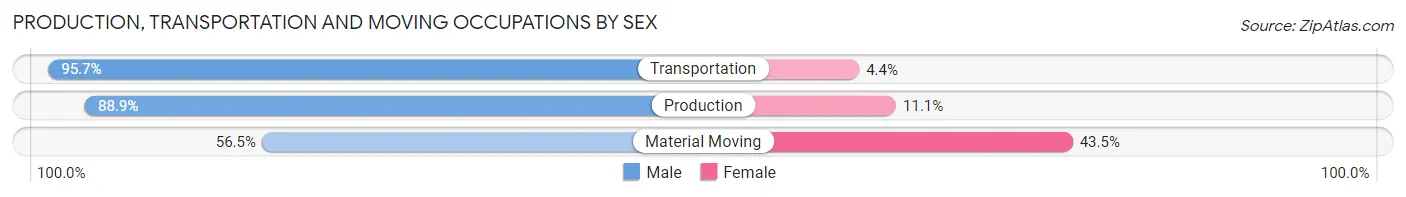
| Occupation | Male | Female |
| Production | 64 (88.9%) | 8 (11.1%) |
| Transportation | 132 (95.7%) | 6 (4.3%) |
| Material Moving | 61 (56.5%) | 47 (43.5%) |
| Total (Category) | 257 (80.8%) | 61 (19.2%) |
| Total (Overall) | 717 (46.1%) | 837 (53.9%) |
Employment Industries by Sex in Gooding
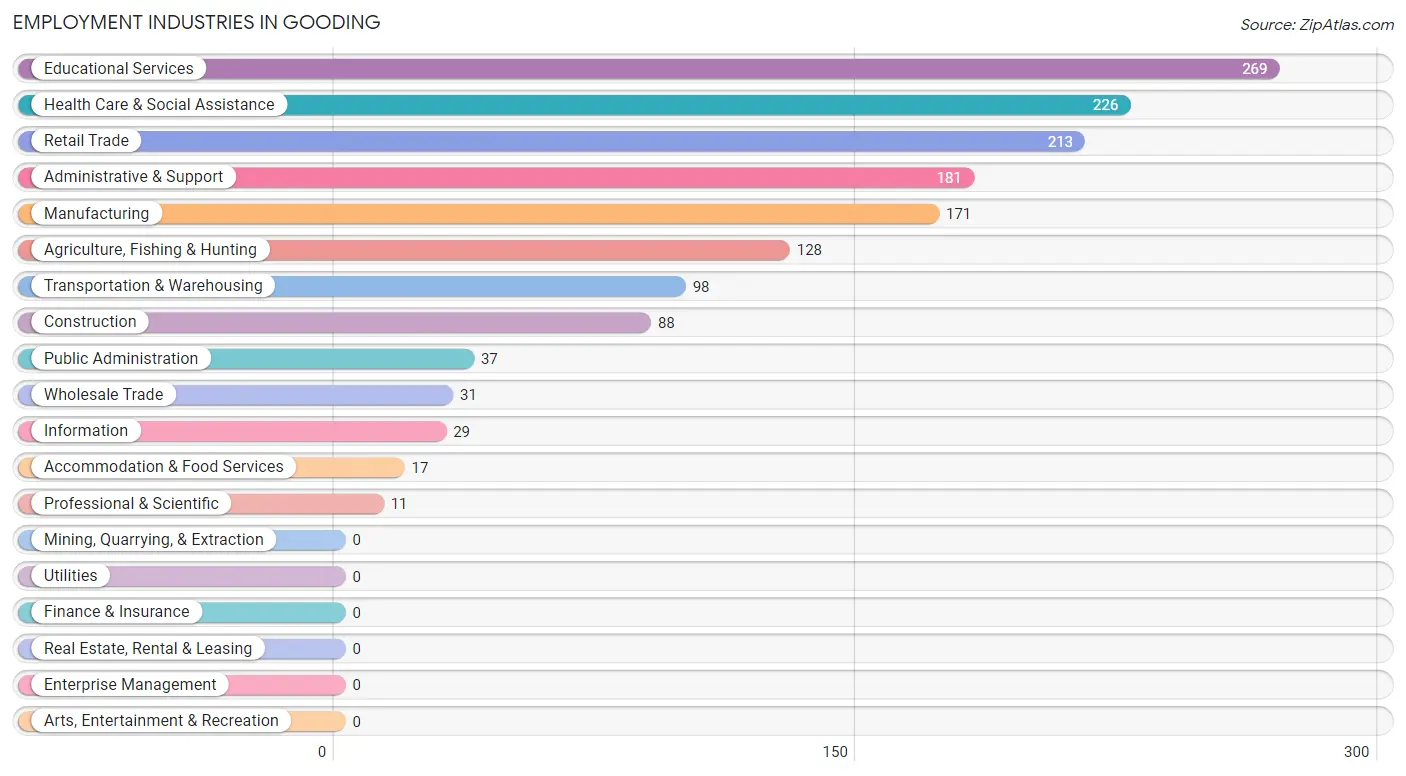
Employment Industries in Gooding
The major employment industries in Gooding include Educational Services (269 | 17.3%), Health Care & Social Assistance (226 | 14.5%), Retail Trade (213 | 13.7%), Administrative & Support (181 | 11.7%), and Manufacturing (171 | 11.0%).
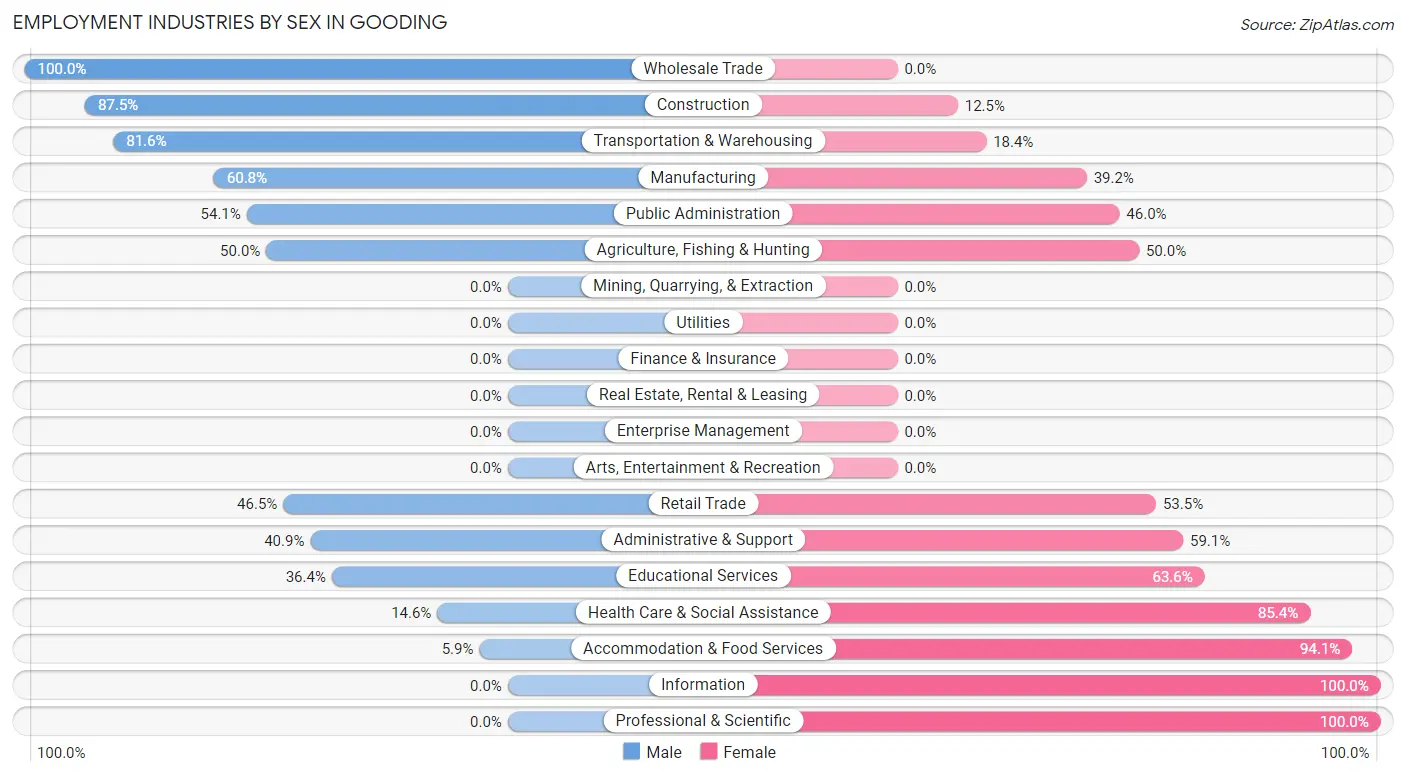
Employment Industries by Sex in Gooding
The Gooding industries that see more men than women are Wholesale Trade (100.0%), Construction (87.5%), and Transportation & Warehousing (81.6%), whereas the industries that tend to have a higher number of women are Information (100.0%), Professional & Scientific (100.0%), and Accommodation & Food Services (94.1%).
| Industry | Male | Female |
| Agriculture, Fishing & Hunting | 64 (50.0%) | 64 (50.0%) |
| Mining, Quarrying, & Extraction | 0 (0.0%) | 0 (0.0%) |
| Construction | 77 (87.5%) | 11 (12.5%) |
| Manufacturing | 104 (60.8%) | 67 (39.2%) |
| Wholesale Trade | 31 (100.0%) | 0 (0.0%) |
| Retail Trade | 99 (46.5%) | 114 (53.5%) |
| Transportation & Warehousing | 80 (81.6%) | 18 (18.4%) |
| Utilities | 0 (0.0%) | 0 (0.0%) |
| Information | 0 (0.0%) | 29 (100.0%) |
| Finance & Insurance | 0 (0.0%) | 0 (0.0%) |
| Real Estate, Rental & Leasing | 0 (0.0%) | 0 (0.0%) |
| Professional & Scientific | 0 (0.0%) | 11 (100.0%) |
| Enterprise Management | 0 (0.0%) | 0 (0.0%) |
| Administrative & Support | 74 (40.9%) | 107 (59.1%) |
| Educational Services | 98 (36.4%) | 171 (63.6%) |
| Health Care & Social Assistance | 33 (14.6%) | 193 (85.4%) |
| Arts, Entertainment & Recreation | 0 (0.0%) | 0 (0.0%) |
| Accommodation & Food Services | 1 (5.9%) | 16 (94.1%) |
| Public Administration | 20 (54.0%) | 17 (46.0%) |
| Total | 717 (46.1%) | 837 (53.9%) |
Education in Gooding
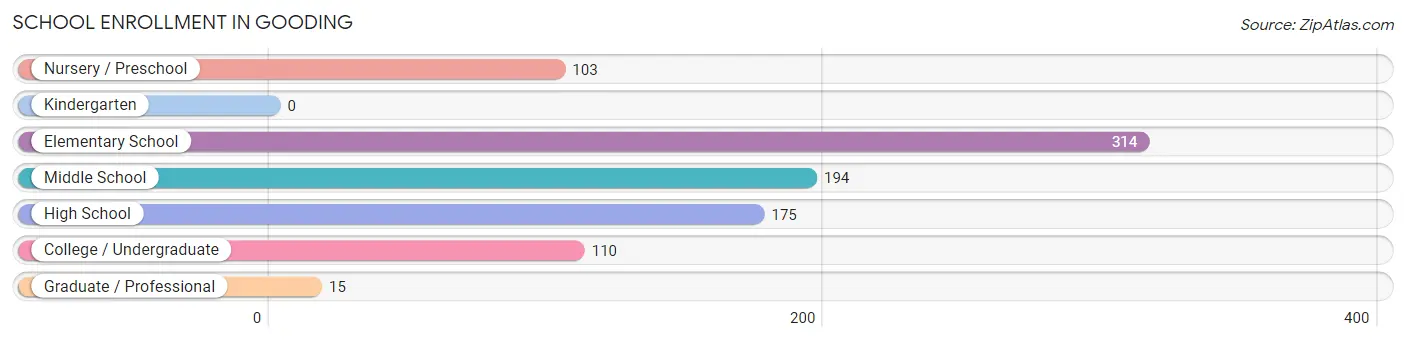
School Enrollment in Gooding
The most common levels of schooling among the 911 students in Gooding are elementary school (314 | 34.5%), middle school (194 | 21.3%), and high school (175 | 19.2%).
| School Level | # Students | % Students |
| Nursery / Preschool | 103 | 11.3% |
| Kindergarten | 0 | 0.0% |
| Elementary School | 314 | 34.5% |
| Middle School | 194 | 21.3% |
| High School | 175 | 19.2% |
| College / Undergraduate | 110 | 12.1% |
| Graduate / Professional | 15 | 1.7% |
| Total | 911 | 100.0% |
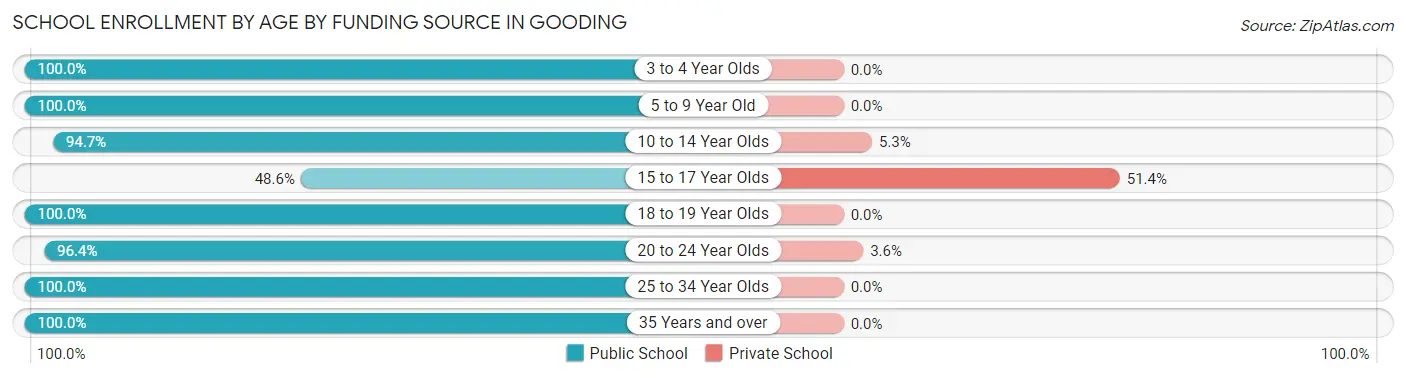
School Enrollment by Age by Funding Source in Gooding
Out of a total of 911 students who are enrolled in schools in Gooding, 71 (7.8%) attend a private institution, while the remaining 840 (92.2%) are enrolled in public schools. The age group of 15 to 17 year olds has the highest likelihood of being enrolled in private schools, with 54 (51.4% in the age bracket) enrolled. Conversely, the age group of 3 to 4 year olds has the lowest likelihood of being enrolled in a private school, with 56 (100.0% in the age bracket) attending a public institution.
| Age Bracket | Public School | Private School |
| 3 to 4 Year Olds | 56 (100.0%) | 0 (0.0%) |
| 5 to 9 Year Old | 271 (100.0%) | 0 (0.0%) |
| 10 to 14 Year Olds | 269 (94.7%) | 15 (5.3%) |
| 15 to 17 Year Olds | 51 (48.6%) | 54 (51.4%) |
| 18 to 19 Year Olds | 69 (100.0%) | 0 (0.0%) |
| 20 to 24 Year Olds | 53 (96.4%) | 2 (3.6%) |
| 25 to 34 Year Olds | 17 (100.0%) | 0 (0.0%) |
| 35 Years and over | 54 (100.0%) | 0 (0.0%) |
| Total | 840 (92.2%) | 71 (7.8%) |
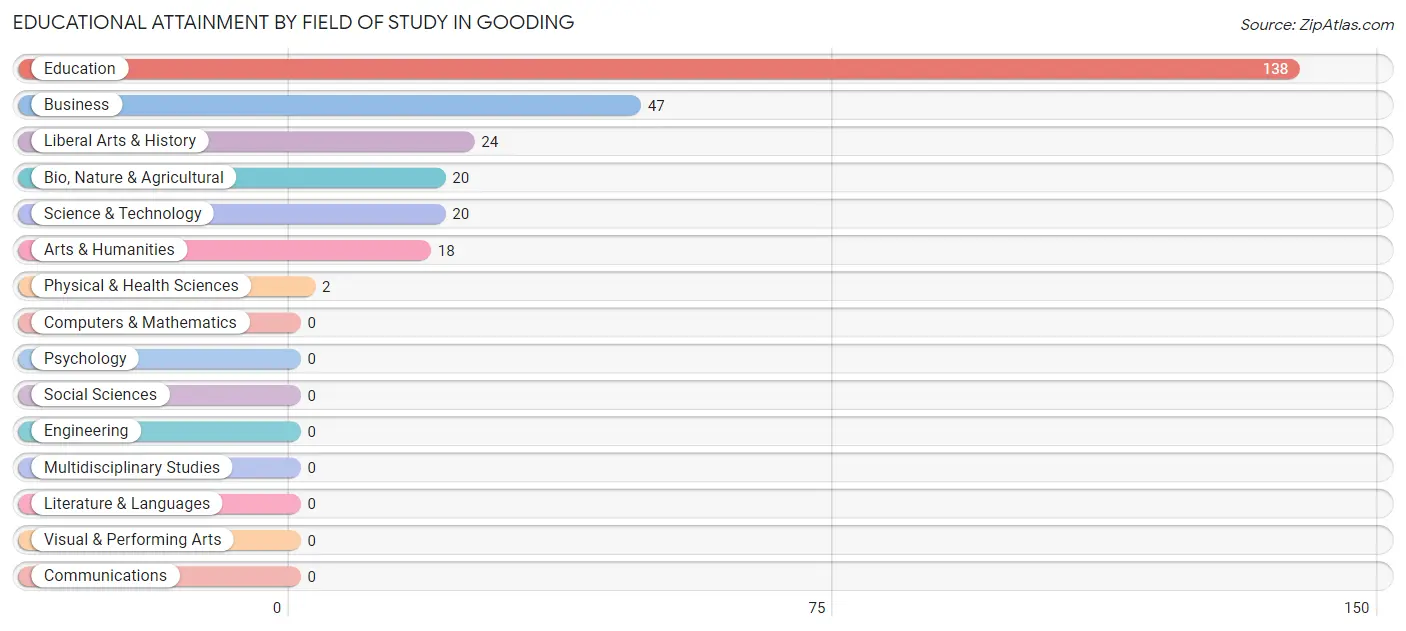
Educational Attainment by Field of Study in Gooding
Education (138 | 51.3%), business (47 | 17.5%), liberal arts & history (24 | 8.9%), bio, nature & agricultural (20 | 7.4%), and science & technology (20 | 7.4%) are the most common fields of study among 269 individuals in Gooding who have obtained a bachelor's degree or higher.
| Field of Study | # Graduates | % Graduates |
| Computers & Mathematics | 0 | 0.0% |
| Bio, Nature & Agricultural | 20 | 7.4% |
| Physical & Health Sciences | 2 | 0.7% |
| Psychology | 0 | 0.0% |
| Social Sciences | 0 | 0.0% |
| Engineering | 0 | 0.0% |
| Multidisciplinary Studies | 0 | 0.0% |
| Science & Technology | 20 | 7.4% |
| Business | 47 | 17.5% |
| Education | 138 | 51.3% |
| Literature & Languages | 0 | 0.0% |
| Liberal Arts & History | 24 | 8.9% |
| Visual & Performing Arts | 0 | 0.0% |
| Communications | 0 | 0.0% |
| Arts & Humanities | 18 | 6.7% |
| Total | 269 | 100.0% |
Transportation & Commute in Gooding
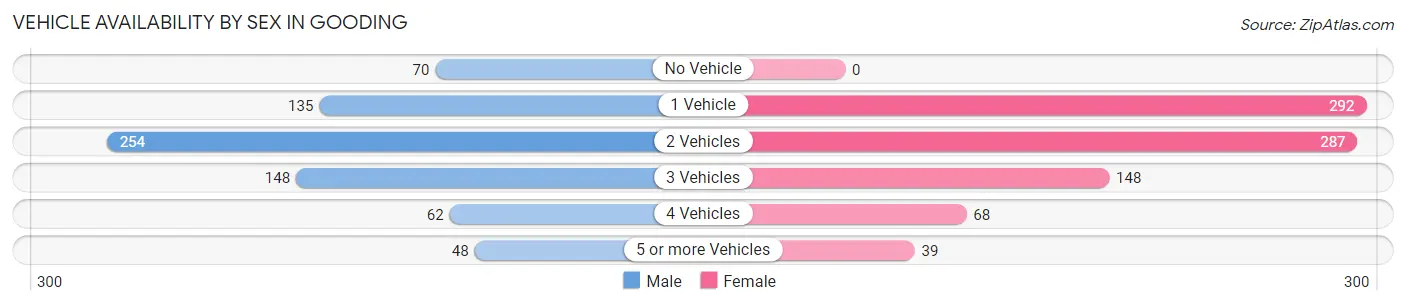
Vehicle Availability by Sex in Gooding
The most prevalent vehicle ownership categories in Gooding are males with 2 vehicles (254, accounting for 35.4%) and females with 2 vehicles (287, making up 30.5%).
| Vehicles Available | Male | Female |
| No Vehicle | 70 (9.8%) | 0 (0.0%) |
| 1 Vehicle | 135 (18.8%) | 292 (35.0%) |
| 2 Vehicles | 254 (35.4%) | 287 (34.4%) |
| 3 Vehicles | 148 (20.6%) | 148 (17.7%) |
| 4 Vehicles | 62 (8.6%) | 68 (8.2%) |
| 5 or more Vehicles | 48 (6.7%) | 39 (4.7%) |
| Total | 717 (100.0%) | 834 (100.0%) |
Commute Time in Gooding
The most frequently occuring commute durations in Gooding are 5 to 9 minutes (451 commuters, 32.2%), less than 5 minutes (211 commuters, 15.0%), and 10 to 14 minutes (197 commuters, 14.0%).
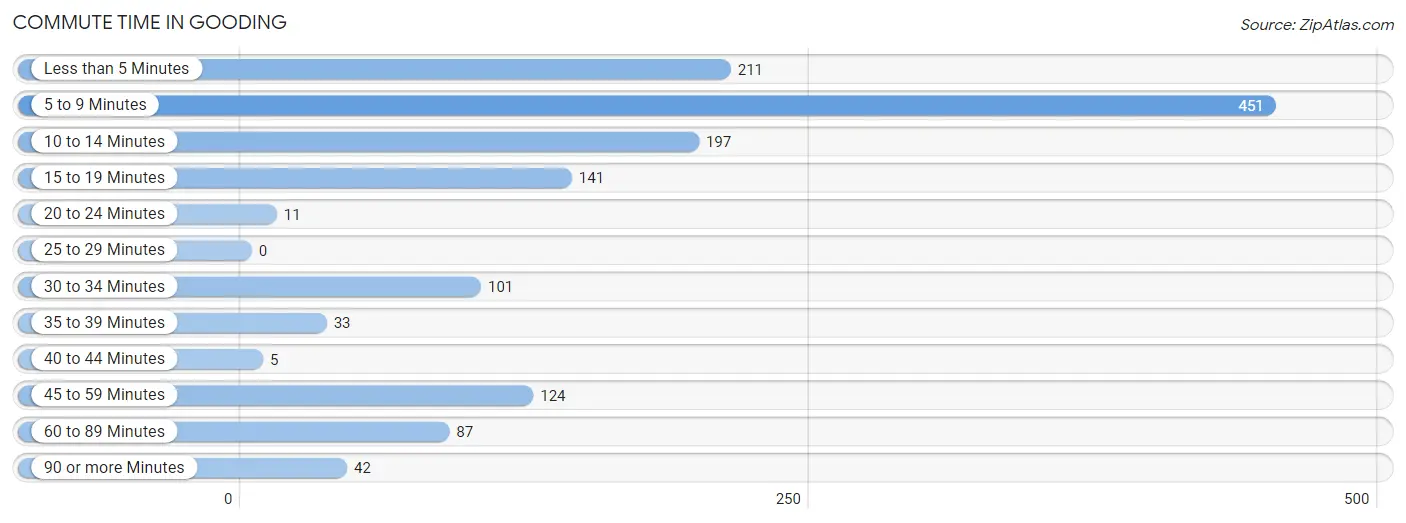
| Commute Time | # Commuters | % Commuters |
| Less than 5 Minutes | 211 | 15.0% |
| 5 to 9 Minutes | 451 | 32.2% |
| 10 to 14 Minutes | 197 | 14.0% |
| 15 to 19 Minutes | 141 | 10.1% |
| 20 to 24 Minutes | 11 | 0.8% |
| 25 to 29 Minutes | 0 | 0.0% |
| 30 to 34 Minutes | 101 | 7.2% |
| 35 to 39 Minutes | 33 | 2.4% |
| 40 to 44 Minutes | 5 | 0.4% |
| 45 to 59 Minutes | 124 | 8.8% |
| 60 to 89 Minutes | 87 | 6.2% |
| 90 or more Minutes | 42 | 3.0% |
Commute Time by Sex in Gooding
The most common commute times in Gooding are 5 to 9 minutes (183 commuters, 25.6%) for males and 5 to 9 minutes (268 commuters, 39.0%) for females.
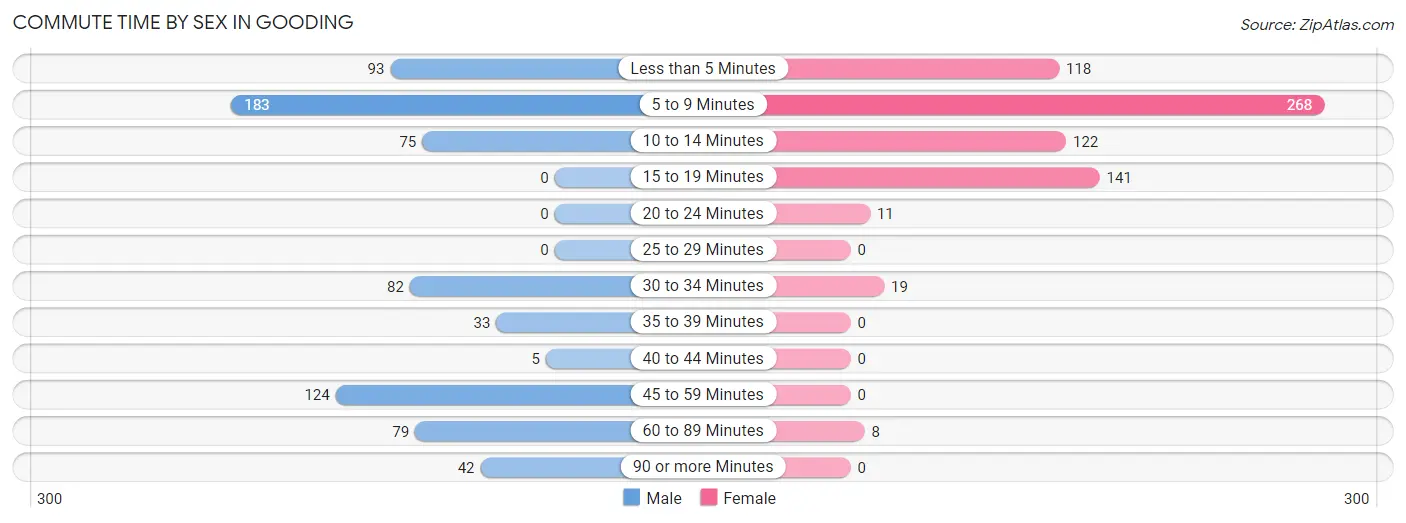
| Commute Time | Male | Female |
| Less than 5 Minutes | 93 (13.0%) | 118 (17.2%) |
| 5 to 9 Minutes | 183 (25.6%) | 268 (39.0%) |
| 10 to 14 Minutes | 75 (10.5%) | 122 (17.8%) |
| 15 to 19 Minutes | 0 (0.0%) | 141 (20.5%) |
| 20 to 24 Minutes | 0 (0.0%) | 11 (1.6%) |
| 25 to 29 Minutes | 0 (0.0%) | 0 (0.0%) |
| 30 to 34 Minutes | 82 (11.5%) | 19 (2.8%) |
| 35 to 39 Minutes | 33 (4.6%) | 0 (0.0%) |
| 40 to 44 Minutes | 5 (0.7%) | 0 (0.0%) |
| 45 to 59 Minutes | 124 (17.3%) | 0 (0.0%) |
| 60 to 89 Minutes | 79 (11.0%) | 8 (1.2%) |
| 90 or more Minutes | 42 (5.9%) | 0 (0.0%) |
Time of Departure to Work by Sex in Gooding
The most frequent times of departure to work in Gooding are 12:00 AM to 4:59 AM (132, 18.4%) for males and 7:30 AM to 7:59 AM (195, 28.4%) for females.
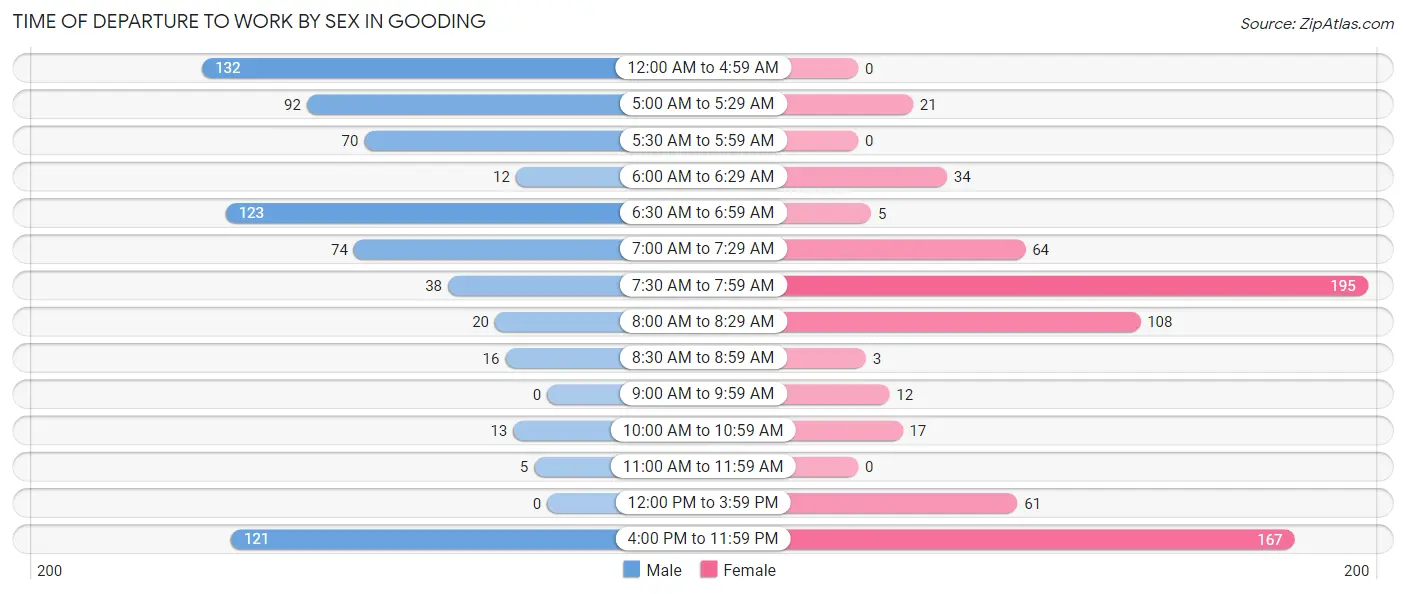
| Time of Departure | Male | Female |
| 12:00 AM to 4:59 AM | 132 (18.4%) | 0 (0.0%) |
| 5:00 AM to 5:29 AM | 92 (12.9%) | 21 (3.1%) |
| 5:30 AM to 5:59 AM | 70 (9.8%) | 0 (0.0%) |
| 6:00 AM to 6:29 AM | 12 (1.7%) | 34 (5.0%) |
| 6:30 AM to 6:59 AM | 123 (17.2%) | 5 (0.7%) |
| 7:00 AM to 7:29 AM | 74 (10.3%) | 64 (9.3%) |
| 7:30 AM to 7:59 AM | 38 (5.3%) | 195 (28.4%) |
| 8:00 AM to 8:29 AM | 20 (2.8%) | 108 (15.7%) |
| 8:30 AM to 8:59 AM | 16 (2.2%) | 3 (0.4%) |
| 9:00 AM to 9:59 AM | 0 (0.0%) | 12 (1.8%) |
| 10:00 AM to 10:59 AM | 13 (1.8%) | 17 (2.5%) |
| 11:00 AM to 11:59 AM | 5 (0.7%) | 0 (0.0%) |
| 12:00 PM to 3:59 PM | 0 (0.0%) | 61 (8.9%) |
| 4:00 PM to 11:59 PM | 121 (16.9%) | 167 (24.3%) |
| Total | 716 (100.0%) | 687 (100.0%) |
Housing Occupancy in Gooding
Occupancy by Ownership in Gooding
Of the total 1,387 dwellings in Gooding, owner-occupied units account for 847 (61.1%), while renter-occupied units make up 540 (38.9%).
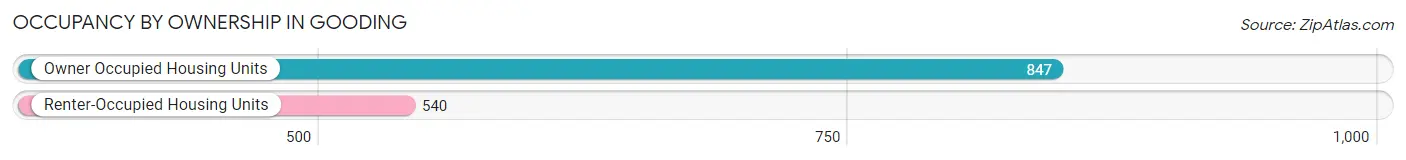
| Occupancy | # Housing Units | % Housing Units |
| Owner Occupied Housing Units | 847 | 61.1% |
| Renter-Occupied Housing Units | 540 | 38.9% |
| Total Occupied Housing Units | 1,387 | 100.0% |
Occupancy by Household Size in Gooding
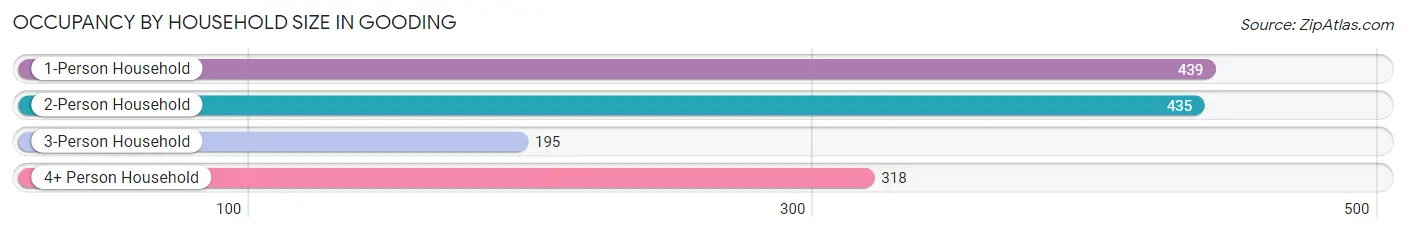
| Household Size | # Housing Units | % Housing Units |
| 1-Person Household | 439 | 31.7% |
| 2-Person Household | 435 | 31.4% |
| 3-Person Household | 195 | 14.1% |
| 4+ Person Household | 318 | 22.9% |
| Total Housing Units | 1,387 | 100.0% |
Occupancy by Ownership by Household Size in Gooding
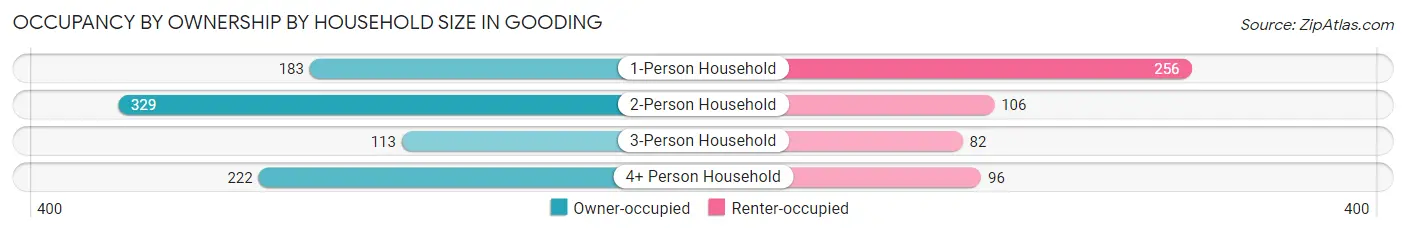
| Household Size | Owner-occupied | Renter-occupied |
| 1-Person Household | 183 (41.7%) | 256 (58.3%) |
| 2-Person Household | 329 (75.6%) | 106 (24.4%) |
| 3-Person Household | 113 (58.0%) | 82 (42.0%) |
| 4+ Person Household | 222 (69.8%) | 96 (30.2%) |
| Total Housing Units | 847 (61.1%) | 540 (38.9%) |
Occupancy by Educational Attainment in Gooding
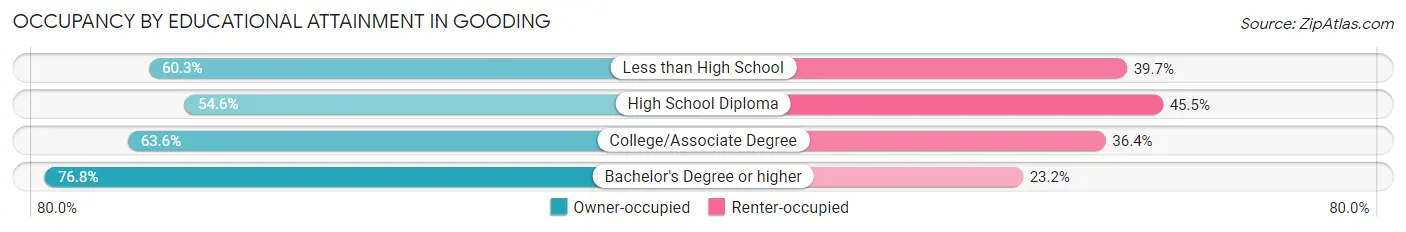
| Household Size | Owner-occupied | Renter-occupied |
| Less than High School | 94 (60.3%) | 62 (39.7%) |
| High School Diploma | 294 (54.5%) | 245 (45.5%) |
| College/Associate Degree | 350 (63.6%) | 200 (36.4%) |
| Bachelor's Degree or higher | 109 (76.8%) | 33 (23.2%) |
Occupancy by Age of Householder in Gooding
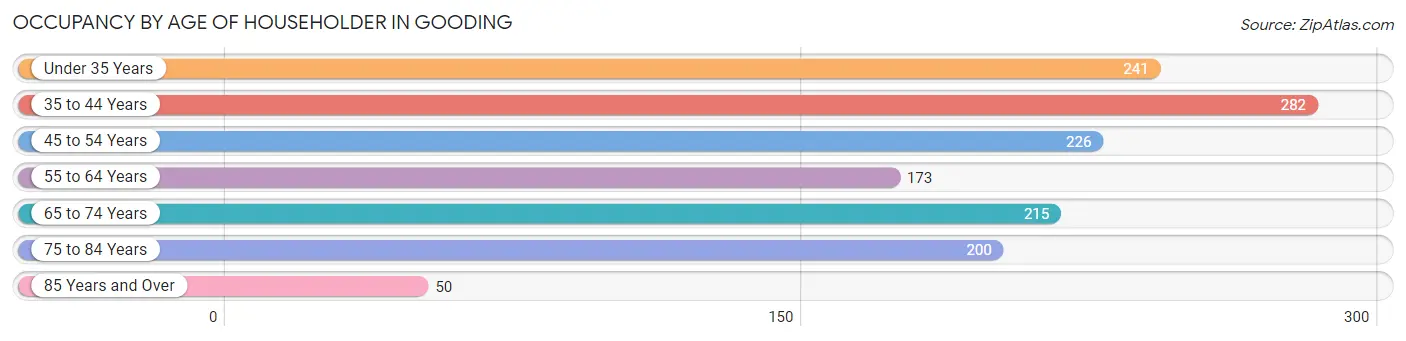
| Age Bracket | # Households | % Households |
| Under 35 Years | 241 | 17.4% |
| 35 to 44 Years | 282 | 20.3% |
| 45 to 54 Years | 226 | 16.3% |
| 55 to 64 Years | 173 | 12.5% |
| 65 to 74 Years | 215 | 15.5% |
| 75 to 84 Years | 200 | 14.4% |
| 85 Years and Over | 50 | 3.6% |
| Total | 1,387 | 100.0% |
Housing Finances in Gooding
Median Income by Occupancy in Gooding
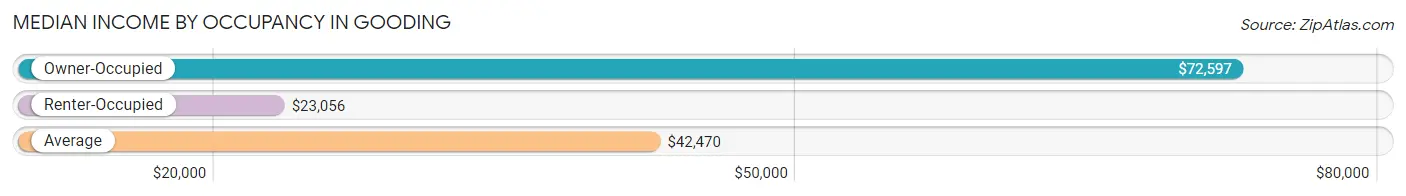
| Occupancy Type | # Households | Median Income |
| Owner-Occupied | 847 (61.1%) | $72,597 |
| Renter-Occupied | 540 (38.9%) | $23,056 |
| Average | 1,387 (100.0%) | $42,470 |
Occupancy by Householder Income Bracket in Gooding
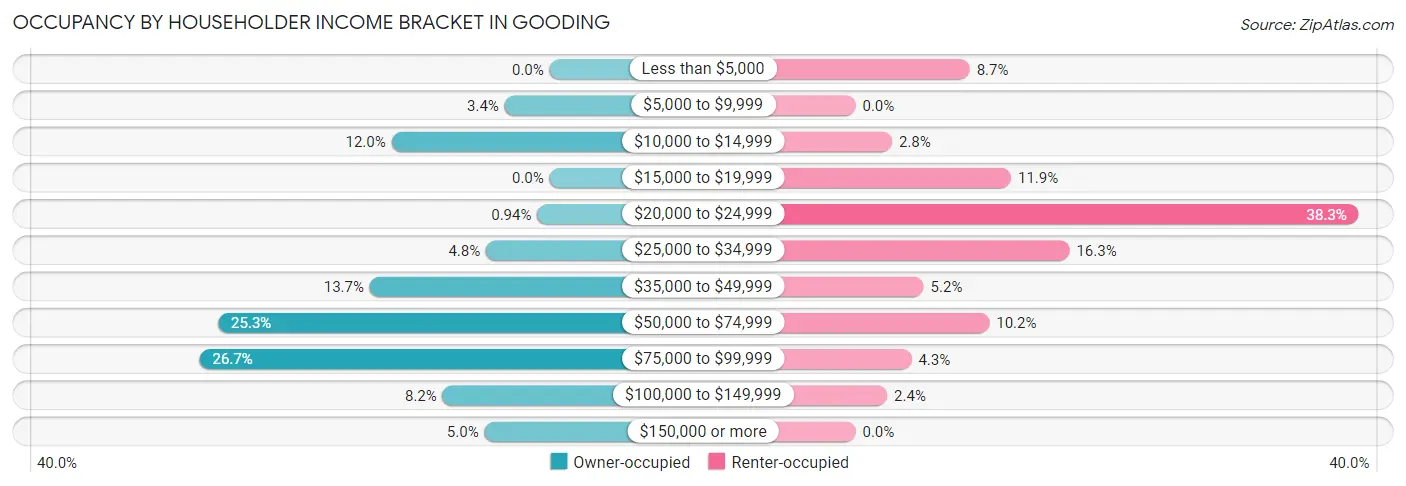
| Income Bracket | Owner-occupied | Renter-occupied |
| Less than $5,000 | 0 (0.0%) | 47 (8.7%) |
| $5,000 to $9,999 | 29 (3.4%) | 0 (0.0%) |
| $10,000 to $14,999 | 102 (12.0%) | 15 (2.8%) |
| $15,000 to $19,999 | 0 (0.0%) | 64 (11.8%) |
| $20,000 to $24,999 | 8 (0.9%) | 207 (38.3%) |
| $25,000 to $34,999 | 41 (4.8%) | 88 (16.3%) |
| $35,000 to $49,999 | 116 (13.7%) | 28 (5.2%) |
| $50,000 to $74,999 | 214 (25.3%) | 55 (10.2%) |
| $75,000 to $99,999 | 226 (26.7%) | 23 (4.3%) |
| $100,000 to $149,999 | 69 (8.2%) | 13 (2.4%) |
| $150,000 or more | 42 (5.0%) | 0 (0.0%) |
| Total | 847 (100.0%) | 540 (100.0%) |
Monthly Housing Cost Tiers in Gooding
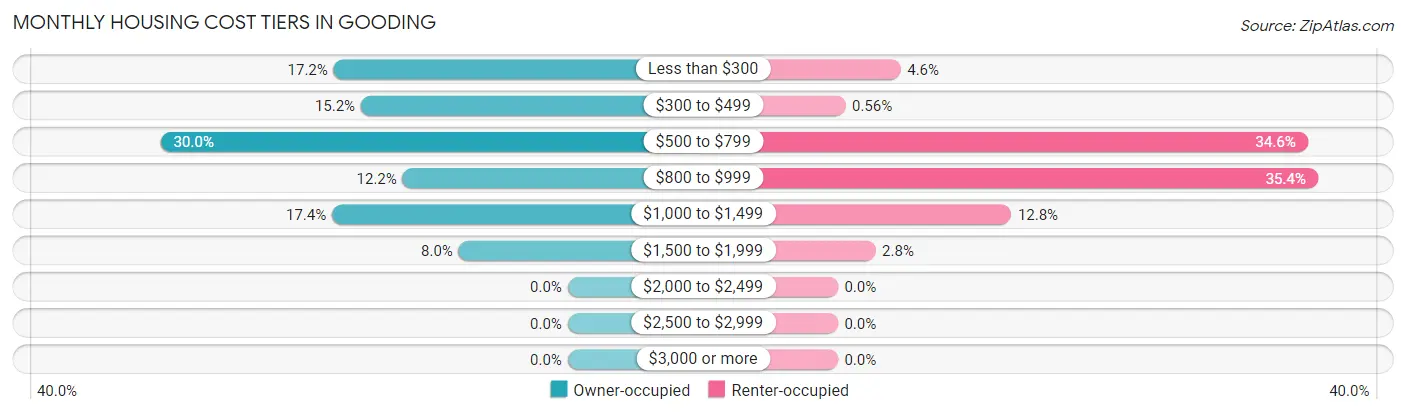
| Monthly Cost | Owner-occupied | Renter-occupied |
| Less than $300 | 146 (17.2%) | 25 (4.6%) |
| $300 to $499 | 129 (15.2%) | 3 (0.6%) |
| $500 to $799 | 254 (30.0%) | 187 (34.6%) |
| $800 to $999 | 103 (12.2%) | 191 (35.4%) |
| $1,000 to $1,499 | 147 (17.4%) | 69 (12.8%) |
| $1,500 to $1,999 | 68 (8.0%) | 15 (2.8%) |
| $2,000 to $2,499 | 0 (0.0%) | 0 (0.0%) |
| $2,500 to $2,999 | 0 (0.0%) | 0 (0.0%) |
| $3,000 or more | 0 (0.0%) | 0 (0.0%) |
| Total | 847 (100.0%) | 540 (100.0%) |
Physical Housing Characteristics in Gooding
Housing Structures in Gooding
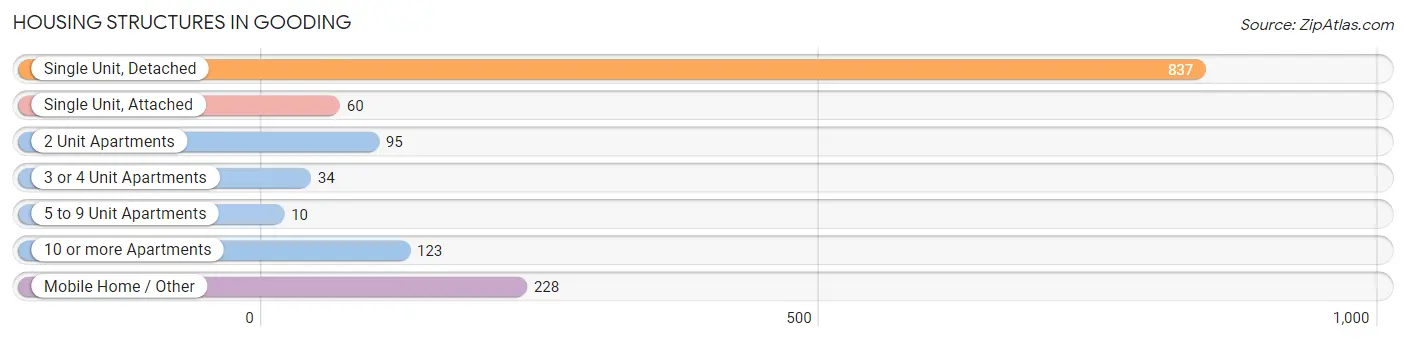
| Structure Type | # Housing Units | % Housing Units |
| Single Unit, Detached | 837 | 60.4% |
| Single Unit, Attached | 60 | 4.3% |
| 2 Unit Apartments | 95 | 6.9% |
| 3 or 4 Unit Apartments | 34 | 2.5% |
| 5 to 9 Unit Apartments | 10 | 0.7% |
| 10 or more Apartments | 123 | 8.9% |
| Mobile Home / Other | 228 | 16.4% |
| Total | 1,387 | 100.0% |
Housing Structures by Occupancy in Gooding
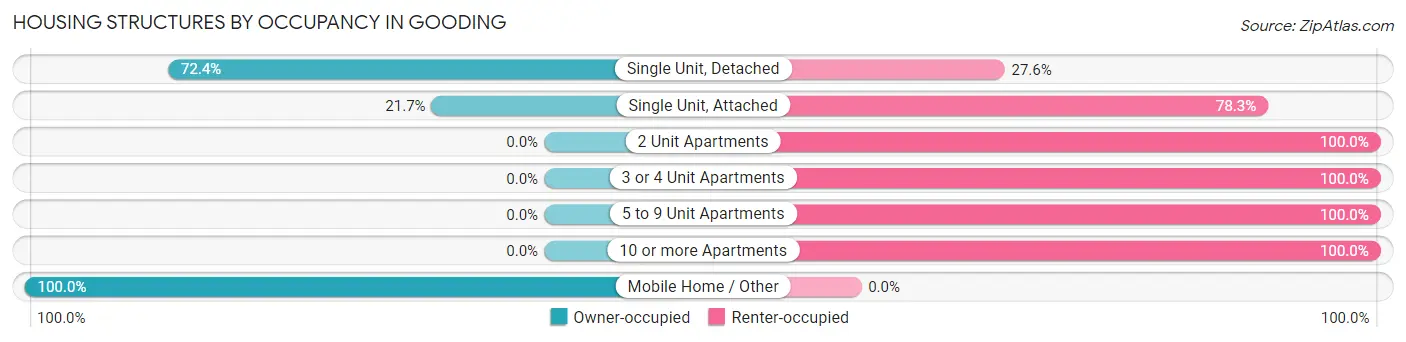
| Structure Type | Owner-occupied | Renter-occupied |
| Single Unit, Detached | 606 (72.4%) | 231 (27.6%) |
| Single Unit, Attached | 13 (21.7%) | 47 (78.3%) |
| 2 Unit Apartments | 0 (0.0%) | 95 (100.0%) |
| 3 or 4 Unit Apartments | 0 (0.0%) | 34 (100.0%) |
| 5 to 9 Unit Apartments | 0 (0.0%) | 10 (100.0%) |
| 10 or more Apartments | 0 (0.0%) | 123 (100.0%) |
| Mobile Home / Other | 228 (100.0%) | 0 (0.0%) |
| Total | 847 (61.1%) | 540 (38.9%) |
Housing Structures by Number of Rooms in Gooding
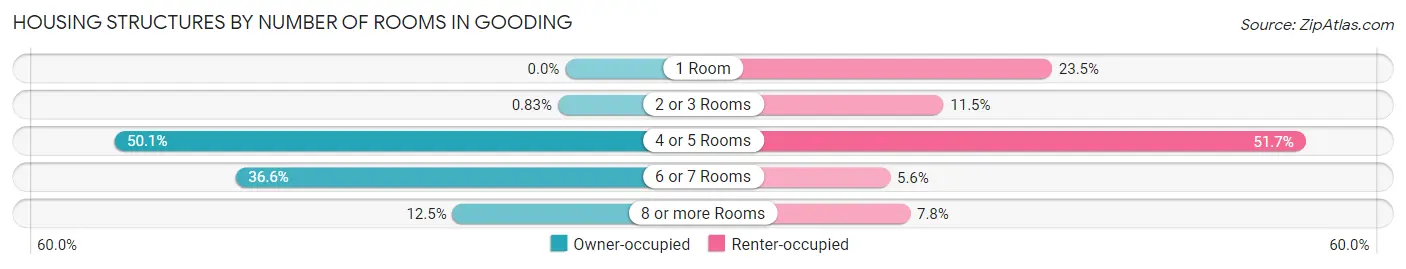
| Number of Rooms | Owner-occupied | Renter-occupied |
| 1 Room | 0 (0.0%) | 127 (23.5%) |
| 2 or 3 Rooms | 7 (0.8%) | 62 (11.5%) |
| 4 or 5 Rooms | 424 (50.1%) | 279 (51.7%) |
| 6 or 7 Rooms | 310 (36.6%) | 30 (5.6%) |
| 8 or more Rooms | 106 (12.5%) | 42 (7.8%) |
| Total | 847 (100.0%) | 540 (100.0%) |
Housing Structure by Heating Type in Gooding
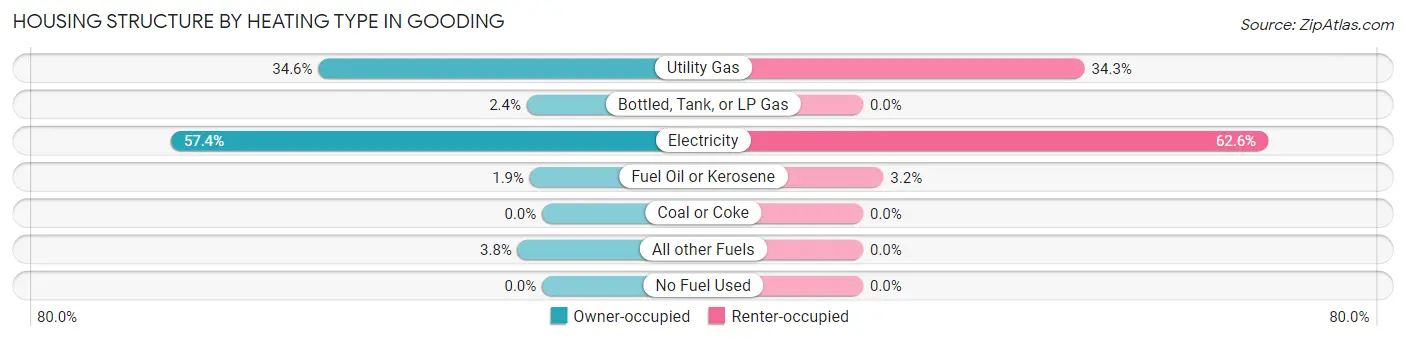
| Heating Type | Owner-occupied | Renter-occupied |
| Utility Gas | 293 (34.6%) | 185 (34.3%) |
| Bottled, Tank, or LP Gas | 20 (2.4%) | 0 (0.0%) |
| Electricity | 486 (57.4%) | 338 (62.6%) |
| Fuel Oil or Kerosene | 16 (1.9%) | 17 (3.2%) |
| Coal or Coke | 0 (0.0%) | 0 (0.0%) |
| All other Fuels | 32 (3.8%) | 0 (0.0%) |
| No Fuel Used | 0 (0.0%) | 0 (0.0%) |
| Total | 847 (100.0%) | 540 (100.0%) |
Household Vehicle Usage in Gooding
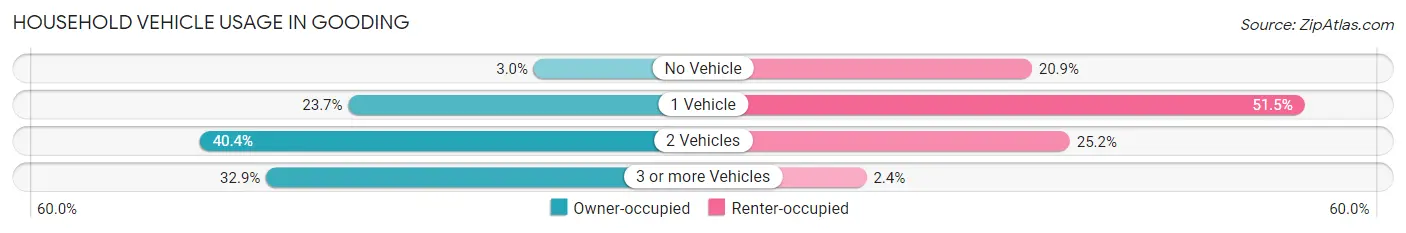
| Vehicles per Household | Owner-occupied | Renter-occupied |
| No Vehicle | 25 (2.9%) | 113 (20.9%) |
| 1 Vehicle | 201 (23.7%) | 278 (51.5%) |
| 2 Vehicles | 342 (40.4%) | 136 (25.2%) |
| 3 or more Vehicles | 279 (32.9%) | 13 (2.4%) |
| Total | 847 (100.0%) | 540 (100.0%) |
Real Estate & Mortgages in Gooding
Real Estate and Mortgage Overview in Gooding
| Characteristic | Without Mortgage | With Mortgage |
| Housing Units | 371 | 476 |
| Median Property Value | $85,500 | $146,200 |
| Median Household Income | $74,792 | $37 |
| Monthly Housing Costs | $372 | $0 |
| Real Estate Taxes | $603 | $0 |
Property Value by Mortgage Status in Gooding
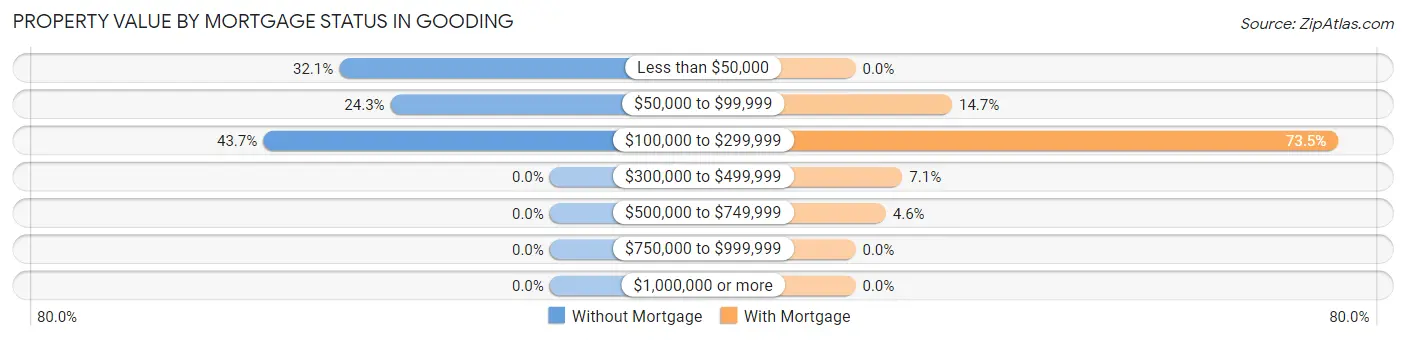
| Property Value | Without Mortgage | With Mortgage |
| Less than $50,000 | 119 (32.1%) | 0 (0.0%) |
| $50,000 to $99,999 | 90 (24.3%) | 70 (14.7%) |
| $100,000 to $299,999 | 162 (43.7%) | 350 (73.5%) |
| $300,000 to $499,999 | 0 (0.0%) | 34 (7.1%) |
| $500,000 to $749,999 | 0 (0.0%) | 22 (4.6%) |
| $750,000 to $999,999 | 0 (0.0%) | 0 (0.0%) |
| $1,000,000 or more | 0 (0.0%) | 0 (0.0%) |
| Total | 371 (100.0%) | 476 (100.0%) |
Household Income by Mortgage Status in Gooding
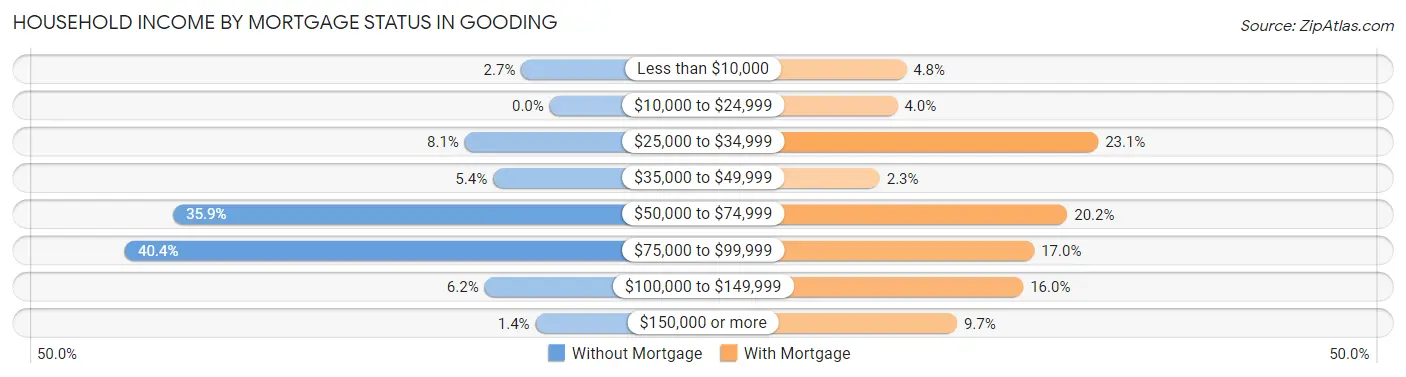
| Household Income | Without Mortgage | With Mortgage |
| Less than $10,000 | 10 (2.7%) | 23 (4.8%) |
| $10,000 to $24,999 | 0 (0.0%) | 19 (4.0%) |
| $25,000 to $34,999 | 30 (8.1%) | 110 (23.1%) |
| $35,000 to $49,999 | 20 (5.4%) | 11 (2.3%) |
| $50,000 to $74,999 | 133 (35.8%) | 96 (20.2%) |
| $75,000 to $99,999 | 150 (40.4%) | 81 (17.0%) |
| $100,000 to $149,999 | 23 (6.2%) | 76 (16.0%) |
| $150,000 or more | 5 (1.3%) | 46 (9.7%) |
| Total | 371 (100.0%) | 476 (100.0%) |
Property Value to Household Income Ratio in Gooding
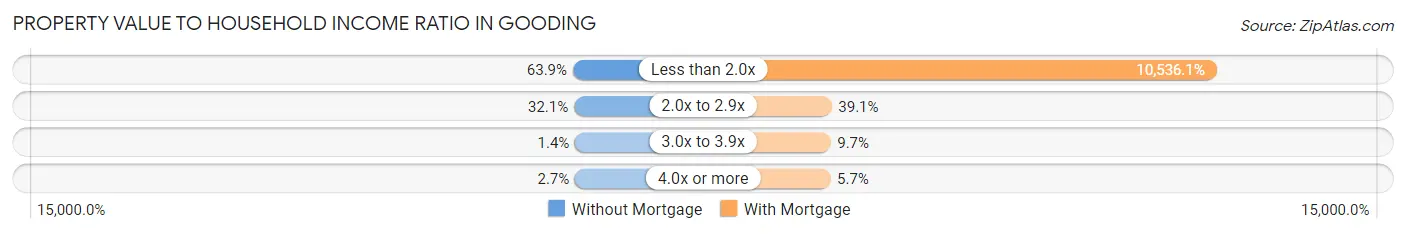
| Value-to-Income Ratio | Without Mortgage | With Mortgage |
| Less than 2.0x | 237 (63.9%) | 50,152 (10,536.1%) |
| 2.0x to 2.9x | 119 (32.1%) | 186 (39.1%) |
| 3.0x to 3.9x | 5 (1.3%) | 46 (9.7%) |
| 4.0x or more | 10 (2.7%) | 27 (5.7%) |
| Total | 371 (100.0%) | 476 (100.0%) |
Real Estate Taxes by Mortgage Status in Gooding
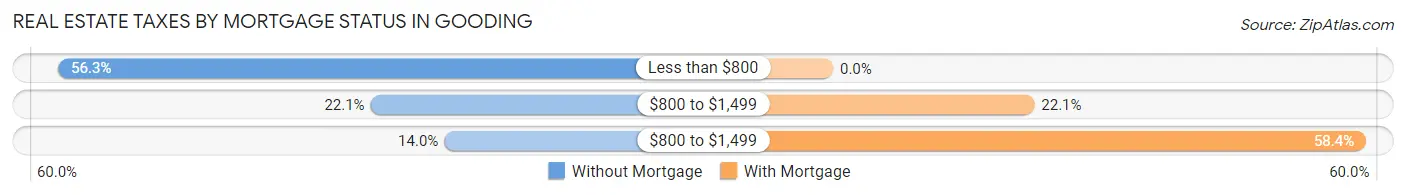
| Property Taxes | Without Mortgage | With Mortgage |
| Less than $800 | 209 (56.3%) | 0 (0.0%) |
| $800 to $1,499 | 82 (22.1%) | 105 (22.1%) |
| $800 to $1,499 | 52 (14.0%) | 278 (58.4%) |
| Total | 371 (100.0%) | 476 (100.0%) |
Health & Disability in Gooding
Health Insurance Coverage by Age in Gooding
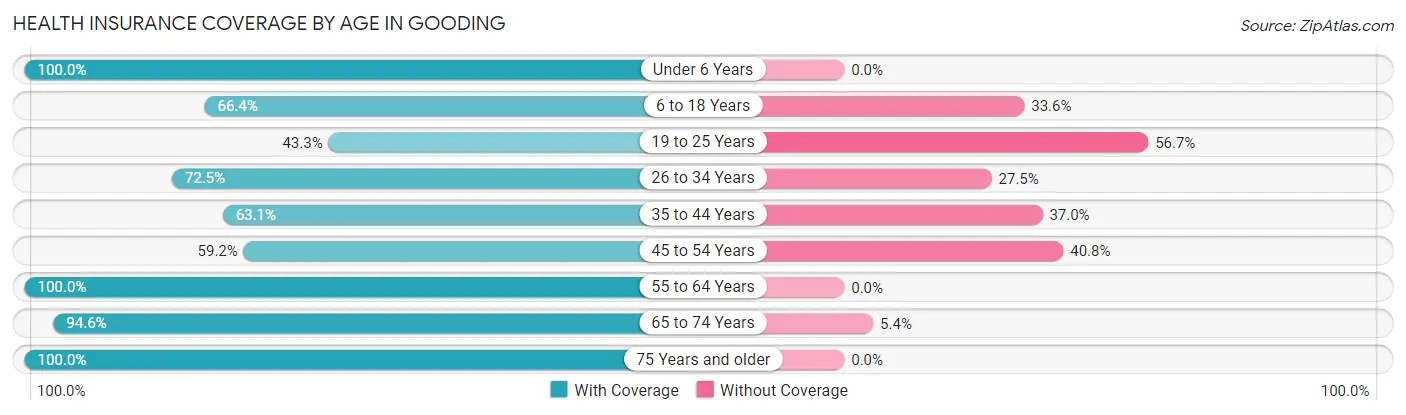
| Age Bracket | With Coverage | Without Coverage |
| Under 6 Years | 222 (100.0%) | 0 (0.0%) |
| 6 to 18 Years | 489 (66.4%) | 247 (33.6%) |
| 19 to 25 Years | 143 (43.3%) | 187 (56.7%) |
| 26 to 34 Years | 235 (72.5%) | 89 (27.5%) |
| 35 to 44 Years | 256 (63.0%) | 150 (36.9%) |
| 45 to 54 Years | 297 (59.2%) | 205 (40.8%) |
| 55 to 64 Years | 410 (100.0%) | 0 (0.0%) |
| 65 to 74 Years | 352 (94.6%) | 20 (5.4%) |
| 75 Years and older | 295 (100.0%) | 0 (0.0%) |
| Total | 2,699 (75.0%) | 898 (25.0%) |
Health Insurance Coverage by Citizenship Status in Gooding
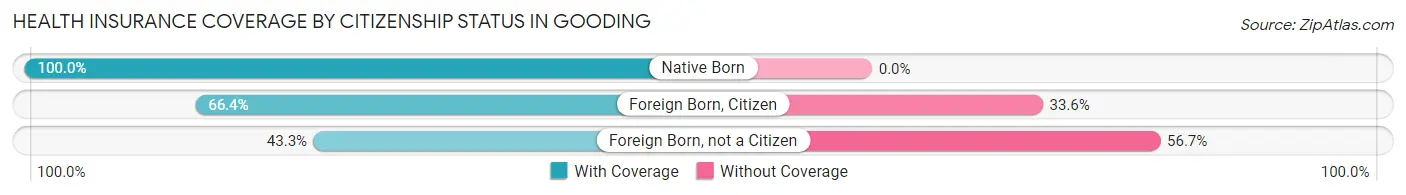
| Citizenship Status | With Coverage | Without Coverage |
| Native Born | 222 (100.0%) | 0 (0.0%) |
| Foreign Born, Citizen | 489 (66.4%) | 247 (33.6%) |
| Foreign Born, not a Citizen | 143 (43.3%) | 187 (56.7%) |
Health Insurance Coverage by Household Income in Gooding
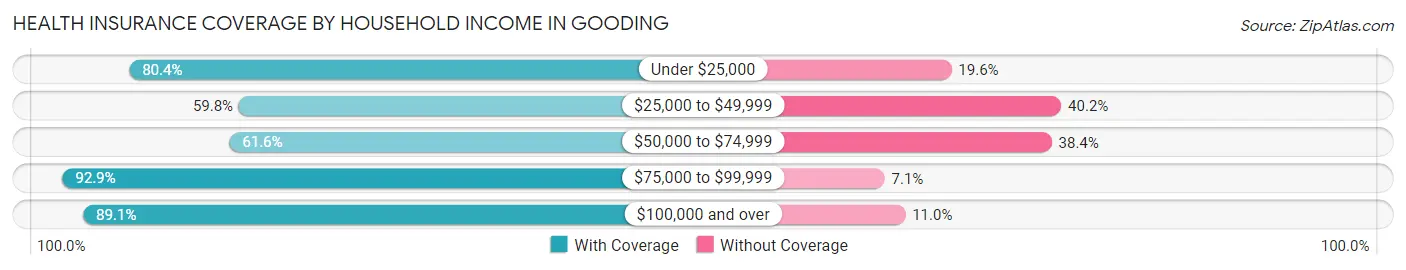
| Household Income | With Coverage | Without Coverage |
| Under $25,000 | 722 (80.4%) | 176 (19.6%) |
| $25,000 to $49,999 | 438 (59.8%) | 294 (40.2%) |
| $50,000 to $74,999 | 538 (61.6%) | 335 (38.4%) |
| $75,000 to $99,999 | 643 (92.9%) | 49 (7.1%) |
| $100,000 and over | 358 (89.0%) | 44 (11.0%) |
Public vs Private Health Insurance Coverage by Age in Gooding
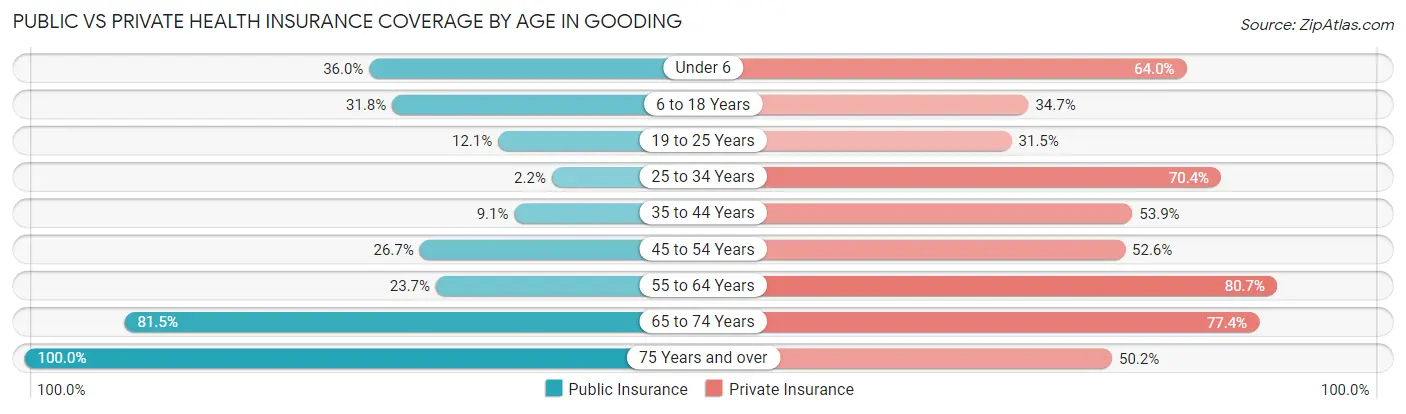
| Age Bracket | Public Insurance | Private Insurance |
| Under 6 | 80 (36.0%) | 142 (64.0%) |
| 6 to 18 Years | 234 (31.8%) | 255 (34.6%) |
| 19 to 25 Years | 40 (12.1%) | 104 (31.5%) |
| 25 to 34 Years | 7 (2.2%) | 228 (70.4%) |
| 35 to 44 Years | 37 (9.1%) | 219 (53.9%) |
| 45 to 54 Years | 134 (26.7%) | 264 (52.6%) |
| 55 to 64 Years | 97 (23.7%) | 331 (80.7%) |
| 65 to 74 Years | 303 (81.5%) | 288 (77.4%) |
| 75 Years and over | 295 (100.0%) | 148 (50.2%) |
| Total | 1,227 (34.1%) | 1,979 (55.0%) |
Disability Status by Sex by Age in Gooding
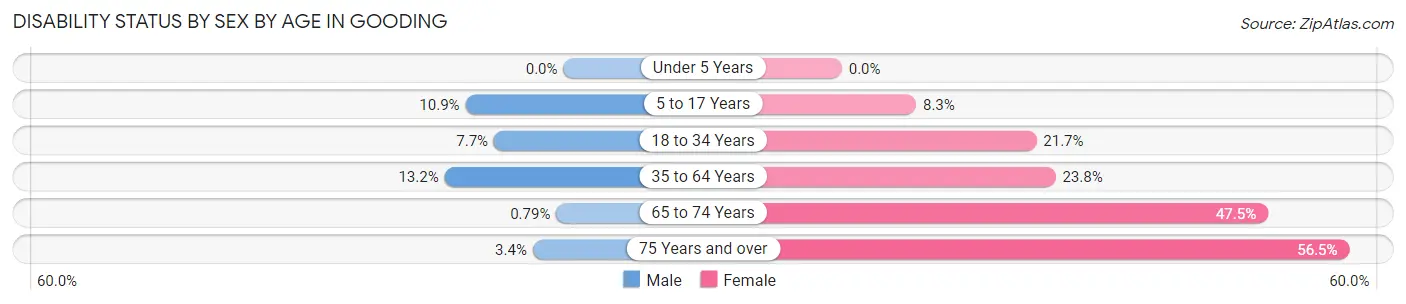
| Age Bracket | Male | Female |
| Under 5 Years | 0 (0.0%) | 0 (0.0%) |
| 5 to 17 Years | 37 (10.9%) | 31 (8.3%) |
| 18 to 34 Years | 17 (7.7%) | 109 (21.7%) |
| 35 to 64 Years | 81 (13.2%) | 168 (23.8%) |
| 65 to 74 Years | 2 (0.8%) | 56 (47.5%) |
| 75 Years and over | 3 (3.4%) | 117 (56.5%) |
Disability Class by Sex by Age in Gooding
Disability Class: Hearing Difficulty
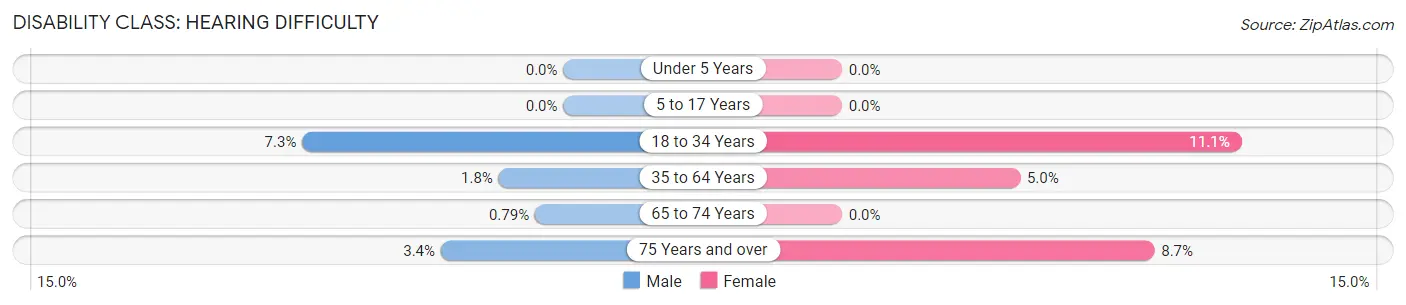
| Age Bracket | Male | Female |
| Under 5 Years | 0 (0.0%) | 0 (0.0%) |
| 5 to 17 Years | 0 (0.0%) | 0 (0.0%) |
| 18 to 34 Years | 16 (7.3%) | 56 (11.1%) |
| 35 to 64 Years | 11 (1.8%) | 35 (5.0%) |
| 65 to 74 Years | 2 (0.8%) | 0 (0.0%) |
| 75 Years and over | 3 (3.4%) | 18 (8.7%) |
Disability Class: Vision Difficulty
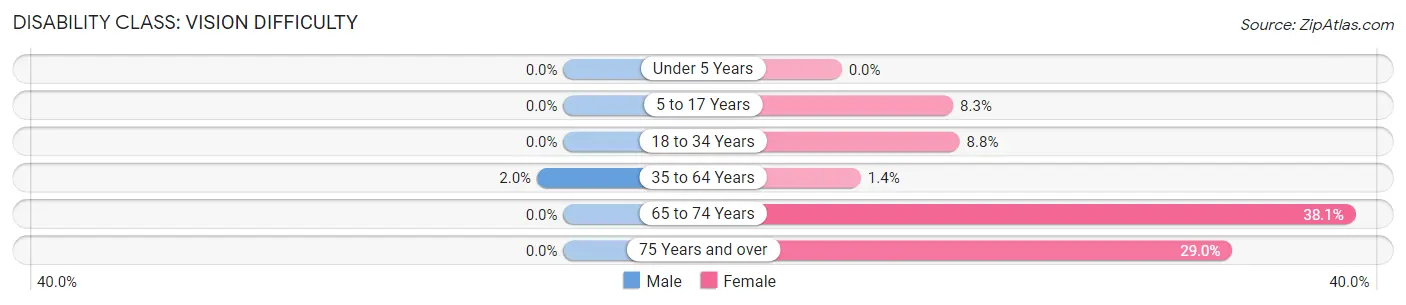
| Age Bracket | Male | Female |
| Under 5 Years | 0 (0.0%) | 0 (0.0%) |
| 5 to 17 Years | 0 (0.0%) | 31 (8.3%) |
| 18 to 34 Years | 0 (0.0%) | 44 (8.7%) |
| 35 to 64 Years | 12 (2.0%) | 10 (1.4%) |
| 65 to 74 Years | 0 (0.0%) | 45 (38.1%) |
| 75 Years and over | 0 (0.0%) | 60 (29.0%) |
Disability Class: Cognitive Difficulty
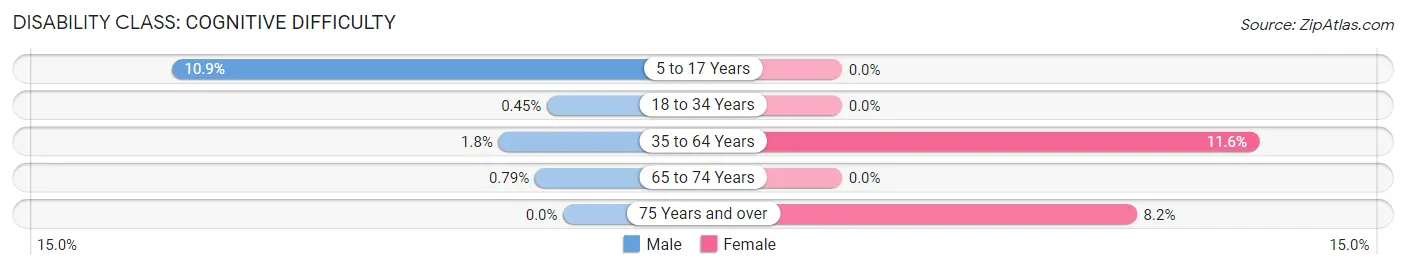
| Age Bracket | Male | Female |
| 5 to 17 Years | 37 (10.9%) | 0 (0.0%) |
| 18 to 34 Years | 1 (0.4%) | 0 (0.0%) |
| 35 to 64 Years | 11 (1.8%) | 82 (11.6%) |
| 65 to 74 Years | 2 (0.8%) | 0 (0.0%) |
| 75 Years and over | 0 (0.0%) | 17 (8.2%) |
Disability Class: Ambulatory Difficulty
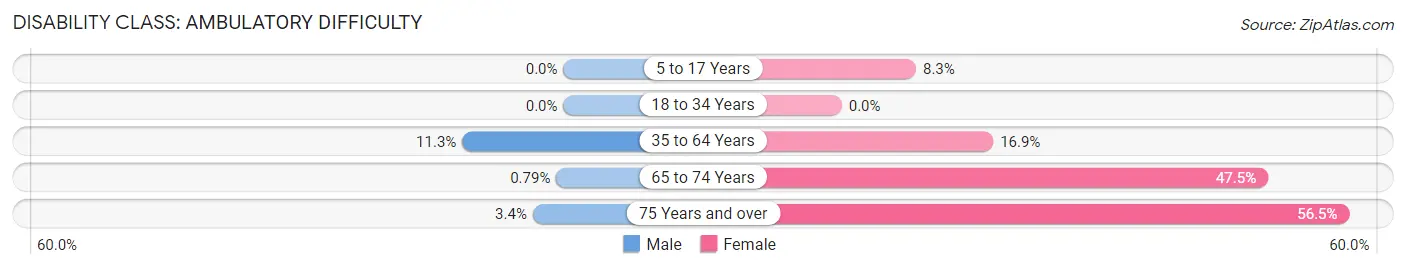
| Age Bracket | Male | Female |
| 5 to 17 Years | 0 (0.0%) | 31 (8.3%) |
| 18 to 34 Years | 0 (0.0%) | 0 (0.0%) |
| 35 to 64 Years | 69 (11.3%) | 119 (16.9%) |
| 65 to 74 Years | 2 (0.8%) | 56 (47.5%) |
| 75 Years and over | 3 (3.4%) | 117 (56.5%) |
Disability Class: Self-Care Difficulty
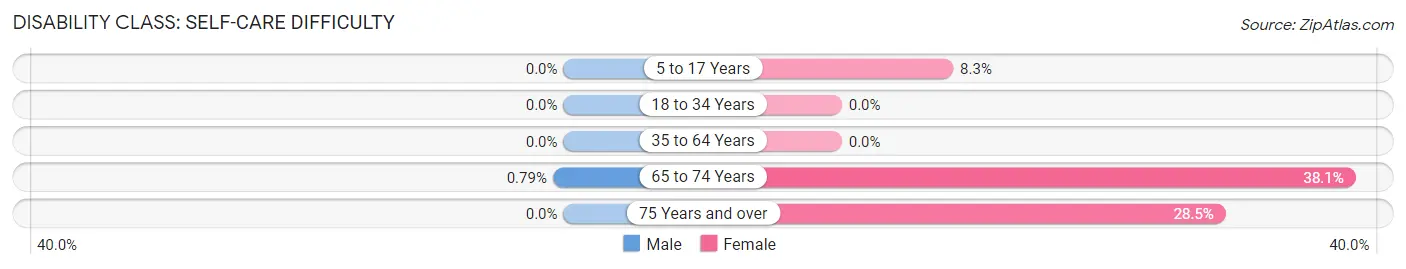
| Age Bracket | Male | Female |
| 5 to 17 Years | 0 (0.0%) | 31 (8.3%) |
| 18 to 34 Years | 0 (0.0%) | 0 (0.0%) |
| 35 to 64 Years | 0 (0.0%) | 0 (0.0%) |
| 65 to 74 Years | 2 (0.8%) | 45 (38.1%) |
| 75 Years and over | 0 (0.0%) | 59 (28.5%) |
Technology Access in Gooding
Computing Device Access in Gooding
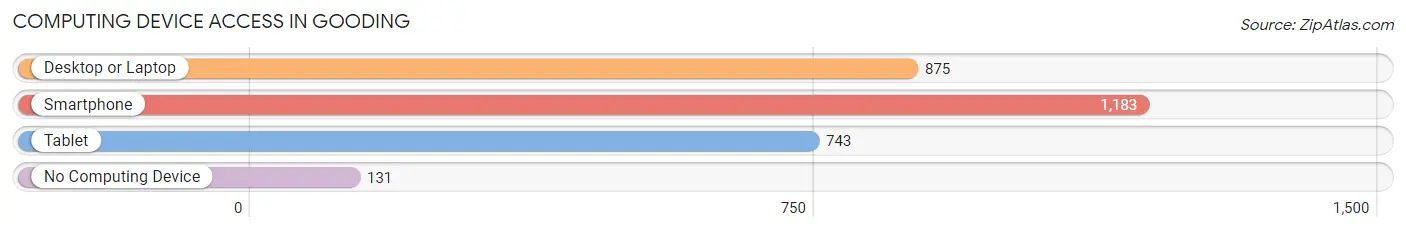
| Device Type | # Households | % Households |
| Desktop or Laptop | 875 | 63.1% |
| Smartphone | 1,183 | 85.3% |
| Tablet | 743 | 53.6% |
| No Computing Device | 131 | 9.4% |
| Total | 1,387 | 100.0% |
Internet Access in Gooding
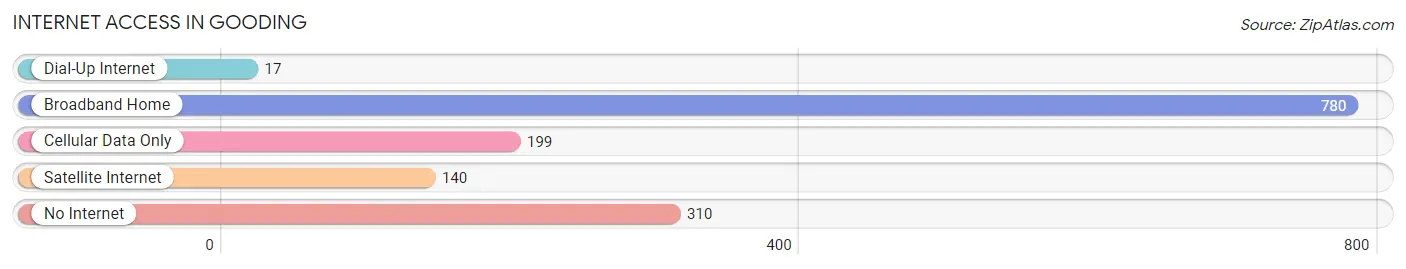
| Internet Type | # Households | % Households |
| Dial-Up Internet | 17 | 1.2% |
| Broadband Home | 780 | 56.2% |
| Cellular Data Only | 199 | 14.3% |
| Satellite Internet | 140 | 10.1% |
| No Internet | 310 | 22.4% |
| Total | 1,387 | 100.0% |
Gooding Summary
Gooding is a city located in the south-central region of the U.S. state of Idaho. It is the county seat of Gooding County and is part of the Twin Falls Metropolitan Statistical Area. The population of Gooding was 3,541 at the 2010 census.
History
Gooding was founded in 1906 by the Gooding Land and Townsite Company. The company was formed by a group of investors from Gooding, Idaho, who wanted to create a new town in the area. The town was named after the investors' hometown. The first post office was established in 1907.
The city was incorporated in 1909 and the first mayor was elected in 1910. The city was originally a farming and ranching community, but in the early 20th century, the economy shifted to include mining and manufacturing. The city was also home to a large sugar beet processing plant.
Geography
Gooding is located in the south-central region of Idaho, in the Snake River Plain. The city is situated at an elevation of 4,072 feet (1,241 m) above sea level. The city is located at the intersection of U.S. Route 26 and Idaho State Highway 46.
The city is located in the Snake River Valley, which is surrounded by the Owyhee Mountains to the east, the Albion Mountains to the west, and the Snake River to the south. The city is located approximately 50 miles (80 km) south of Twin Falls and 100 miles (160 km) north of Boise.
Economy
Gooding's economy is largely based on agriculture and manufacturing. The city is home to several large agricultural operations, including sugar beet processing, dairy farming, and cattle ranching. The city is also home to several manufacturing companies, including a plastics manufacturer and a food processing plant.
The city is also home to several retail stores, restaurants, and other businesses. The city is served by the Gooding County Airport, which provides general aviation services.
Demographics
As of the 2010 census, there were 3,541 people, 1,323 households, and 890 families residing in the city. The population density was 1,092.3 people per square mile (421.7/km2). There were 1,521 housing units at an average density of 472.3 per square mile (182.2/km2). The racial makeup of the city was 87.2% White, 0.3% African American, 0.7% Native American, 0.3% Asian, 0.1% Pacific Islander, 9.2% from other races, and 2.3% from two or more races. Hispanic or Latino of any race were 16.7% of the population.
There were 1,323 households, out of which 33.2% had children under the age of 18 living with them, 48.2% were married couples living together, 13.2% had a female householder with no husband present, and 33.2% were non-families. 28.2% of all households were made up of individuals, and 13.2% had someone living alone who was 65 years of age or older. The average household size was 2.60 and the average family size was 3.17.
In the city, the population was spread out, with 28.2% under the age of 18, 8.2% from 18 to 24, 24.2% from 25 to 44, 22.2% from 45 to 64, and 17.2% who were 65 years of age or older. The median age was 37 years. For every 100 females, there were 94.2 males. For every 100 females age 18 and over, there were 91.2 males.
The median income for a household in the city was $30,938, and the median income for a family was $36,250. Males had a median income of $30,000 versus $20,000 for females. The per capita income for the city was $14,945. About 11.2% of families and 14.2% of the population were below the poverty line, including 17.2% of those under age 18 and 8.2% of those age 65 or over.
Common Questions
What is Per Capita Income in Gooding?
Per Capita income in Gooding is $22,124.
What is the Median Family Income in Gooding?
Median Family Income in Gooding is $64,063.
What is the Median Household income in Gooding?
Median Household Income in Gooding is $42,470.
What is Income or Wage Gap in Gooding?
Income or Wage Gap in Gooding is 57.3%.
Women in Gooding earn 42.7 cents for every dollar earned by a man.
What is Inequality or Gini Index in Gooding?
Inequality or Gini Index in Gooding is 0.42.
What is the Total Population of Gooding?
Total Population of Gooding is 3,673.
What is the Total Male Population of Gooding?
Total Male Population of Gooding is 1,637.
What is the Total Female Population of Gooding?
Total Female Population of Gooding is 2,036.
What is the Ratio of Males per 100 Females in Gooding?
There are 80.40 Males per 100 Females in Gooding.
What is the Ratio of Females per 100 Males in Gooding?
There are 124.37 Females per 100 Males in Gooding.
What is the Median Population Age in Gooding?
Median Population Age in Gooding is 38.6 Years.
What is the Average Family Size in Gooding
Average Family Size in Gooding is 3.2 People.
What is the Average Household Size in Gooding
Average Household Size in Gooding is 2.6 People.
How Large is the Labor Force in Gooding?
There are 1,733 People in the Labor Forcein in Gooding.
What is the Percentage of People in the Labor Force in Gooding?
61.0% of People are in the Labor Force in Gooding.
What is the Unemployment Rate in Gooding?
Unemployment Rate in Gooding is 10.3%.