Glenns Ferry, ID Map & Demographics
Glenns Ferry Map
Glenns Ferry Overview
$20,604
PER CAPITA INCOME
$47,381
AVG FAMILY INCOME
$36,413
AVG HOUSEHOLD INCOME
19.6%
WAGE / INCOME GAP [ % ]
80.4¢/ $1
WAGE / INCOME GAP [ $ ]
0.42
INEQUALITY / GINI INDEX
1,327
TOTAL POPULATION
638
MALE POPULATION
689
FEMALE POPULATION
92.60
MALES / 100 FEMALES
107.99
FEMALES / 100 MALES
47.2
MEDIAN AGE
3.4
AVG FAMILY SIZE
2.5
AVG HOUSEHOLD SIZE
549
LABOR FORCE [ PEOPLE ]
52.5%
PERCENT IN LABOR FORCE
2.4%
UNEMPLOYMENT RATE
Glenns Ferry Zip Codes
Glenns Ferry Area Codes
Income in Glenns Ferry
Income Overview in Glenns Ferry
Per Capita Income in Glenns Ferry is $20,604, while median incomes of families and households are $47,381 and $36,413 respectively.
| Characteristic | Number | Measure |
| Per Capita Income | 1,327 | $20,604 |
| Median Family Income | 282 | $47,381 |
| Mean Family Income | 282 | $54,546 |
| Median Household Income | 492 | $36,413 |
| Mean Household Income | 492 | $45,818 |
| Income Deficit | 282 | $0 |
| Wage / Income Gap (%) | 1,327 | 19.58% |
| Wage / Income Gap ($) | 1,327 | 80.42¢ per $1 |
| Gini / Inequality Index | 1,327 | 0.42 |
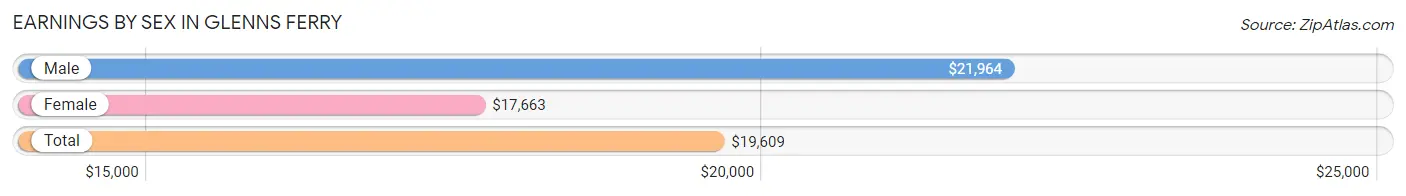
Earnings by Sex in Glenns Ferry
Average Earnings in Glenns Ferry are $19,609, $21,964 for men and $17,663 for women, a difference of 19.6%.
| Sex | Number | Average Earnings |
| Male | 317 (50.5%) | $21,964 |
| Female | 311 (49.5%) | $17,663 |
| Total | 628 (100.0%) | $19,609 |
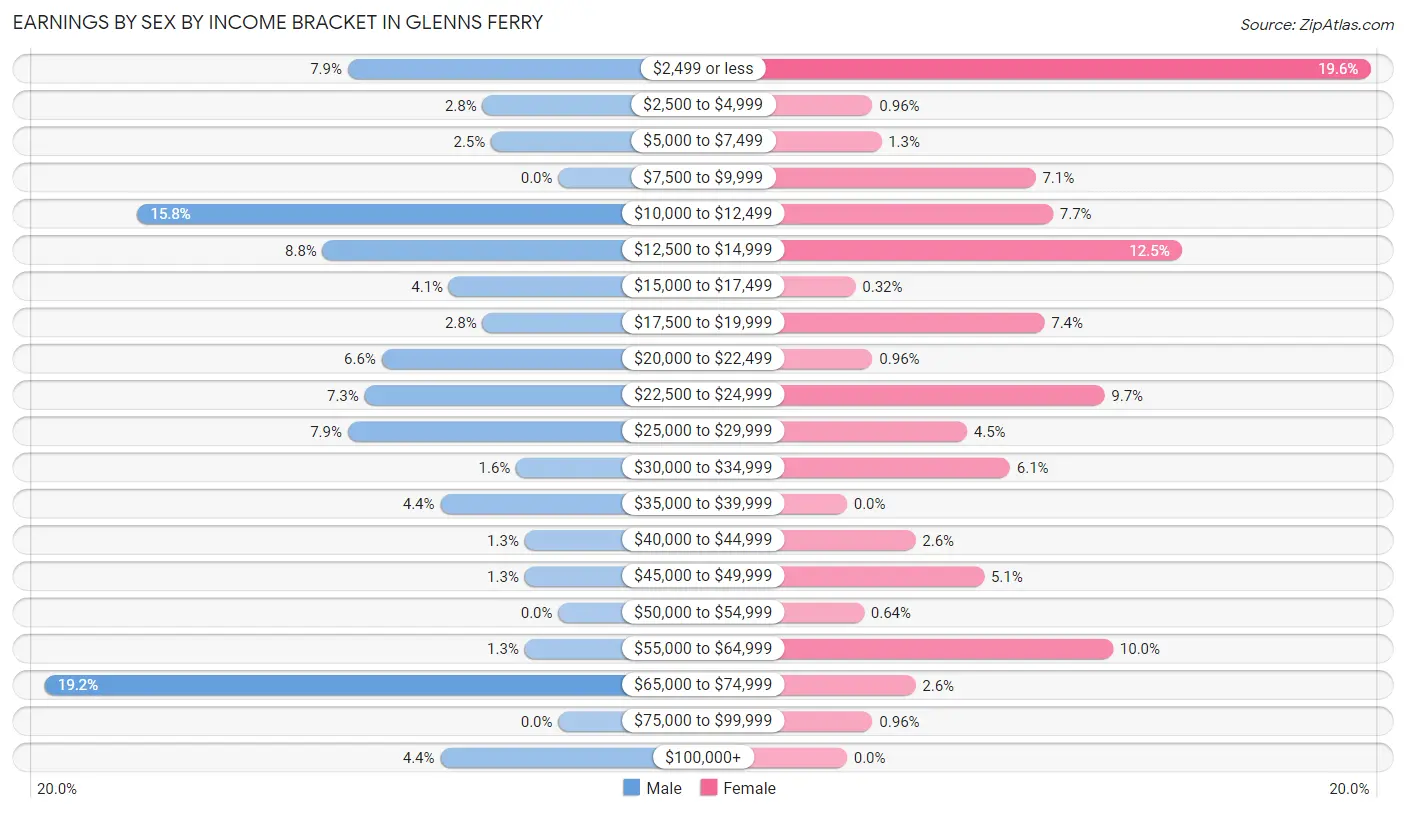
Earnings by Sex by Income Bracket in Glenns Ferry
The most common earnings brackets in Glenns Ferry are $65,000 to $74,999 for men (61 | 19.2%) and $2,499 or less for women (61 | 19.6%).
| Income | Male | Female |
| $2,499 or less | 25 (7.9%) | 61 (19.6%) |
| $2,500 to $4,999 | 9 (2.8%) | 3 (1.0%) |
| $5,000 to $7,499 | 8 (2.5%) | 4 (1.3%) |
| $7,500 to $9,999 | 0 (0.0%) | 22 (7.1%) |
| $10,000 to $12,499 | 50 (15.8%) | 24 (7.7%) |
| $12,500 to $14,999 | 28 (8.8%) | 39 (12.5%) |
| $15,000 to $17,499 | 13 (4.1%) | 1 (0.3%) |
| $17,500 to $19,999 | 9 (2.8%) | 23 (7.4%) |
| $20,000 to $22,499 | 21 (6.6%) | 3 (1.0%) |
| $22,500 to $24,999 | 23 (7.3%) | 30 (9.7%) |
| $25,000 to $29,999 | 25 (7.9%) | 14 (4.5%) |
| $30,000 to $34,999 | 5 (1.6%) | 19 (6.1%) |
| $35,000 to $39,999 | 14 (4.4%) | 0 (0.0%) |
| $40,000 to $44,999 | 4 (1.3%) | 8 (2.6%) |
| $45,000 to $49,999 | 4 (1.3%) | 16 (5.1%) |
| $50,000 to $54,999 | 0 (0.0%) | 2 (0.6%) |
| $55,000 to $64,999 | 4 (1.3%) | 31 (10.0%) |
| $65,000 to $74,999 | 61 (19.2%) | 8 (2.6%) |
| $75,000 to $99,999 | 0 (0.0%) | 3 (1.0%) |
| $100,000+ | 14 (4.4%) | 0 (0.0%) |
| Total | 317 (100.0%) | 311 (100.0%) |
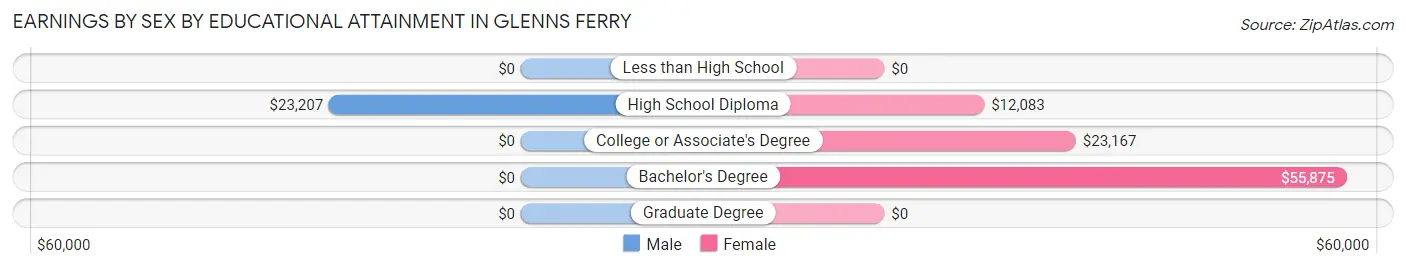
Earnings by Sex by Educational Attainment in Glenns Ferry
Average earnings in Glenns Ferry are $24,185 for men and $18,587 for women, a difference of 23.2%. Men with an educational attainment of high school diploma enjoy the highest average annual earnings of $23,207, while those with high school diploma education earn the least with $23,207. Women with an educational attainment of bachelor's degree earn the most with the average annual earnings of $55,875, while those with high school diploma education have the smallest earnings of $12,083.
| Educational Attainment | Male Income | Female Income |
| Less than High School | - | - |
| High School Diploma | $23,207 | $12,083 |
| College or Associate's Degree | - | - |
| Bachelor's Degree | - | - |
| Graduate Degree | - | - |
| Total | $24,185 | $18,587 |
Family Income in Glenns Ferry
Family Income Brackets in Glenns Ferry
According to the Glenns Ferry family income data, there are 69 families falling into the $50,000 to $74,999 income range, which is the most common income bracket and makes up 24.5% of all families.
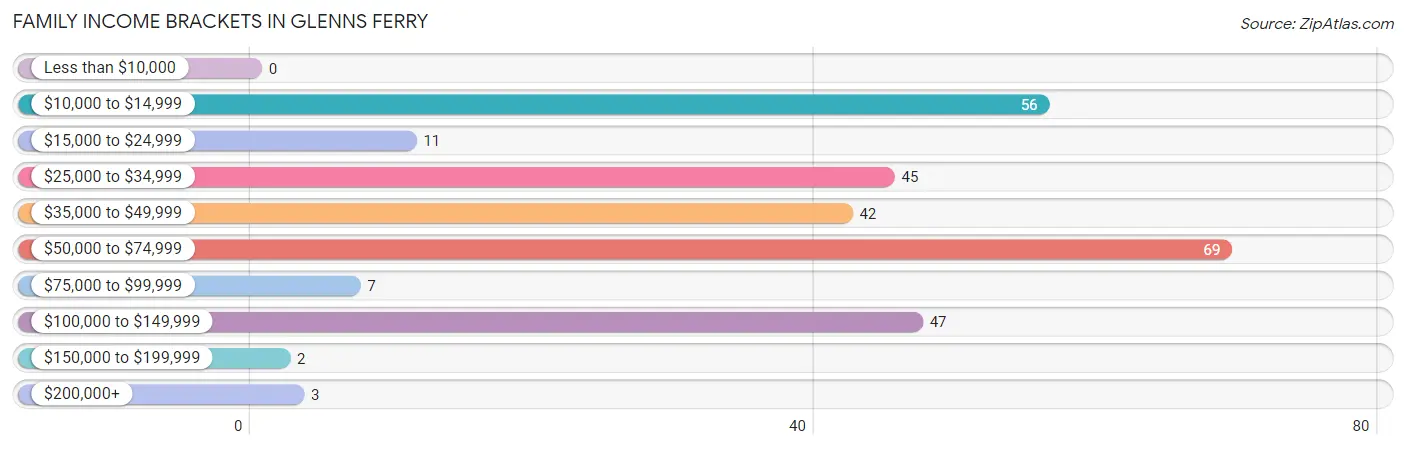
| Income Bracket | # Families | % Families |
| Less than $10,000 | 0 | 0.0% |
| $10,000 to $14,999 | 56 | 19.9% |
| $15,000 to $24,999 | 11 | 3.9% |
| $25,000 to $34,999 | 45 | 16.0% |
| $35,000 to $49,999 | 42 | 14.9% |
| $50,000 to $74,999 | 69 | 24.5% |
| $75,000 to $99,999 | 7 | 2.5% |
| $100,000 to $149,999 | 47 | 16.7% |
| $150,000 to $199,999 | 2 | 0.7% |
| $200,000+ | 3 | 1.1% |
Family Income by Famaliy Size in Glenns Ferry
2-person families (164 | 58.2%) account for the highest median family income in Glenns Ferry with $50,000 per family, while 2-person families (164 | 58.2%) have the highest median income of $25,000 per family member.
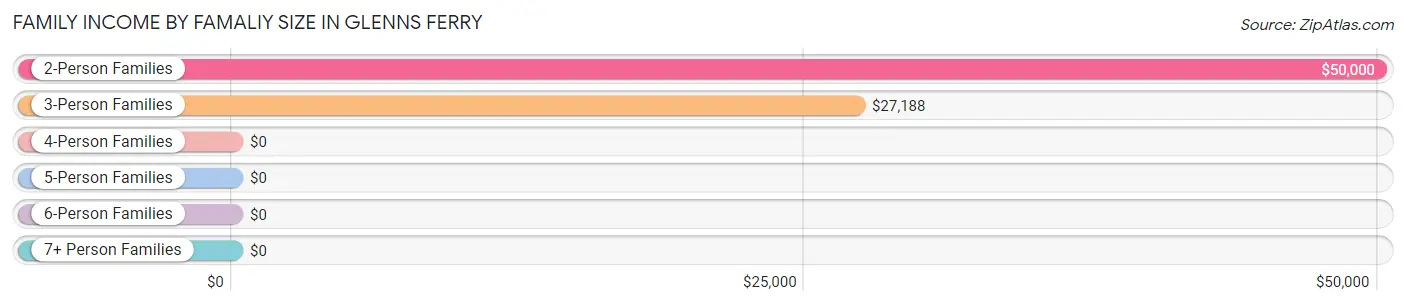
| Income Bracket | # Families | Median Income |
| 2-Person Families | 164 (58.2%) | $50,000 |
| 3-Person Families | 30 (10.6%) | $27,188 |
| 4-Person Families | 22 (7.8%) | $0 |
| 5-Person Families | 35 (12.4%) | $0 |
| 6-Person Families | 7 (2.5%) | $0 |
| 7+ Person Families | 24 (8.5%) | $0 |
| Total | 282 (100.0%) | $47,381 |
Family Income by Number of Earners in Glenns Ferry
The median family income in Glenns Ferry is $47,381, with families comprising 3+ earners (9) having the highest median family income of $148,125, while families with no earners (93) have the lowest median family income of $34,219, accounting for 3.2% and 33.0% of families, respectively.
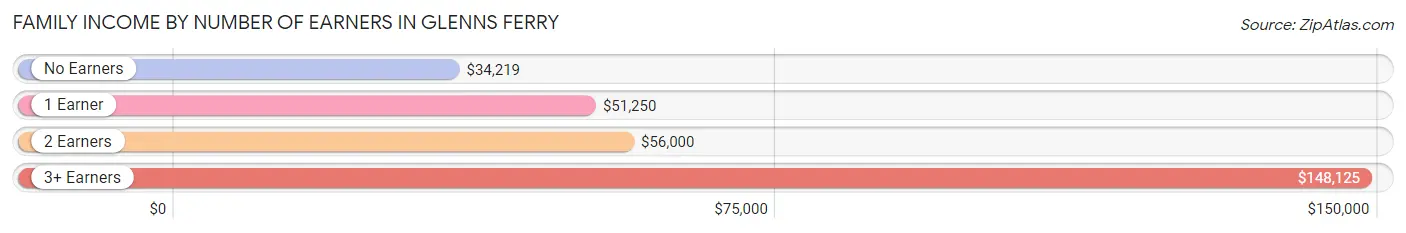
| Number of Earners | # Families | Median Income |
| No Earners | 93 (33.0%) | $34,219 |
| 1 Earner | 74 (26.2%) | $51,250 |
| 2 Earners | 106 (37.6%) | $56,000 |
| 3+ Earners | 9 (3.2%) | $148,125 |
| Total | 282 (100.0%) | $47,381 |
Household Income in Glenns Ferry
Household Income Brackets in Glenns Ferry
With 111 households falling in the category, the $50,000 to $74,999 income range is the most frequent in Glenns Ferry, accounting for 22.6% of all households. In contrast, only 2 households (0.4%) fall into the $150,000 to $199,999 income bracket, making it the least populous group.
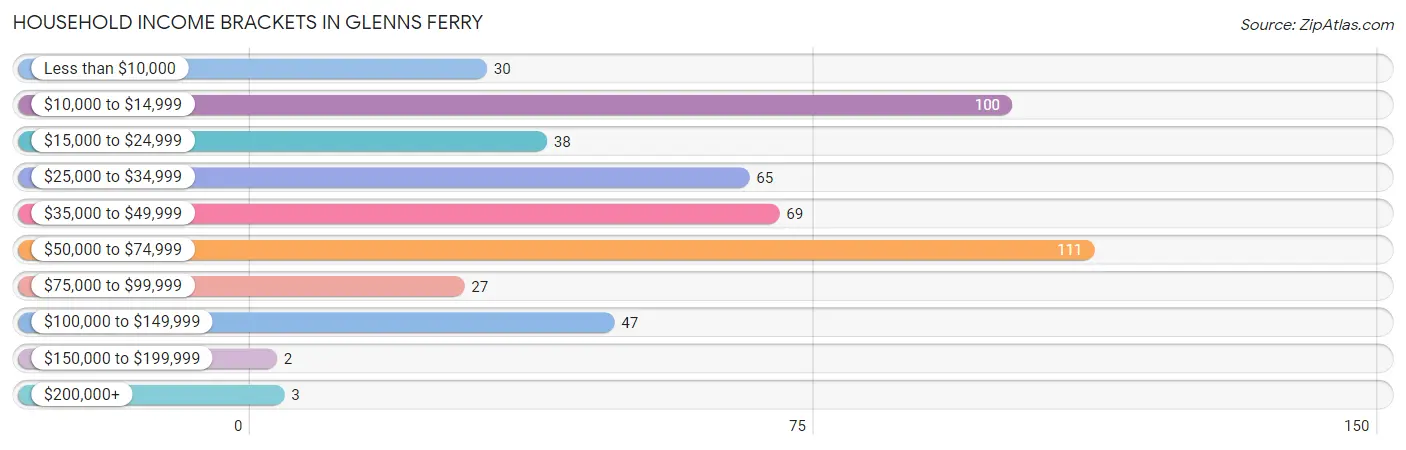
| Income Bracket | # Households | % Households |
| Less than $10,000 | 30 | 6.1% |
| $10,000 to $14,999 | 100 | 20.3% |
| $15,000 to $24,999 | 38 | 7.7% |
| $25,000 to $34,999 | 65 | 13.2% |
| $35,000 to $49,999 | 69 | 14.0% |
| $50,000 to $74,999 | 111 | 22.6% |
| $75,000 to $99,999 | 27 | 5.5% |
| $100,000 to $149,999 | 47 | 9.6% |
| $150,000 to $199,999 | 2 | 0.4% |
| $200,000+ | 3 | 0.6% |
Household Income by Householder Age in Glenns Ferry
The median household income in Glenns Ferry is $36,413, with the highest median household income of $48,125 found in the 45 to 64 years age bracket for the primary householder. A total of 222 households (45.1%) fall into this category.
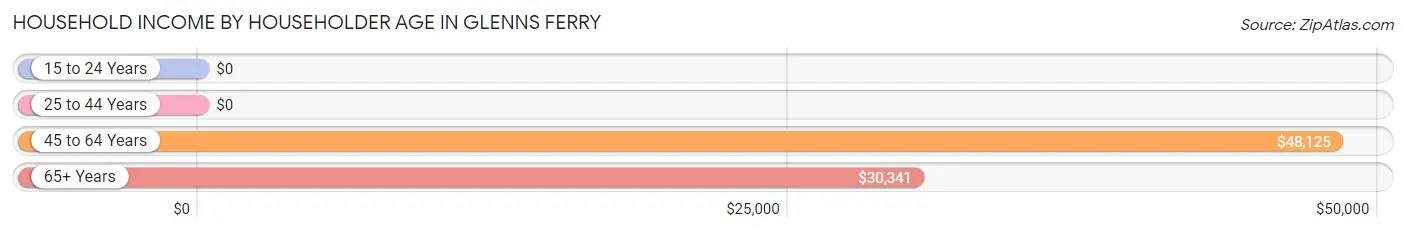
| Income Bracket | # Households | Median Income |
| 15 to 24 Years | 0 (0.0%) | $0 |
| 25 to 44 Years | 83 (16.9%) | $0 |
| 45 to 64 Years | 222 (45.1%) | $48,125 |
| 65+ Years | 187 (38.0%) | $30,341 |
| Total | 492 (100.0%) | $36,413 |
Poverty in Glenns Ferry
Income Below Poverty by Sex and Age in Glenns Ferry
With 40.8% poverty level for males and 34.7% for females among the residents of Glenns Ferry, 12 to 14 year old males and 18 to 24 year old females are the most vulnerable to poverty, with 7 males (100.0%) and 17 females (89.5%) in their respective age groups living below the poverty level.
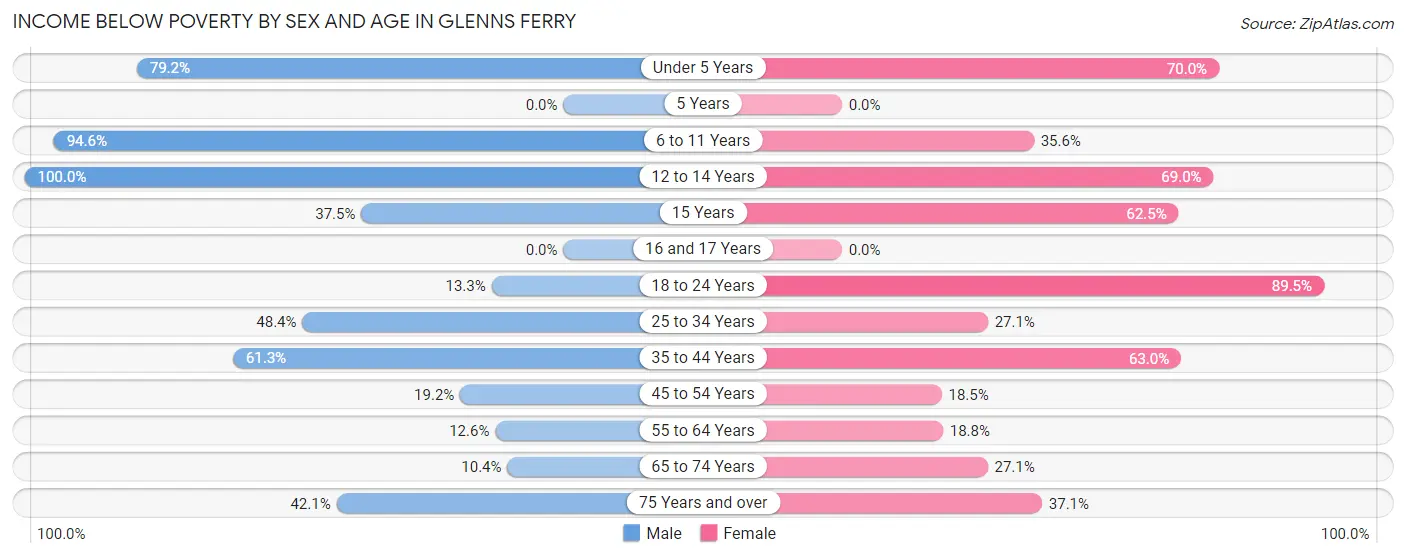
| Age Bracket | Male | Female |
| Under 5 Years | 19 (79.2%) | 35 (70.0%) |
| 5 Years | 0 (0.0%) | 0 (0.0%) |
| 6 to 11 Years | 70 (94.6%) | 26 (35.6%) |
| 12 to 14 Years | 7 (100.0%) | 20 (69.0%) |
| 15 Years | 3 (37.5%) | 5 (62.5%) |
| 16 and 17 Years | 0 (0.0%) | 0 (0.0%) |
| 18 to 24 Years | 2 (13.3%) | 17 (89.5%) |
| 25 to 34 Years | 31 (48.4%) | 13 (27.1%) |
| 35 to 44 Years | 46 (61.3%) | 17 (63.0%) |
| 45 to 54 Years | 18 (19.2%) | 15 (18.5%) |
| 55 to 64 Years | 11 (12.6%) | 24 (18.8%) |
| 65 to 74 Years | 8 (10.4%) | 33 (27.1%) |
| 75 Years and over | 32 (42.1%) | 13 (37.1%) |
| Total | 247 (40.8%) | 218 (34.7%) |
Income Above Poverty by Sex and Age in Glenns Ferry
According to the poverty statistics in Glenns Ferry, males aged 5 years and females aged 5 years are the age groups that are most secure financially, with 100.0% of males and 100.0% of females in these age groups living above the poverty line.
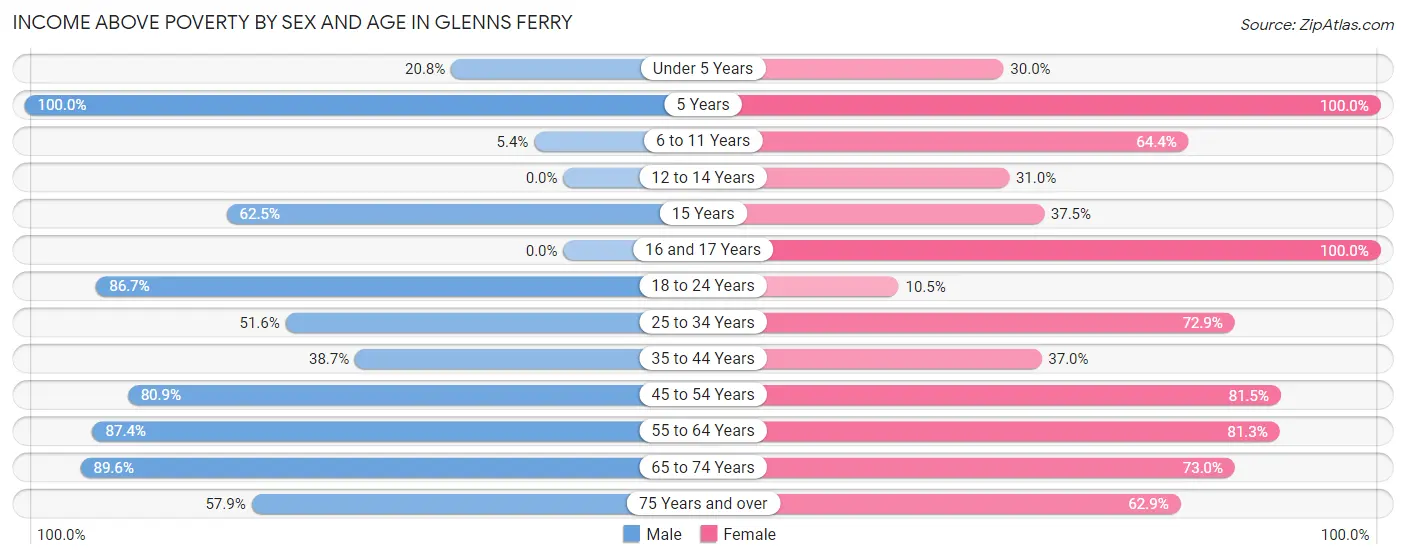
| Age Bracket | Male | Female |
| Under 5 Years | 5 (20.8%) | 15 (30.0%) |
| 5 Years | 4 (100.0%) | 2 (100.0%) |
| 6 to 11 Years | 4 (5.4%) | 47 (64.4%) |
| 12 to 14 Years | 0 (0.0%) | 9 (31.0%) |
| 15 Years | 5 (62.5%) | 3 (37.5%) |
| 16 and 17 Years | 0 (0.0%) | 6 (100.0%) |
| 18 to 24 Years | 13 (86.7%) | 2 (10.5%) |
| 25 to 34 Years | 33 (51.6%) | 35 (72.9%) |
| 35 to 44 Years | 29 (38.7%) | 10 (37.0%) |
| 45 to 54 Years | 76 (80.8%) | 66 (81.5%) |
| 55 to 64 Years | 76 (87.4%) | 104 (81.2%) |
| 65 to 74 Years | 69 (89.6%) | 89 (73.0%) |
| 75 Years and over | 44 (57.9%) | 22 (62.9%) |
| Total | 358 (59.2%) | 410 (65.3%) |
Income Below Poverty Among Married-Couple Families in Glenns Ferry
The poverty statistics for married-couple families in Glenns Ferry show that 24.1% or 57 of the total 236 families live below the poverty line. Families with 5 or more children have the highest poverty rate of 100.0%, comprising of 24 families. On the other hand, families with 1 or 2 children have the lowest poverty rate of 0.0%, which includes 0 families.
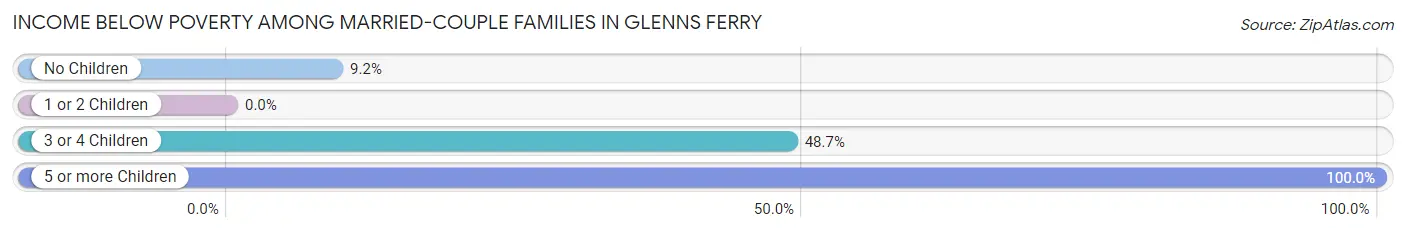
| Children | Above Poverty | Below Poverty |
| No Children | 139 (90.8%) | 14 (9.1%) |
| 1 or 2 Children | 20 (100.0%) | 0 (0.0%) |
| 3 or 4 Children | 20 (51.3%) | 19 (48.7%) |
| 5 or more Children | 0 (0.0%) | 24 (100.0%) |
| Total | 179 (75.8%) | 57 (24.1%) |
Income Below Poverty Among Single-Parent Households in Glenns Ferry
According to the poverty data in Glenns Ferry, 100.0% or 16 single-father households and 10.0% or 3 single-mother households are living below the poverty line. Among single-father households, those with no children have the highest poverty rate, with 8 households (100.0%) experiencing poverty. Likewise, among single-mother households, those with 1 or 2 children have the highest poverty rate, with 3 households (37.5%) falling below the poverty line.
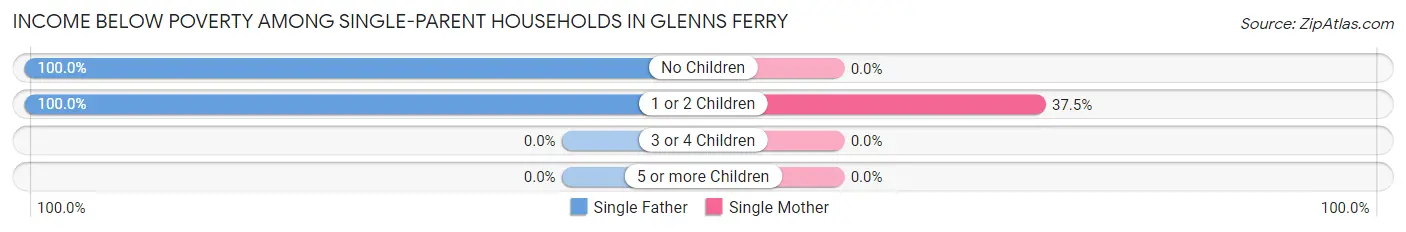
| Children | Single Father | Single Mother |
| No Children | 8 (100.0%) | 0 (0.0%) |
| 1 or 2 Children | 8 (100.0%) | 3 (37.5%) |
| 3 or 4 Children | 0 (0.0%) | 0 (0.0%) |
| 5 or more Children | 0 (0.0%) | 0 (0.0%) |
| Total | 16 (100.0%) | 3 (10.0%) |
Income Below Poverty Among Married-Couple vs Single-Parent Households in Glenns Ferry
The poverty data for Glenns Ferry shows that 57 of the married-couple family households (24.1%) and 19 of the single-parent households (41.3%) are living below the poverty level. Within the married-couple family households, those with 5 or more children have the highest poverty rate, with 24 households (100.0%) falling below the poverty line. Among the single-parent households, those with 1 or 2 children have the highest poverty rate, with 11 household (68.8%) living below poverty.
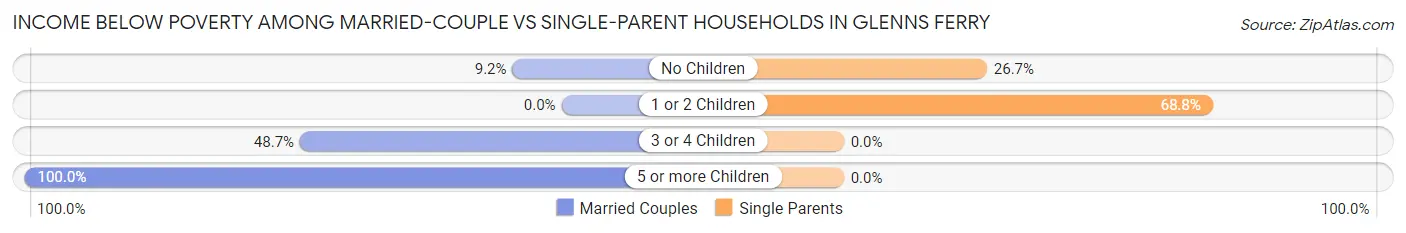
| Children | Married-Couple Families | Single-Parent Households |
| No Children | 14 (9.1%) | 8 (26.7%) |
| 1 or 2 Children | 0 (0.0%) | 11 (68.8%) |
| 3 or 4 Children | 19 (48.7%) | 0 (0.0%) |
| 5 or more Children | 24 (100.0%) | 0 (0.0%) |
| Total | 57 (24.1%) | 19 (41.3%) |
Race in Glenns Ferry
The most populous races in Glenns Ferry are White / Caucasian (1,100 | 82.9%), Hispanic or Latino (349 | 26.3%), and Two or more Races (175 | 13.2%).
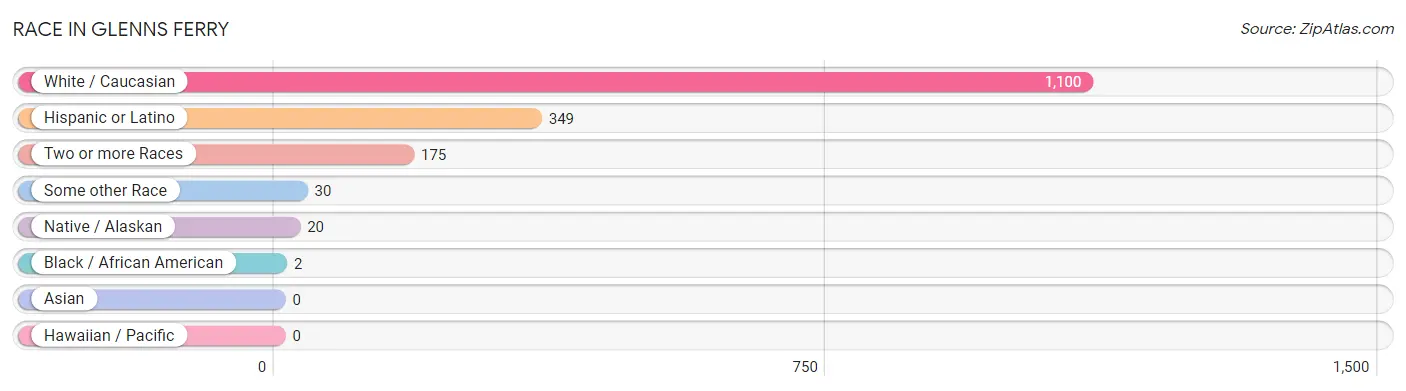
| Race | # Population | % Population |
| Asian | 0 | 0.0% |
| Black / African American | 2 | 0.2% |
| Hawaiian / Pacific | 0 | 0.0% |
| Hispanic or Latino | 349 | 26.3% |
| Native / Alaskan | 20 | 1.5% |
| White / Caucasian | 1,100 | 82.9% |
| Two or more Races | 175 | 13.2% |
| Some other Race | 30 | 2.3% |
| Total | 1,327 | 100.0% |
Ancestry in Glenns Ferry
The most populous ancestries reported in Glenns Ferry are English (327 | 24.6%), German (302 | 22.8%), Mexican (257 | 19.4%), Scottish (147 | 11.1%), and Irish (85 | 6.4%), together accounting for 84.3% of all Glenns Ferry residents.
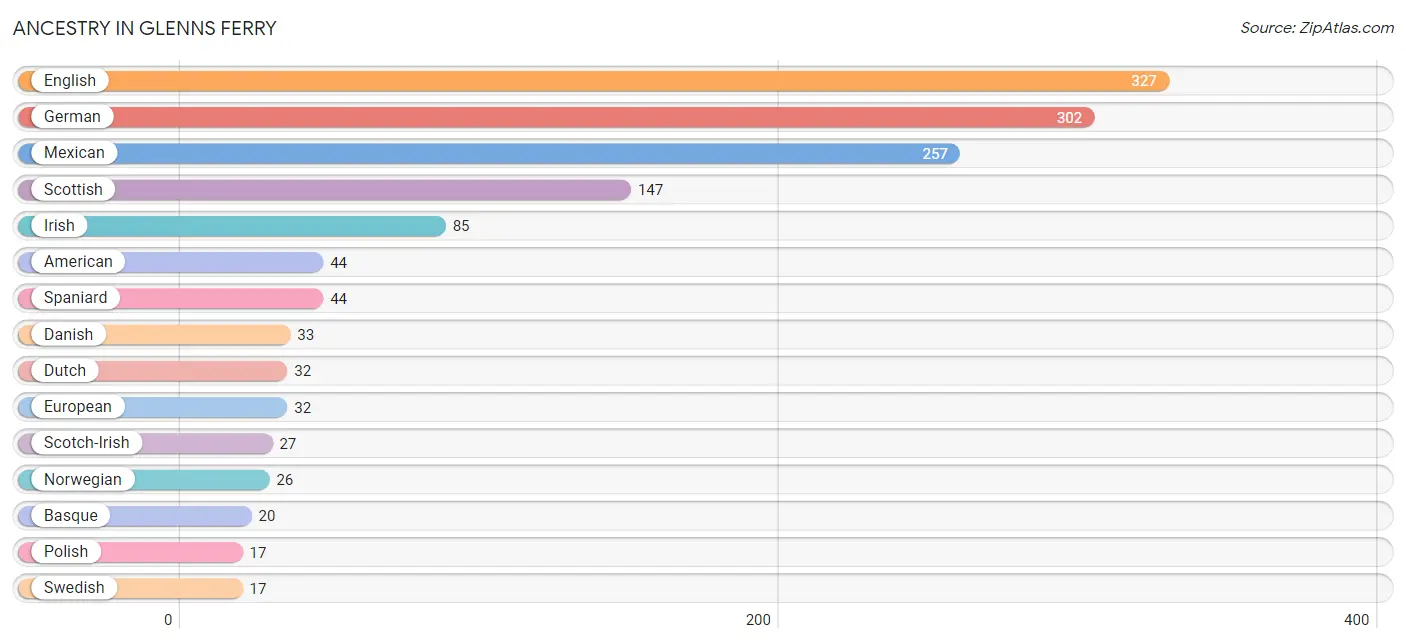
| Ancestry | # Population | % Population |
| American | 44 | 3.3% |
| Apache | 2 | 0.2% |
| Basque | 20 | 1.5% |
| Belgian | 11 | 0.8% |
| British | 3 | 0.2% |
| Cherokee | 12 | 0.9% |
| Czech | 4 | 0.3% |
| Danish | 33 | 2.5% |
| Dutch | 32 | 2.4% |
| English | 327 | 24.6% |
| European | 32 | 2.4% |
| French | 11 | 0.8% |
| German | 302 | 22.8% |
| Iranian | 16 | 1.2% |
| Irish | 85 | 6.4% |
| Italian | 6 | 0.4% |
| Mexican | 257 | 19.4% |
| Norwegian | 26 | 2.0% |
| Polish | 17 | 1.3% |
| Puerto Rican | 5 | 0.4% |
| Scandinavian | 2 | 0.2% |
| Scotch-Irish | 27 | 2.0% |
| Scottish | 147 | 11.1% |
| Spaniard | 44 | 3.3% |
| Spanish | 8 | 0.6% |
| Swedish | 17 | 1.3% |
| Turkish | 4 | 0.3% |
| Ukrainian | 2 | 0.2% |
| Welsh | 5 | 0.4% |
| Yaqui | 2 | 0.2% | View All 30 Rows |
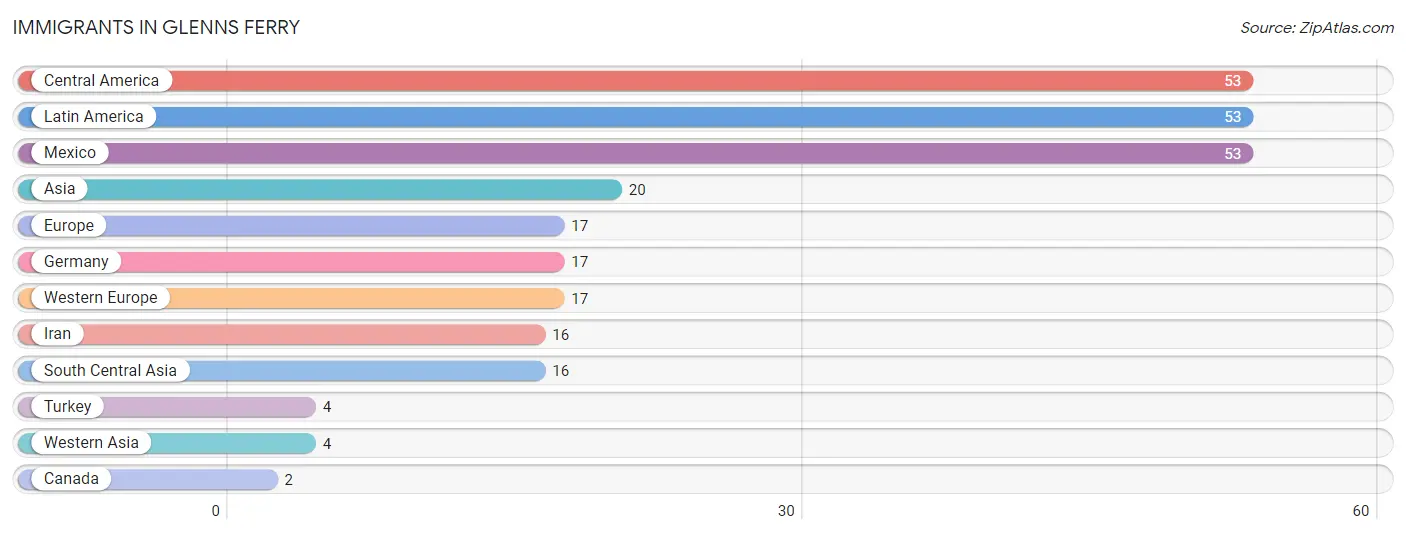
Immigrants in Glenns Ferry
The most numerous immigrant groups reported in Glenns Ferry came from Central America (53 | 4.0%), Latin America (53 | 4.0%), Mexico (53 | 4.0%), Asia (20 | 1.5%), and Europe (17 | 1.3%), together accounting for 14.8% of all Glenns Ferry residents.
| Immigration Origin | # Population | % Population |
| Asia | 20 | 1.5% |
| Canada | 2 | 0.2% |
| Central America | 53 | 4.0% |
| Europe | 17 | 1.3% |
| Germany | 17 | 1.3% |
| Iran | 16 | 1.2% |
| Latin America | 53 | 4.0% |
| Mexico | 53 | 4.0% |
| South Central Asia | 16 | 1.2% |
| Turkey | 4 | 0.3% |
| Western Asia | 4 | 0.3% |
| Western Europe | 17 | 1.3% | View All 12 Rows |
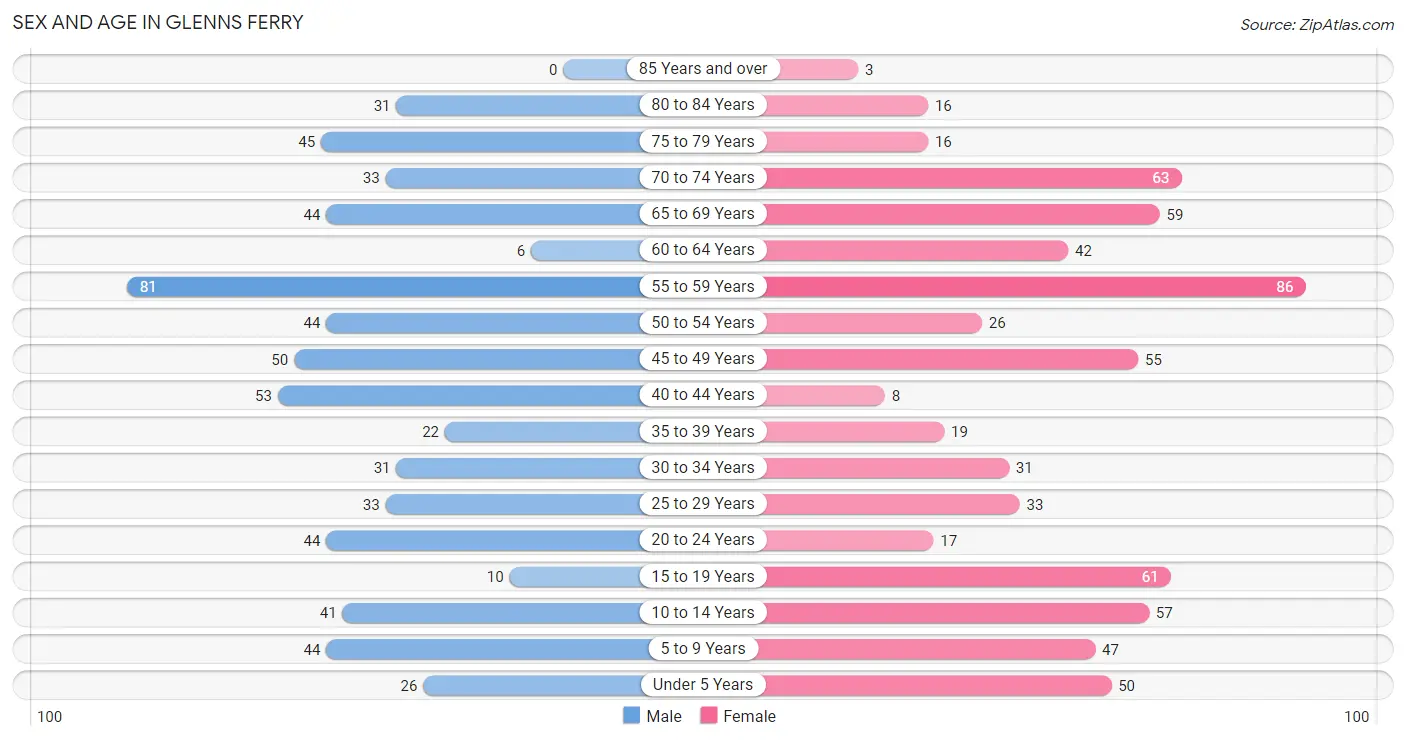
Sex and Age in Glenns Ferry
Sex and Age in Glenns Ferry
The most populous age groups in Glenns Ferry are 55 to 59 Years (81 | 12.7%) for men and 55 to 59 Years (86 | 12.5%) for women.
| Age Bracket | Male | Female |
| Under 5 Years | 26 (4.1%) | 50 (7.3%) |
| 5 to 9 Years | 44 (6.9%) | 47 (6.8%) |
| 10 to 14 Years | 41 (6.4%) | 57 (8.3%) |
| 15 to 19 Years | 10 (1.6%) | 61 (8.8%) |
| 20 to 24 Years | 44 (6.9%) | 17 (2.5%) |
| 25 to 29 Years | 33 (5.2%) | 33 (4.8%) |
| 30 to 34 Years | 31 (4.9%) | 31 (4.5%) |
| 35 to 39 Years | 22 (3.5%) | 19 (2.8%) |
| 40 to 44 Years | 53 (8.3%) | 8 (1.2%) |
| 45 to 49 Years | 50 (7.8%) | 55 (8.0%) |
| 50 to 54 Years | 44 (6.9%) | 26 (3.8%) |
| 55 to 59 Years | 81 (12.7%) | 86 (12.5%) |
| 60 to 64 Years | 6 (0.9%) | 42 (6.1%) |
| 65 to 69 Years | 44 (6.9%) | 59 (8.6%) |
| 70 to 74 Years | 33 (5.2%) | 63 (9.1%) |
| 75 to 79 Years | 45 (7.0%) | 16 (2.3%) |
| 80 to 84 Years | 31 (4.9%) | 16 (2.3%) |
| 85 Years and over | 0 (0.0%) | 3 (0.4%) |
| Total | 638 (100.0%) | 689 (100.0%) |
Families and Households in Glenns Ferry
Median Family Size in Glenns Ferry
The median family size in Glenns Ferry is 3.37 persons per family, with married-couple families (236 | 83.7%) accounting for the largest median family size of 3.51 persons per family. On the other hand, single male/father families (16 | 5.7%) represent the smallest median family size with 2.31 persons per family.
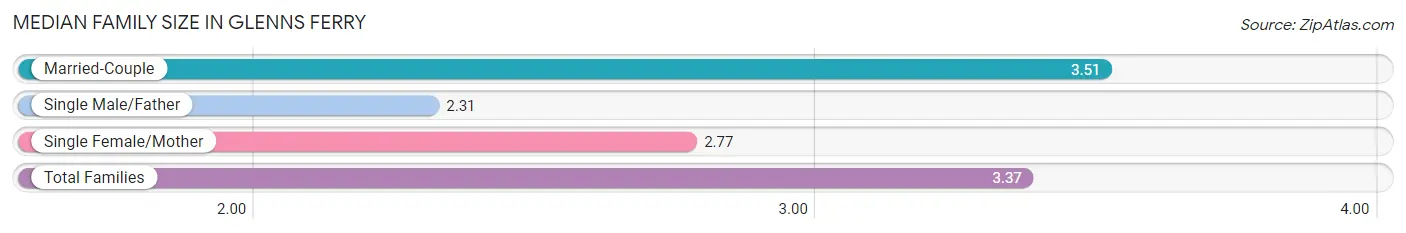
| Family Type | # Families | Family Size |
| Married-Couple | 236 (83.7%) | 3.51 |
| Single Male/Father | 16 (5.7%) | 2.31 |
| Single Female/Mother | 30 (10.6%) | 2.77 |
| Total Families | 282 (100.0%) | 3.37 |
Median Household Size in Glenns Ferry
The median household size in Glenns Ferry is 2.49 persons per household, with married-couple households (236 | 48.0%) accounting for the largest median household size of 3.51 persons per household. non-family households (210 | 42.7%) represent the smallest median household size with 1.31 persons per household.
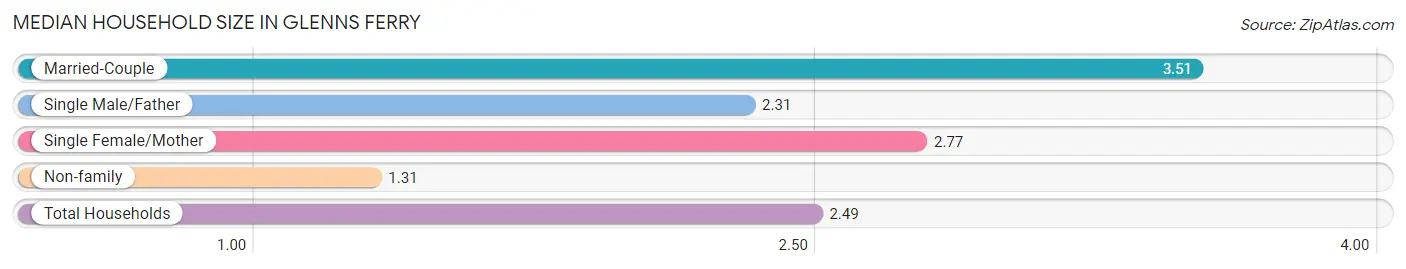
| Household Type | # Households | Household Size |
| Married-Couple | 236 (48.0%) | 3.51 |
| Single Male/Father | 16 (3.3%) | 2.31 |
| Single Female/Mother | 30 (6.1%) | 2.77 |
| Non-family | 210 (42.7%) | 1.31 |
| Total Households | 492 (100.0%) | 2.49 |
Household Size by Marriage Status in Glenns Ferry
Out of a total of 492 households in Glenns Ferry, 282 (57.3%) are family households, while 210 (42.7%) are nonfamily households. The most numerous type of family households are 2-person households, comprising 164, and the most common type of nonfamily households are 1-person households, comprising 161.
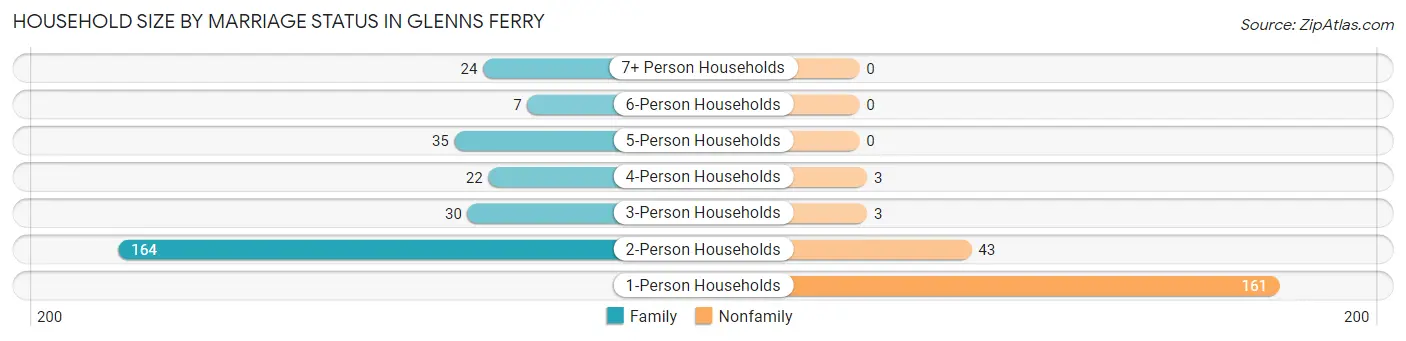
| Household Size | Family Households | Nonfamily Households |
| 1-Person Households | - | 161 (32.7%) |
| 2-Person Households | 164 (33.3%) | 43 (8.7%) |
| 3-Person Households | 30 (6.1%) | 3 (0.6%) |
| 4-Person Households | 22 (4.5%) | 3 (0.6%) |
| 5-Person Households | 35 (7.1%) | 0 (0.0%) |
| 6-Person Households | 7 (1.4%) | 0 (0.0%) |
| 7+ Person Households | 24 (4.9%) | 0 (0.0%) |
| Total | 282 (57.3%) | 210 (42.7%) |
Female Fertility in Glenns Ferry
Fertility by Age in Glenns Ferry
| Age Bracket | Women with Births | Births / 1,000 Women |
| 15 to 19 years | 0 (0.0%) | 0.0 |
| 20 to 34 years | 0 (0.0%) | 0.0 |
| 35 to 50 years | 0 (0.0%) | 0.0 |
| Total | 0 (0.0%) | 0.0 |
Fertility by Age by Marriage Status in Glenns Ferry
| Age Bracket | Married | Unmarried |
| 15 to 19 years | 0 (0.0%) | 0 (0.0%) |
| 20 to 34 years | 0 (0.0%) | 0 (0.0%) |
| 35 to 50 years | 0 (0.0%) | 0 (0.0%) |
| Total | 0 (0.0%) | 0 (0.0%) |
Fertility by Education in Glenns Ferry
| Educational Attainment | Women with Births | Births / 1,000 Women |
| Less than High School | 0 (0.0%) | 0.0 |
| High School Diploma | 0 (0.0%) | 0.0 |
| College or Associate's Degree | 0 (0.0%) | 0.0 |
| Bachelor's Degree | 0 (0.0%) | 0.0 |
| Graduate Degree | 0 (0.0%) | 0.0 |
| Total | 0 (0.0%) | 0.0 |
Fertility by Education by Marriage Status in Glenns Ferry
| Educational Attainment | Married | Unmarried |
| Less than High School | 0 (0.0%) | 0 (0.0%) |
| High School Diploma | 0 (0.0%) | 0 (0.0%) |
| College or Associate's Degree | 0 (0.0%) | 0 (0.0%) |
| Bachelor's Degree | 0 (0.0%) | 0 (0.0%) |
| Graduate Degree | 0 (0.0%) | 0 (0.0%) |
| Total | 0 (0.0%) | 0 (0.0%) |
Employment Characteristics in Glenns Ferry
Employment by Class of Employer in Glenns Ferry
Among the 525 employed individuals in Glenns Ferry, private company employees (210 | 40.0%), local government employees (114 | 21.7%), and not-for-profit organizations (83 | 15.8%) make up the most common classes of employment.
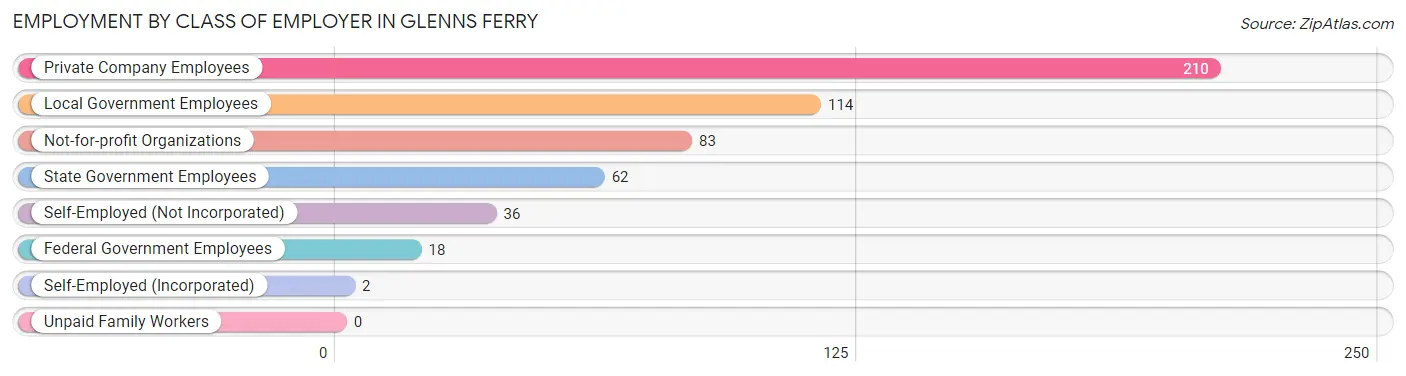
| Employer Class | # Employees | % Employees |
| Private Company Employees | 210 | 40.0% |
| Self-Employed (Incorporated) | 2 | 0.4% |
| Self-Employed (Not Incorporated) | 36 | 6.9% |
| Not-for-profit Organizations | 83 | 15.8% |
| Local Government Employees | 114 | 21.7% |
| State Government Employees | 62 | 11.8% |
| Federal Government Employees | 18 | 3.4% |
| Unpaid Family Workers | 0 | 0.0% |
| Total | 525 | 100.0% |
Employment Status by Age in Glenns Ferry
According to the labor force statistics for Glenns Ferry, out of the total population over 16 years of age (1,046), 52.5% or 549 individuals are in the labor force, with 2.4% or 13 of them unemployed. The age group with the highest labor force participation rate is 25 to 29 years, with 100.0% or 66 individuals in the labor force. Within the labor force, the 30 to 34 years age range has the highest percentage of unemployed individuals, with 29.7% or 11 of them being unemployed.
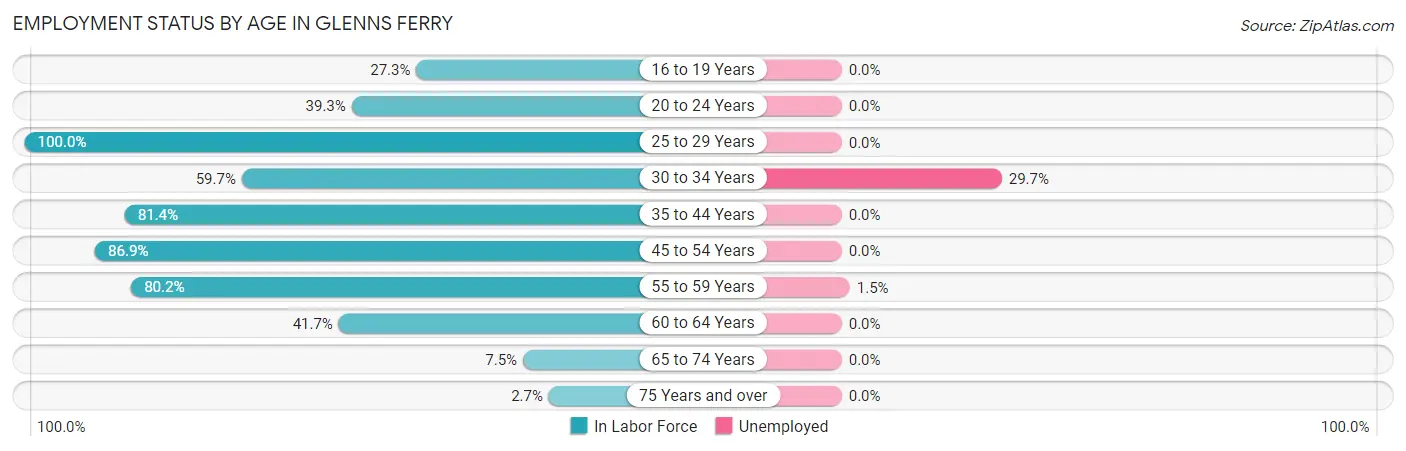
| Age Bracket | In Labor Force | Unemployed |
| 16 to 19 Years | 15 (27.3%) | 0 (0.0%) |
| 20 to 24 Years | 24 (39.3%) | 0 (0.0%) |
| 25 to 29 Years | 66 (100.0%) | 0 (0.0%) |
| 30 to 34 Years | 37 (59.7%) | 11 (29.7%) |
| 35 to 44 Years | 83 (81.4%) | 0 (0.0%) |
| 45 to 54 Years | 152 (86.9%) | 0 (0.0%) |
| 55 to 59 Years | 134 (80.2%) | 2 (1.5%) |
| 60 to 64 Years | 20 (41.7%) | 0 (0.0%) |
| 65 to 74 Years | 15 (7.5%) | 0 (0.0%) |
| 75 Years and over | 3 (2.7%) | 0 (0.0%) |
| Total | 549 (52.5%) | 13 (2.4%) |
Employment Status by Educational Attainment in Glenns Ferry
According to labor force statistics for Glenns Ferry, 79.4% of individuals (492) out of the total population between 25 and 64 years of age (620) are in the labor force, with 2.7% or 13 of them being unemployed. The group with the highest labor force participation rate are those with the educational attainment of bachelor's degree or higher, with 100.0% or 91 individuals in the labor force. Within the labor force, individuals with bachelor's degree or higher education have the highest percentage of unemployment, with 12.4% or 11 of them being unemployed.
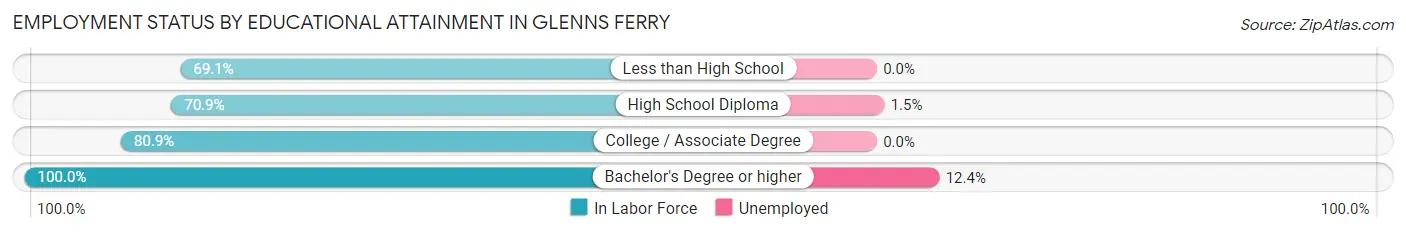
| Educational Attainment | In Labor Force | Unemployed |
| Less than High School | 47 (69.1%) | 0 (0.0%) |
| High School Diploma | 134 (70.9%) | 3 (1.5%) |
| College / Associate Degree | 220 (80.9%) | 0 (0.0%) |
| Bachelor's Degree or higher | 91 (100.0%) | 11 (12.4%) |
| Total | 492 (79.4%) | 17 (2.7%) |
Employment Occupations by Sex in Glenns Ferry
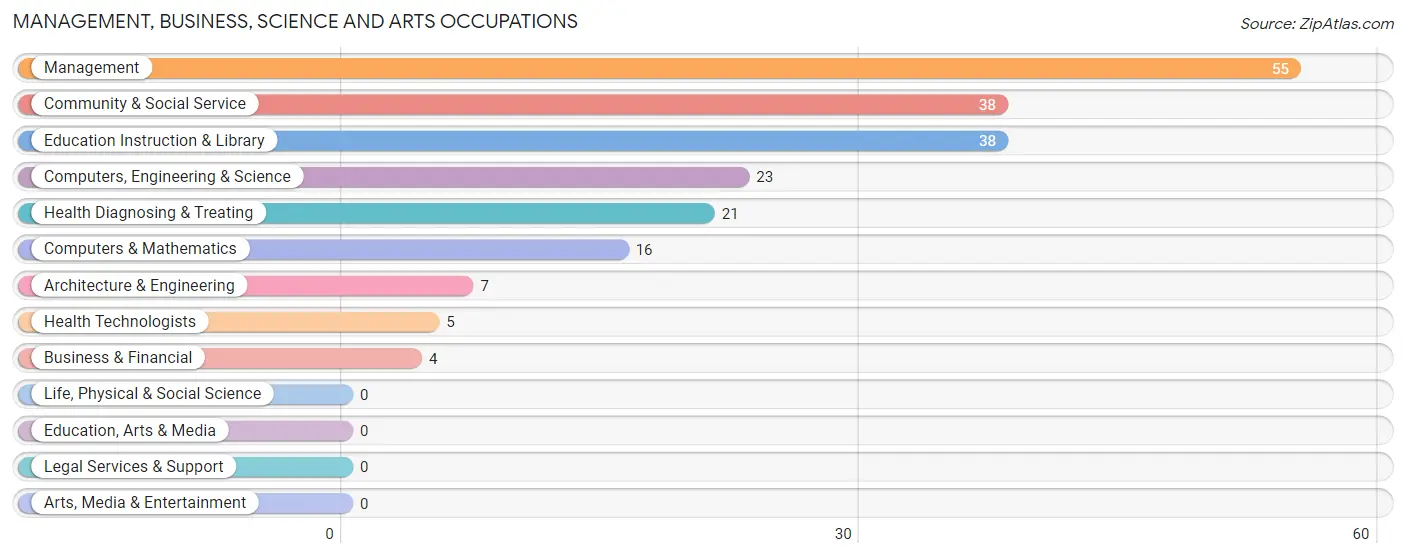
Management, Business, Science and Arts Occupations
The most common Management, Business, Science and Arts occupations in Glenns Ferry are Management (55 | 10.3%), Community & Social Service (38 | 7.1%), Education Instruction & Library (38 | 7.1%), Computers, Engineering & Science (23 | 4.3%), and Health Diagnosing & Treating (21 | 3.9%).
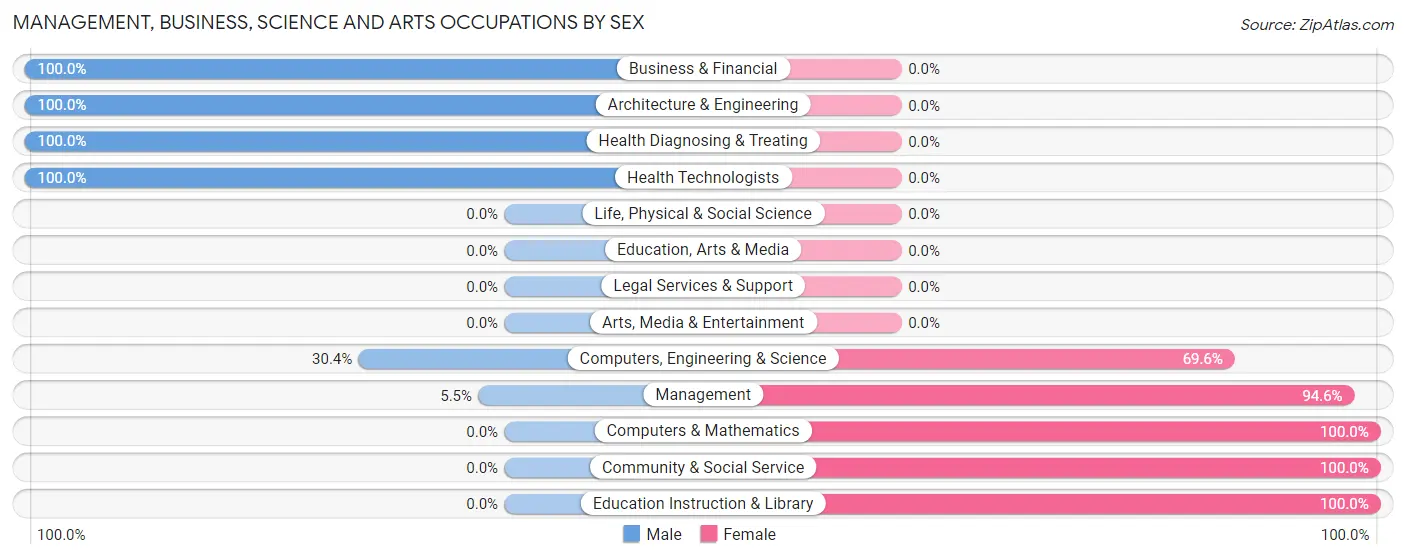
Management, Business, Science and Arts Occupations by Sex
Within the Management, Business, Science and Arts occupations in Glenns Ferry, the most male-oriented occupations are Business & Financial (100.0%), Architecture & Engineering (100.0%), and Health Diagnosing & Treating (100.0%), while the most female-oriented occupations are Computers & Mathematics (100.0%), Community & Social Service (100.0%), and Education Instruction & Library (100.0%).
| Occupation | Male | Female |
| Management | 3 (5.4%) | 52 (94.6%) |
| Business & Financial | 4 (100.0%) | 0 (0.0%) |
| Computers, Engineering & Science | 7 (30.4%) | 16 (69.6%) |
| Computers & Mathematics | 0 (0.0%) | 16 (100.0%) |
| Architecture & Engineering | 7 (100.0%) | 0 (0.0%) |
| Life, Physical & Social Science | 0 (0.0%) | 0 (0.0%) |
| Community & Social Service | 0 (0.0%) | 38 (100.0%) |
| Education, Arts & Media | 0 (0.0%) | 0 (0.0%) |
| Legal Services & Support | 0 (0.0%) | 0 (0.0%) |
| Education Instruction & Library | 0 (0.0%) | 38 (100.0%) |
| Arts, Media & Entertainment | 0 (0.0%) | 0 (0.0%) |
| Health Diagnosing & Treating | 21 (100.0%) | 0 (0.0%) |
| Health Technologists | 5 (100.0%) | 0 (0.0%) |
| Total (Category) | 35 (24.8%) | 106 (75.2%) |
| Total (Overall) | 291 (54.5%) | 243 (45.5%) |
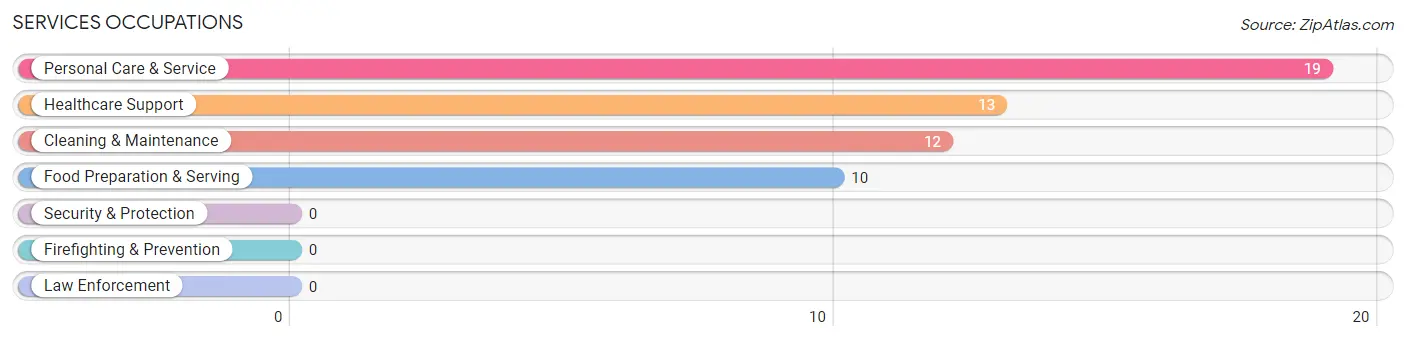
Services Occupations
The most common Services occupations in Glenns Ferry are Personal Care & Service (19 | 3.6%), Healthcare Support (13 | 2.4%), Cleaning & Maintenance (12 | 2.2%), and Food Preparation & Serving (10 | 1.9%).
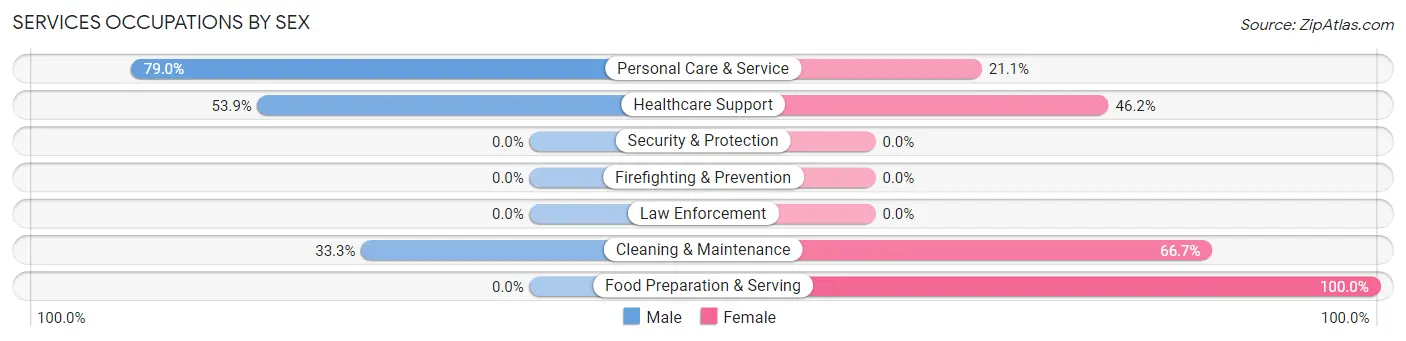
Services Occupations by Sex
Within the Services occupations in Glenns Ferry, the most male-oriented occupations are Personal Care & Service (78.9%), Healthcare Support (53.8%), and Cleaning & Maintenance (33.3%), while the most female-oriented occupations are Food Preparation & Serving (100.0%), Cleaning & Maintenance (66.7%), and Healthcare Support (46.2%).
| Occupation | Male | Female |
| Healthcare Support | 7 (53.8%) | 6 (46.2%) |
| Security & Protection | 0 (0.0%) | 0 (0.0%) |
| Firefighting & Prevention | 0 (0.0%) | 0 (0.0%) |
| Law Enforcement | 0 (0.0%) | 0 (0.0%) |
| Food Preparation & Serving | 0 (0.0%) | 10 (100.0%) |
| Cleaning & Maintenance | 4 (33.3%) | 8 (66.7%) |
| Personal Care & Service | 15 (78.9%) | 4 (21.0%) |
| Total (Category) | 26 (48.1%) | 28 (51.8%) |
| Total (Overall) | 291 (54.5%) | 243 (45.5%) |
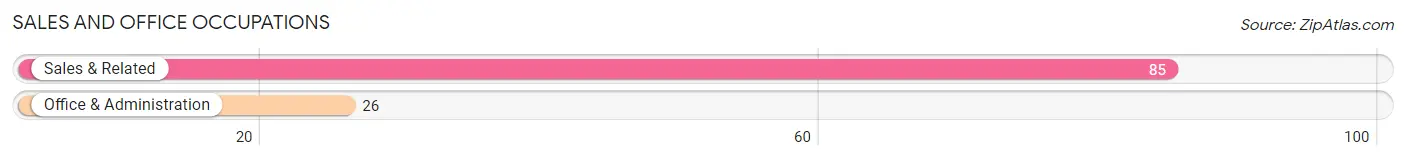
Sales and Office Occupations
The most common Sales and Office occupations in Glenns Ferry are Sales & Related (85 | 15.9%), and Office & Administration (26 | 4.9%).
Sales and Office Occupations by Sex
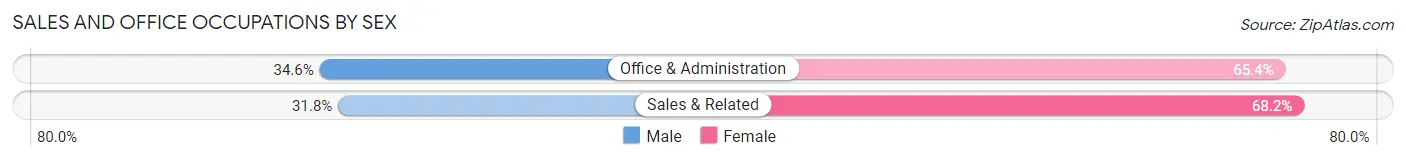
| Occupation | Male | Female |
| Sales & Related | 27 (31.8%) | 58 (68.2%) |
| Office & Administration | 9 (34.6%) | 17 (65.4%) |
| Total (Category) | 36 (32.4%) | 75 (67.6%) |
| Total (Overall) | 291 (54.5%) | 243 (45.5%) |
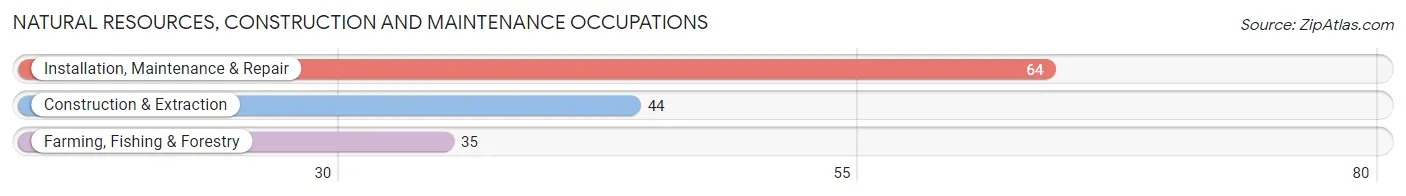
Natural Resources, Construction and Maintenance Occupations
The most common Natural Resources, Construction and Maintenance occupations in Glenns Ferry are Installation, Maintenance & Repair (64 | 12.0%), Construction & Extraction (44 | 8.2%), and Farming, Fishing & Forestry (35 | 6.6%).
Natural Resources, Construction and Maintenance Occupations by Sex
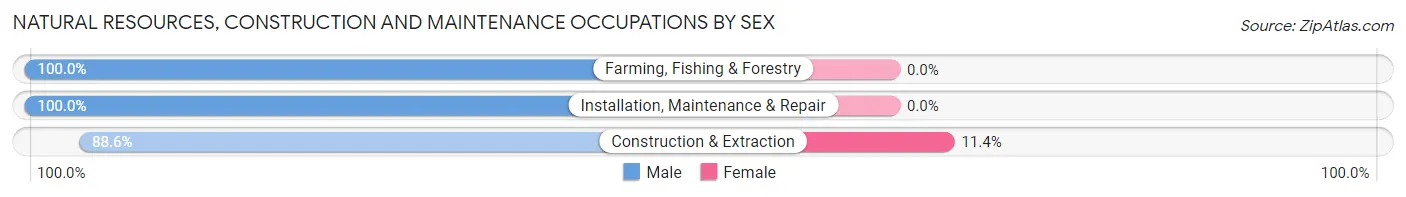
| Occupation | Male | Female |
| Farming, Fishing & Forestry | 35 (100.0%) | 0 (0.0%) |
| Construction & Extraction | 39 (88.6%) | 5 (11.4%) |
| Installation, Maintenance & Repair | 64 (100.0%) | 0 (0.0%) |
| Total (Category) | 138 (96.5%) | 5 (3.5%) |
| Total (Overall) | 291 (54.5%) | 243 (45.5%) |
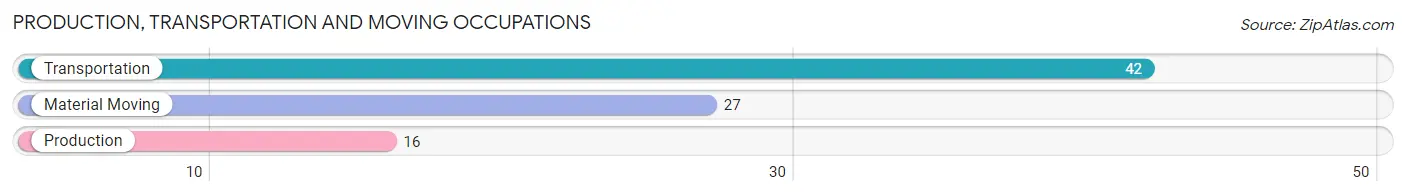
Production, Transportation and Moving Occupations
The most common Production, Transportation and Moving occupations in Glenns Ferry are Transportation (42 | 7.9%), Material Moving (27 | 5.1%), and Production (16 | 3.0%).
Production, Transportation and Moving Occupations by Sex
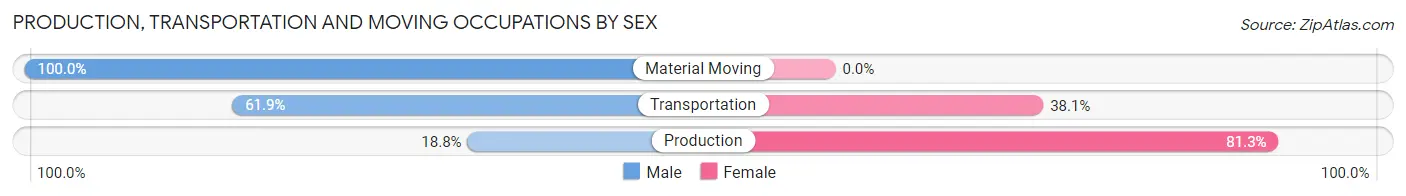
| Occupation | Male | Female |
| Production | 3 (18.8%) | 13 (81.2%) |
| Transportation | 26 (61.9%) | 16 (38.1%) |
| Material Moving | 27 (100.0%) | 0 (0.0%) |
| Total (Category) | 56 (65.9%) | 29 (34.1%) |
| Total (Overall) | 291 (54.5%) | 243 (45.5%) |
Employment Industries by Sex in Glenns Ferry
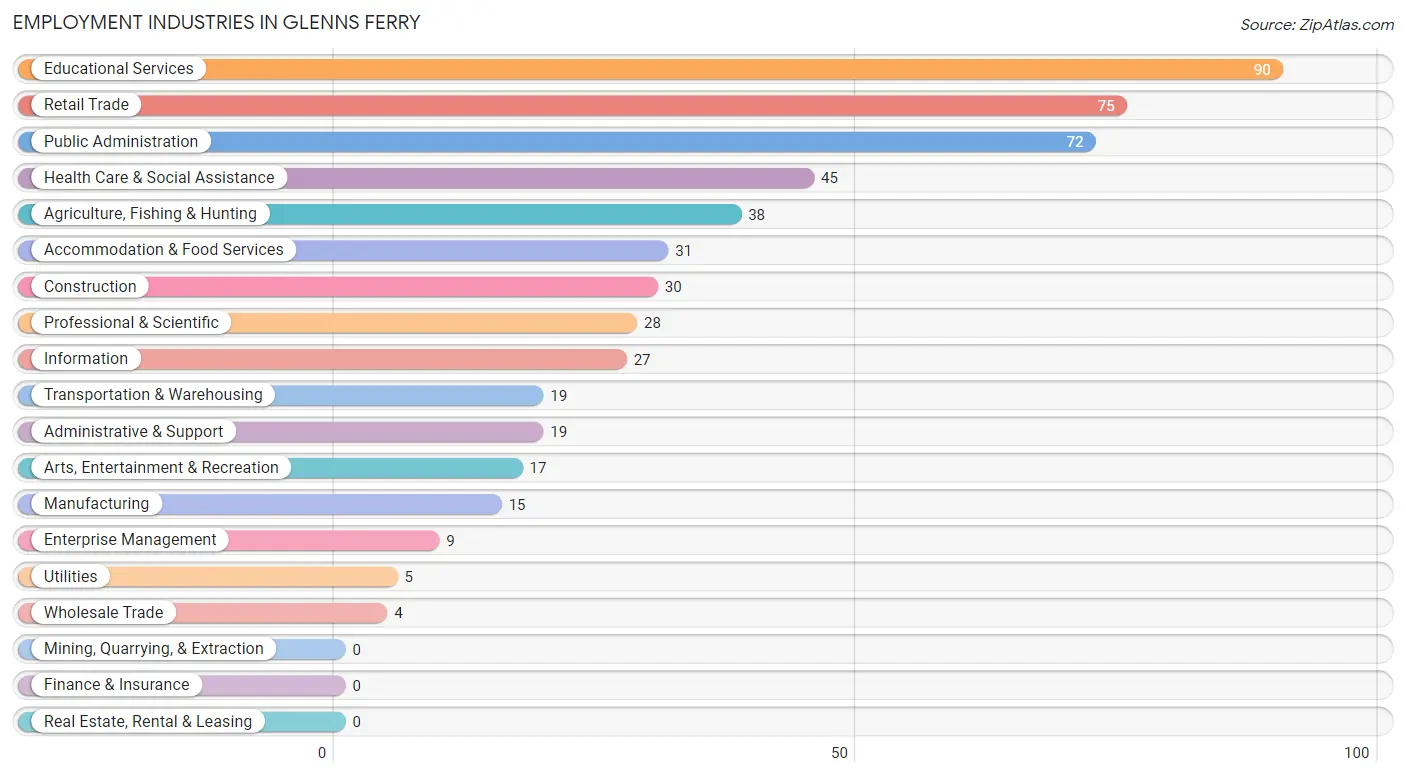
Employment Industries in Glenns Ferry
The major employment industries in Glenns Ferry include Educational Services (90 | 16.9%), Retail Trade (75 | 14.0%), Public Administration (72 | 13.5%), Health Care & Social Assistance (45 | 8.4%), and Agriculture, Fishing & Hunting (38 | 7.1%).
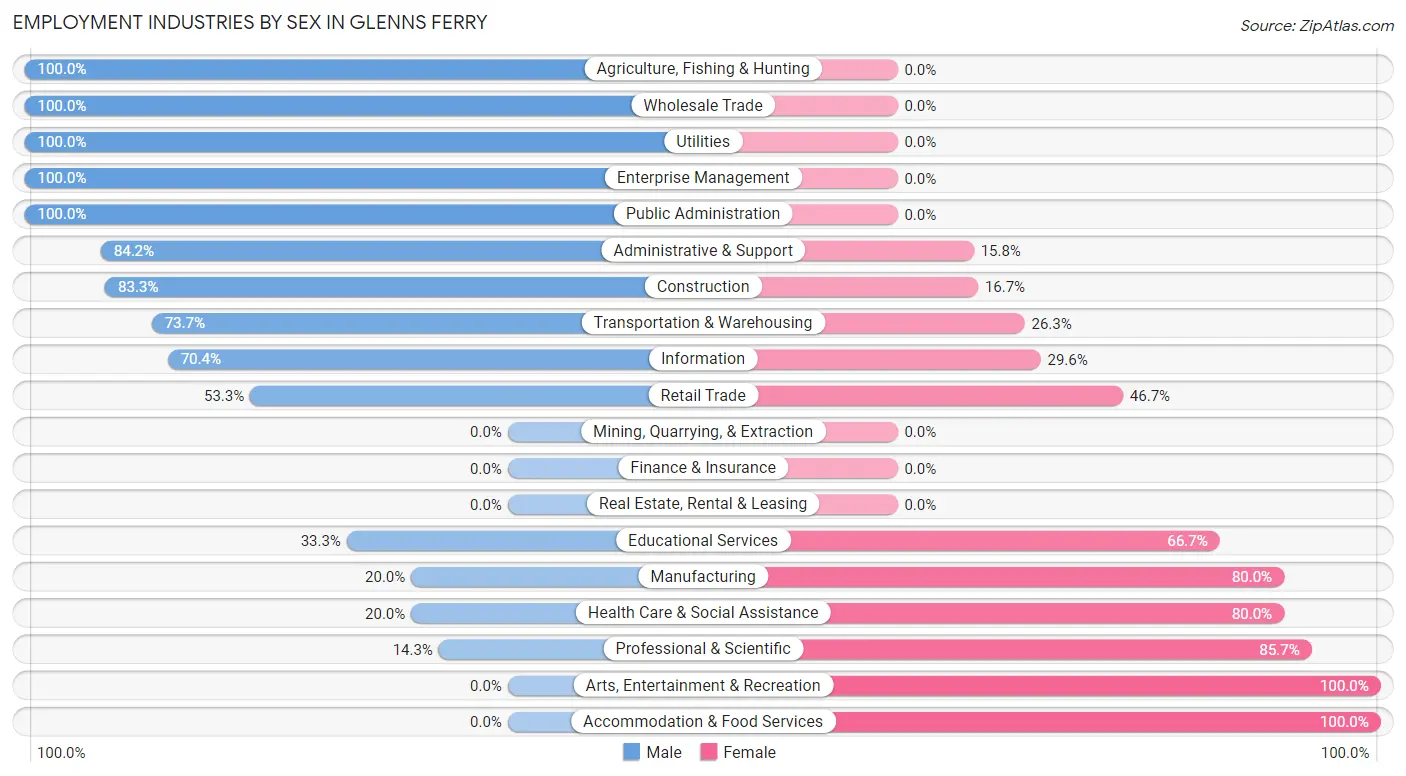
Employment Industries by Sex in Glenns Ferry
The Glenns Ferry industries that see more men than women are Agriculture, Fishing & Hunting (100.0%), Wholesale Trade (100.0%), and Utilities (100.0%), whereas the industries that tend to have a higher number of women are Arts, Entertainment & Recreation (100.0%), Accommodation & Food Services (100.0%), and Professional & Scientific (85.7%).
| Industry | Male | Female |
| Agriculture, Fishing & Hunting | 38 (100.0%) | 0 (0.0%) |
| Mining, Quarrying, & Extraction | 0 (0.0%) | 0 (0.0%) |
| Construction | 25 (83.3%) | 5 (16.7%) |
| Manufacturing | 3 (20.0%) | 12 (80.0%) |
| Wholesale Trade | 4 (100.0%) | 0 (0.0%) |
| Retail Trade | 40 (53.3%) | 35 (46.7%) |
| Transportation & Warehousing | 14 (73.7%) | 5 (26.3%) |
| Utilities | 5 (100.0%) | 0 (0.0%) |
| Information | 19 (70.4%) | 8 (29.6%) |
| Finance & Insurance | 0 (0.0%) | 0 (0.0%) |
| Real Estate, Rental & Leasing | 0 (0.0%) | 0 (0.0%) |
| Professional & Scientific | 4 (14.3%) | 24 (85.7%) |
| Enterprise Management | 9 (100.0%) | 0 (0.0%) |
| Administrative & Support | 16 (84.2%) | 3 (15.8%) |
| Educational Services | 30 (33.3%) | 60 (66.7%) |
| Health Care & Social Assistance | 9 (20.0%) | 36 (80.0%) |
| Arts, Entertainment & Recreation | 0 (0.0%) | 17 (100.0%) |
| Accommodation & Food Services | 0 (0.0%) | 31 (100.0%) |
| Public Administration | 72 (100.0%) | 0 (0.0%) |
| Total | 291 (54.5%) | 243 (45.5%) |
Education in Glenns Ferry
School Enrollment in Glenns Ferry
The most common levels of schooling among the 360 students in Glenns Ferry are college / undergraduate (105 | 29.2%), middle school (98 | 27.2%), and elementary school (72 | 20.0%).
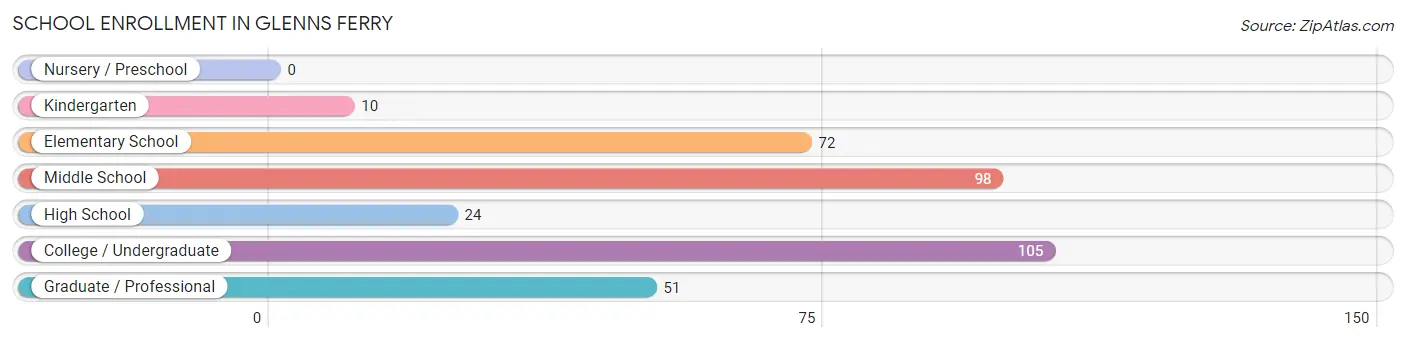
| School Level | # Students | % Students |
| Nursery / Preschool | 0 | 0.0% |
| Kindergarten | 10 | 2.8% |
| Elementary School | 72 | 20.0% |
| Middle School | 98 | 27.2% |
| High School | 24 | 6.7% |
| College / Undergraduate | 105 | 29.2% |
| Graduate / Professional | 51 | 14.2% |
| Total | 360 | 100.0% |
School Enrollment by Age by Funding Source in Glenns Ferry
Out of a total of 360 students who are enrolled in schools in Glenns Ferry, 45 (12.5%) attend a private institution, while the remaining 315 (87.5%) are enrolled in public schools. The age group of 35 years and over has the highest likelihood of being enrolled in private schools, with 15 (100.0% in the age bracket) enrolled. Conversely, the age group of 10 to 14 year olds has the lowest likelihood of being enrolled in a private school, with 98 (100.0% in the age bracket) attending a public institution.
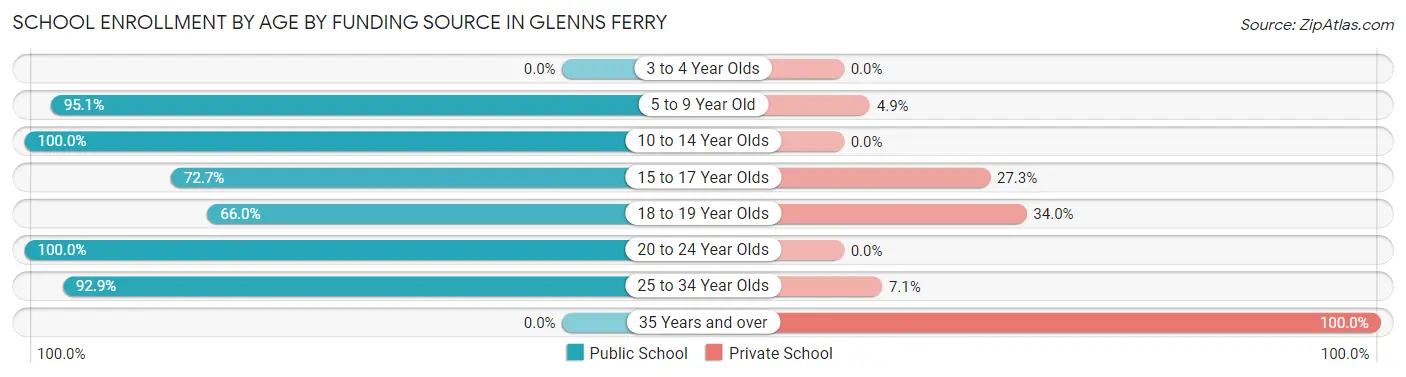
| Age Bracket | Public School | Private School |
| 3 to 4 Year Olds | 0 (0.0%) | 0 (0.0%) |
| 5 to 9 Year Old | 78 (95.1%) | 4 (4.9%) |
| 10 to 14 Year Olds | 98 (100.0%) | 0 (0.0%) |
| 15 to 17 Year Olds | 16 (72.7%) | 6 (27.3%) |
| 18 to 19 Year Olds | 31 (66.0%) | 16 (34.0%) |
| 20 to 24 Year Olds | 40 (100.0%) | 0 (0.0%) |
| 25 to 34 Year Olds | 52 (92.9%) | 4 (7.1%) |
| 35 Years and over | 0 (0.0%) | 15 (100.0%) |
| Total | 315 (87.5%) | 45 (12.5%) |
Educational Attainment by Field of Study in Glenns Ferry
Education (45 | 39.8%), business (31 | 27.4%), computers & mathematics (17 | 15.0%), bio, nature & agricultural (11 | 9.7%), and social sciences (5 | 4.4%) are the most common fields of study among 113 individuals in Glenns Ferry who have obtained a bachelor's degree or higher.
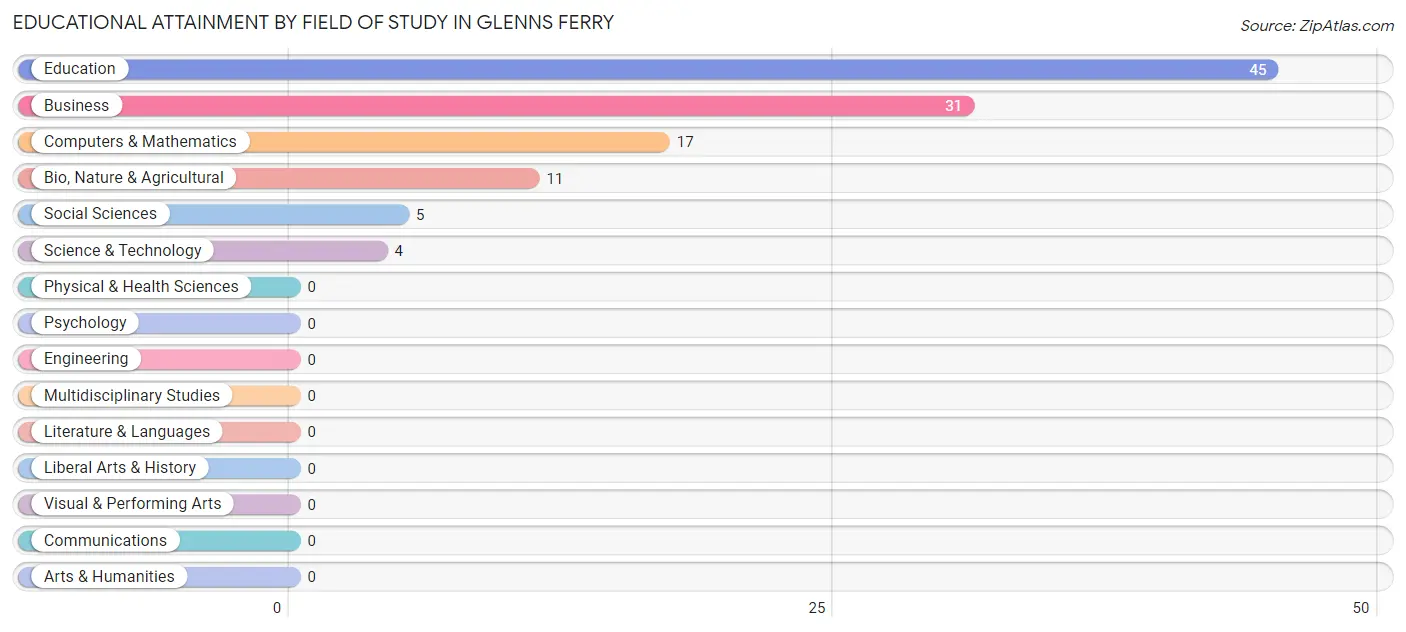
| Field of Study | # Graduates | % Graduates |
| Computers & Mathematics | 17 | 15.0% |
| Bio, Nature & Agricultural | 11 | 9.7% |
| Physical & Health Sciences | 0 | 0.0% |
| Psychology | 0 | 0.0% |
| Social Sciences | 5 | 4.4% |
| Engineering | 0 | 0.0% |
| Multidisciplinary Studies | 0 | 0.0% |
| Science & Technology | 4 | 3.5% |
| Business | 31 | 27.4% |
| Education | 45 | 39.8% |
| Literature & Languages | 0 | 0.0% |
| Liberal Arts & History | 0 | 0.0% |
| Visual & Performing Arts | 0 | 0.0% |
| Communications | 0 | 0.0% |
| Arts & Humanities | 0 | 0.0% |
| Total | 113 | 100.0% |
Transportation & Commute in Glenns Ferry
Vehicle Availability by Sex in Glenns Ferry
The most prevalent vehicle ownership categories in Glenns Ferry are males with 2 vehicles (155, accounting for 57.4%) and females with 2 vehicles (106, making up 77.1%).
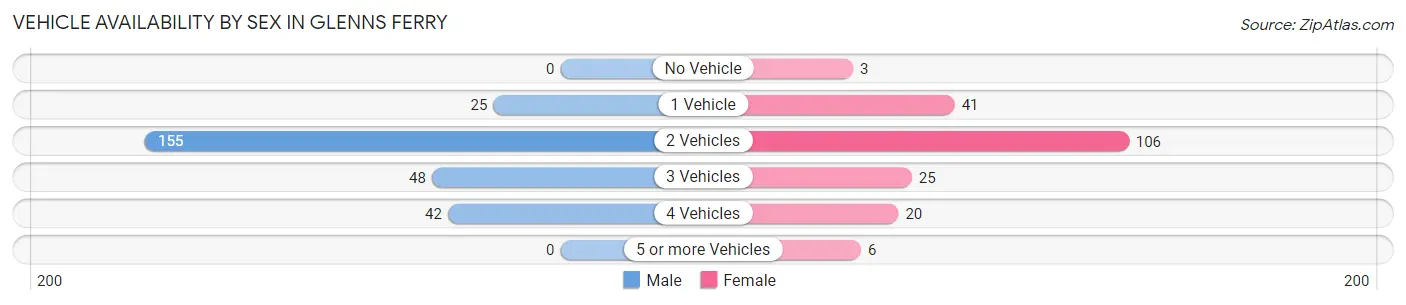
| Vehicles Available | Male | Female |
| No Vehicle | 0 (0.0%) | 3 (1.5%) |
| 1 Vehicle | 25 (9.3%) | 41 (20.4%) |
| 2 Vehicles | 155 (57.4%) | 106 (52.7%) |
| 3 Vehicles | 48 (17.8%) | 25 (12.4%) |
| 4 Vehicles | 42 (15.6%) | 20 (10.0%) |
| 5 or more Vehicles | 0 (0.0%) | 6 (3.0%) |
| Total | 270 (100.0%) | 201 (100.0%) |
Commute Time in Glenns Ferry
The most frequently occuring commute durations in Glenns Ferry are 5 to 9 minutes (163 commuters, 32.7%), 10 to 14 minutes (116 commuters, 23.3%), and 60 to 89 minutes (64 commuters, 12.8%).
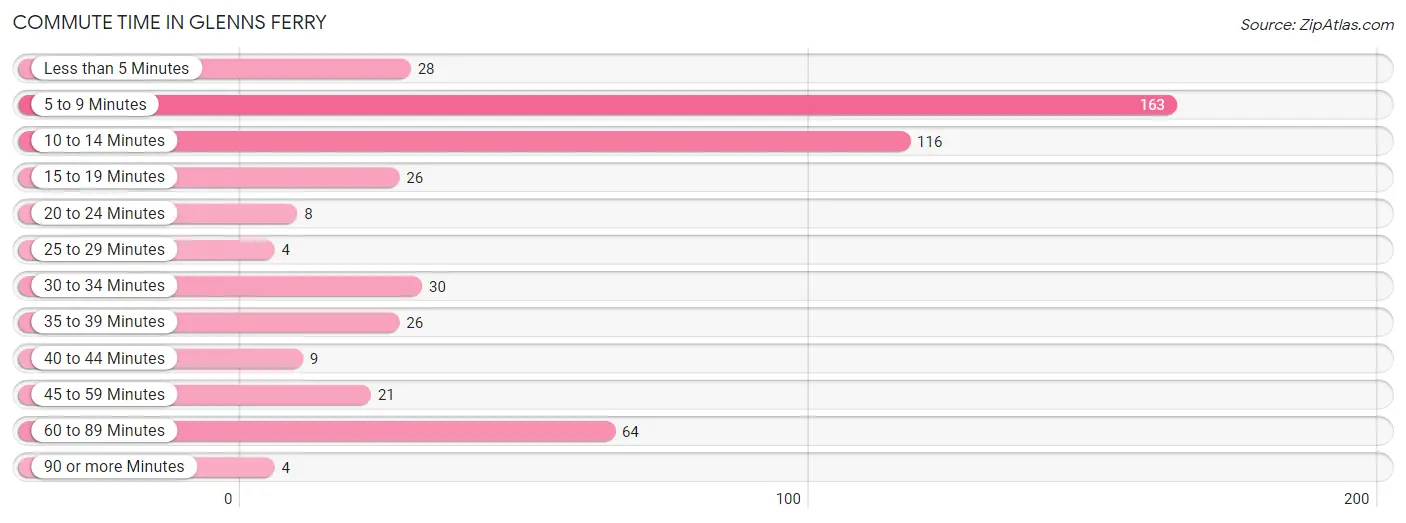
| Commute Time | # Commuters | % Commuters |
| Less than 5 Minutes | 28 | 5.6% |
| 5 to 9 Minutes | 163 | 32.7% |
| 10 to 14 Minutes | 116 | 23.3% |
| 15 to 19 Minutes | 26 | 5.2% |
| 20 to 24 Minutes | 8 | 1.6% |
| 25 to 29 Minutes | 4 | 0.8% |
| 30 to 34 Minutes | 30 | 6.0% |
| 35 to 39 Minutes | 26 | 5.2% |
| 40 to 44 Minutes | 9 | 1.8% |
| 45 to 59 Minutes | 21 | 4.2% |
| 60 to 89 Minutes | 64 | 12.8% |
| 90 or more Minutes | 4 | 0.8% |
Commute Time by Sex in Glenns Ferry
The most common commute times in Glenns Ferry are 10 to 14 minutes (109 commuters, 39.2%) for males and 5 to 9 minutes (102 commuters, 46.2%) for females.
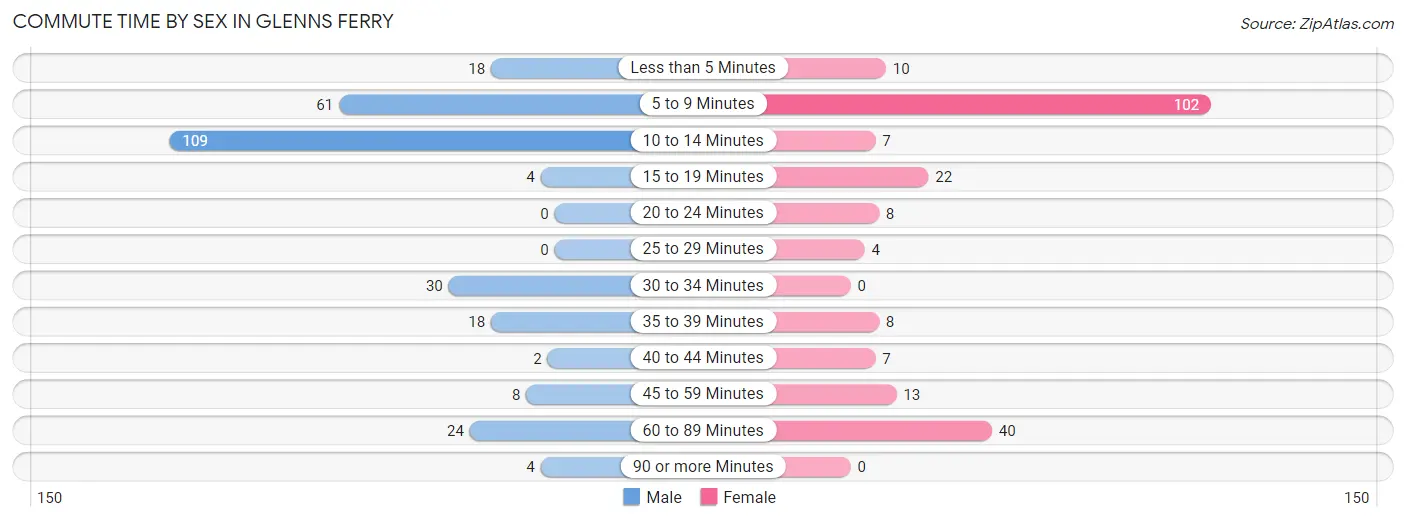
| Commute Time | Male | Female |
| Less than 5 Minutes | 18 (6.5%) | 10 (4.5%) |
| 5 to 9 Minutes | 61 (21.9%) | 102 (46.2%) |
| 10 to 14 Minutes | 109 (39.2%) | 7 (3.2%) |
| 15 to 19 Minutes | 4 (1.4%) | 22 (10.0%) |
| 20 to 24 Minutes | 0 (0.0%) | 8 (3.6%) |
| 25 to 29 Minutes | 0 (0.0%) | 4 (1.8%) |
| 30 to 34 Minutes | 30 (10.8%) | 0 (0.0%) |
| 35 to 39 Minutes | 18 (6.5%) | 8 (3.6%) |
| 40 to 44 Minutes | 2 (0.7%) | 7 (3.2%) |
| 45 to 59 Minutes | 8 (2.9%) | 13 (5.9%) |
| 60 to 89 Minutes | 24 (8.6%) | 40 (18.1%) |
| 90 or more Minutes | 4 (1.4%) | 0 (0.0%) |
Time of Departure to Work by Sex in Glenns Ferry
The most frequent times of departure to work in Glenns Ferry are 6:30 AM to 6:59 AM (60, 21.6%) for males and 9:00 AM to 9:59 AM (31, 14.0%) for females.
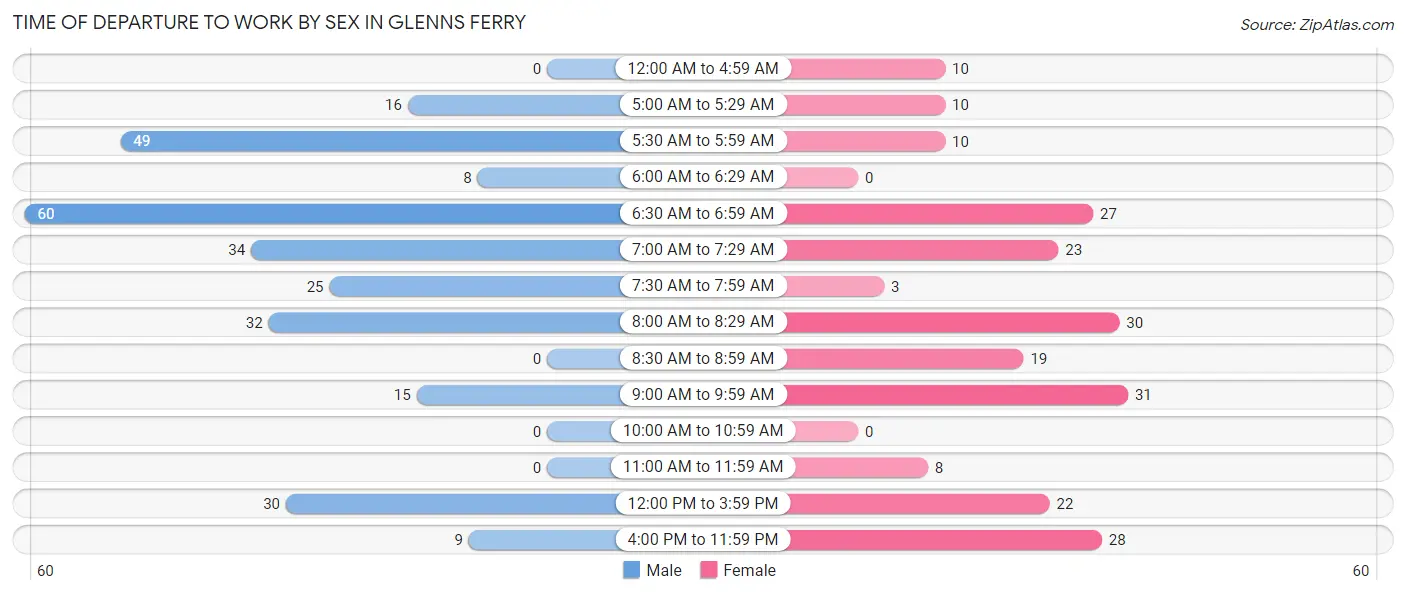
| Time of Departure | Male | Female |
| 12:00 AM to 4:59 AM | 0 (0.0%) | 10 (4.5%) |
| 5:00 AM to 5:29 AM | 16 (5.8%) | 10 (4.5%) |
| 5:30 AM to 5:59 AM | 49 (17.6%) | 10 (4.5%) |
| 6:00 AM to 6:29 AM | 8 (2.9%) | 0 (0.0%) |
| 6:30 AM to 6:59 AM | 60 (21.6%) | 27 (12.2%) |
| 7:00 AM to 7:29 AM | 34 (12.2%) | 23 (10.4%) |
| 7:30 AM to 7:59 AM | 25 (9.0%) | 3 (1.4%) |
| 8:00 AM to 8:29 AM | 32 (11.5%) | 30 (13.6%) |
| 8:30 AM to 8:59 AM | 0 (0.0%) | 19 (8.6%) |
| 9:00 AM to 9:59 AM | 15 (5.4%) | 31 (14.0%) |
| 10:00 AM to 10:59 AM | 0 (0.0%) | 0 (0.0%) |
| 11:00 AM to 11:59 AM | 0 (0.0%) | 8 (3.6%) |
| 12:00 PM to 3:59 PM | 30 (10.8%) | 22 (10.0%) |
| 4:00 PM to 11:59 PM | 9 (3.2%) | 28 (12.7%) |
| Total | 278 (100.0%) | 221 (100.0%) |
Housing Occupancy in Glenns Ferry
Occupancy by Ownership in Glenns Ferry
Of the total 492 dwellings in Glenns Ferry, owner-occupied units account for 316 (64.2%), while renter-occupied units make up 176 (35.8%).
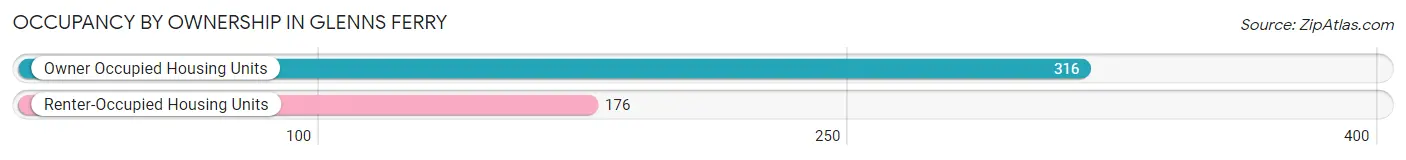
| Occupancy | # Housing Units | % Housing Units |
| Owner Occupied Housing Units | 316 | 64.2% |
| Renter-Occupied Housing Units | 176 | 35.8% |
| Total Occupied Housing Units | 492 | 100.0% |
Occupancy by Household Size in Glenns Ferry
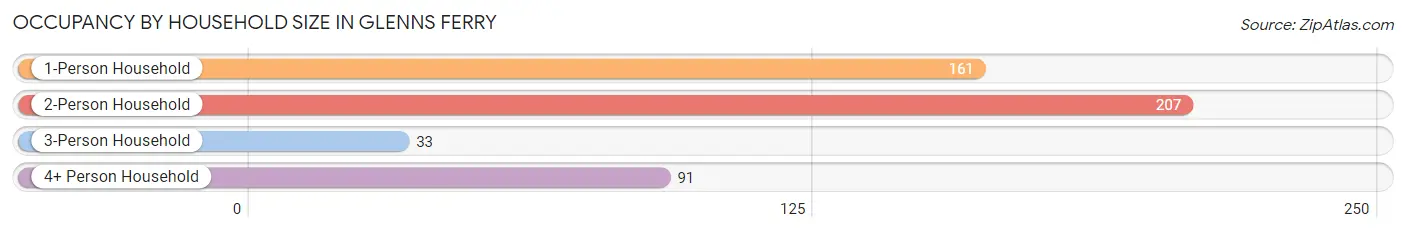
| Household Size | # Housing Units | % Housing Units |
| 1-Person Household | 161 | 32.7% |
| 2-Person Household | 207 | 42.1% |
| 3-Person Household | 33 | 6.7% |
| 4+ Person Household | 91 | 18.5% |
| Total Housing Units | 492 | 100.0% |
Occupancy by Ownership by Household Size in Glenns Ferry
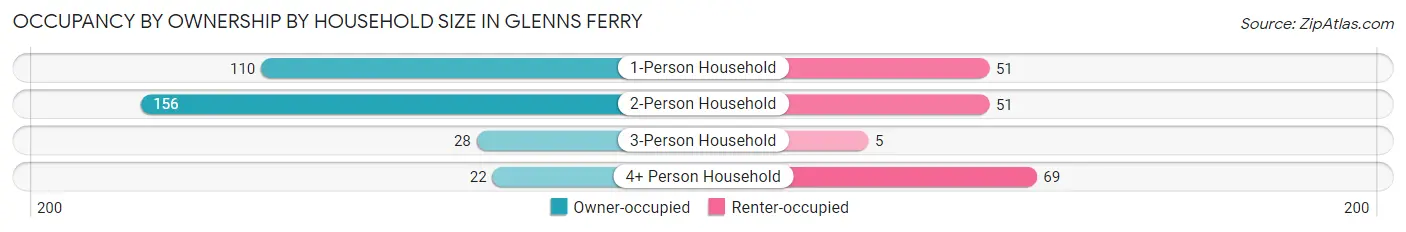
| Household Size | Owner-occupied | Renter-occupied |
| 1-Person Household | 110 (68.3%) | 51 (31.7%) |
| 2-Person Household | 156 (75.4%) | 51 (24.6%) |
| 3-Person Household | 28 (84.9%) | 5 (15.1%) |
| 4+ Person Household | 22 (24.2%) | 69 (75.8%) |
| Total Housing Units | 316 (64.2%) | 176 (35.8%) |
Occupancy by Educational Attainment in Glenns Ferry
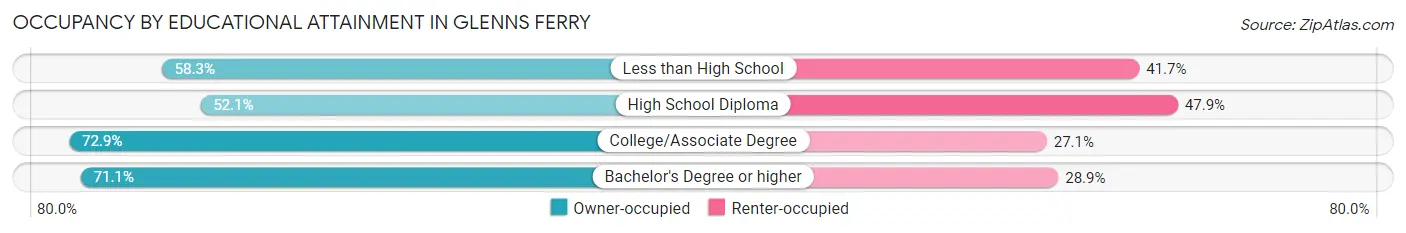
| Household Size | Owner-occupied | Renter-occupied |
| Less than High School | 67 (58.3%) | 48 (41.7%) |
| High School Diploma | 61 (52.1%) | 56 (47.9%) |
| College/Associate Degree | 124 (72.9%) | 46 (27.1%) |
| Bachelor's Degree or higher | 64 (71.1%) | 26 (28.9%) |
Occupancy by Age of Householder in Glenns Ferry
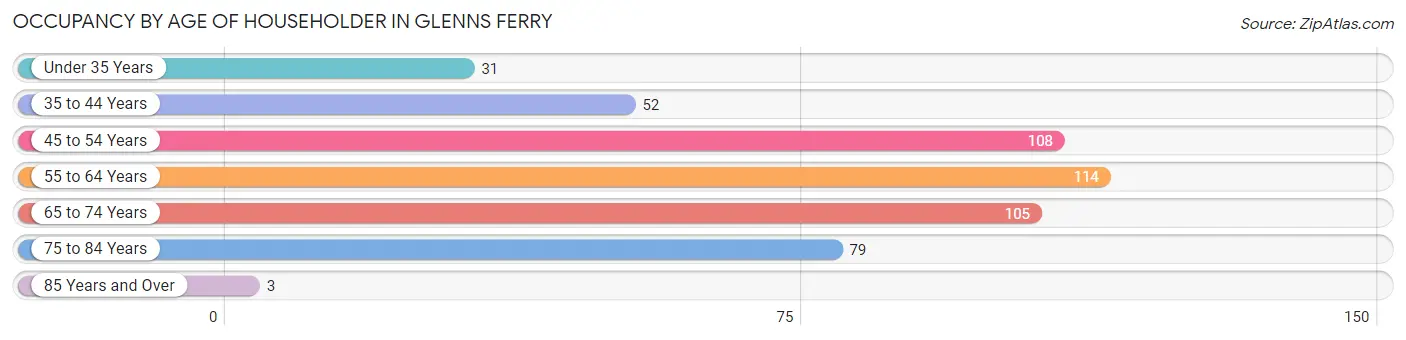
| Age Bracket | # Households | % Households |
| Under 35 Years | 31 | 6.3% |
| 35 to 44 Years | 52 | 10.6% |
| 45 to 54 Years | 108 | 22.0% |
| 55 to 64 Years | 114 | 23.2% |
| 65 to 74 Years | 105 | 21.3% |
| 75 to 84 Years | 79 | 16.1% |
| 85 Years and Over | 3 | 0.6% |
| Total | 492 | 100.0% |
Housing Finances in Glenns Ferry
Median Income by Occupancy in Glenns Ferry
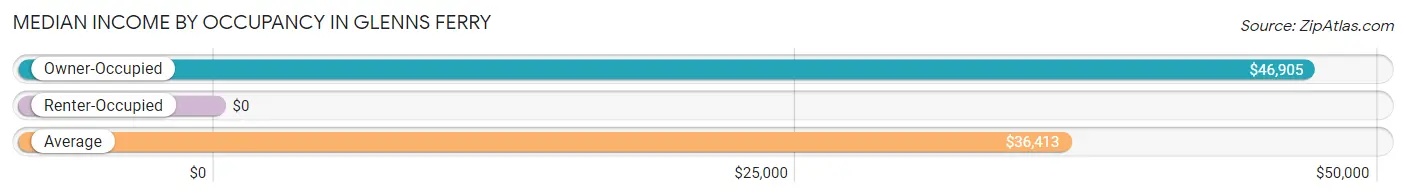
| Occupancy Type | # Households | Median Income |
| Owner-Occupied | 316 (64.2%) | $46,905 |
| Renter-Occupied | 176 (35.8%) | $0 |
| Average | 492 (100.0%) | $36,413 |
Occupancy by Householder Income Bracket in Glenns Ferry
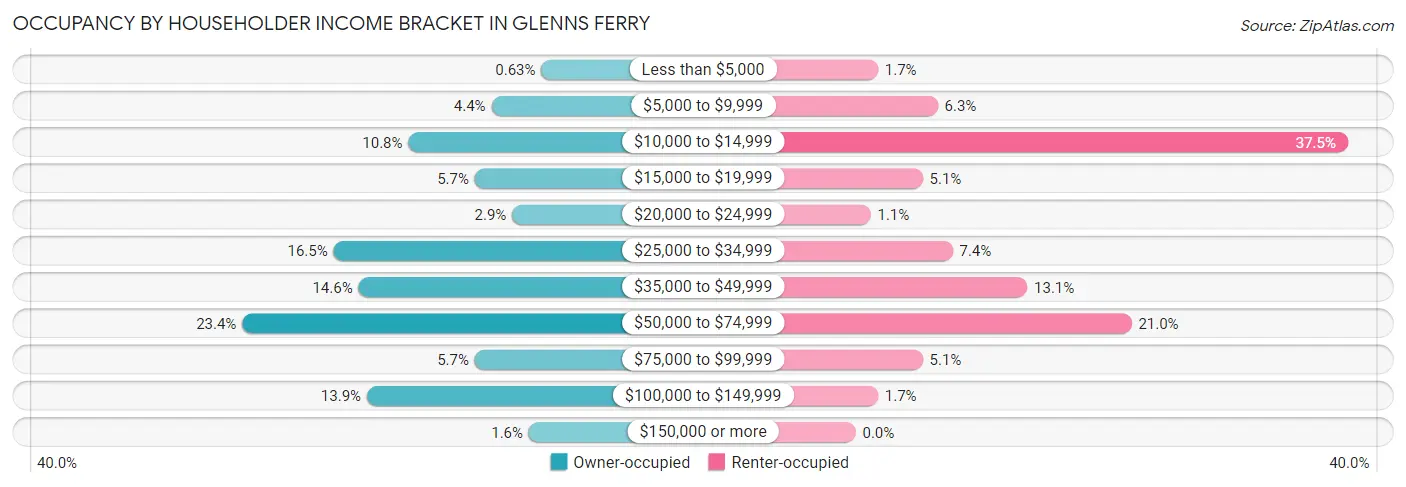
| Income Bracket | Owner-occupied | Renter-occupied |
| Less than $5,000 | 2 (0.6%) | 3 (1.7%) |
| $5,000 to $9,999 | 14 (4.4%) | 11 (6.2%) |
| $10,000 to $14,999 | 34 (10.8%) | 66 (37.5%) |
| $15,000 to $19,999 | 18 (5.7%) | 9 (5.1%) |
| $20,000 to $24,999 | 9 (2.9%) | 2 (1.1%) |
| $25,000 to $34,999 | 52 (16.5%) | 13 (7.4%) |
| $35,000 to $49,999 | 46 (14.6%) | 23 (13.1%) |
| $50,000 to $74,999 | 74 (23.4%) | 37 (21.0%) |
| $75,000 to $99,999 | 18 (5.7%) | 9 (5.1%) |
| $100,000 to $149,999 | 44 (13.9%) | 3 (1.7%) |
| $150,000 or more | 5 (1.6%) | 0 (0.0%) |
| Total | 316 (100.0%) | 176 (100.0%) |
Monthly Housing Cost Tiers in Glenns Ferry
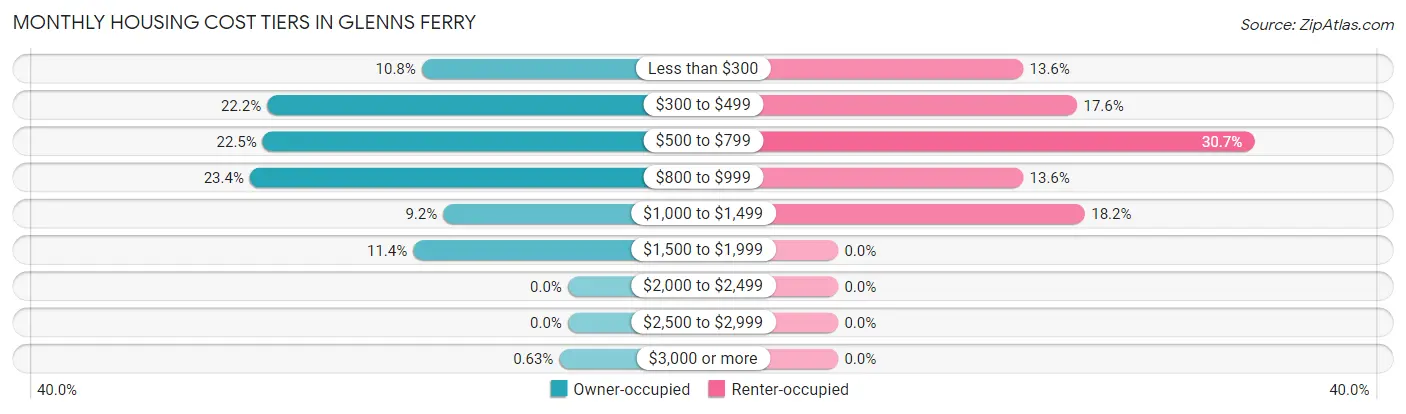
| Monthly Cost | Owner-occupied | Renter-occupied |
| Less than $300 | 34 (10.8%) | 24 (13.6%) |
| $300 to $499 | 70 (22.2%) | 31 (17.6%) |
| $500 to $799 | 71 (22.5%) | 54 (30.7%) |
| $800 to $999 | 74 (23.4%) | 24 (13.6%) |
| $1,000 to $1,499 | 29 (9.2%) | 32 (18.2%) |
| $1,500 to $1,999 | 36 (11.4%) | 0 (0.0%) |
| $2,000 to $2,499 | 0 (0.0%) | 0 (0.0%) |
| $2,500 to $2,999 | 0 (0.0%) | 0 (0.0%) |
| $3,000 or more | 2 (0.6%) | 0 (0.0%) |
| Total | 316 (100.0%) | 176 (100.0%) |
Physical Housing Characteristics in Glenns Ferry
Housing Structures in Glenns Ferry
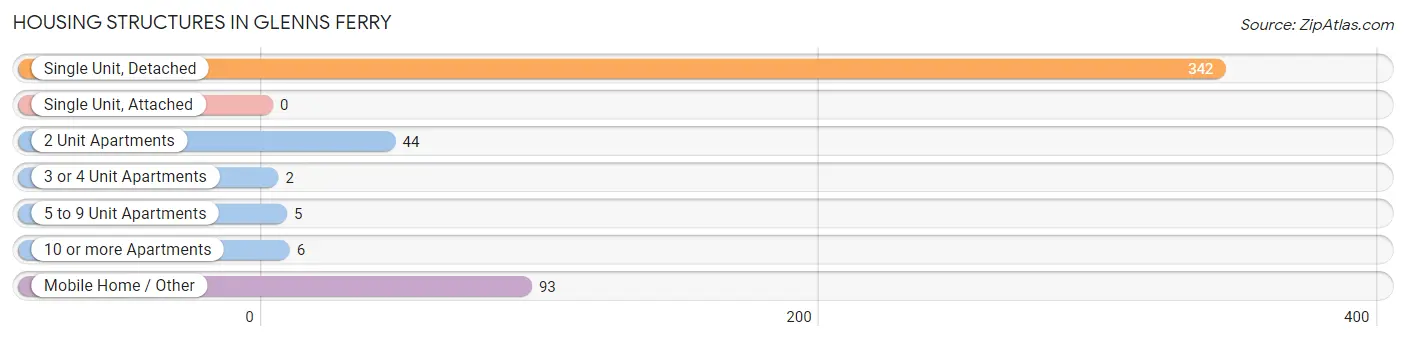
| Structure Type | # Housing Units | % Housing Units |
| Single Unit, Detached | 342 | 69.5% |
| Single Unit, Attached | 0 | 0.0% |
| 2 Unit Apartments | 44 | 8.9% |
| 3 or 4 Unit Apartments | 2 | 0.4% |
| 5 to 9 Unit Apartments | 5 | 1.0% |
| 10 or more Apartments | 6 | 1.2% |
| Mobile Home / Other | 93 | 18.9% |
| Total | 492 | 100.0% |
Housing Structures by Occupancy in Glenns Ferry
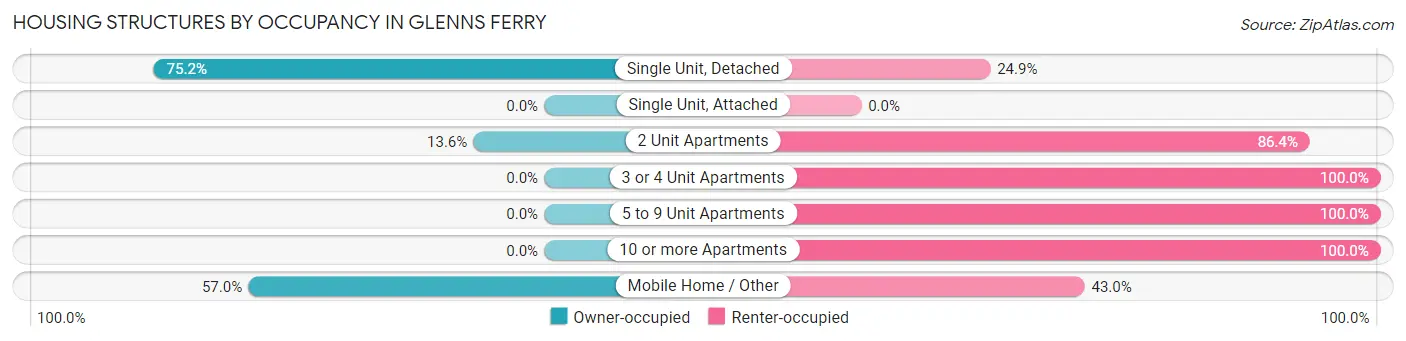
| Structure Type | Owner-occupied | Renter-occupied |
| Single Unit, Detached | 257 (75.1%) | 85 (24.8%) |
| Single Unit, Attached | 0 (0.0%) | 0 (0.0%) |
| 2 Unit Apartments | 6 (13.6%) | 38 (86.4%) |
| 3 or 4 Unit Apartments | 0 (0.0%) | 2 (100.0%) |
| 5 to 9 Unit Apartments | 0 (0.0%) | 5 (100.0%) |
| 10 or more Apartments | 0 (0.0%) | 6 (100.0%) |
| Mobile Home / Other | 53 (57.0%) | 40 (43.0%) |
| Total | 316 (64.2%) | 176 (35.8%) |
Housing Structures by Number of Rooms in Glenns Ferry
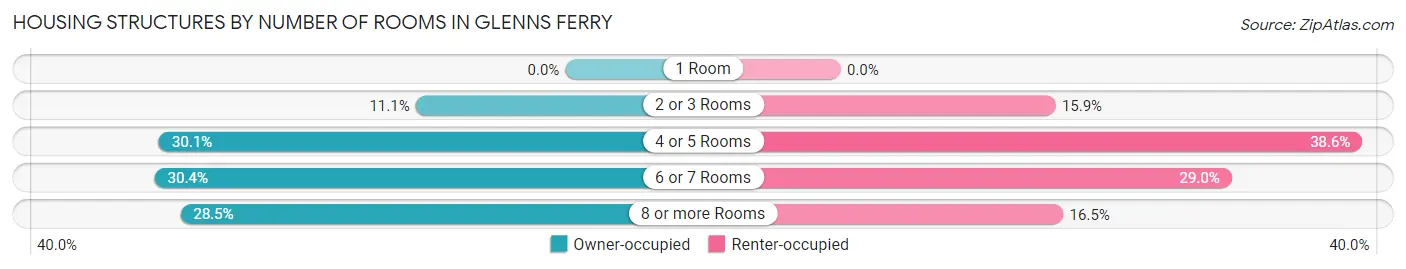
| Number of Rooms | Owner-occupied | Renter-occupied |
| 1 Room | 0 (0.0%) | 0 (0.0%) |
| 2 or 3 Rooms | 35 (11.1%) | 28 (15.9%) |
| 4 or 5 Rooms | 95 (30.1%) | 68 (38.6%) |
| 6 or 7 Rooms | 96 (30.4%) | 51 (29.0%) |
| 8 or more Rooms | 90 (28.5%) | 29 (16.5%) |
| Total | 316 (100.0%) | 176 (100.0%) |
Housing Structure by Heating Type in Glenns Ferry
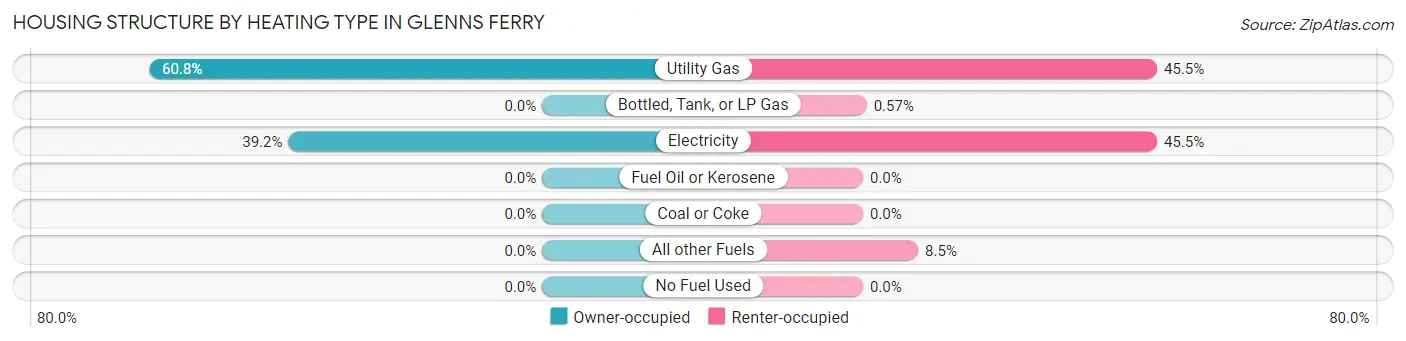
| Heating Type | Owner-occupied | Renter-occupied |
| Utility Gas | 192 (60.8%) | 80 (45.5%) |
| Bottled, Tank, or LP Gas | 0 (0.0%) | 1 (0.6%) |
| Electricity | 124 (39.2%) | 80 (45.5%) |
| Fuel Oil or Kerosene | 0 (0.0%) | 0 (0.0%) |
| Coal or Coke | 0 (0.0%) | 0 (0.0%) |
| All other Fuels | 0 (0.0%) | 15 (8.5%) |
| No Fuel Used | 0 (0.0%) | 0 (0.0%) |
| Total | 316 (100.0%) | 176 (100.0%) |
Household Vehicle Usage in Glenns Ferry
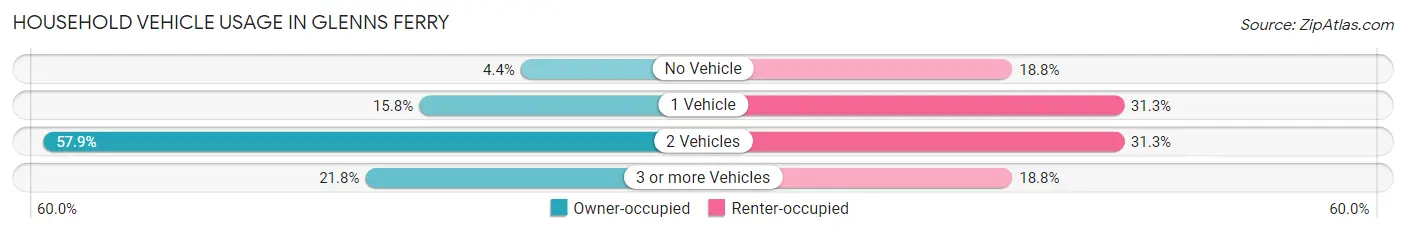
| Vehicles per Household | Owner-occupied | Renter-occupied |
| No Vehicle | 14 (4.4%) | 33 (18.8%) |
| 1 Vehicle | 50 (15.8%) | 55 (31.2%) |
| 2 Vehicles | 183 (57.9%) | 55 (31.2%) |
| 3 or more Vehicles | 69 (21.8%) | 33 (18.8%) |
| Total | 316 (100.0%) | 176 (100.0%) |
Real Estate & Mortgages in Glenns Ferry
Real Estate and Mortgage Overview in Glenns Ferry
| Characteristic | Without Mortgage | With Mortgage |
| Housing Units | 127 | 189 |
| Median Property Value | $93,400 | $154,800 |
| Median Household Income | $25,703 | $5 |
| Monthly Housing Costs | $327 | $2 |
| Real Estate Taxes | $973 | $3 |
Property Value by Mortgage Status in Glenns Ferry
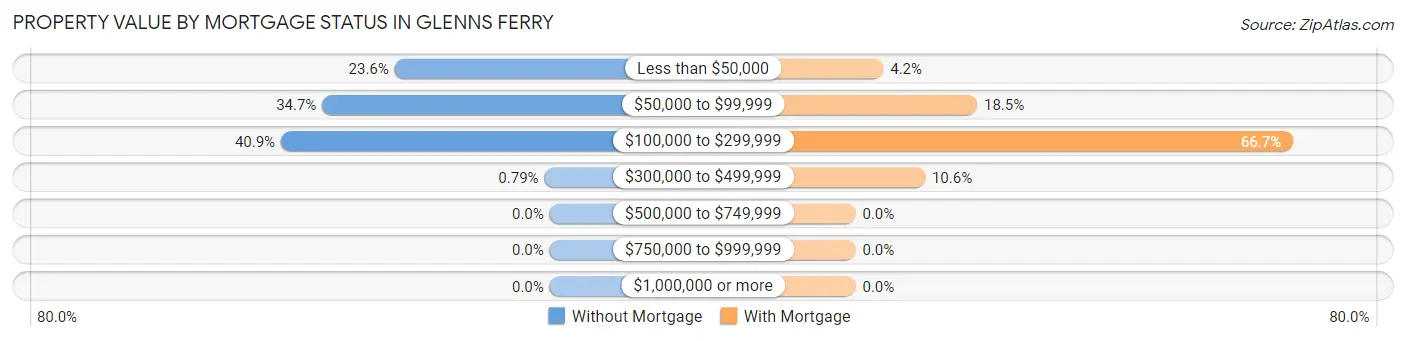
| Property Value | Without Mortgage | With Mortgage |
| Less than $50,000 | 30 (23.6%) | 8 (4.2%) |
| $50,000 to $99,999 | 44 (34.6%) | 35 (18.5%) |
| $100,000 to $299,999 | 52 (40.9%) | 126 (66.7%) |
| $300,000 to $499,999 | 1 (0.8%) | 20 (10.6%) |
| $500,000 to $749,999 | 0 (0.0%) | 0 (0.0%) |
| $750,000 to $999,999 | 0 (0.0%) | 0 (0.0%) |
| $1,000,000 or more | 0 (0.0%) | 0 (0.0%) |
| Total | 127 (100.0%) | 189 (100.0%) |
Household Income by Mortgage Status in Glenns Ferry
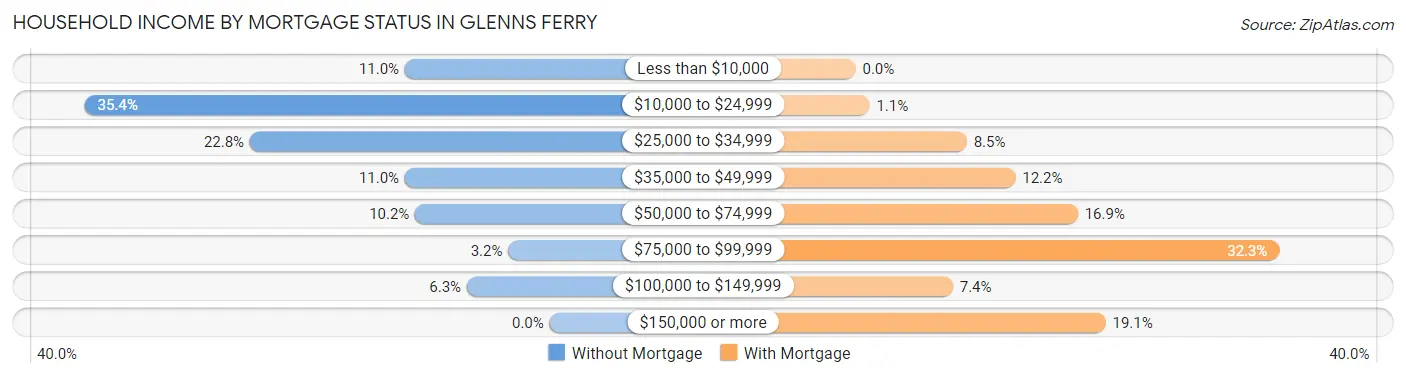
| Household Income | Without Mortgage | With Mortgage |
| Less than $10,000 | 14 (11.0%) | 0 (0.0%) |
| $10,000 to $24,999 | 45 (35.4%) | 2 (1.1%) |
| $25,000 to $34,999 | 29 (22.8%) | 16 (8.5%) |
| $35,000 to $49,999 | 14 (11.0%) | 23 (12.2%) |
| $50,000 to $74,999 | 13 (10.2%) | 32 (16.9%) |
| $75,000 to $99,999 | 4 (3.2%) | 61 (32.3%) |
| $100,000 to $149,999 | 8 (6.3%) | 14 (7.4%) |
| $150,000 or more | 0 (0.0%) | 36 (19.1%) |
| Total | 127 (100.0%) | 189 (100.0%) |
Property Value to Household Income Ratio in Glenns Ferry
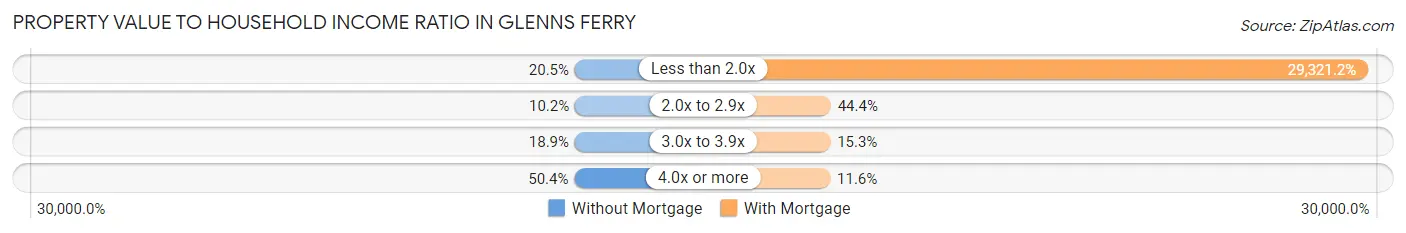
| Value-to-Income Ratio | Without Mortgage | With Mortgage |
| Less than 2.0x | 26 (20.5%) | 55,417 (29,321.2%) |
| 2.0x to 2.9x | 13 (10.2%) | 84 (44.4%) |
| 3.0x to 3.9x | 24 (18.9%) | 29 (15.3%) |
| 4.0x or more | 64 (50.4%) | 22 (11.6%) |
| Total | 127 (100.0%) | 189 (100.0%) |
Real Estate Taxes by Mortgage Status in Glenns Ferry
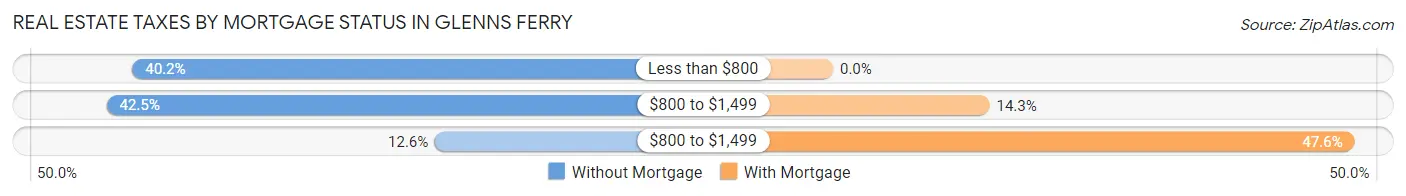
| Property Taxes | Without Mortgage | With Mortgage |
| Less than $800 | 51 (40.2%) | 0 (0.0%) |
| $800 to $1,499 | 54 (42.5%) | 27 (14.3%) |
| $800 to $1,499 | 16 (12.6%) | 90 (47.6%) |
| Total | 127 (100.0%) | 189 (100.0%) |
Health & Disability in Glenns Ferry
Health Insurance Coverage by Age in Glenns Ferry
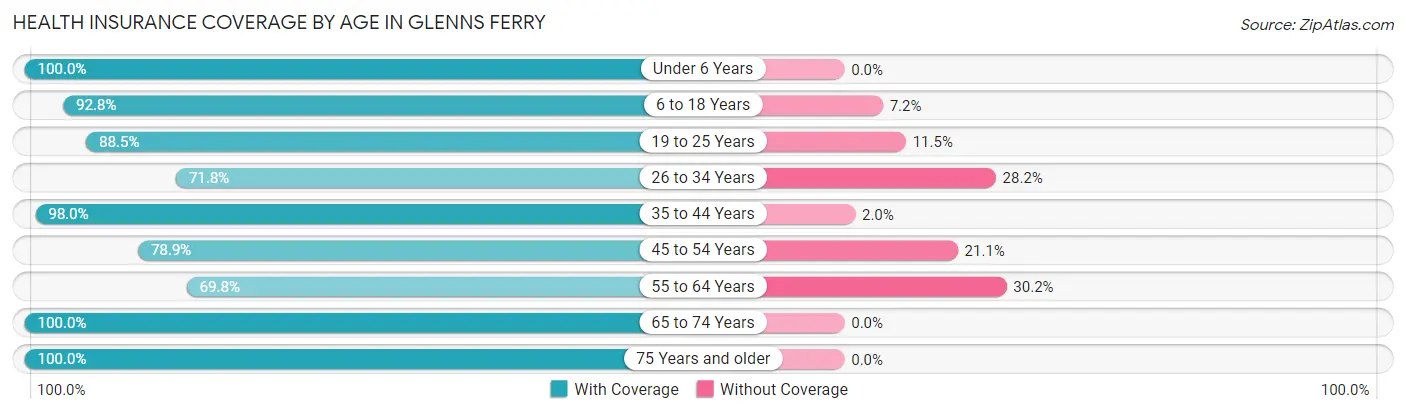
| Age Bracket | With Coverage | Without Coverage |
| Under 6 Years | 82 (100.0%) | 0 (0.0%) |
| 6 to 18 Years | 207 (92.8%) | 16 (7.2%) |
| 19 to 25 Years | 85 (88.5%) | 11 (11.5%) |
| 26 to 34 Years | 89 (71.8%) | 35 (28.2%) |
| 35 to 44 Years | 98 (98.0%) | 2 (2.0%) |
| 45 to 54 Years | 138 (78.9%) | 37 (21.1%) |
| 55 to 64 Years | 150 (69.8%) | 65 (30.2%) |
| 65 to 74 Years | 199 (100.0%) | 0 (0.0%) |
| 75 Years and older | 111 (100.0%) | 0 (0.0%) |
| Total | 1,159 (87.5%) | 166 (12.5%) |
Health Insurance Coverage by Citizenship Status in Glenns Ferry
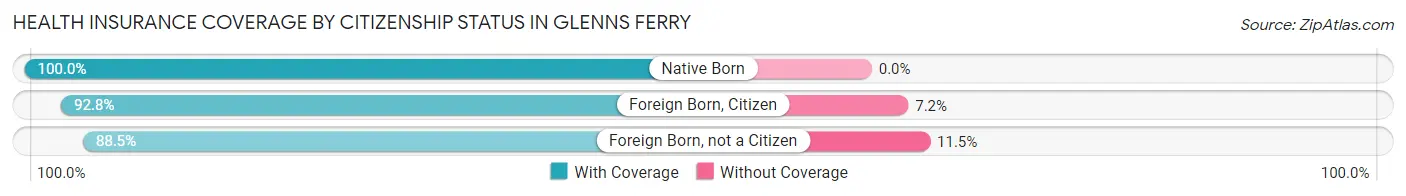
| Citizenship Status | With Coverage | Without Coverage |
| Native Born | 82 (100.0%) | 0 (0.0%) |
| Foreign Born, Citizen | 207 (92.8%) | 16 (7.2%) |
| Foreign Born, not a Citizen | 85 (88.5%) | 11 (11.5%) |
Health Insurance Coverage by Household Income in Glenns Ferry
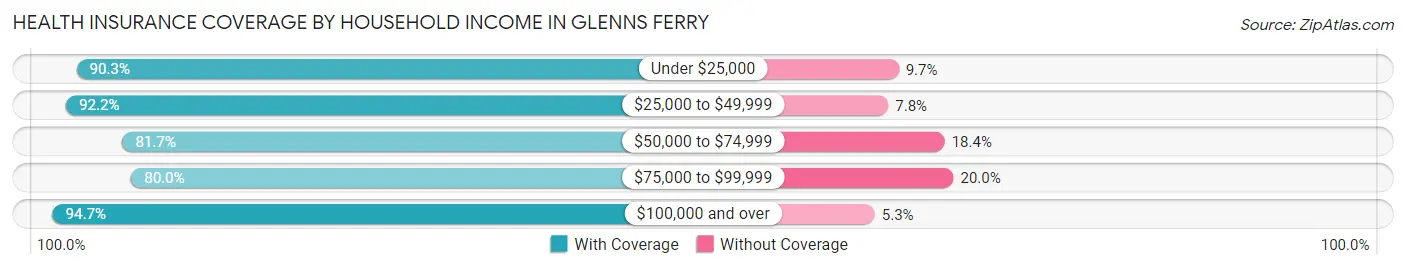
| Household Income | With Coverage | Without Coverage |
| Under $25,000 | 297 (90.3%) | 32 (9.7%) |
| $25,000 to $49,999 | 355 (92.2%) | 30 (7.8%) |
| $50,000 to $74,999 | 218 (81.7%) | 49 (18.3%) |
| $75,000 to $99,999 | 56 (80.0%) | 14 (20.0%) |
| $100,000 and over | 162 (94.7%) | 9 (5.3%) |
Public vs Private Health Insurance Coverage by Age in Glenns Ferry
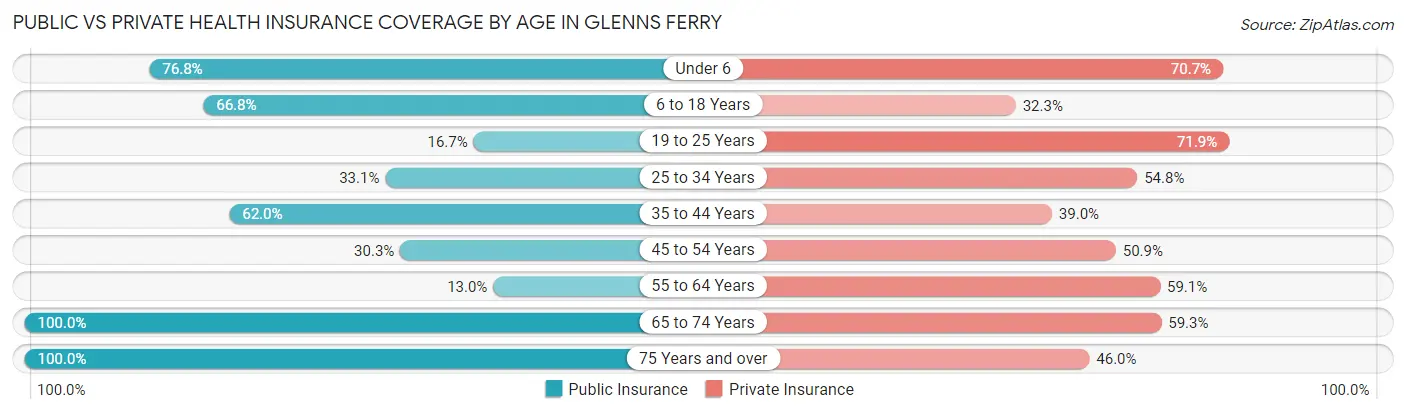
| Age Bracket | Public Insurance | Private Insurance |
| Under 6 | 63 (76.8%) | 58 (70.7%) |
| 6 to 18 Years | 149 (66.8%) | 72 (32.3%) |
| 19 to 25 Years | 16 (16.7%) | 69 (71.9%) |
| 25 to 34 Years | 41 (33.1%) | 68 (54.8%) |
| 35 to 44 Years | 62 (62.0%) | 39 (39.0%) |
| 45 to 54 Years | 53 (30.3%) | 89 (50.9%) |
| 55 to 64 Years | 28 (13.0%) | 127 (59.1%) |
| 65 to 74 Years | 199 (100.0%) | 118 (59.3%) |
| 75 Years and over | 111 (100.0%) | 51 (46.0%) |
| Total | 722 (54.5%) | 691 (52.1%) |
Disability Status by Sex by Age in Glenns Ferry
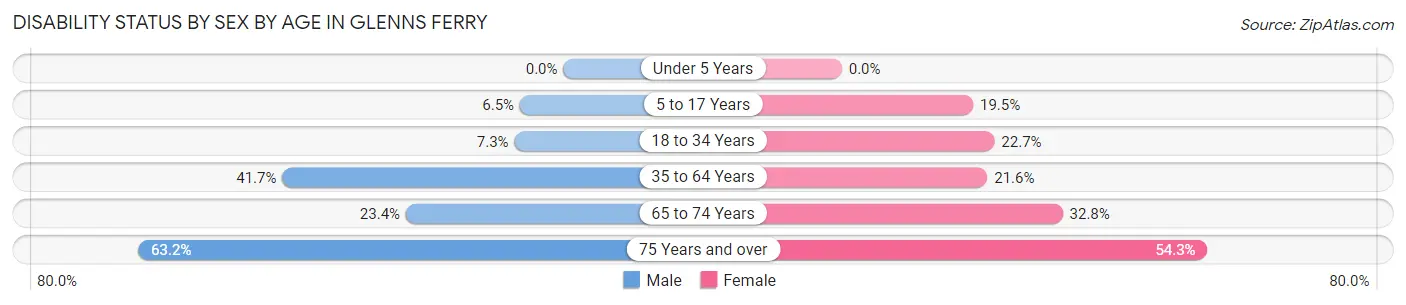
| Age Bracket | Male | Female |
| Under 5 Years | 0 (0.0%) | 0 (0.0%) |
| 5 to 17 Years | 6 (6.5%) | 23 (19.5%) |
| 18 to 34 Years | 8 (7.3%) | 29 (22.7%) |
| 35 to 64 Years | 106 (41.7%) | 51 (21.6%) |
| 65 to 74 Years | 18 (23.4%) | 40 (32.8%) |
| 75 Years and over | 48 (63.2%) | 19 (54.3%) |
Disability Class by Sex by Age in Glenns Ferry
Disability Class: Hearing Difficulty
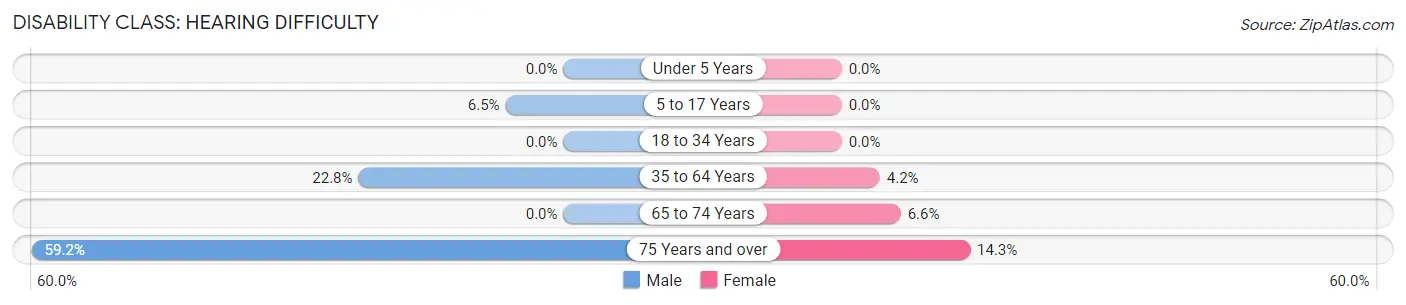
| Age Bracket | Male | Female |
| Under 5 Years | 0 (0.0%) | 0 (0.0%) |
| 5 to 17 Years | 6 (6.5%) | 0 (0.0%) |
| 18 to 34 Years | 0 (0.0%) | 0 (0.0%) |
| 35 to 64 Years | 58 (22.8%) | 10 (4.2%) |
| 65 to 74 Years | 0 (0.0%) | 8 (6.6%) |
| 75 Years and over | 45 (59.2%) | 5 (14.3%) |
Disability Class: Vision Difficulty
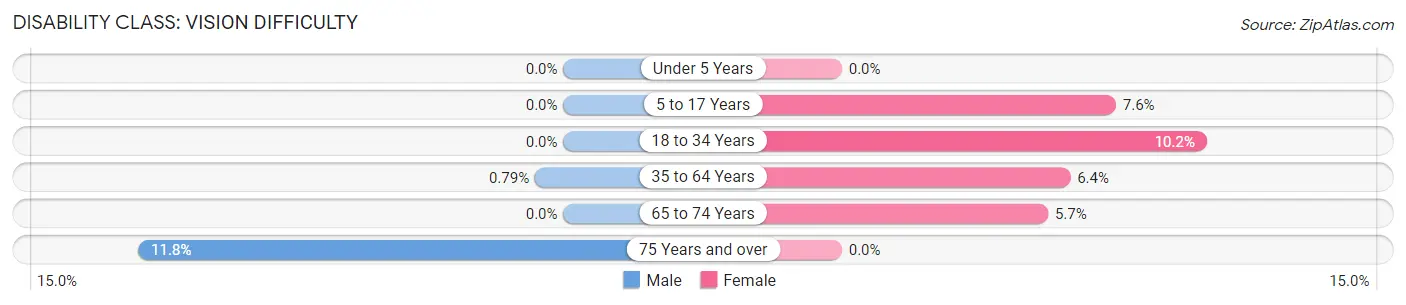
| Age Bracket | Male | Female |
| Under 5 Years | 0 (0.0%) | 0 (0.0%) |
| 5 to 17 Years | 0 (0.0%) | 9 (7.6%) |
| 18 to 34 Years | 0 (0.0%) | 13 (10.2%) |
| 35 to 64 Years | 2 (0.8%) | 15 (6.4%) |
| 65 to 74 Years | 0 (0.0%) | 7 (5.7%) |
| 75 Years and over | 9 (11.8%) | 0 (0.0%) |
Disability Class: Cognitive Difficulty
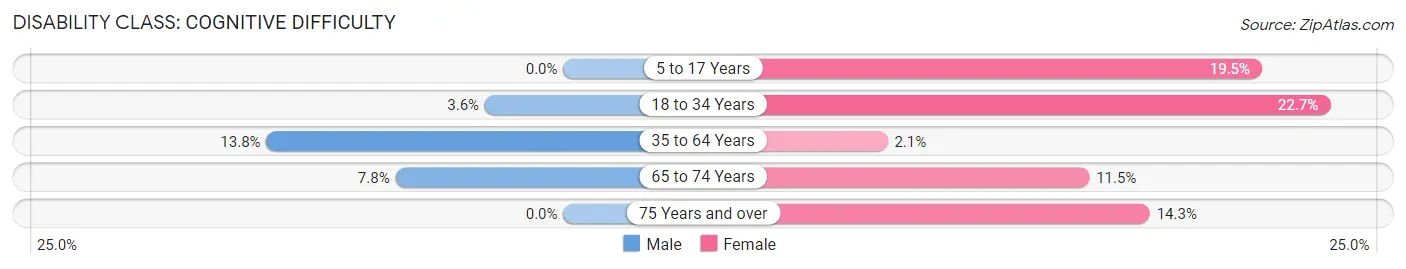
| Age Bracket | Male | Female |
| 5 to 17 Years | 0 (0.0%) | 23 (19.5%) |
| 18 to 34 Years | 4 (3.6%) | 29 (22.7%) |
| 35 to 64 Years | 35 (13.8%) | 5 (2.1%) |
| 65 to 74 Years | 6 (7.8%) | 14 (11.5%) |
| 75 Years and over | 0 (0.0%) | 5 (14.3%) |
Disability Class: Ambulatory Difficulty
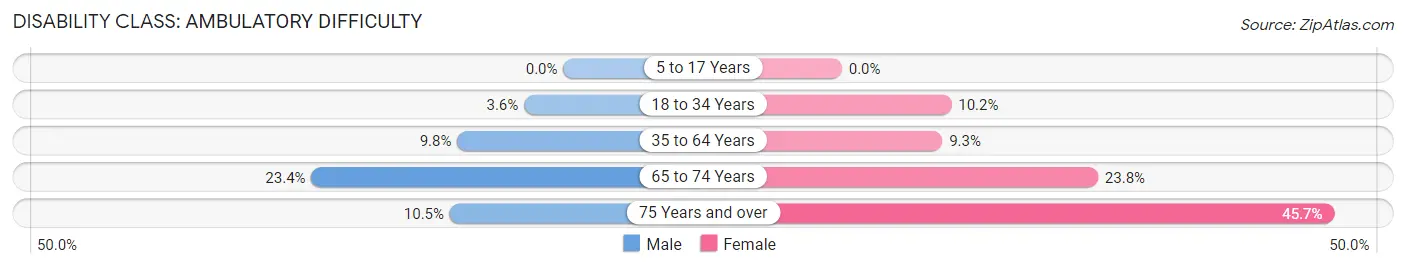
| Age Bracket | Male | Female |
| 5 to 17 Years | 0 (0.0%) | 0 (0.0%) |
| 18 to 34 Years | 4 (3.6%) | 13 (10.2%) |
| 35 to 64 Years | 25 (9.8%) | 22 (9.3%) |
| 65 to 74 Years | 18 (23.4%) | 29 (23.8%) |
| 75 Years and over | 8 (10.5%) | 16 (45.7%) |
Disability Class: Self-Care Difficulty
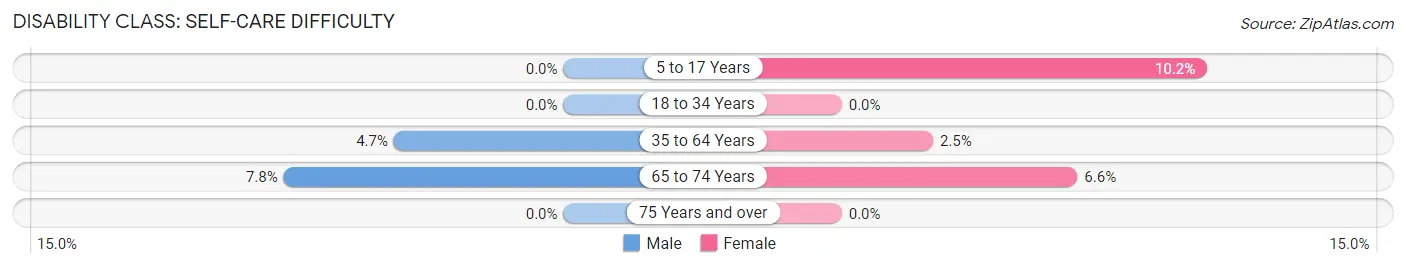
| Age Bracket | Male | Female |
| 5 to 17 Years | 0 (0.0%) | 12 (10.2%) |
| 18 to 34 Years | 0 (0.0%) | 0 (0.0%) |
| 35 to 64 Years | 12 (4.7%) | 6 (2.5%) |
| 65 to 74 Years | 6 (7.8%) | 8 (6.6%) |
| 75 Years and over | 0 (0.0%) | 0 (0.0%) |
Technology Access in Glenns Ferry
Computing Device Access in Glenns Ferry
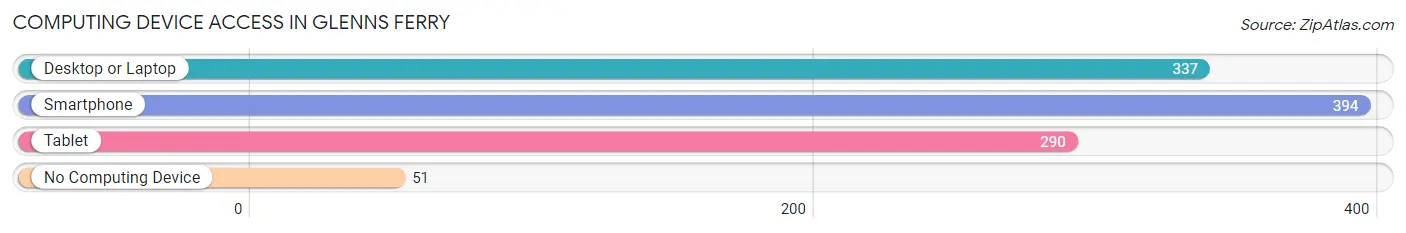
| Device Type | # Households | % Households |
| Desktop or Laptop | 337 | 68.5% |
| Smartphone | 394 | 80.1% |
| Tablet | 290 | 58.9% |
| No Computing Device | 51 | 10.4% |
| Total | 492 | 100.0% |
Internet Access in Glenns Ferry
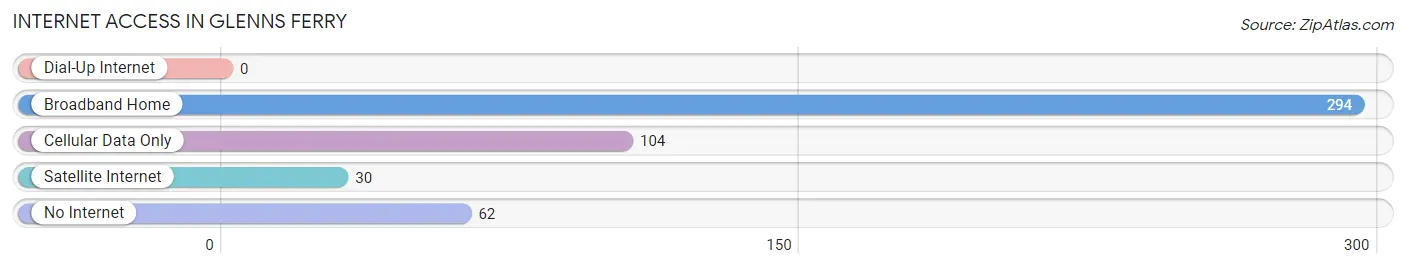
| Internet Type | # Households | % Households |
| Dial-Up Internet | 0 | 0.0% |
| Broadband Home | 294 | 59.8% |
| Cellular Data Only | 104 | 21.1% |
| Satellite Internet | 30 | 6.1% |
| No Internet | 62 | 12.6% |
| Total | 492 | 100.0% |
Glenns Ferry Summary
Glenns Ferry is a small city located in Elmore County, Idaho, United States. It is situated along the Snake River, near the Oregon border. The city was named after a ferry that operated on the Snake River in the late 1800s. As of the 2010 census, the population of Glenns Ferry was 1,119.
History
The area around Glenns Ferry has been inhabited for thousands of years. The Shoshone-Bannock tribes were the first to settle in the area, and they used the Snake River as a major transportation route. The first white settlers arrived in the area in the late 1800s, and the city of Glenns Ferry was established in 1883. The city was named after a ferry that operated on the Snake River, which was owned by a man named Glenn.
The city quickly grew, and by the early 1900s, it had become a major transportation hub. The Oregon Short Line Railroad ran through the city, and it was a major stop for travelers heading to and from Oregon. The city also had a ferry that operated on the Snake River, which allowed travelers to cross the river.
In the early 1900s, Glenns Ferry became a popular destination for tourists. The city was known for its hot springs, which were believed to have healing properties. The city also had a number of resorts and hotels, which attracted visitors from all over the country.
Geography
Glenns Ferry is located in Elmore County, Idaho, United States. It is situated along the Snake River, near the Oregon border. The city has a total area of 1.3 square miles, all of which is land.
The city is located in a semi-arid climate zone, with hot summers and cold winters. The average temperature in the summer is around 90°F, and the average temperature in the winter is around 30°F. The city receives an average of 8 inches of precipitation per year.
Economy
The economy of Glenns Ferry is largely based on agriculture and tourism. The city is home to a number of farms, which produce a variety of crops, including potatoes, alfalfa, and wheat. The city also has a number of tourist attractions, including the Snake River, hot springs, and a number of resorts and hotels.
The city is also home to a number of businesses, including restaurants, retail stores, and service providers. The city is also home to a number of manufacturing companies, which produce a variety of products, including furniture, clothing, and electronics.
Demographics
As of the 2010 census, the population of Glenns Ferry was 1,119. The racial makeup of the city was 95.3% White, 0.7% Native American, 0.3% Asian, 0.2% African American, 0.1% Pacific Islander, and 2.4% from other races. The median household income in the city was $35,000, and the median family income was $41,000.
Conclusion
Glenns Ferry is a small city located in Elmore County, Idaho, United States. It is situated along the Snake River, near the Oregon border. The city was named after a ferry that operated on the Snake River in the late 1800s. As of the 2010 census, the population of Glenns Ferry was 1,119. The economy of Glenns Ferry is largely based on agriculture and tourism, and the city is home to a number of businesses, including restaurants, retail stores, and service providers. The racial makeup of the city was 95.3% White, 0.7% Native American, 0.3% Asian, 0.2% African American, 0.1% Pacific Islander, and 2.4% from other races. The median household income in the city was $35,000, and the median family income was $41,000.
Common Questions
What is Per Capita Income in Glenns Ferry?
Per Capita income in Glenns Ferry is $20,604.
What is the Median Family Income in Glenns Ferry?
Median Family Income in Glenns Ferry is $47,381.
What is the Median Household income in Glenns Ferry?
Median Household Income in Glenns Ferry is $36,413.
What is Income or Wage Gap in Glenns Ferry?
Income or Wage Gap in Glenns Ferry is 19.6%.
Women in Glenns Ferry earn 80.4 cents for every dollar earned by a man.
What is Inequality or Gini Index in Glenns Ferry?
Inequality or Gini Index in Glenns Ferry is 0.42.
What is the Total Population of Glenns Ferry?
Total Population of Glenns Ferry is 1,327.
What is the Total Male Population of Glenns Ferry?
Total Male Population of Glenns Ferry is 638.
What is the Total Female Population of Glenns Ferry?
Total Female Population of Glenns Ferry is 689.
What is the Ratio of Males per 100 Females in Glenns Ferry?
There are 92.60 Males per 100 Females in Glenns Ferry.
What is the Ratio of Females per 100 Males in Glenns Ferry?
There are 107.99 Females per 100 Males in Glenns Ferry.
What is the Median Population Age in Glenns Ferry?
Median Population Age in Glenns Ferry is 47.2 Years.
What is the Average Family Size in Glenns Ferry
Average Family Size in Glenns Ferry is 3.4 People.
What is the Average Household Size in Glenns Ferry
Average Household Size in Glenns Ferry is 2.5 People.
How Large is the Labor Force in Glenns Ferry?
There are 549 People in the Labor Forcein in Glenns Ferry.
What is the Percentage of People in the Labor Force in Glenns Ferry?
52.5% of People are in the Labor Force in Glenns Ferry.
What is the Unemployment Rate in Glenns Ferry?
Unemployment Rate in Glenns Ferry is 2.4%.