Genesee, ID
Genesee Map
Genesee Overview
1,209
TOTAL POPULATION
633
MALE POPULATION
576
FEMALE POPULATION
109.90
MALES / 100 FEMALES
91.00
FEMALES / 100 MALES
35.7
MEDIAN AGE
2.8
AVG FAMILY SIZE
2.6
AVG HOUSEHOLD SIZE
$37,304
PER CAPITA INCOME
$86,771
AVG FAMILY INCOME
$77,266
AVG HOUSEHOLD INCOME
30.0%
WAGE / INCOME GAP [ % ]
70.0¢/ $1
WAGE / INCOME GAP [ $ ]
$14,629
FAMILY INCOME DEFICIT
0.35
INEQUALITY / GINI INDEX
560
LABOR FORCE [ PEOPLE ]
64.2%
PERCENT IN LABOR FORCE
2.5%
UNEMPLOYMENT RATE
Genesee Zip Codes
Genesee Area Codes
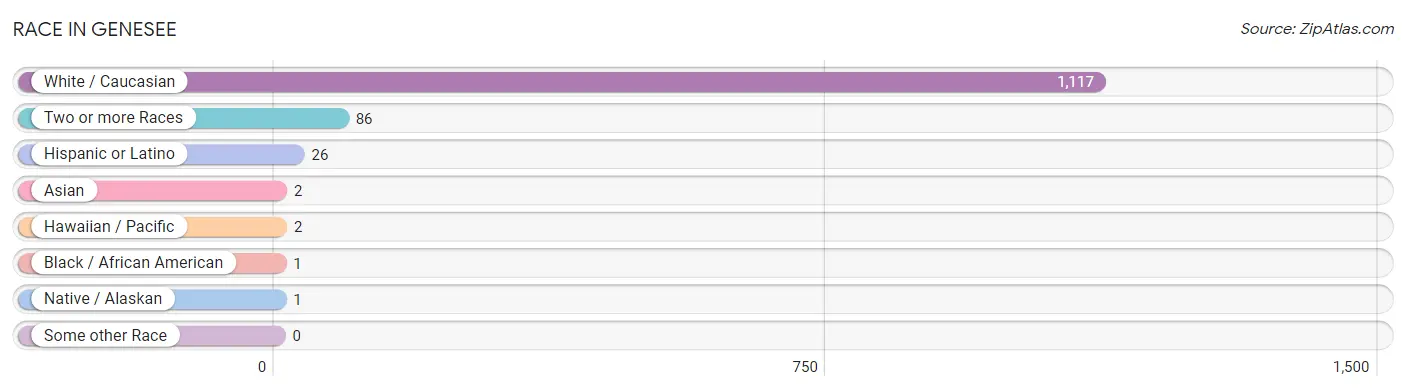
Race in Genesee
The most populous races in Genesee are White / Caucasian (1,117 | 92.4%), Two or more Races (86 | 7.1%), and Hispanic or Latino (26 | 2.1%).
| Race | # Population | % Population |
| Asian | 2 | 0.2% |
| Black / African American | 1 | 0.1% |
| Hawaiian / Pacific | 2 | 0.2% |
| Hispanic or Latino | 26 | 2.1% |
| Native / Alaskan | 1 | 0.1% |
| White / Caucasian | 1,117 | 92.4% |
| Two or more Races | 86 | 7.1% |
| Some other Race | 0 | 0.0% |
| Total | 1,209 | 100.0% |
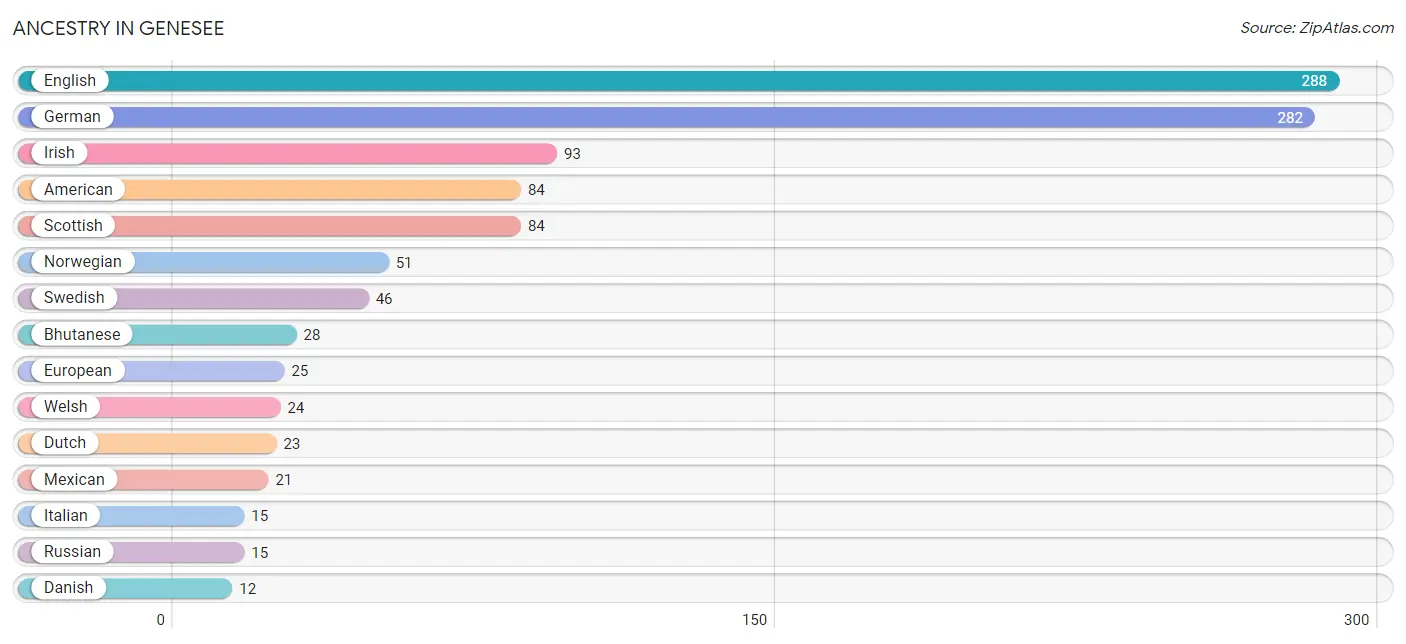
Ancestry in Genesee
The most populous ancestries reported in Genesee are English (288 | 23.8%), German (282 | 23.3%), Irish (93 | 7.7%), American (84 | 7.0%), and Scottish (84 | 7.0%), together accounting for 68.7% of all Genesee residents.
| Ancestry | # Population | % Population |
| American | 84 | 7.0% |
| Austrian | 3 | 0.3% |
| Bhutanese | 28 | 2.3% |
| British | 6 | 0.5% |
| Burmese | 2 | 0.2% |
| Central American | 5 | 0.4% |
| Danish | 12 | 1.0% |
| Dutch | 23 | 1.9% |
| English | 288 | 23.8% |
| European | 25 | 2.1% |
| Finnish | 11 | 0.9% |
| French | 10 | 0.8% |
| French Canadian | 3 | 0.3% |
| German | 282 | 23.3% |
| Haitian | 1 | 0.1% |
| Hungarian | 2 | 0.2% |
| Irish | 93 | 7.7% |
| Italian | 15 | 1.2% |
| Korean | 12 | 1.0% |
| Luxembourger | 2 | 0.2% |
| Mexican | 21 | 1.7% |
| Native Hawaiian | 3 | 0.3% |
| Northern European | 9 | 0.7% |
| Norwegian | 51 | 4.2% |
| Polish | 9 | 0.7% |
| Portuguese | 3 | 0.3% |
| Russian | 15 | 1.2% |
| Salvadoran | 5 | 0.4% |
| Samoan | 2 | 0.2% |
| Scandinavian | 6 | 0.5% |
| Scotch-Irish | 2 | 0.2% |
| Scottish | 84 | 7.0% |
| Swedish | 46 | 3.8% |
| Welsh | 24 | 2.0% | View All 34 Rows |
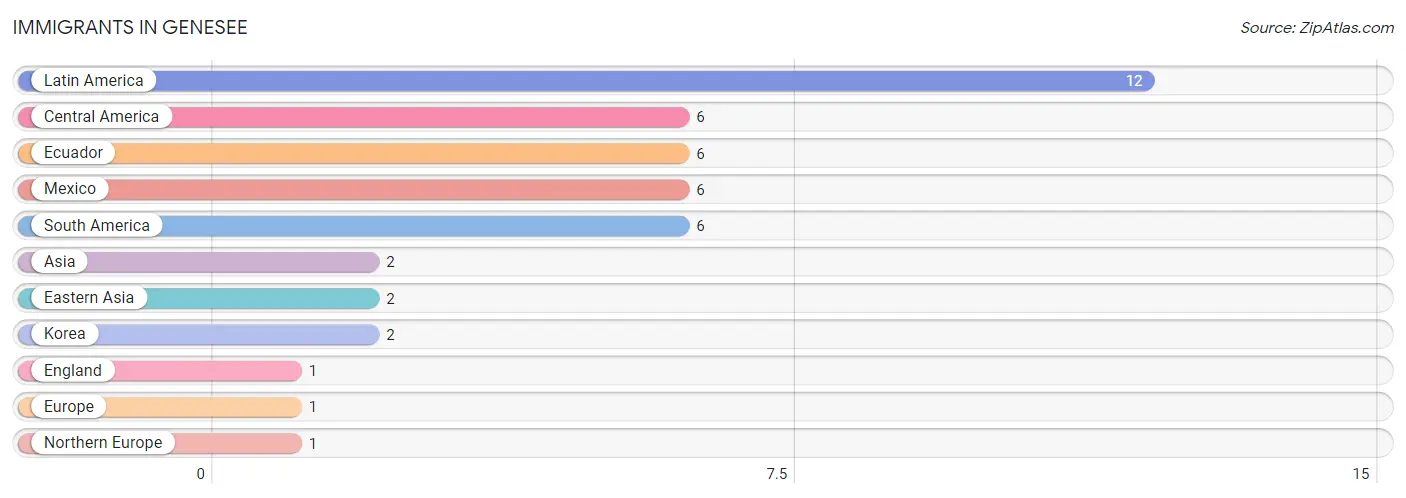
Immigrants in Genesee
The most numerous immigrant groups reported in Genesee came from Latin America (12 | 1.0%), Central America (6 | 0.5%), Ecuador (6 | 0.5%), Mexico (6 | 0.5%), and South America (6 | 0.5%), together accounting for 3.0% of all Genesee residents.
| Immigration Origin | # Population | % Population |
| Asia | 2 | 0.2% |
| Central America | 6 | 0.5% |
| Eastern Asia | 2 | 0.2% |
| Ecuador | 6 | 0.5% |
| England | 1 | 0.1% |
| Europe | 1 | 0.1% |
| Korea | 2 | 0.2% |
| Latin America | 12 | 1.0% |
| Mexico | 6 | 0.5% |
| Northern Europe | 1 | 0.1% |
| South America | 6 | 0.5% | View All 11 Rows |
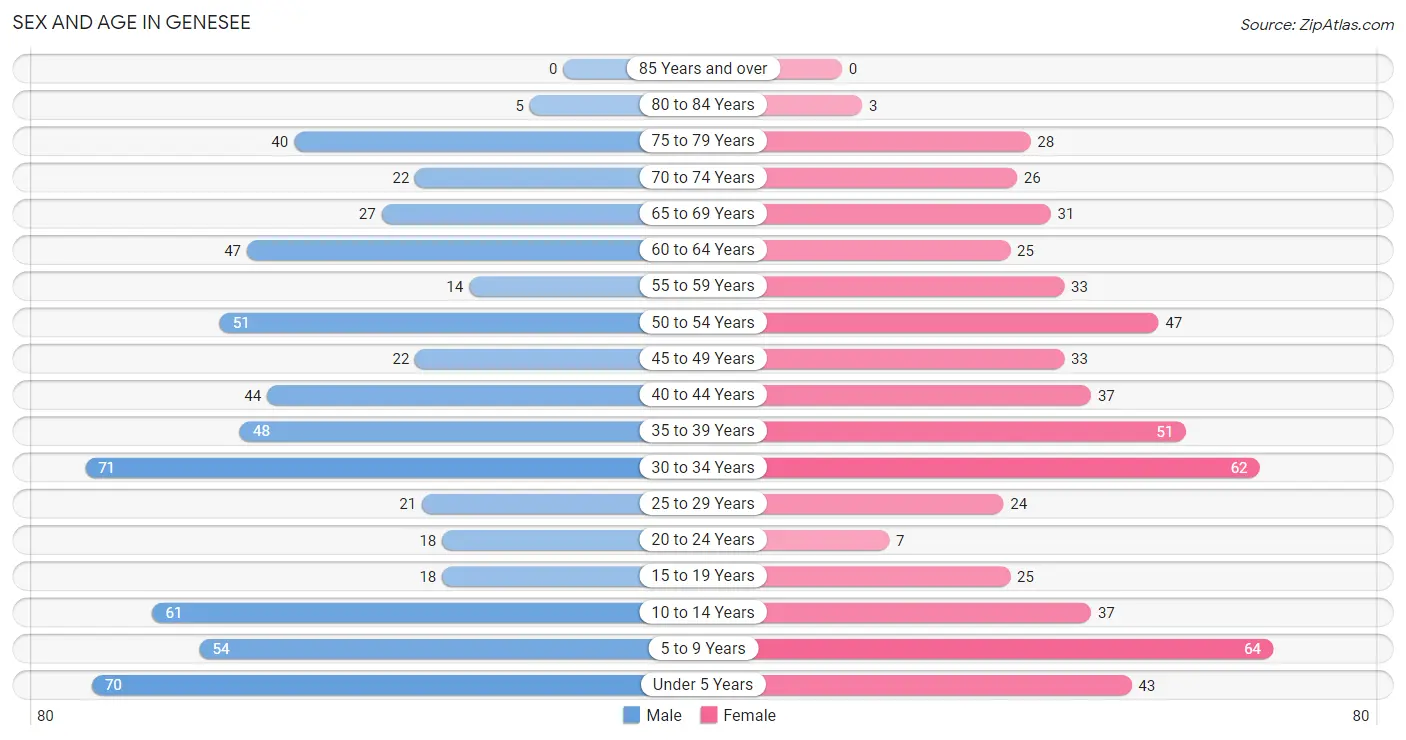
Sex and Age in Genesee
Sex and Age in Genesee
The most populous age groups in Genesee are 30 to 34 Years (71 | 11.2%) for men and 5 to 9 Years (64 | 11.1%) for women.
| Age Bracket | Male | Female |
| Under 5 Years | 70 (11.1%) | 43 (7.5%) |
| 5 to 9 Years | 54 (8.5%) | 64 (11.1%) |
| 10 to 14 Years | 61 (9.6%) | 37 (6.4%) |
| 15 to 19 Years | 18 (2.8%) | 25 (4.3%) |
| 20 to 24 Years | 18 (2.8%) | 7 (1.2%) |
| 25 to 29 Years | 21 (3.3%) | 24 (4.2%) |
| 30 to 34 Years | 71 (11.2%) | 62 (10.8%) |
| 35 to 39 Years | 48 (7.6%) | 51 (8.8%) |
| 40 to 44 Years | 44 (7.0%) | 37 (6.4%) |
| 45 to 49 Years | 22 (3.5%) | 33 (5.7%) |
| 50 to 54 Years | 51 (8.1%) | 47 (8.2%) |
| 55 to 59 Years | 14 (2.2%) | 33 (5.7%) |
| 60 to 64 Years | 47 (7.4%) | 25 (4.3%) |
| 65 to 69 Years | 27 (4.3%) | 31 (5.4%) |
| 70 to 74 Years | 22 (3.5%) | 26 (4.5%) |
| 75 to 79 Years | 40 (6.3%) | 28 (4.9%) |
| 80 to 84 Years | 5 (0.8%) | 3 (0.5%) |
| 85 Years and over | 0 (0.0%) | 0 (0.0%) |
| Total | 633 (100.0%) | 576 (100.0%) |
Families and Households in Genesee
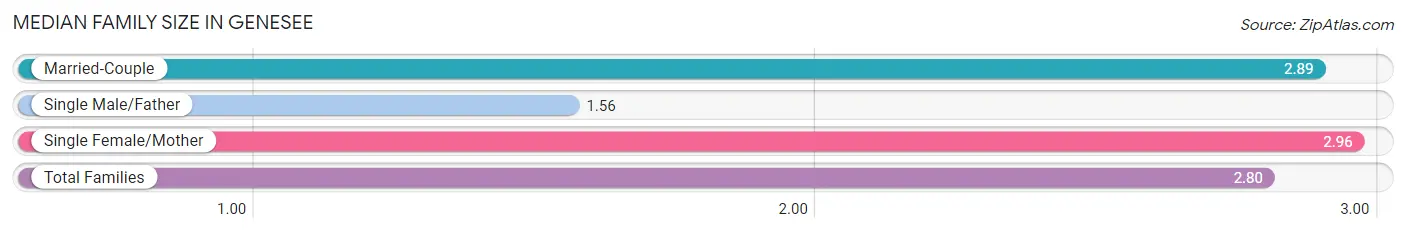
Median Family Size in Genesee
The median family size in Genesee is 2.80 persons per family, with single female/mother families (23 | 6.2%) accounting for the largest median family size of 2.96 persons per family. On the other hand, single male/father families (25 | 6.7%) represent the smallest median family size with 1.56 persons per family.
| Family Type | # Families | Family Size |
| Married-Couple | 323 (87.1%) | 2.89 |
| Single Male/Father | 25 (6.7%) | 1.56 |
| Single Female/Mother | 23 (6.2%) | 2.96 |
| Total Families | 371 (100.0%) | 2.80 |
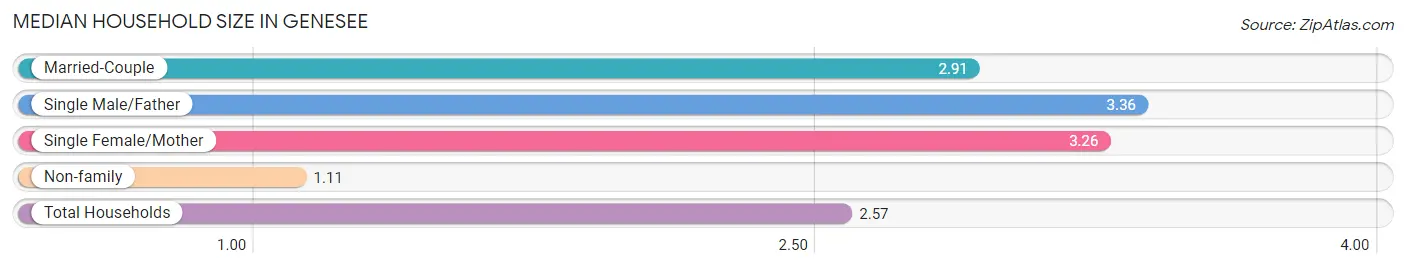
Median Household Size in Genesee
The median household size in Genesee is 2.57 persons per household, with single male/father households (25 | 5.3%) accounting for the largest median household size of 3.36 persons per household. non-family households (100 | 21.2%) represent the smallest median household size with 1.11 persons per household.
| Household Type | # Households | Household Size |
| Married-Couple | 323 (68.6%) | 2.91 |
| Single Male/Father | 25 (5.3%) | 3.36 |
| Single Female/Mother | 23 (4.9%) | 3.26 |
| Non-family | 100 (21.2%) | 1.11 |
| Total Households | 471 (100.0%) | 2.57 |
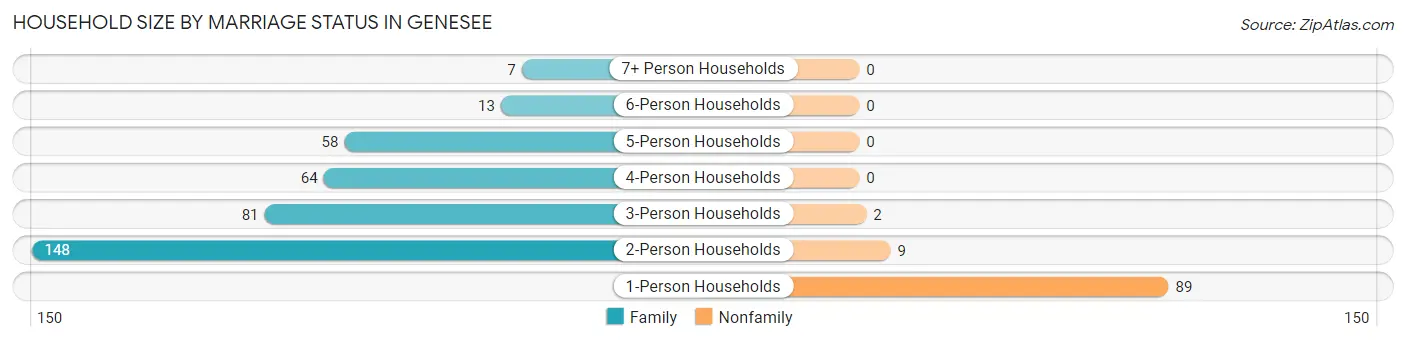
Household Size by Marriage Status in Genesee
Out of a total of 471 households in Genesee, 371 (78.8%) are family households, while 100 (21.2%) are nonfamily households. The most numerous type of family households are 2-person households, comprising 148, and the most common type of nonfamily households are 1-person households, comprising 89.
| Household Size | Family Households | Nonfamily Households |
| 1-Person Households | - | 89 (18.9%) |
| 2-Person Households | 148 (31.4%) | 9 (1.9%) |
| 3-Person Households | 81 (17.2%) | 2 (0.4%) |
| 4-Person Households | 64 (13.6%) | 0 (0.0%) |
| 5-Person Households | 58 (12.3%) | 0 (0.0%) |
| 6-Person Households | 13 (2.8%) | 0 (0.0%) |
| 7+ Person Households | 7 (1.5%) | 0 (0.0%) |
| Total | 371 (78.8%) | 100 (21.2%) |
Female Fertility in Genesee
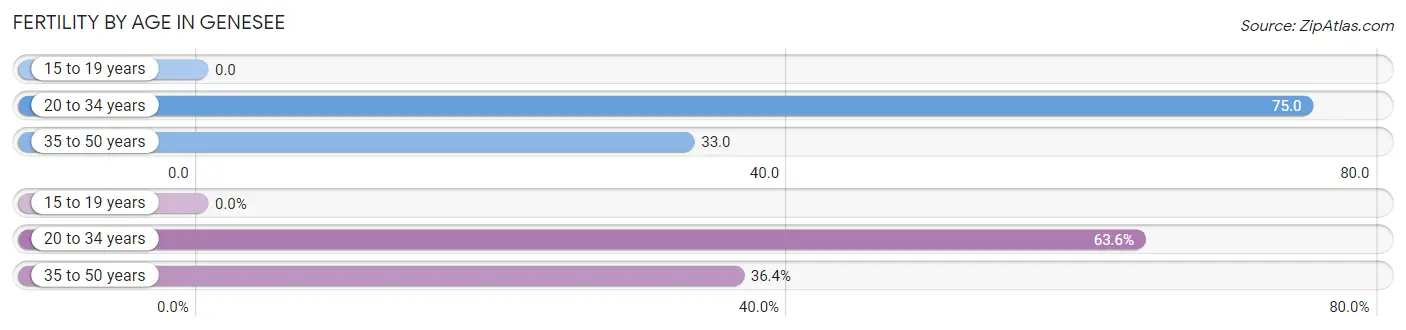
Fertility by Age in Genesee
Average fertility rate in Genesee is 46.0 births per 1,000 women. Women in the age bracket of 20 to 34 years have the highest fertility rate with 75.0 births per 1,000 women. Women in the age bracket of 20 to 34 years acount for 63.6% of all women with births.
| Age Bracket | Women with Births | Births / 1,000 Women |
| 15 to 19 years | 0 (0.0%) | 0.0 |
| 20 to 34 years | 7 (63.6%) | 75.0 |
| 35 to 50 years | 4 (36.4%) | 33.0 |
| Total | 11 (100.0%) | 46.0 |
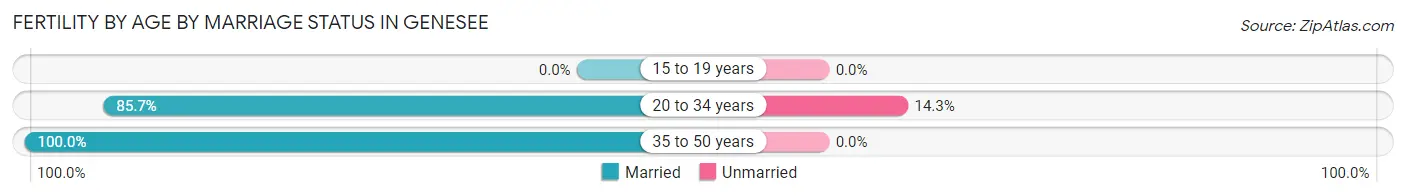
Fertility by Age by Marriage Status in Genesee
90.9% of women with births (11) in Genesee are married. The highest percentage of unmarried women with births falls into 20 to 34 years age bracket with 14.3% of them unmarried at the time of birth, while the lowest percentage of unmarried women with births belong to 35 to 50 years age bracket with 0.0% of them unmarried.
| Age Bracket | Married | Unmarried |
| 15 to 19 years | 0 (0.0%) | 0 (0.0%) |
| 20 to 34 years | 6 (85.7%) | 1 (14.3%) |
| 35 to 50 years | 4 (100.0%) | 0 (0.0%) |
| Total | 10 (90.9%) | 1 (9.1%) |
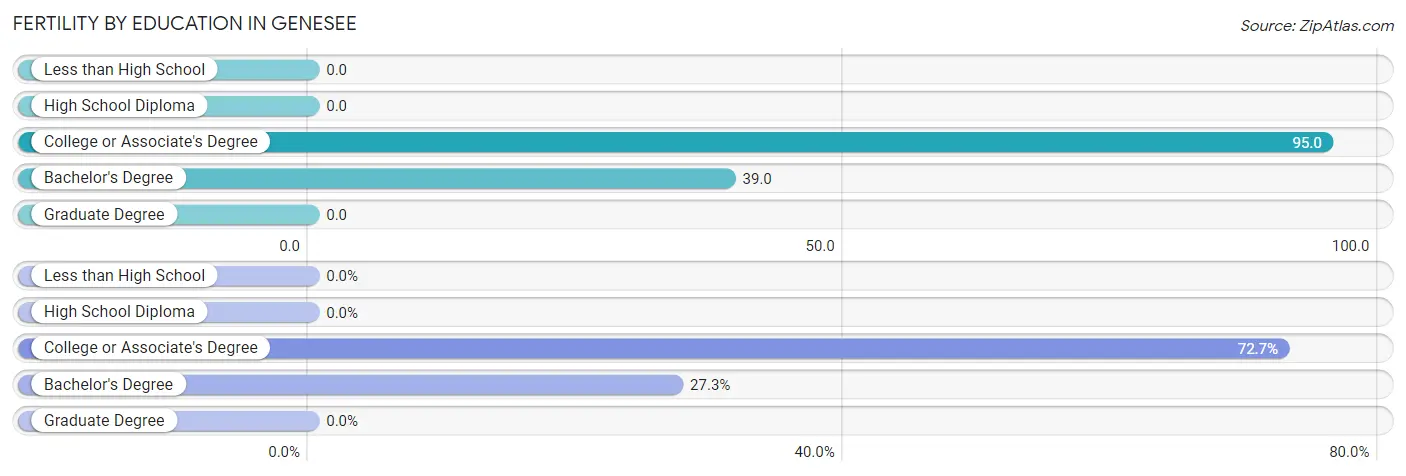
Fertility by Education in Genesee
| Educational Attainment | Women with Births | Births / 1,000 Women |
| Less than High School | 0 (0.0%) | 0.0 |
| High School Diploma | 0 (0.0%) | 0.0 |
| College or Associate's Degree | 8 (72.7%) | 95.0 |
| Bachelor's Degree | 3 (27.3%) | 39.0 |
| Graduate Degree | 0 (0.0%) | 0.0 |
| Total | 11 (100.0%) | 46.0 |
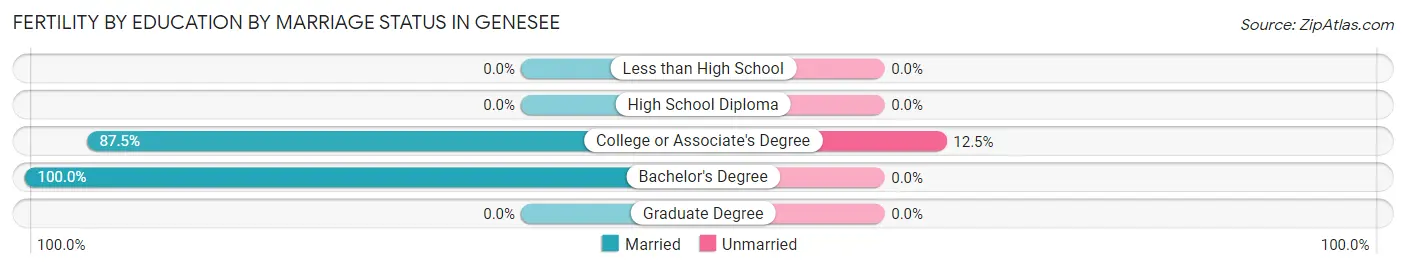
Fertility by Education by Marriage Status in Genesee
9.1% of women with births in Genesee are unmarried. Women with the educational attainment of bachelor's degree are most likely to be married with 100.0% of them married at childbirth, while women with the educational attainment of college or associate's degree are least likely to be married with 12.5% of them unmarried at childbirth.
| Educational Attainment | Married | Unmarried |
| Less than High School | 0 (0.0%) | 0 (0.0%) |
| High School Diploma | 0 (0.0%) | 0 (0.0%) |
| College or Associate's Degree | 7 (87.5%) | 1 (12.5%) |
| Bachelor's Degree | 3 (100.0%) | 0 (0.0%) |
| Graduate Degree | 0 (0.0%) | 0 (0.0%) |
| Total | 10 (90.9%) | 1 (9.1%) |
Income in Genesee
Income Overview in Genesee
Per Capita Income in Genesee is $37,304, while median incomes of families and households are $86,771 and $77,266 respectively.
| Characteristic | Number | Measure |
| Per Capita Income | 1,209 | $37,304 |
| Median Family Income | 371 | $86,771 |
| Mean Family Income | 371 | $104,047 |
| Median Household Income | 471 | $77,266 |
| Mean Household Income | 471 | $96,583 |
| Income Deficit | 371 | $14,629 |
| Wage / Income Gap (%) | 1,209 | 29.96% |
| Wage / Income Gap ($) | 1,209 | 70.04¢ per $1 |
| Gini / Inequality Index | 1,209 | 0.35 |
Earnings by Sex in Genesee
Average Earnings in Genesee are $58,264, $66,927 for men and $46,875 for women, a difference of 30.0%.
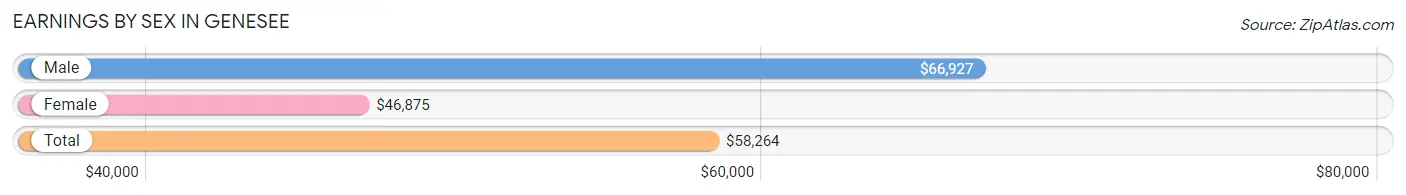
| Sex | Number | Average Earnings |
| Male | 325 (53.6%) | $66,927 |
| Female | 281 (46.4%) | $46,875 |
| Total | 606 (100.0%) | $58,264 |
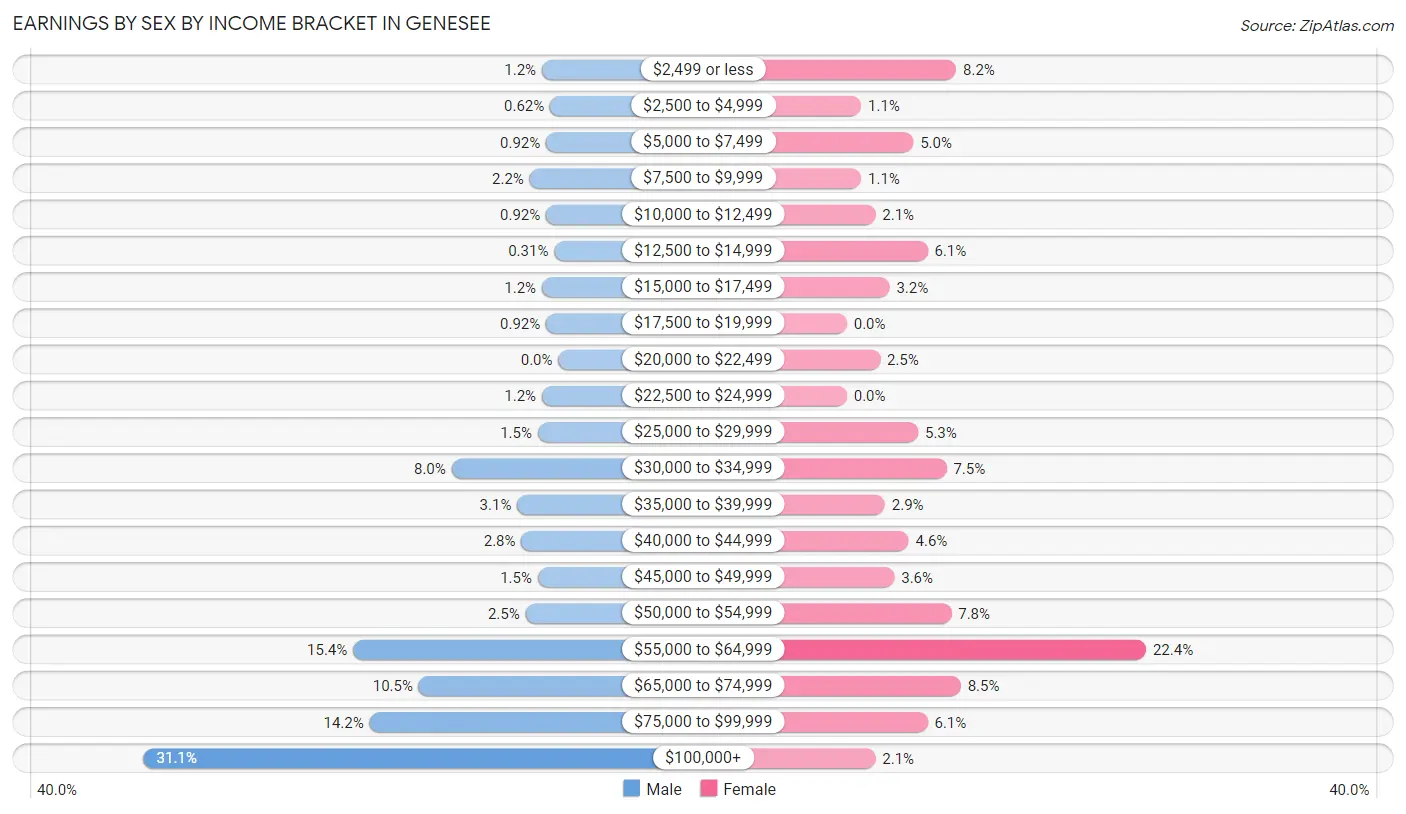
Earnings by Sex by Income Bracket in Genesee
The most common earnings brackets in Genesee are $100,000+ for men (101 | 31.1%) and $55,000 to $64,999 for women (63 | 22.4%).
| Income | Male | Female |
| $2,499 or less | 4 (1.2%) | 23 (8.2%) |
| $2,500 to $4,999 | 2 (0.6%) | 3 (1.1%) |
| $5,000 to $7,499 | 3 (0.9%) | 14 (5.0%) |
| $7,500 to $9,999 | 7 (2.1%) | 3 (1.1%) |
| $10,000 to $12,499 | 3 (0.9%) | 6 (2.1%) |
| $12,500 to $14,999 | 1 (0.3%) | 17 (6.0%) |
| $15,000 to $17,499 | 4 (1.2%) | 9 (3.2%) |
| $17,500 to $19,999 | 3 (0.9%) | 0 (0.0%) |
| $20,000 to $22,499 | 0 (0.0%) | 7 (2.5%) |
| $22,500 to $24,999 | 4 (1.2%) | 0 (0.0%) |
| $25,000 to $29,999 | 5 (1.5%) | 15 (5.3%) |
| $30,000 to $34,999 | 26 (8.0%) | 21 (7.5%) |
| $35,000 to $39,999 | 10 (3.1%) | 8 (2.9%) |
| $40,000 to $44,999 | 9 (2.8%) | 13 (4.6%) |
| $45,000 to $49,999 | 5 (1.5%) | 10 (3.6%) |
| $50,000 to $54,999 | 8 (2.5%) | 22 (7.8%) |
| $55,000 to $64,999 | 50 (15.4%) | 63 (22.4%) |
| $65,000 to $74,999 | 34 (10.5%) | 24 (8.5%) |
| $75,000 to $99,999 | 46 (14.1%) | 17 (6.0%) |
| $100,000+ | 101 (31.1%) | 6 (2.1%) |
| Total | 325 (100.0%) | 281 (100.0%) |
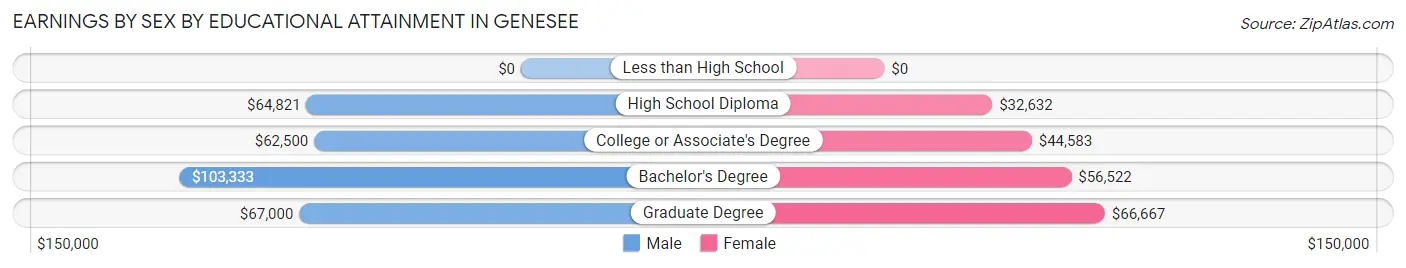
Earnings by Sex by Educational Attainment in Genesee
Average earnings in Genesee are $72,917 for men and $49,219 for women, a difference of 32.5%. Men with an educational attainment of bachelor's degree enjoy the highest average annual earnings of $103,333, while those with college or associate's degree education earn the least with $62,500. Women with an educational attainment of graduate degree earn the most with the average annual earnings of $66,667, while those with high school diploma education have the smallest earnings of $32,632.
| Educational Attainment | Male Income | Female Income |
| Less than High School | - | - |
| High School Diploma | $64,821 | $32,632 |
| College or Associate's Degree | $62,500 | $44,583 |
| Bachelor's Degree | $103,333 | $56,522 |
| Graduate Degree | $67,000 | $66,667 |
| Total | $72,917 | $49,219 |
Family Income in Genesee
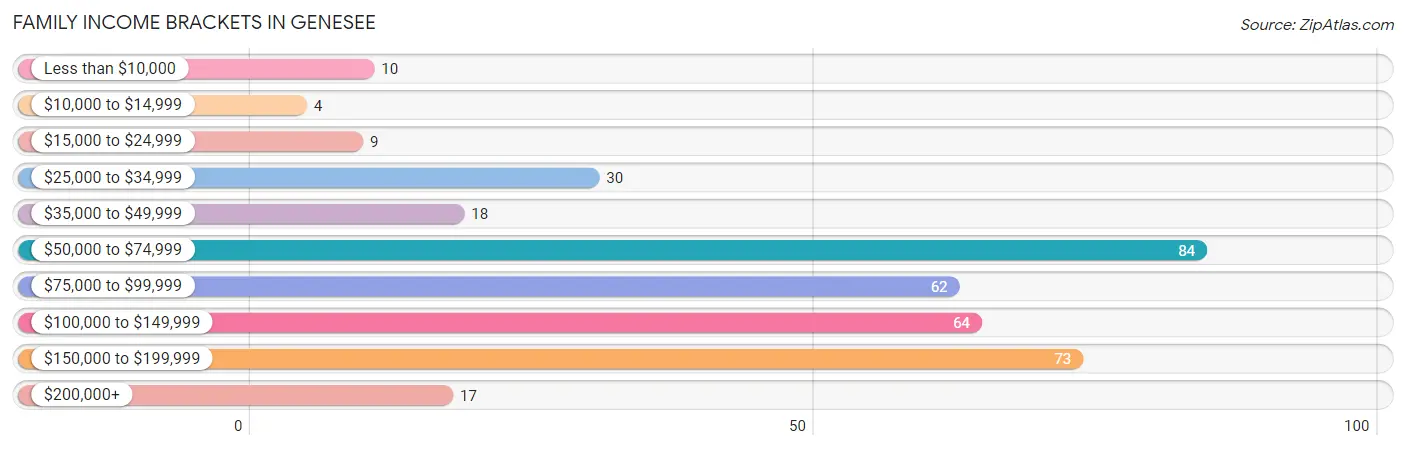
Family Income Brackets in Genesee
According to the Genesee family income data, there are 84 families falling into the $50,000 to $74,999 income range, which is the most common income bracket and makes up 22.6% of all families. Conversely, the $10,000 to $14,999 income bracket is the least frequent group with only 4 families (1.1%) belonging to this category.
| Income Bracket | # Families | % Families |
| Less than $10,000 | 10 | 2.7% |
| $10,000 to $14,999 | 4 | 1.1% |
| $15,000 to $24,999 | 9 | 2.4% |
| $25,000 to $34,999 | 30 | 8.1% |
| $35,000 to $49,999 | 18 | 4.9% |
| $50,000 to $74,999 | 84 | 22.6% |
| $75,000 to $99,999 | 62 | 16.7% |
| $100,000 to $149,999 | 64 | 17.3% |
| $150,000 to $199,999 | 73 | 19.7% |
| $200,000+ | 17 | 4.6% |
Family Income by Famaliy Size in Genesee
5-person families (45 | 12.1%) account for the highest median family income in Genesee with $157,679 per family, while 3-person families (85 | 22.9%) have the highest median income of $42,760 per family member.
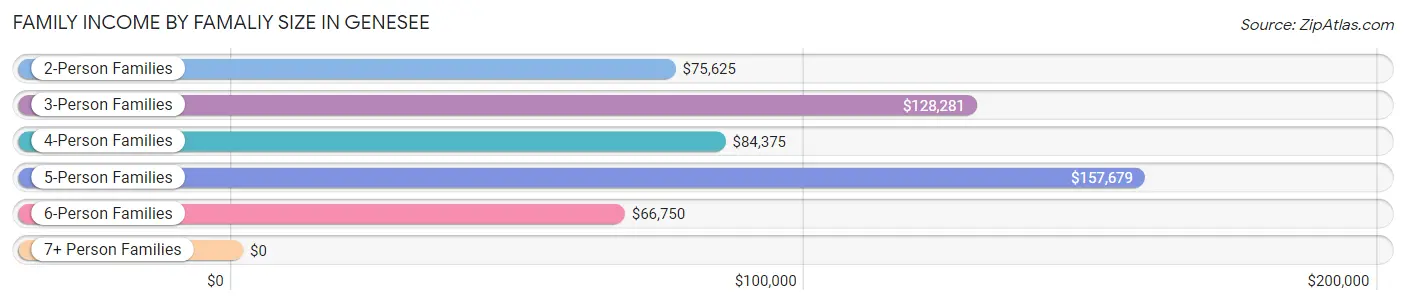
| Income Bracket | # Families | Median Income |
| 2-Person Families | 167 (45.0%) | $75,625 |
| 3-Person Families | 85 (22.9%) | $128,281 |
| 4-Person Families | 60 (16.2%) | $84,375 |
| 5-Person Families | 45 (12.1%) | $157,679 |
| 6-Person Families | 7 (1.9%) | $66,750 |
| 7+ Person Families | 7 (1.9%) | $0 |
| Total | 371 (100.0%) | $86,771 |
Family Income by Number of Earners in Genesee
The median family income in Genesee is $86,771, with families comprising 3+ earners (31) having the highest median family income of $161,875, while families with 1 earner (104) have the lowest median family income of $58,421, accounting for 8.4% and 28.0% of families, respectively.
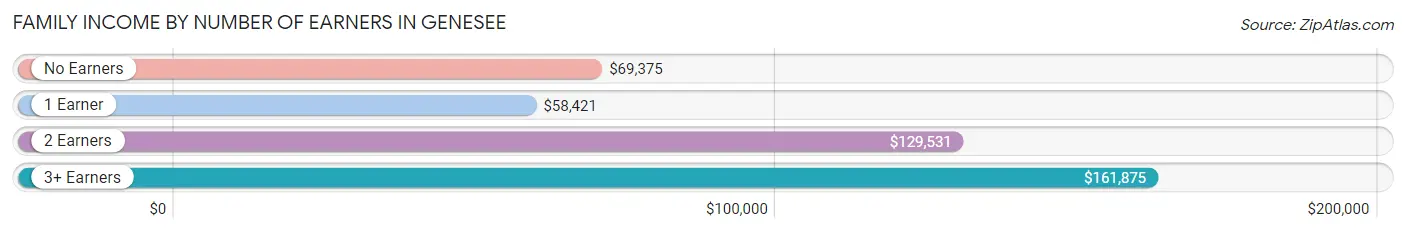
| Number of Earners | # Families | Median Income |
| No Earners | 61 (16.4%) | $69,375 |
| 1 Earner | 104 (28.0%) | $58,421 |
| 2 Earners | 175 (47.2%) | $129,531 |
| 3+ Earners | 31 (8.4%) | $161,875 |
| Total | 371 (100.0%) | $86,771 |
Household Income in Genesee
Household Income Brackets in Genesee
With 128 households falling in the category, the $50,000 to $74,999 income range is the most frequent in Genesee, accounting for 27.2% of all households. In contrast, only 12 households (2.5%) fall into the less than $10,000 income bracket, making it the least populous group.
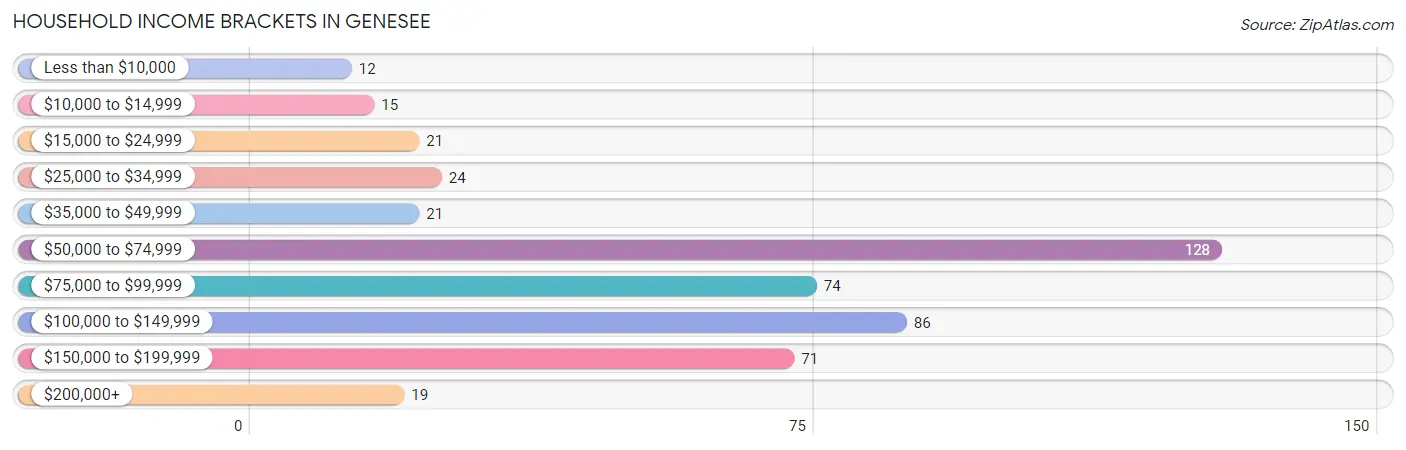
| Income Bracket | # Households | % Households |
| Less than $10,000 | 12 | 2.5% |
| $10,000 to $14,999 | 15 | 3.2% |
| $15,000 to $24,999 | 21 | 4.5% |
| $25,000 to $34,999 | 24 | 5.1% |
| $35,000 to $49,999 | 21 | 4.5% |
| $50,000 to $74,999 | 128 | 27.2% |
| $75,000 to $99,999 | 74 | 15.7% |
| $100,000 to $149,999 | 86 | 18.3% |
| $150,000 to $199,999 | 71 | 15.1% |
| $200,000+ | 19 | 4.0% |
Household Income by Householder Age in Genesee
The median household income in Genesee is $77,266, with the highest median household income of $98,625 found in the 45 to 64 years age bracket for the primary householder. A total of 175 households (37.1%) fall into this category. Meanwhile, the 15 to 24 years age bracket for the primary householder has the lowest median household income of $57,969, with 13 households (2.8%) in this group.
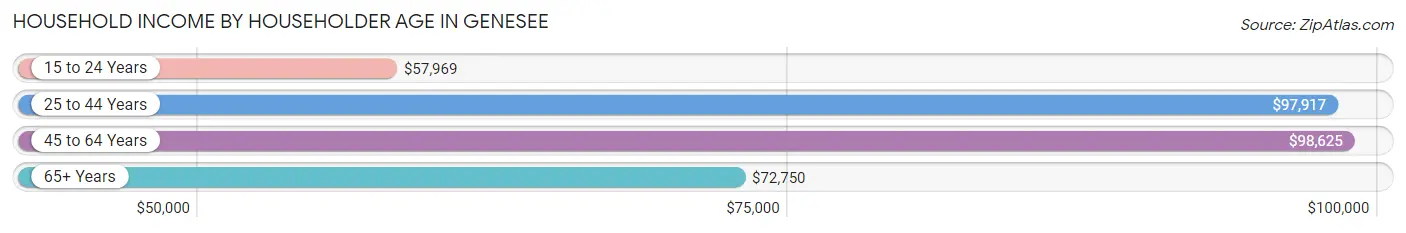
| Income Bracket | # Households | Median Income |
| 15 to 24 Years | 13 (2.8%) | $57,969 |
| 25 to 44 Years | 171 (36.3%) | $97,917 |
| 45 to 64 Years | 175 (37.1%) | $98,625 |
| 65+ Years | 112 (23.8%) | $72,750 |
| Total | 471 (100.0%) | $77,266 |
Poverty in Genesee
Income Below Poverty by Sex and Age in Genesee
With 9.5% poverty level for males and 7.5% for females among the residents of Genesee, 5 year old males and 5 year old females are the most vulnerable to poverty, with 6 males (42.9%) and 1 females (50.0%) in their respective age groups living below the poverty level.
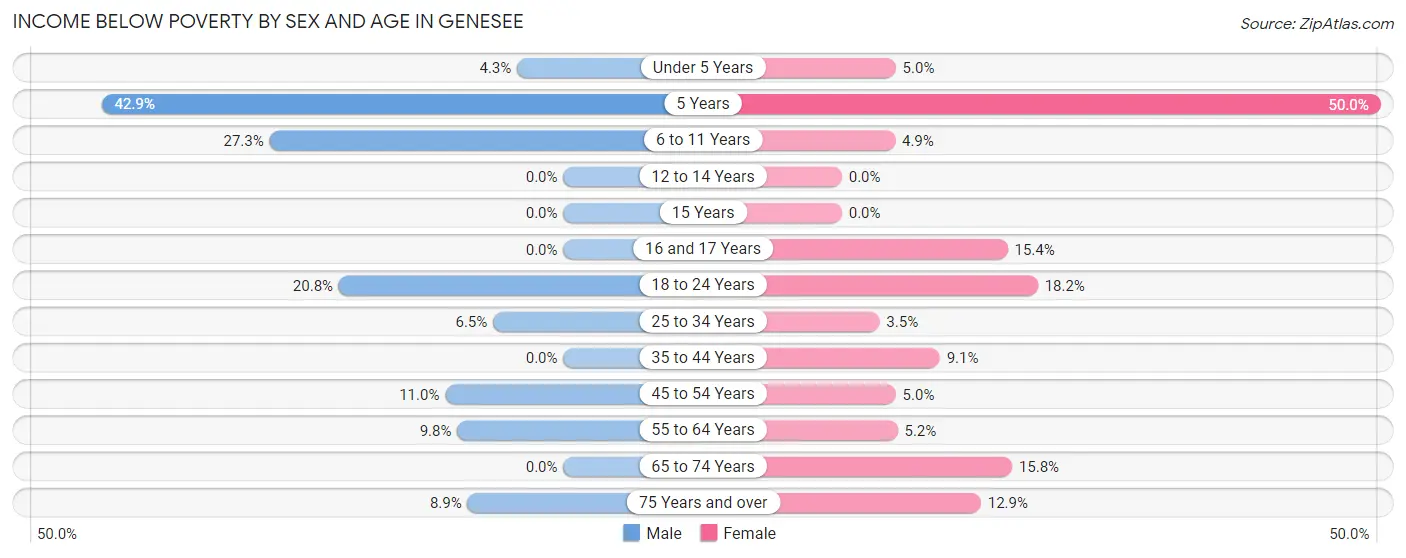
| Age Bracket | Male | Female |
| Under 5 Years | 3 (4.3%) | 2 (5.0%) |
| 5 Years | 6 (42.9%) | 1 (50.0%) |
| 6 to 11 Years | 21 (27.3%) | 4 (4.9%) |
| 12 to 14 Years | 0 (0.0%) | 0 (0.0%) |
| 15 Years | 0 (0.0%) | 0 (0.0%) |
| 16 and 17 Years | 0 (0.0%) | 2 (15.4%) |
| 18 to 24 Years | 5 (20.8%) | 2 (18.2%) |
| 25 to 34 Years | 6 (6.5%) | 3 (3.5%) |
| 35 to 44 Years | 0 (0.0%) | 8 (9.1%) |
| 45 to 54 Years | 8 (11.0%) | 4 (5.0%) |
| 55 to 64 Years | 6 (9.8%) | 3 (5.2%) |
| 65 to 74 Years | 0 (0.0%) | 9 (15.8%) |
| 75 Years and over | 4 (8.9%) | 4 (12.9%) |
| Total | 59 (9.5%) | 42 (7.5%) |
Income Above Poverty by Sex and Age in Genesee
According to the poverty statistics in Genesee, males aged 12 to 14 years and females aged 12 to 14 years are the age groups that are most secure financially, with 100.0% of males and 100.0% of females in these age groups living above the poverty line.
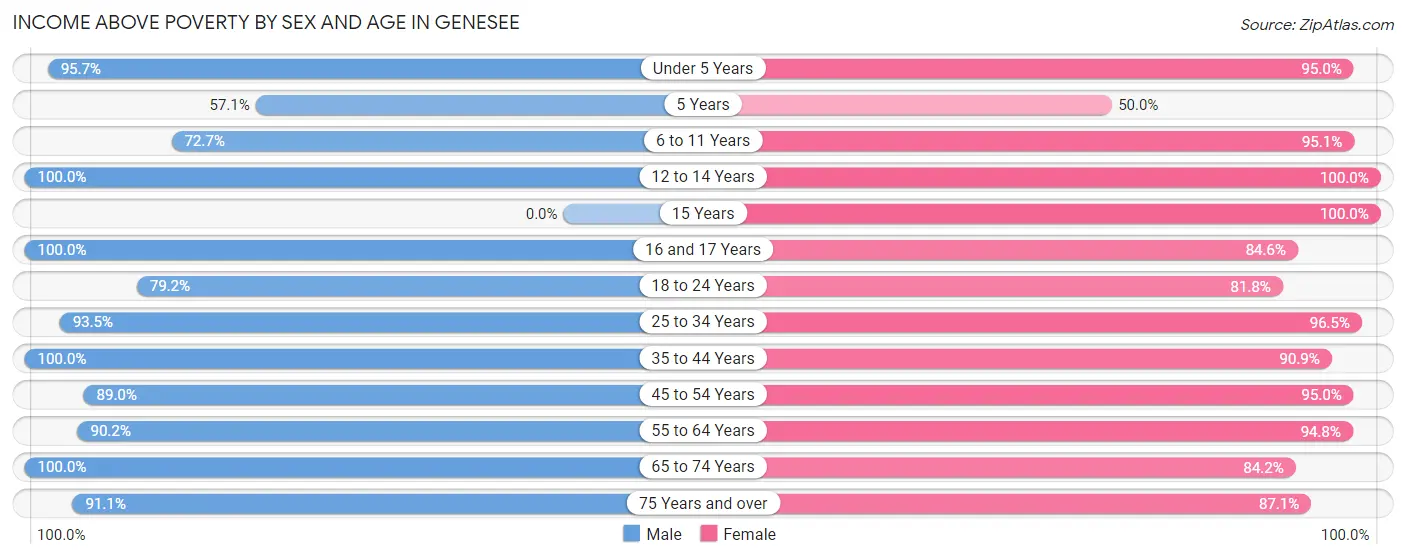
| Age Bracket | Male | Female |
| Under 5 Years | 67 (95.7%) | 38 (95.0%) |
| 5 Years | 8 (57.1%) | 1 (50.0%) |
| 6 to 11 Years | 56 (72.7%) | 77 (95.1%) |
| 12 to 14 Years | 12 (100.0%) | 4 (100.0%) |
| 15 Years | 0 (0.0%) | 8 (100.0%) |
| 16 and 17 Years | 12 (100.0%) | 11 (84.6%) |
| 18 to 24 Years | 19 (79.2%) | 9 (81.8%) |
| 25 to 34 Years | 86 (93.5%) | 83 (96.5%) |
| 35 to 44 Years | 92 (100.0%) | 80 (90.9%) |
| 45 to 54 Years | 65 (89.0%) | 76 (95.0%) |
| 55 to 64 Years | 55 (90.2%) | 55 (94.8%) |
| 65 to 74 Years | 49 (100.0%) | 48 (84.2%) |
| 75 Years and over | 41 (91.1%) | 27 (87.1%) |
| Total | 562 (90.5%) | 517 (92.5%) |
Income Below Poverty Among Married-Couple Families in Genesee
The poverty statistics for married-couple families in Genesee show that 2.8% or 9 of the total 323 families live below the poverty line. Families with no children have the highest poverty rate of 3.3%, comprising of 6 families. On the other hand, families with 3 or 4 children have the lowest poverty rate of 0.0%, which includes 0 families.
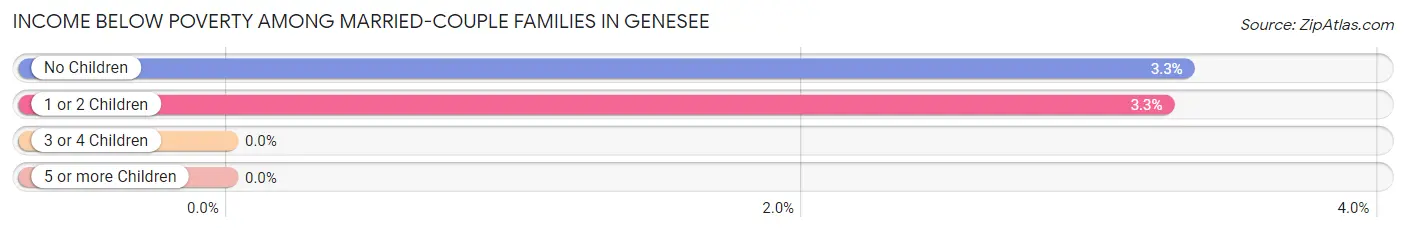
| Children | Above Poverty | Below Poverty |
| No Children | 174 (96.7%) | 6 (3.3%) |
| 1 or 2 Children | 89 (96.7%) | 3 (3.3%) |
| 3 or 4 Children | 49 (100.0%) | 0 (0.0%) |
| 5 or more Children | 2 (100.0%) | 0 (0.0%) |
| Total | 314 (97.2%) | 9 (2.8%) |
Income Below Poverty Among Single-Parent Households in Genesee
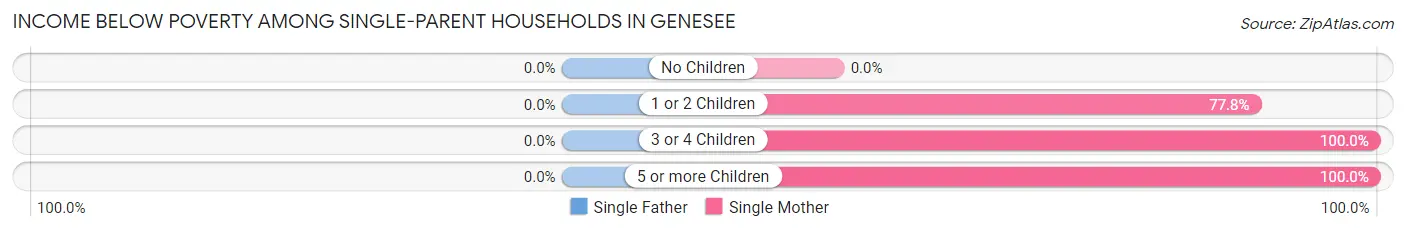
| Children | Single Father | Single Mother |
| No Children | 0 (0.0%) | 0 (0.0%) |
| 1 or 2 Children | 0 (0.0%) | 7 (77.8%) |
| 3 or 4 Children | 0 (0.0%) | 3 (100.0%) |
| 5 or more Children | 0 (0.0%) | 5 (100.0%) |
| Total | 0 (0.0%) | 15 (65.2%) |
Income Below Poverty Among Married-Couple vs Single-Parent Households in Genesee
The poverty data for Genesee shows that 9 of the married-couple family households (2.8%) and 15 of the single-parent households (31.2%) are living below the poverty level. Within the married-couple family households, those with no children have the highest poverty rate, with 6 households (3.3%) falling below the poverty line. Among the single-parent households, those with 5 or more children have the highest poverty rate, with 5 household (100.0%) living below poverty.
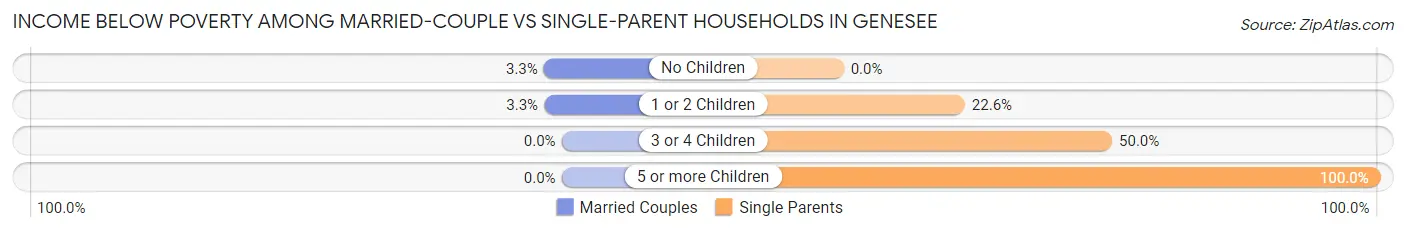
| Children | Married-Couple Families | Single-Parent Households |
| No Children | 6 (3.3%) | 0 (0.0%) |
| 1 or 2 Children | 3 (3.3%) | 7 (22.6%) |
| 3 or 4 Children | 0 (0.0%) | 3 (50.0%) |
| 5 or more Children | 0 (0.0%) | 5 (100.0%) |
| Total | 9 (2.8%) | 15 (31.2%) |
Employment Characteristics in Genesee
Employment by Class of Employer in Genesee
Among the 540 employed individuals in Genesee, private company employees (327 | 60.6%), local government employees (65 | 12.0%), and state government employees (56 | 10.4%) make up the most common classes of employment.
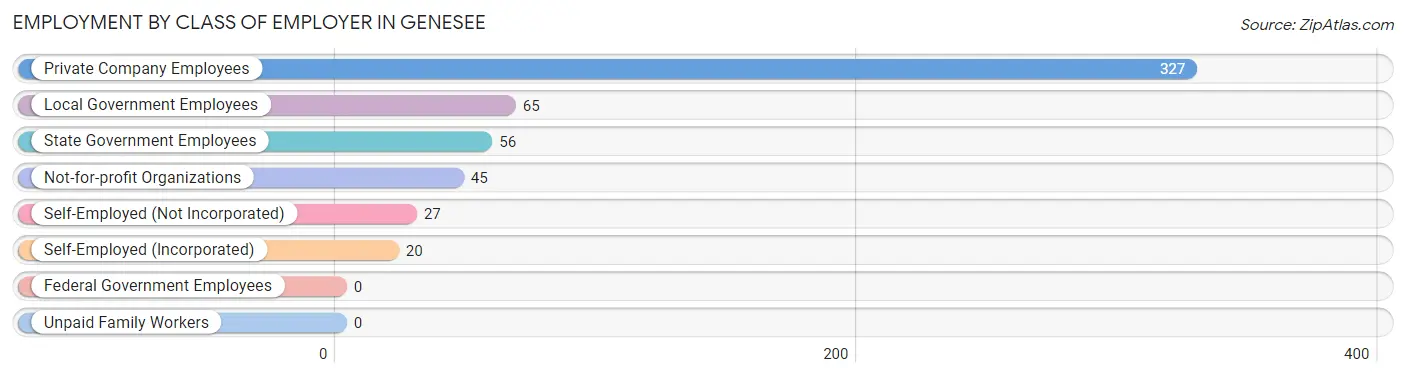
| Employer Class | # Employees | % Employees |
| Private Company Employees | 327 | 60.6% |
| Self-Employed (Incorporated) | 20 | 3.7% |
| Self-Employed (Not Incorporated) | 27 | 5.0% |
| Not-for-profit Organizations | 45 | 8.3% |
| Local Government Employees | 65 | 12.0% |
| State Government Employees | 56 | 10.4% |
| Federal Government Employees | 0 | 0.0% |
| Unpaid Family Workers | 0 | 0.0% |
| Total | 540 | 100.0% |
Employment Status by Age in Genesee
According to the labor force statistics for Genesee, out of the total population over 16 years of age (872), 64.2% or 560 individuals are in the labor force, with 2.5% or 14 of them unemployed. The age group with the highest labor force participation rate is 30 to 34 years, with 89.5% or 119 individuals in the labor force. Within the labor force, the 16 to 19 years age range has the highest percentage of unemployed individuals, with 25.0% or 2 of them being unemployed.
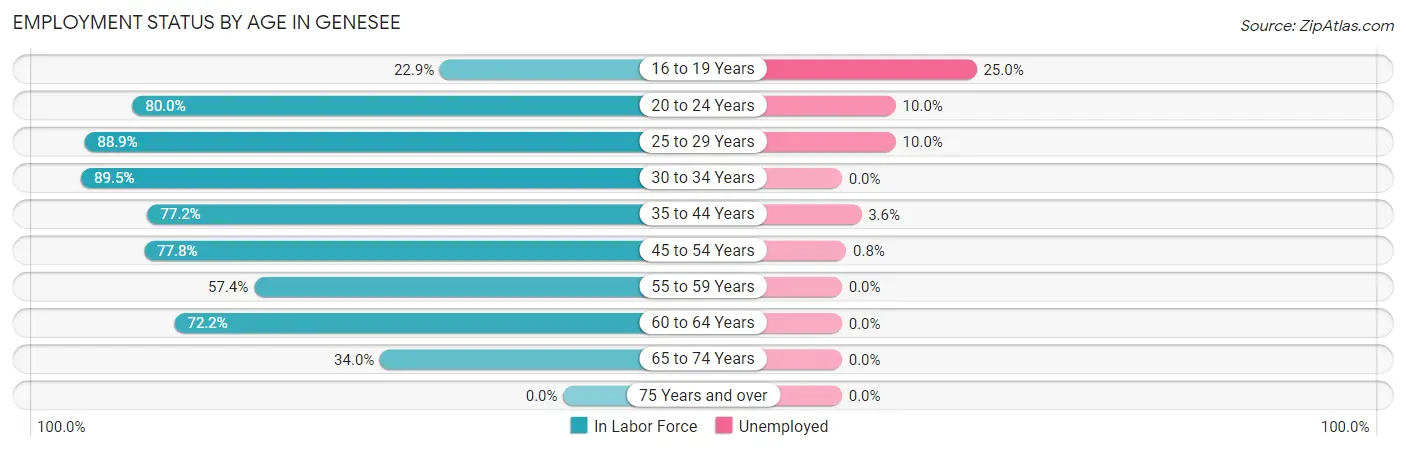
| Age Bracket | In Labor Force | Unemployed |
| 16 to 19 Years | 8 (22.9%) | 2 (25.0%) |
| 20 to 24 Years | 20 (80.0%) | 2 (10.0%) |
| 25 to 29 Years | 40 (88.9%) | 4 (10.0%) |
| 30 to 34 Years | 119 (89.5%) | 0 (0.0%) |
| 35 to 44 Years | 139 (77.2%) | 5 (3.6%) |
| 45 to 54 Years | 119 (77.8%) | 1 (0.8%) |
| 55 to 59 Years | 27 (57.4%) | 0 (0.0%) |
| 60 to 64 Years | 52 (72.2%) | 0 (0.0%) |
| 65 to 74 Years | 36 (34.0%) | 0 (0.0%) |
| 75 Years and over | 0 (0.0%) | 0 (0.0%) |
| Total | 560 (64.2%) | 14 (2.5%) |
Employment Status by Educational Attainment in Genesee
According to labor force statistics for Genesee, 78.7% of individuals (496) out of the total population between 25 and 64 years of age (630) are in the labor force, with 2.0% or 10 of them being unemployed. The group with the highest labor force participation rate are those with the educational attainment of bachelor's degree or higher, with 94.4% or 220 individuals in the labor force. Within the labor force, individuals with college / associate degree education have the highest percentage of unemployment, with 5.8% or 10 of them being unemployed.
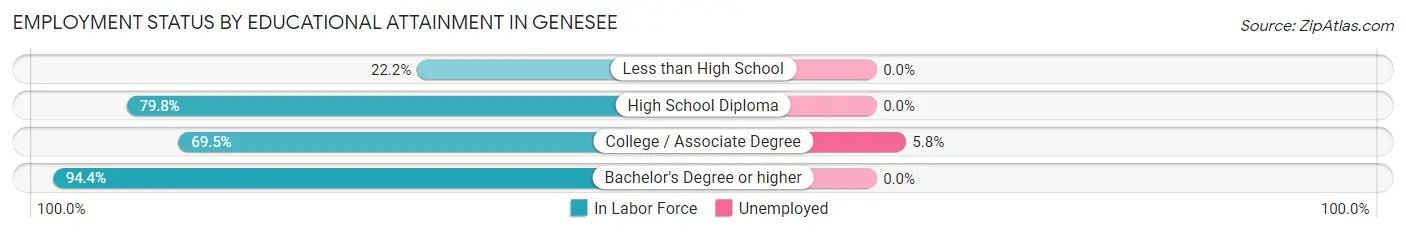
| Educational Attainment | In Labor Force | Unemployed |
| Less than High School | 6 (22.2%) | 0 (0.0%) |
| High School Diploma | 99 (79.8%) | 0 (0.0%) |
| College / Associate Degree | 171 (69.5%) | 14 (5.8%) |
| Bachelor's Degree or higher | 220 (94.4%) | 0 (0.0%) |
| Total | 496 (78.7%) | 13 (2.0%) |
Employment Occupations by Sex in Genesee
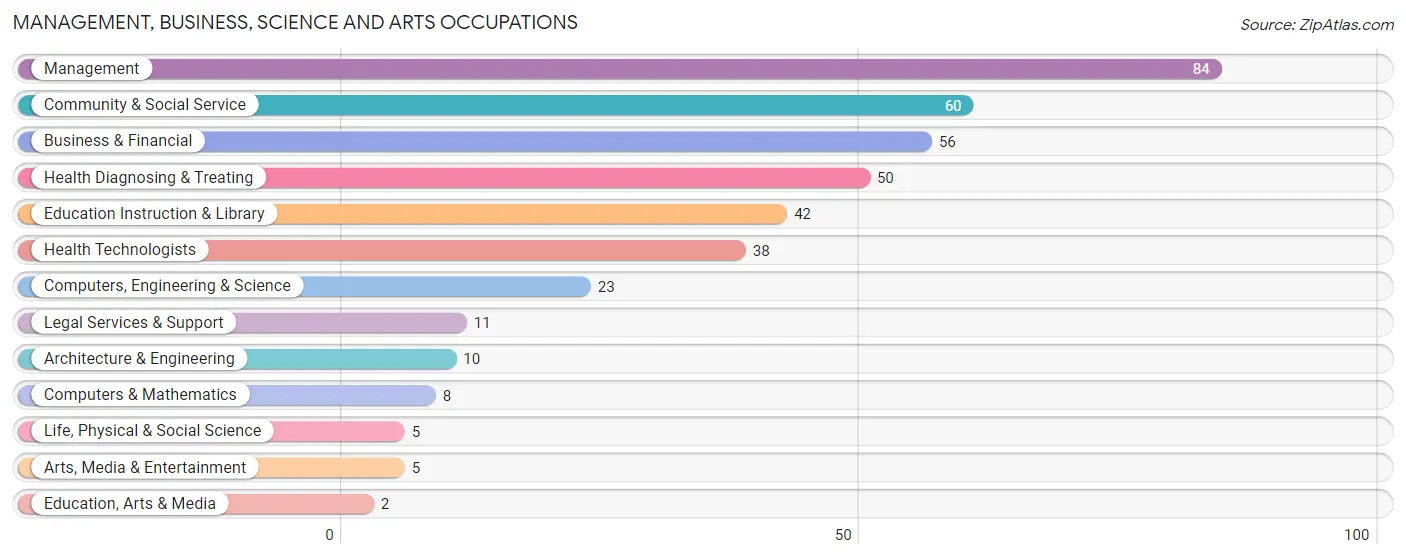
Management, Business, Science and Arts Occupations
The most common Management, Business, Science and Arts occupations in Genesee are Management (84 | 15.4%), Community & Social Service (60 | 11.0%), Business & Financial (56 | 10.3%), Health Diagnosing & Treating (50 | 9.2%), and Education Instruction & Library (42 | 7.7%).
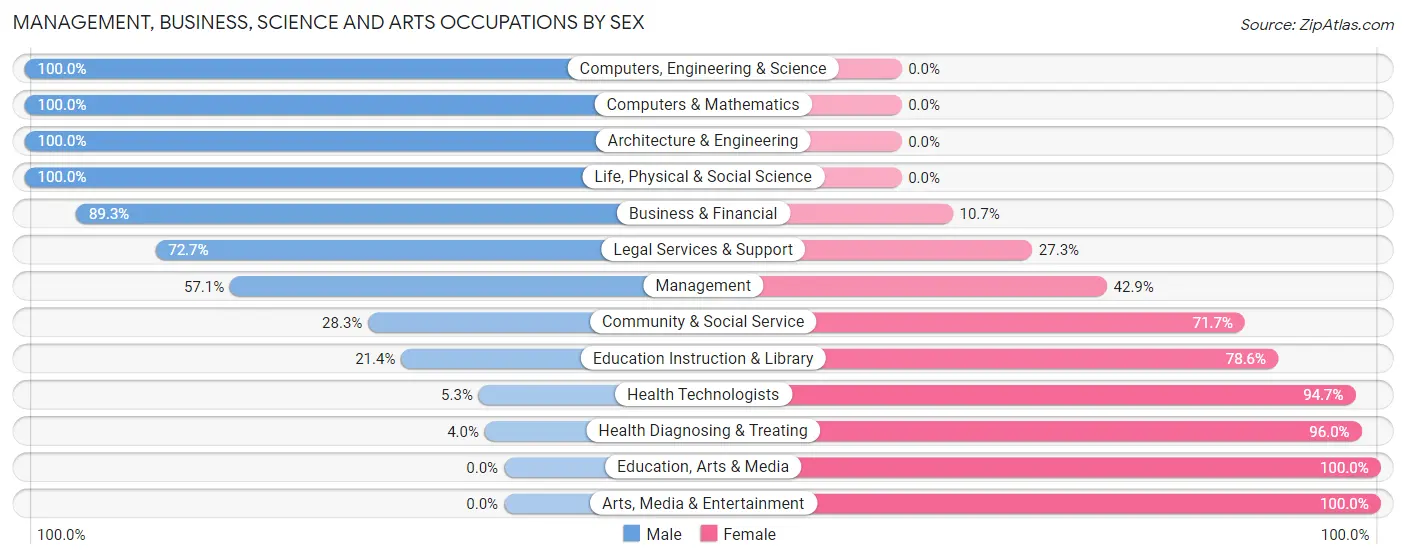
Management, Business, Science and Arts Occupations by Sex
Within the Management, Business, Science and Arts occupations in Genesee, the most male-oriented occupations are Computers, Engineering & Science (100.0%), Computers & Mathematics (100.0%), and Architecture & Engineering (100.0%), while the most female-oriented occupations are Education, Arts & Media (100.0%), Arts, Media & Entertainment (100.0%), and Health Diagnosing & Treating (96.0%).
| Occupation | Male | Female |
| Management | 48 (57.1%) | 36 (42.9%) |
| Business & Financial | 50 (89.3%) | 6 (10.7%) |
| Computers, Engineering & Science | 23 (100.0%) | 0 (0.0%) |
| Computers & Mathematics | 8 (100.0%) | 0 (0.0%) |
| Architecture & Engineering | 10 (100.0%) | 0 (0.0%) |
| Life, Physical & Social Science | 5 (100.0%) | 0 (0.0%) |
| Community & Social Service | 17 (28.3%) | 43 (71.7%) |
| Education, Arts & Media | 0 (0.0%) | 2 (100.0%) |
| Legal Services & Support | 8 (72.7%) | 3 (27.3%) |
| Education Instruction & Library | 9 (21.4%) | 33 (78.6%) |
| Arts, Media & Entertainment | 0 (0.0%) | 5 (100.0%) |
| Health Diagnosing & Treating | 2 (4.0%) | 48 (96.0%) |
| Health Technologists | 2 (5.3%) | 36 (94.7%) |
| Total (Category) | 140 (51.3%) | 133 (48.7%) |
| Total (Overall) | 294 (53.8%) | 252 (46.2%) |
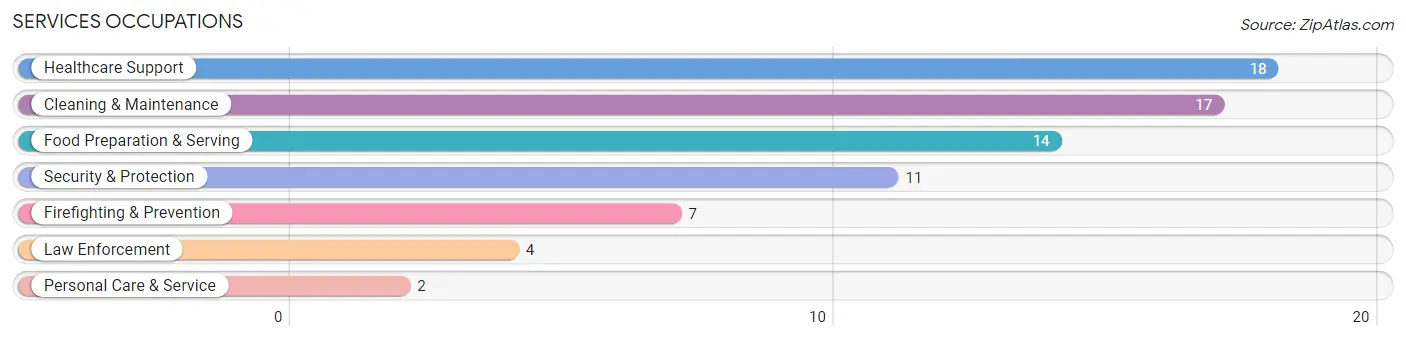
Services Occupations
The most common Services occupations in Genesee are Healthcare Support (18 | 3.3%), Cleaning & Maintenance (17 | 3.1%), Food Preparation & Serving (14 | 2.6%), Security & Protection (11 | 2.0%), and Firefighting & Prevention (7 | 1.3%).
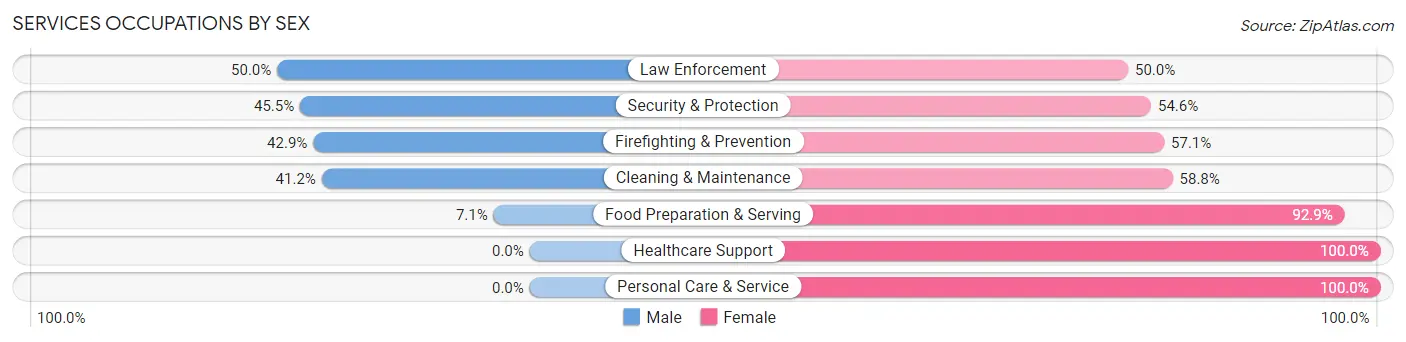
Services Occupations by Sex
Within the Services occupations in Genesee, the most male-oriented occupations are Law Enforcement (50.0%), Security & Protection (45.5%), and Firefighting & Prevention (42.9%), while the most female-oriented occupations are Healthcare Support (100.0%), Personal Care & Service (100.0%), and Food Preparation & Serving (92.9%).
| Occupation | Male | Female |
| Healthcare Support | 0 (0.0%) | 18 (100.0%) |
| Security & Protection | 5 (45.5%) | 6 (54.5%) |
| Firefighting & Prevention | 3 (42.9%) | 4 (57.1%) |
| Law Enforcement | 2 (50.0%) | 2 (50.0%) |
| Food Preparation & Serving | 1 (7.1%) | 13 (92.9%) |
| Cleaning & Maintenance | 7 (41.2%) | 10 (58.8%) |
| Personal Care & Service | 0 (0.0%) | 2 (100.0%) |
| Total (Category) | 13 (21.0%) | 49 (79.0%) |
| Total (Overall) | 294 (53.8%) | 252 (46.2%) |
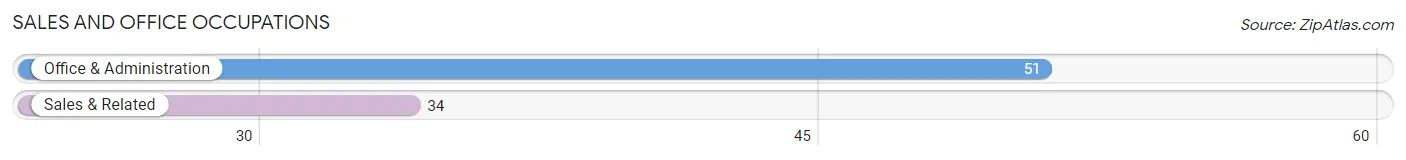
Sales and Office Occupations
The most common Sales and Office occupations in Genesee are Office & Administration (51 | 9.3%), and Sales & Related (34 | 6.2%).
Sales and Office Occupations by Sex
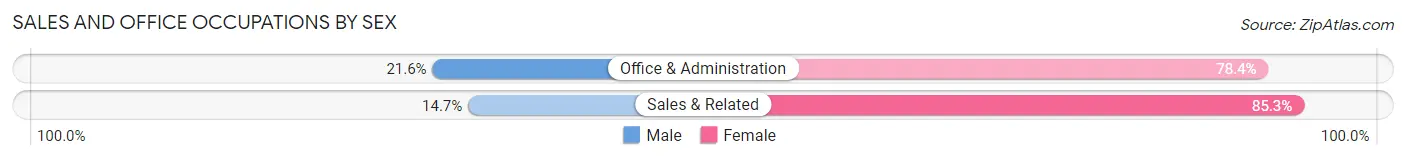
| Occupation | Male | Female |
| Sales & Related | 5 (14.7%) | 29 (85.3%) |
| Office & Administration | 11 (21.6%) | 40 (78.4%) |
| Total (Category) | 16 (18.8%) | 69 (81.2%) |
| Total (Overall) | 294 (53.8%) | 252 (46.2%) |
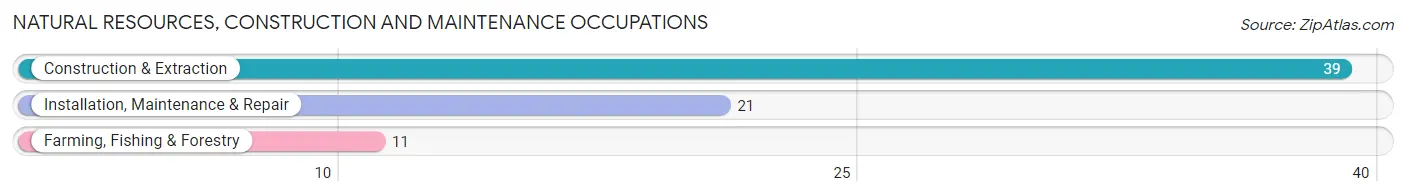
Natural Resources, Construction and Maintenance Occupations
The most common Natural Resources, Construction and Maintenance occupations in Genesee are Construction & Extraction (39 | 7.1%), Installation, Maintenance & Repair (21 | 3.8%), and Farming, Fishing & Forestry (11 | 2.0%).
Natural Resources, Construction and Maintenance Occupations by Sex
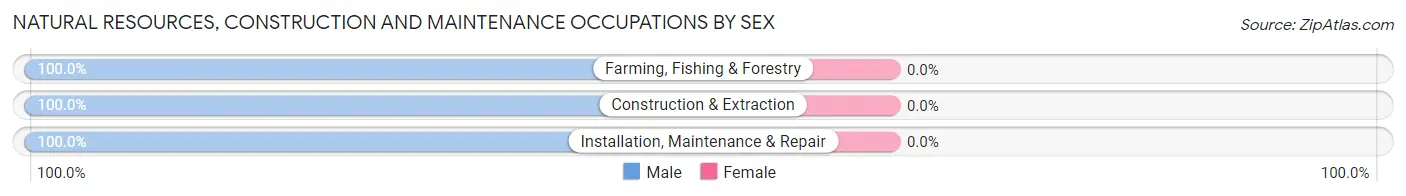
| Occupation | Male | Female |
| Farming, Fishing & Forestry | 11 (100.0%) | 0 (0.0%) |
| Construction & Extraction | 39 (100.0%) | 0 (0.0%) |
| Installation, Maintenance & Repair | 21 (100.0%) | 0 (0.0%) |
| Total (Category) | 71 (100.0%) | 0 (0.0%) |
| Total (Overall) | 294 (53.8%) | 252 (46.2%) |
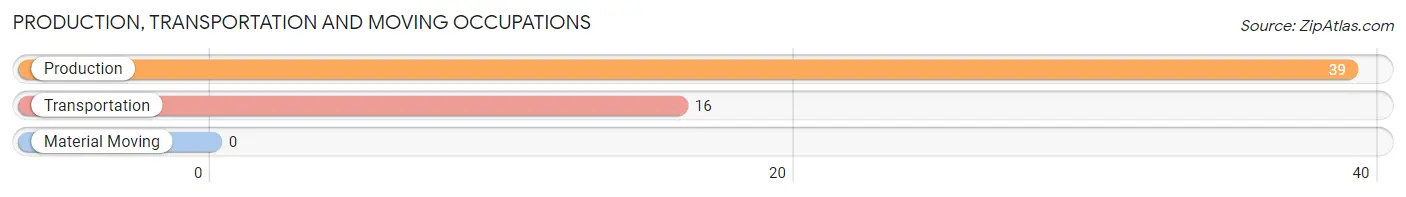
Production, Transportation and Moving Occupations
The most common Production, Transportation and Moving occupations in Genesee are Production (39 | 7.1%), and Transportation (16 | 2.9%).
Production, Transportation and Moving Occupations by Sex
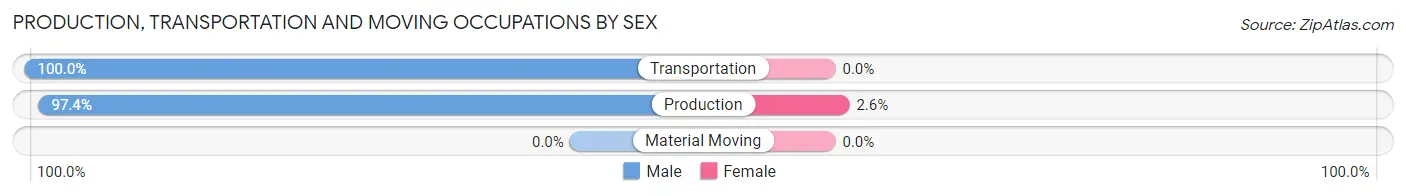
| Occupation | Male | Female |
| Production | 38 (97.4%) | 1 (2.6%) |
| Transportation | 16 (100.0%) | 0 (0.0%) |
| Material Moving | 0 (0.0%) | 0 (0.0%) |
| Total (Category) | 54 (98.2%) | 1 (1.8%) |
| Total (Overall) | 294 (53.8%) | 252 (46.2%) |
Employment Industries by Sex in Genesee
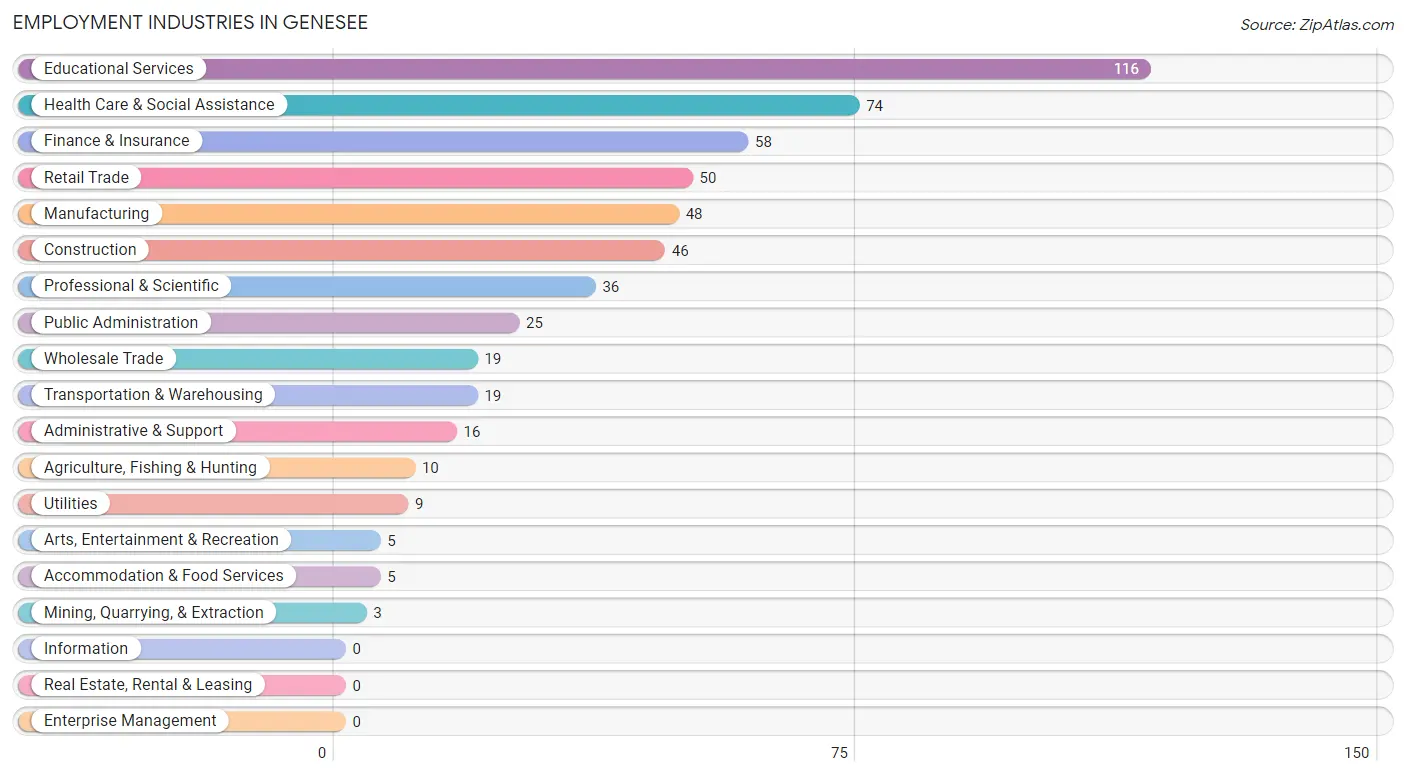
Employment Industries in Genesee
The major employment industries in Genesee include Educational Services (116 | 21.2%), Health Care & Social Assistance (74 | 13.6%), Finance & Insurance (58 | 10.6%), Retail Trade (50 | 9.2%), and Manufacturing (48 | 8.8%).
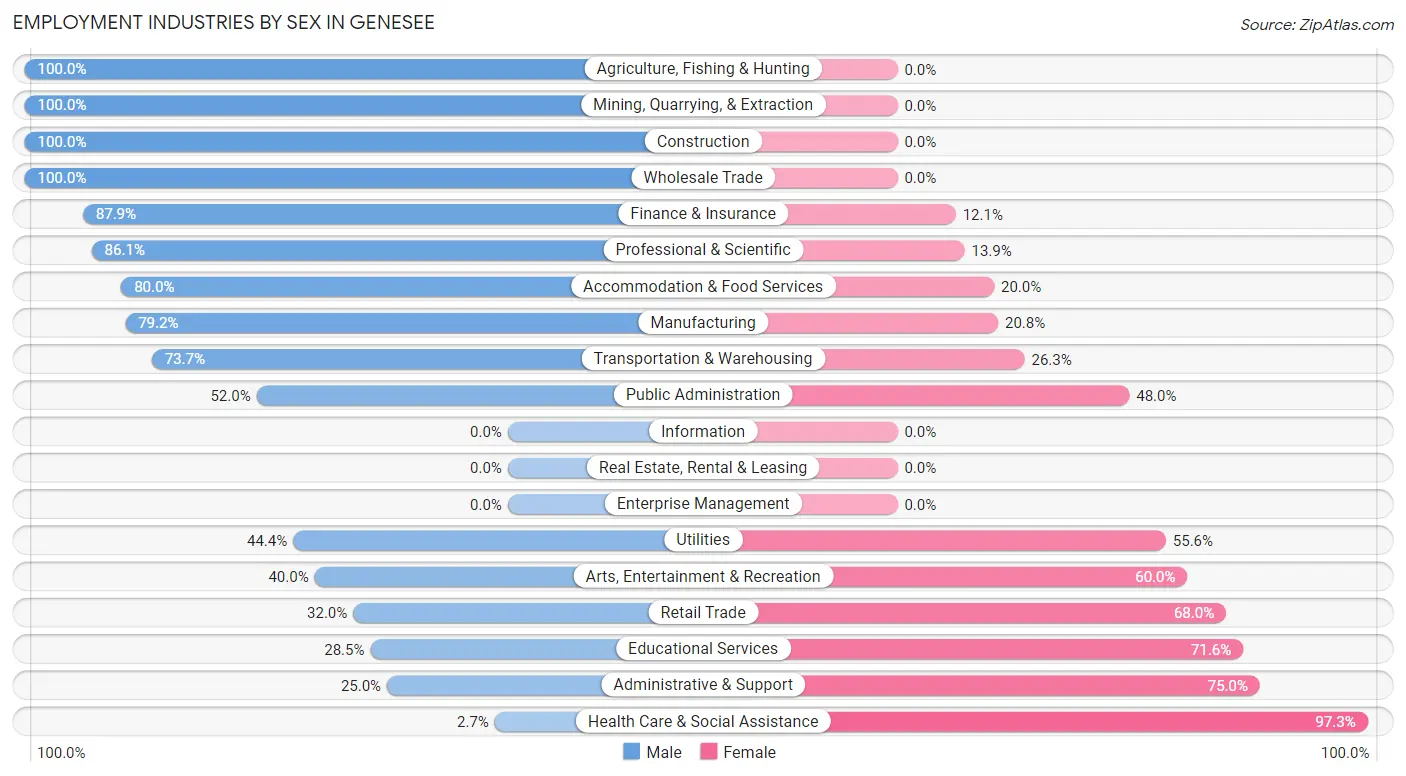
Employment Industries by Sex in Genesee
The Genesee industries that see more men than women are Agriculture, Fishing & Hunting (100.0%), Mining, Quarrying, & Extraction (100.0%), and Construction (100.0%), whereas the industries that tend to have a higher number of women are Health Care & Social Assistance (97.3%), Administrative & Support (75.0%), and Educational Services (71.6%).
| Industry | Male | Female |
| Agriculture, Fishing & Hunting | 10 (100.0%) | 0 (0.0%) |
| Mining, Quarrying, & Extraction | 3 (100.0%) | 0 (0.0%) |
| Construction | 46 (100.0%) | 0 (0.0%) |
| Manufacturing | 38 (79.2%) | 10 (20.8%) |
| Wholesale Trade | 19 (100.0%) | 0 (0.0%) |
| Retail Trade | 16 (32.0%) | 34 (68.0%) |
| Transportation & Warehousing | 14 (73.7%) | 5 (26.3%) |
| Utilities | 4 (44.4%) | 5 (55.6%) |
| Information | 0 (0.0%) | 0 (0.0%) |
| Finance & Insurance | 51 (87.9%) | 7 (12.1%) |
| Real Estate, Rental & Leasing | 0 (0.0%) | 0 (0.0%) |
| Professional & Scientific | 31 (86.1%) | 5 (13.9%) |
| Enterprise Management | 0 (0.0%) | 0 (0.0%) |
| Administrative & Support | 4 (25.0%) | 12 (75.0%) |
| Educational Services | 33 (28.4%) | 83 (71.6%) |
| Health Care & Social Assistance | 2 (2.7%) | 72 (97.3%) |
| Arts, Entertainment & Recreation | 2 (40.0%) | 3 (60.0%) |
| Accommodation & Food Services | 4 (80.0%) | 1 (20.0%) |
| Public Administration | 13 (52.0%) | 12 (48.0%) |
| Total | 294 (53.8%) | 252 (46.2%) |
Education in Genesee
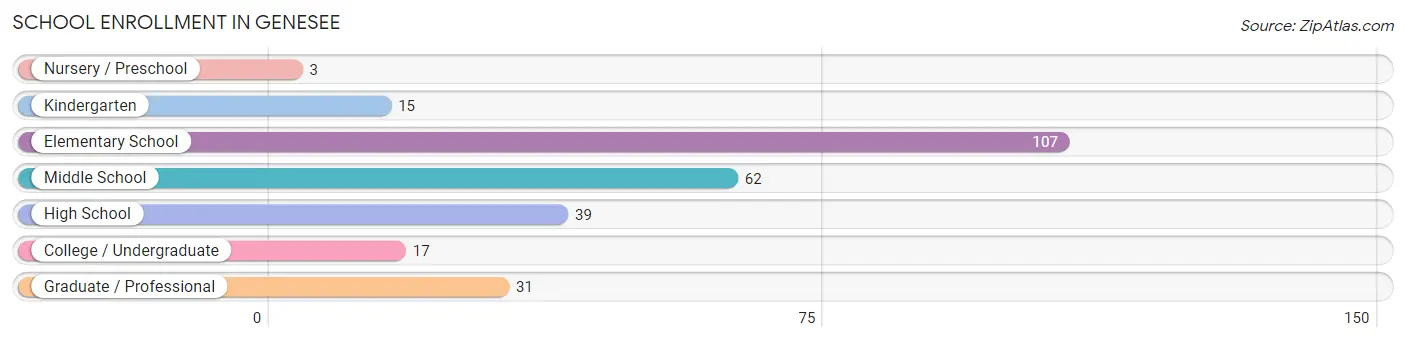
School Enrollment in Genesee
The most common levels of schooling among the 274 students in Genesee are elementary school (107 | 39.1%), middle school (62 | 22.6%), and high school (39 | 14.2%).
| School Level | # Students | % Students |
| Nursery / Preschool | 3 | 1.1% |
| Kindergarten | 15 | 5.5% |
| Elementary School | 107 | 39.1% |
| Middle School | 62 | 22.6% |
| High School | 39 | 14.2% |
| College / Undergraduate | 17 | 6.2% |
| Graduate / Professional | 31 | 11.3% |
| Total | 274 | 100.0% |
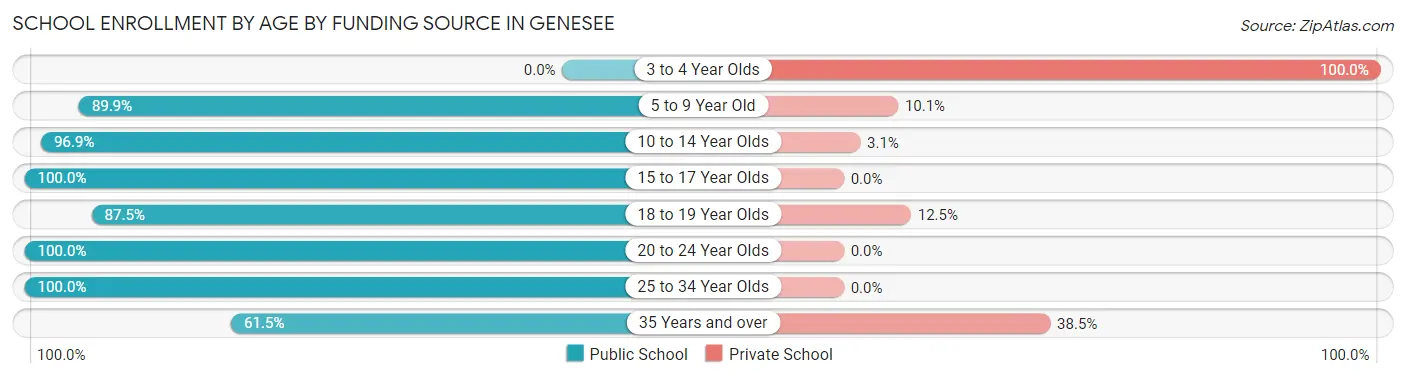
School Enrollment by Age by Funding Source in Genesee
Out of a total of 274 students who are enrolled in schools in Genesee, 25 (9.1%) attend a private institution, while the remaining 249 (90.9%) are enrolled in public schools. The age group of 3 to 4 year olds has the highest likelihood of being enrolled in private schools, with 2 (100.0% in the age bracket) enrolled. Conversely, the age group of 15 to 17 year olds has the lowest likelihood of being enrolled in a private school, with 33 (100.0% in the age bracket) attending a public institution.
| Age Bracket | Public School | Private School |
| 3 to 4 Year Olds | 0 (0.0%) | 2 (100.0%) |
| 5 to 9 Year Old | 80 (89.9%) | 9 (10.1%) |
| 10 to 14 Year Olds | 95 (96.9%) | 3 (3.1%) |
| 15 to 17 Year Olds | 33 (100.0%) | 0 (0.0%) |
| 18 to 19 Year Olds | 7 (87.5%) | 1 (12.5%) |
| 20 to 24 Year Olds | 9 (100.0%) | 0 (0.0%) |
| 25 to 34 Year Olds | 9 (100.0%) | 0 (0.0%) |
| 35 Years and over | 16 (61.5%) | 10 (38.5%) |
| Total | 249 (90.9%) | 25 (9.1%) |
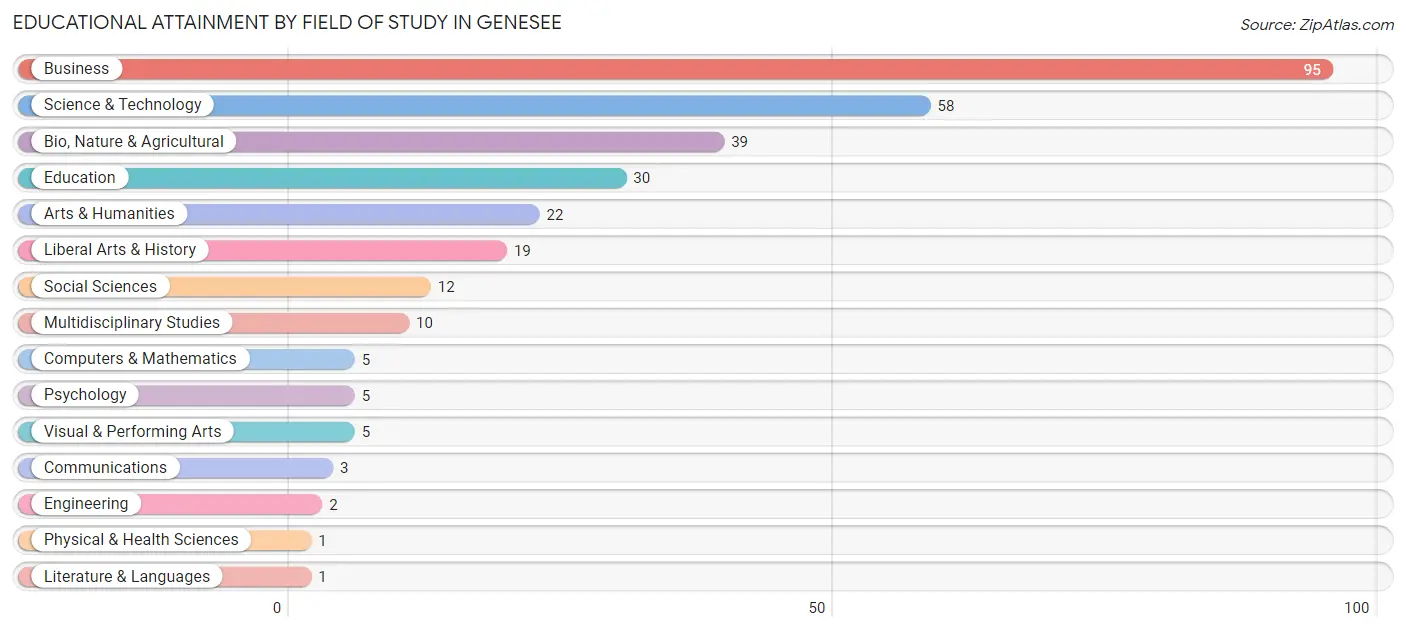
Educational Attainment by Field of Study in Genesee
Business (95 | 30.9%), science & technology (58 | 18.9%), bio, nature & agricultural (39 | 12.7%), education (30 | 9.8%), and arts & humanities (22 | 7.2%) are the most common fields of study among 307 individuals in Genesee who have obtained a bachelor's degree or higher.
| Field of Study | # Graduates | % Graduates |
| Computers & Mathematics | 5 | 1.6% |
| Bio, Nature & Agricultural | 39 | 12.7% |
| Physical & Health Sciences | 1 | 0.3% |
| Psychology | 5 | 1.6% |
| Social Sciences | 12 | 3.9% |
| Engineering | 2 | 0.6% |
| Multidisciplinary Studies | 10 | 3.3% |
| Science & Technology | 58 | 18.9% |
| Business | 95 | 30.9% |
| Education | 30 | 9.8% |
| Literature & Languages | 1 | 0.3% |
| Liberal Arts & History | 19 | 6.2% |
| Visual & Performing Arts | 5 | 1.6% |
| Communications | 3 | 1.0% |
| Arts & Humanities | 22 | 7.2% |
| Total | 307 | 100.0% |
Transportation & Commute in Genesee
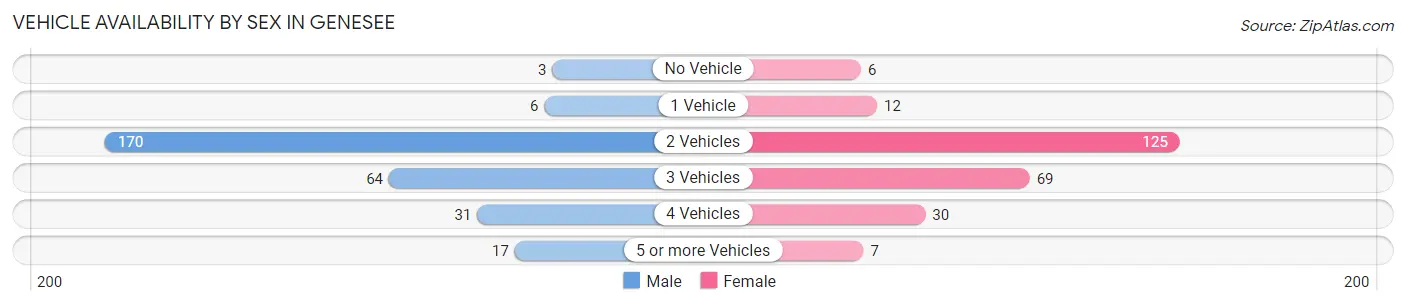
Vehicle Availability by Sex in Genesee
The most prevalent vehicle ownership categories in Genesee are males with 2 vehicles (170, accounting for 58.4%) and females with 2 vehicles (125, making up 68.3%).
| Vehicles Available | Male | Female |
| No Vehicle | 3 (1.0%) | 6 (2.4%) |
| 1 Vehicle | 6 (2.1%) | 12 (4.8%) |
| 2 Vehicles | 170 (58.4%) | 125 (50.2%) |
| 3 Vehicles | 64 (22.0%) | 69 (27.7%) |
| 4 Vehicles | 31 (10.6%) | 30 (12.0%) |
| 5 or more Vehicles | 17 (5.8%) | 7 (2.8%) |
| Total | 291 (100.0%) | 249 (100.0%) |
Commute Time in Genesee
The most frequently occuring commute durations in Genesee are 30 to 34 minutes (150 commuters, 28.5%), 20 to 24 minutes (129 commuters, 24.5%), and 25 to 29 minutes (75 commuters, 14.2%).
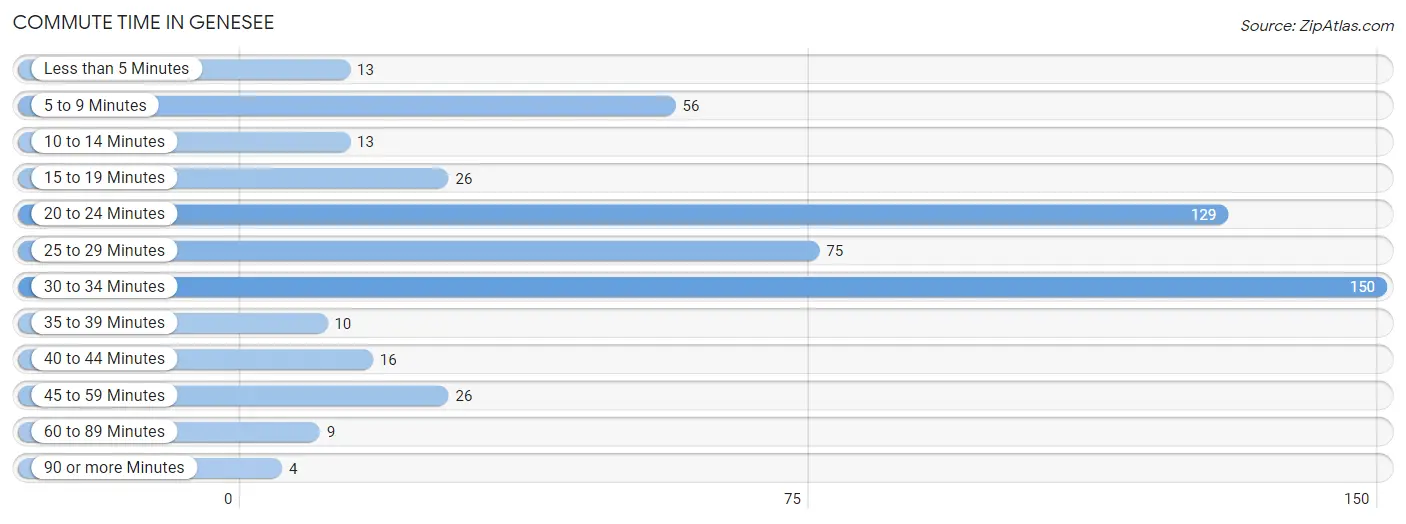
| Commute Time | # Commuters | % Commuters |
| Less than 5 Minutes | 13 | 2.5% |
| 5 to 9 Minutes | 56 | 10.6% |
| 10 to 14 Minutes | 13 | 2.5% |
| 15 to 19 Minutes | 26 | 4.9% |
| 20 to 24 Minutes | 129 | 24.5% |
| 25 to 29 Minutes | 75 | 14.2% |
| 30 to 34 Minutes | 150 | 28.5% |
| 35 to 39 Minutes | 10 | 1.9% |
| 40 to 44 Minutes | 16 | 3.0% |
| 45 to 59 Minutes | 26 | 4.9% |
| 60 to 89 Minutes | 9 | 1.7% |
| 90 or more Minutes | 4 | 0.8% |
Commute Time by Sex in Genesee
The most common commute times in Genesee are 30 to 34 minutes (97 commuters, 34.3%) for males and 20 to 24 minutes (82 commuters, 33.6%) for females.
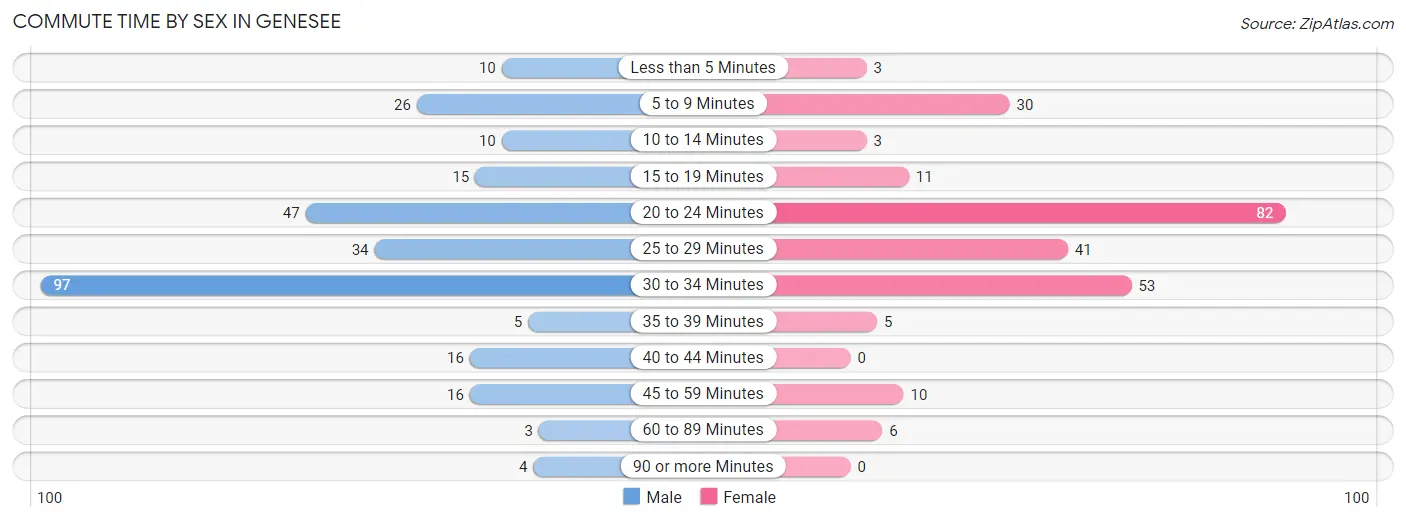
| Commute Time | Male | Female |
| Less than 5 Minutes | 10 (3.5%) | 3 (1.2%) |
| 5 to 9 Minutes | 26 (9.2%) | 30 (12.3%) |
| 10 to 14 Minutes | 10 (3.5%) | 3 (1.2%) |
| 15 to 19 Minutes | 15 (5.3%) | 11 (4.5%) |
| 20 to 24 Minutes | 47 (16.6%) | 82 (33.6%) |
| 25 to 29 Minutes | 34 (12.0%) | 41 (16.8%) |
| 30 to 34 Minutes | 97 (34.3%) | 53 (21.7%) |
| 35 to 39 Minutes | 5 (1.8%) | 5 (2.1%) |
| 40 to 44 Minutes | 16 (5.7%) | 0 (0.0%) |
| 45 to 59 Minutes | 16 (5.7%) | 10 (4.1%) |
| 60 to 89 Minutes | 3 (1.1%) | 6 (2.5%) |
| 90 or more Minutes | 4 (1.4%) | 0 (0.0%) |
Time of Departure to Work by Sex in Genesee
The most frequent times of departure to work in Genesee are 8:00 AM to 8:29 AM (58, 20.5%) for males and 7:00 AM to 7:29 AM (45, 18.4%) for females.
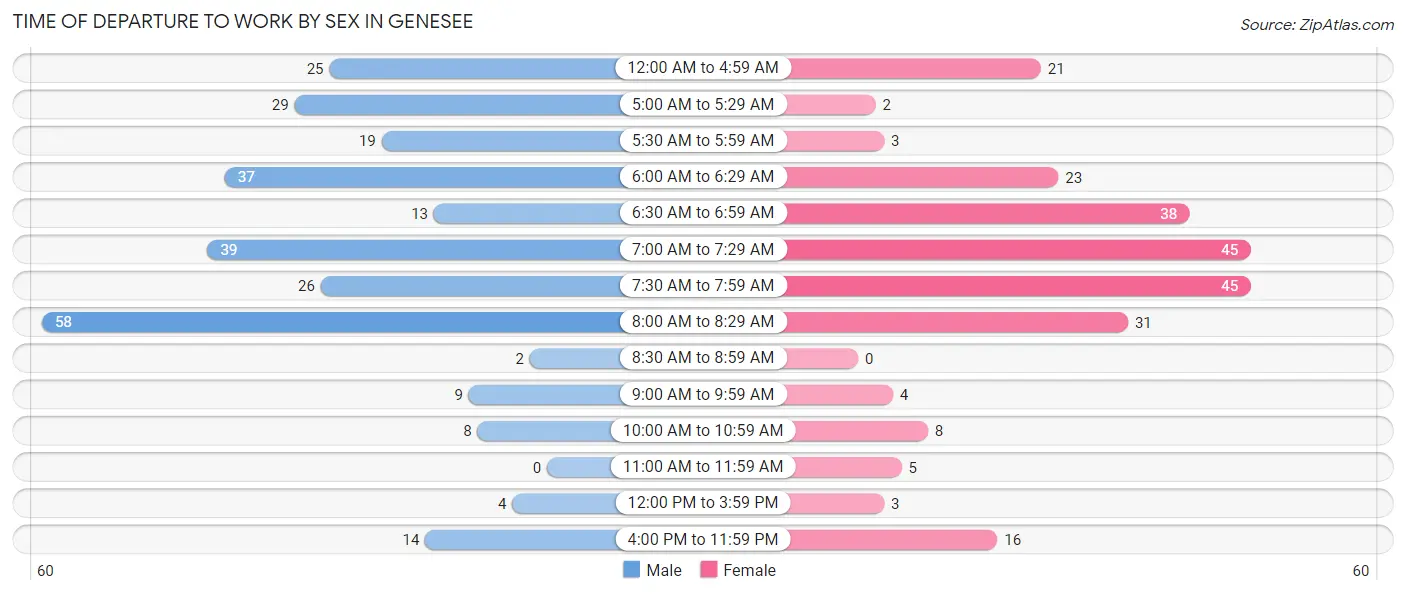
| Time of Departure | Male | Female |
| 12:00 AM to 4:59 AM | 25 (8.8%) | 21 (8.6%) |
| 5:00 AM to 5:29 AM | 29 (10.2%) | 2 (0.8%) |
| 5:30 AM to 5:59 AM | 19 (6.7%) | 3 (1.2%) |
| 6:00 AM to 6:29 AM | 37 (13.1%) | 23 (9.4%) |
| 6:30 AM to 6:59 AM | 13 (4.6%) | 38 (15.6%) |
| 7:00 AM to 7:29 AM | 39 (13.8%) | 45 (18.4%) |
| 7:30 AM to 7:59 AM | 26 (9.2%) | 45 (18.4%) |
| 8:00 AM to 8:29 AM | 58 (20.5%) | 31 (12.7%) |
| 8:30 AM to 8:59 AM | 2 (0.7%) | 0 (0.0%) |
| 9:00 AM to 9:59 AM | 9 (3.2%) | 4 (1.6%) |
| 10:00 AM to 10:59 AM | 8 (2.8%) | 8 (3.3%) |
| 11:00 AM to 11:59 AM | 0 (0.0%) | 5 (2.1%) |
| 12:00 PM to 3:59 PM | 4 (1.4%) | 3 (1.2%) |
| 4:00 PM to 11:59 PM | 14 (5.0%) | 16 (6.6%) |
| Total | 283 (100.0%) | 244 (100.0%) |
Housing Occupancy in Genesee
Occupancy by Ownership in Genesee
Of the total 471 dwellings in Genesee, owner-occupied units account for 434 (92.1%), while renter-occupied units make up 37 (7.9%).
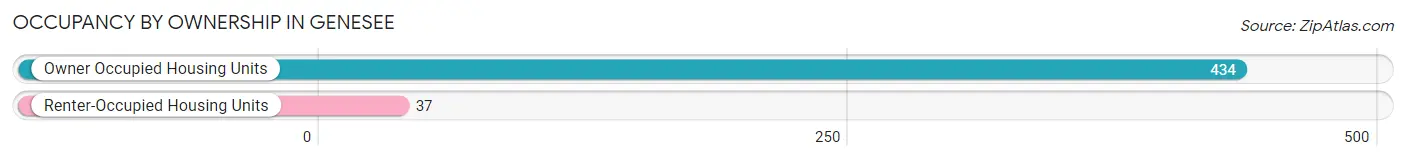
| Occupancy | # Housing Units | % Housing Units |
| Owner Occupied Housing Units | 434 | 92.1% |
| Renter-Occupied Housing Units | 37 | 7.9% |
| Total Occupied Housing Units | 471 | 100.0% |
Occupancy by Household Size in Genesee
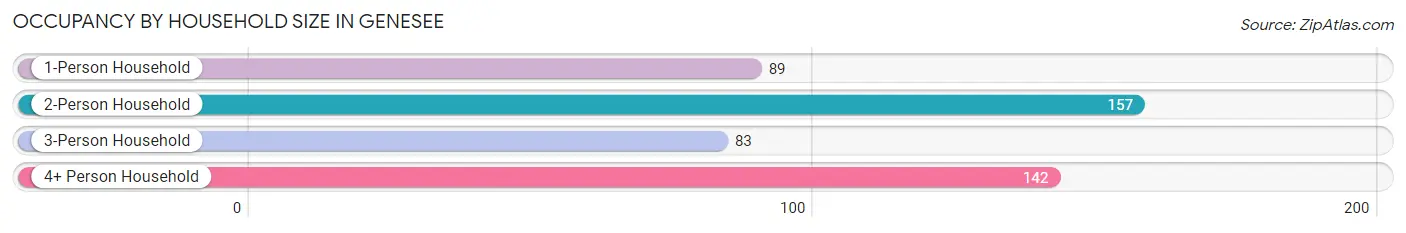
| Household Size | # Housing Units | % Housing Units |
| 1-Person Household | 89 | 18.9% |
| 2-Person Household | 157 | 33.3% |
| 3-Person Household | 83 | 17.6% |
| 4+ Person Household | 142 | 30.1% |
| Total Housing Units | 471 | 100.0% |
Occupancy by Ownership by Household Size in Genesee
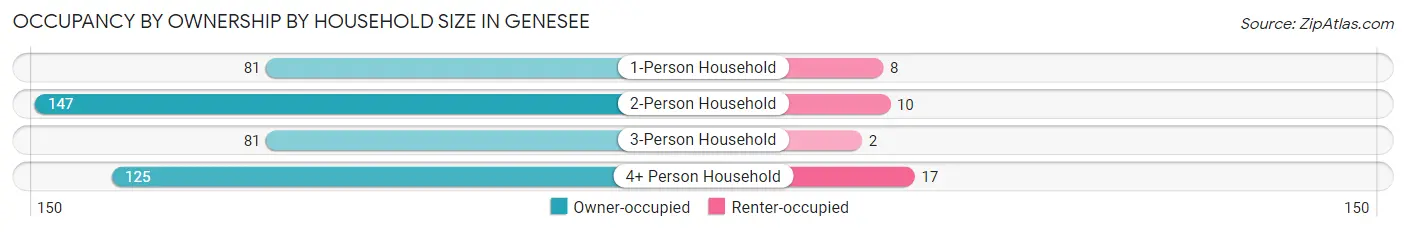
| Household Size | Owner-occupied | Renter-occupied |
| 1-Person Household | 81 (91.0%) | 8 (9.0%) |
| 2-Person Household | 147 (93.6%) | 10 (6.4%) |
| 3-Person Household | 81 (97.6%) | 2 (2.4%) |
| 4+ Person Household | 125 (88.0%) | 17 (12.0%) |
| Total Housing Units | 434 (92.1%) | 37 (7.9%) |
Occupancy by Educational Attainment in Genesee
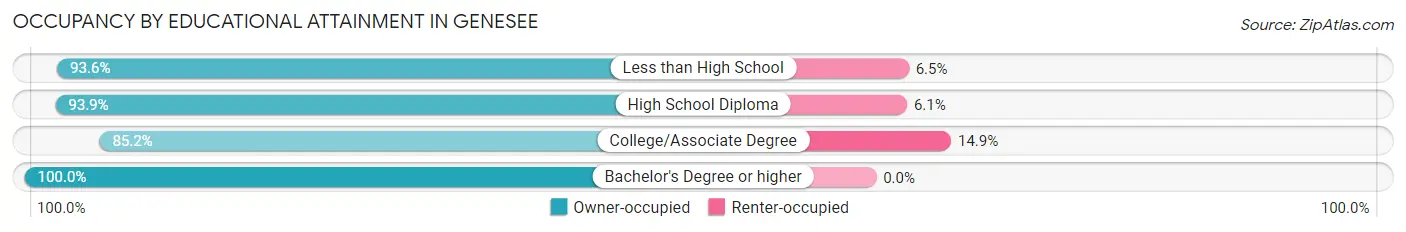
| Household Size | Owner-occupied | Renter-occupied |
| Less than High School | 29 (93.5%) | 2 (6.5%) |
| High School Diploma | 77 (93.9%) | 5 (6.1%) |
| College/Associate Degree | 172 (85.2%) | 30 (14.8%) |
| Bachelor's Degree or higher | 156 (100.0%) | 0 (0.0%) |
Occupancy by Age of Householder in Genesee
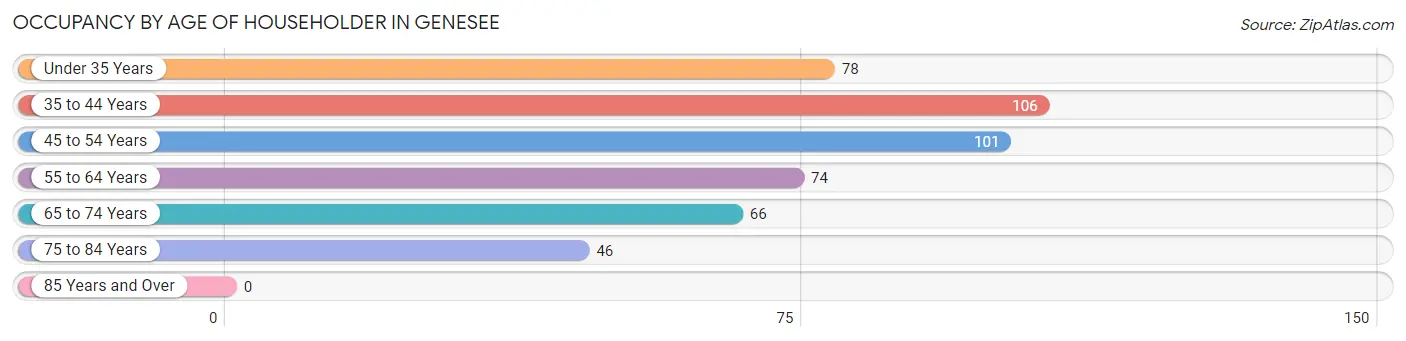
| Age Bracket | # Households | % Households |
| Under 35 Years | 78 | 16.6% |
| 35 to 44 Years | 106 | 22.5% |
| 45 to 54 Years | 101 | 21.4% |
| 55 to 64 Years | 74 | 15.7% |
| 65 to 74 Years | 66 | 14.0% |
| 75 to 84 Years | 46 | 9.8% |
| 85 Years and Over | 0 | 0.0% |
| Total | 471 | 100.0% |
Housing Finances in Genesee
Median Income by Occupancy in Genesee
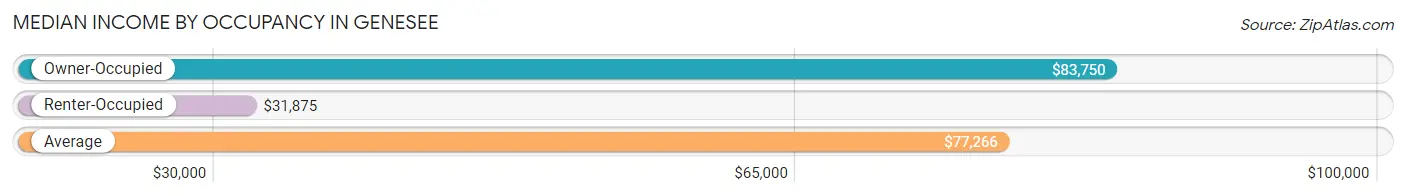
| Occupancy Type | # Households | Median Income |
| Owner-Occupied | 434 (92.1%) | $83,750 |
| Renter-Occupied | 37 (7.9%) | $31,875 |
| Average | 471 (100.0%) | $77,266 |
Occupancy by Householder Income Bracket in Genesee
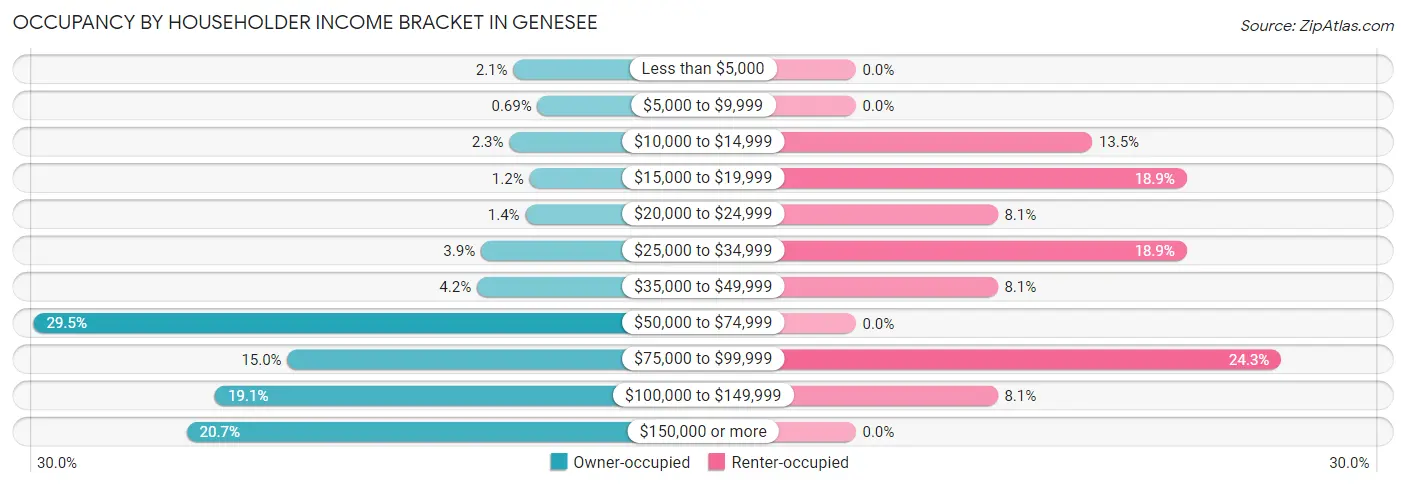
| Income Bracket | Owner-occupied | Renter-occupied |
| Less than $5,000 | 9 (2.1%) | 0 (0.0%) |
| $5,000 to $9,999 | 3 (0.7%) | 0 (0.0%) |
| $10,000 to $14,999 | 10 (2.3%) | 5 (13.5%) |
| $15,000 to $19,999 | 5 (1.1%) | 7 (18.9%) |
| $20,000 to $24,999 | 6 (1.4%) | 3 (8.1%) |
| $25,000 to $34,999 | 17 (3.9%) | 7 (18.9%) |
| $35,000 to $49,999 | 18 (4.2%) | 3 (8.1%) |
| $50,000 to $74,999 | 128 (29.5%) | 0 (0.0%) |
| $75,000 to $99,999 | 65 (15.0%) | 9 (24.3%) |
| $100,000 to $149,999 | 83 (19.1%) | 3 (8.1%) |
| $150,000 or more | 90 (20.7%) | 0 (0.0%) |
| Total | 434 (100.0%) | 37 (100.0%) |
Monthly Housing Cost Tiers in Genesee
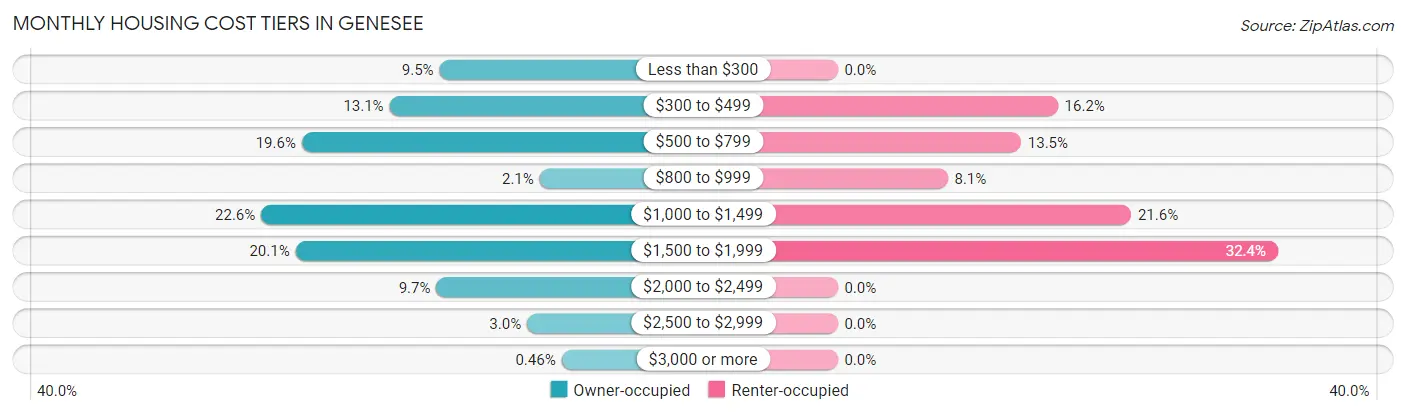
| Monthly Cost | Owner-occupied | Renter-occupied |
| Less than $300 | 41 (9.5%) | 0 (0.0%) |
| $300 to $499 | 57 (13.1%) | 6 (16.2%) |
| $500 to $799 | 85 (19.6%) | 5 (13.5%) |
| $800 to $999 | 9 (2.1%) | 3 (8.1%) |
| $1,000 to $1,499 | 98 (22.6%) | 8 (21.6%) |
| $1,500 to $1,999 | 87 (20.1%) | 12 (32.4%) |
| $2,000 to $2,499 | 42 (9.7%) | 0 (0.0%) |
| $2,500 to $2,999 | 13 (3.0%) | 0 (0.0%) |
| $3,000 or more | 2 (0.5%) | 0 (0.0%) |
| Total | 434 (100.0%) | 37 (100.0%) |
Physical Housing Characteristics in Genesee
Housing Structures in Genesee
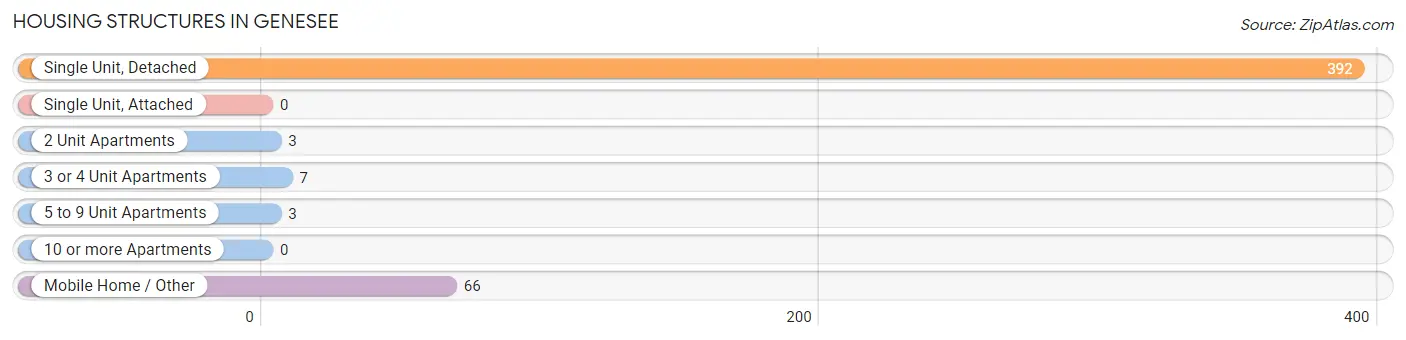
| Structure Type | # Housing Units | % Housing Units |
| Single Unit, Detached | 392 | 83.2% |
| Single Unit, Attached | 0 | 0.0% |
| 2 Unit Apartments | 3 | 0.6% |
| 3 or 4 Unit Apartments | 7 | 1.5% |
| 5 to 9 Unit Apartments | 3 | 0.6% |
| 10 or more Apartments | 0 | 0.0% |
| Mobile Home / Other | 66 | 14.0% |
| Total | 471 | 100.0% |
Housing Structures by Occupancy in Genesee
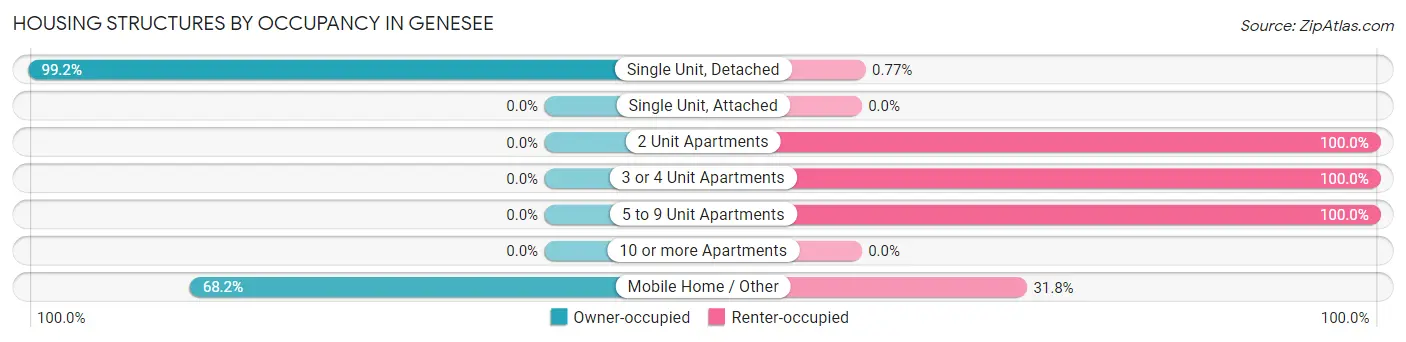
| Structure Type | Owner-occupied | Renter-occupied |
| Single Unit, Detached | 389 (99.2%) | 3 (0.8%) |
| Single Unit, Attached | 0 (0.0%) | 0 (0.0%) |
| 2 Unit Apartments | 0 (0.0%) | 3 (100.0%) |
| 3 or 4 Unit Apartments | 0 (0.0%) | 7 (100.0%) |
| 5 to 9 Unit Apartments | 0 (0.0%) | 3 (100.0%) |
| 10 or more Apartments | 0 (0.0%) | 0 (0.0%) |
| Mobile Home / Other | 45 (68.2%) | 21 (31.8%) |
| Total | 434 (92.1%) | 37 (7.9%) |
Housing Structures by Number of Rooms in Genesee
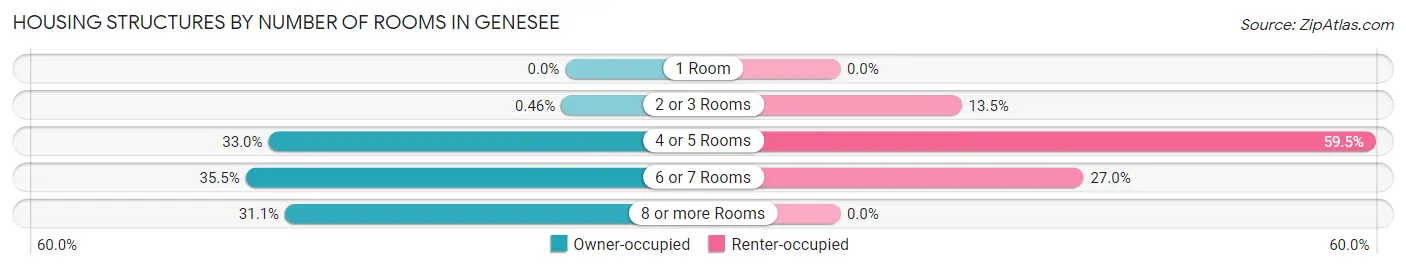
| Number of Rooms | Owner-occupied | Renter-occupied |
| 1 Room | 0 (0.0%) | 0 (0.0%) |
| 2 or 3 Rooms | 2 (0.5%) | 5 (13.5%) |
| 4 or 5 Rooms | 143 (33.0%) | 22 (59.5%) |
| 6 or 7 Rooms | 154 (35.5%) | 10 (27.0%) |
| 8 or more Rooms | 135 (31.1%) | 0 (0.0%) |
| Total | 434 (100.0%) | 37 (100.0%) |
Housing Structure by Heating Type in Genesee
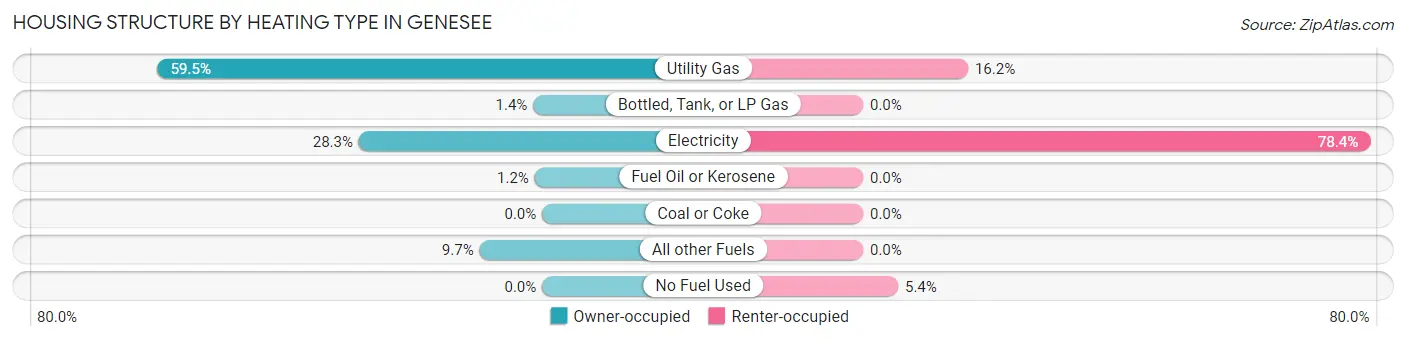
| Heating Type | Owner-occupied | Renter-occupied |
| Utility Gas | 258 (59.5%) | 6 (16.2%) |
| Bottled, Tank, or LP Gas | 6 (1.4%) | 0 (0.0%) |
| Electricity | 123 (28.3%) | 29 (78.4%) |
| Fuel Oil or Kerosene | 5 (1.1%) | 0 (0.0%) |
| Coal or Coke | 0 (0.0%) | 0 (0.0%) |
| All other Fuels | 42 (9.7%) | 0 (0.0%) |
| No Fuel Used | 0 (0.0%) | 2 (5.4%) |
| Total | 434 (100.0%) | 37 (100.0%) |
Household Vehicle Usage in Genesee
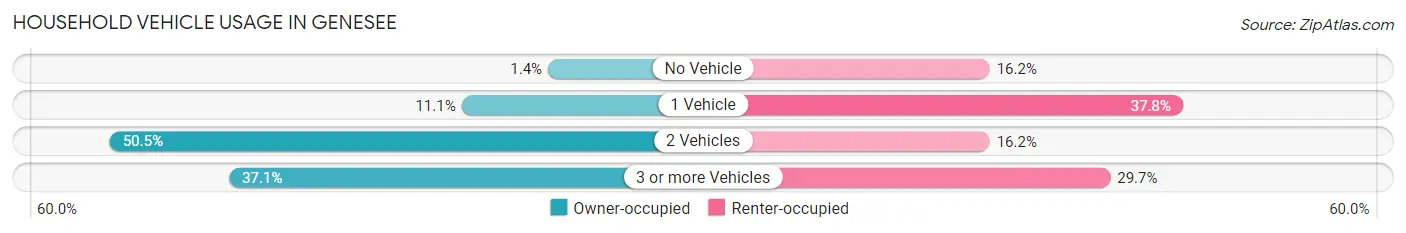
| Vehicles per Household | Owner-occupied | Renter-occupied |
| No Vehicle | 6 (1.4%) | 6 (16.2%) |
| 1 Vehicle | 48 (11.1%) | 14 (37.8%) |
| 2 Vehicles | 219 (50.5%) | 6 (16.2%) |
| 3 or more Vehicles | 161 (37.1%) | 11 (29.7%) |
| Total | 434 (100.0%) | 37 (100.0%) |
Real Estate & Mortgages in Genesee
Real Estate and Mortgage Overview in Genesee
| Characteristic | Without Mortgage | With Mortgage |
| Housing Units | 143 | 291 |
| Median Property Value | $211,000 | $280,100 |
| Median Household Income | $73,125 | $78 |
| Monthly Housing Costs | $377 | $2 |
| Real Estate Taxes | $1,301 | $2 |
Property Value by Mortgage Status in Genesee
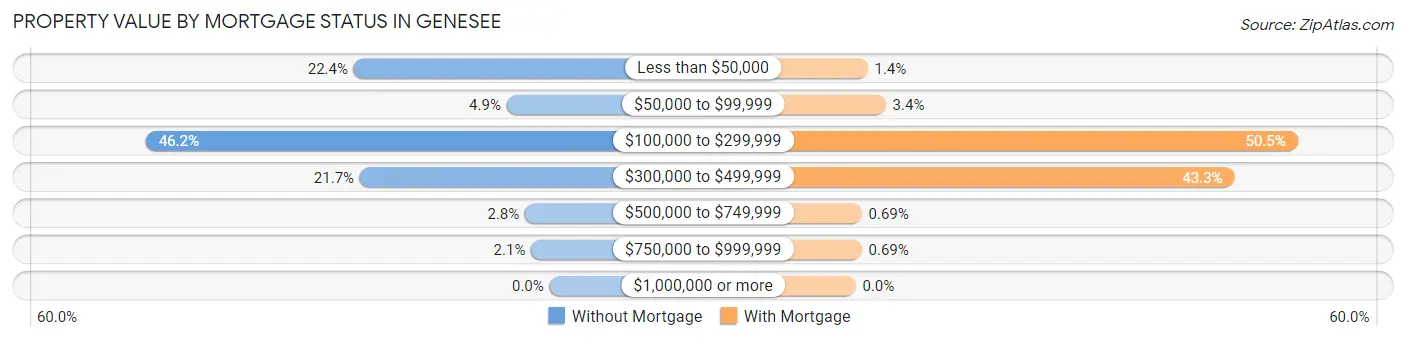
| Property Value | Without Mortgage | With Mortgage |
| Less than $50,000 | 32 (22.4%) | 4 (1.4%) |
| $50,000 to $99,999 | 7 (4.9%) | 10 (3.4%) |
| $100,000 to $299,999 | 66 (46.2%) | 147 (50.5%) |
| $300,000 to $499,999 | 31 (21.7%) | 126 (43.3%) |
| $500,000 to $749,999 | 4 (2.8%) | 2 (0.7%) |
| $750,000 to $999,999 | 3 (2.1%) | 2 (0.7%) |
| $1,000,000 or more | 0 (0.0%) | 0 (0.0%) |
| Total | 143 (100.0%) | 291 (100.0%) |
Household Income by Mortgage Status in Genesee
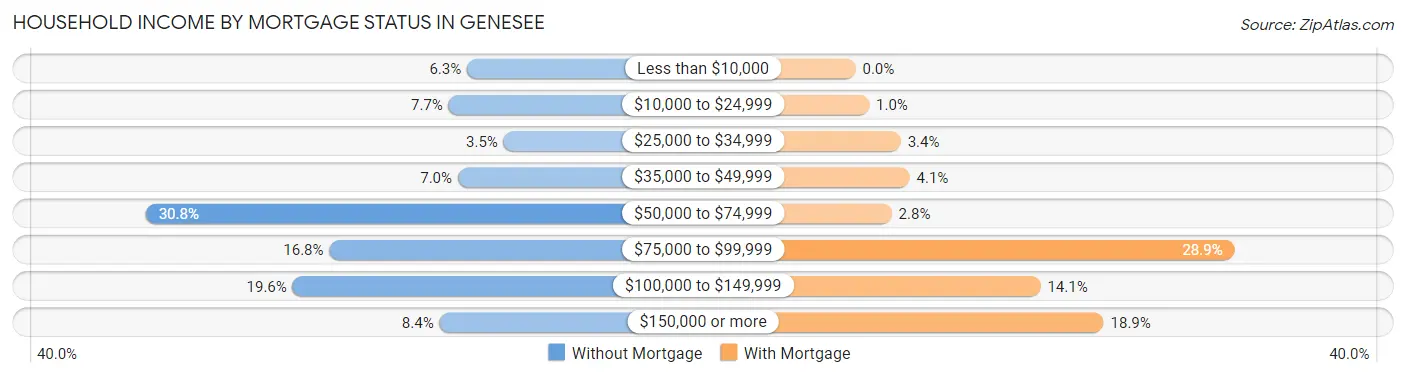
| Household Income | Without Mortgage | With Mortgage |
| Less than $10,000 | 9 (6.3%) | 0 (0.0%) |
| $10,000 to $24,999 | 11 (7.7%) | 3 (1.0%) |
| $25,000 to $34,999 | 5 (3.5%) | 10 (3.4%) |
| $35,000 to $49,999 | 10 (7.0%) | 12 (4.1%) |
| $50,000 to $74,999 | 44 (30.8%) | 8 (2.8%) |
| $75,000 to $99,999 | 24 (16.8%) | 84 (28.9%) |
| $100,000 to $149,999 | 28 (19.6%) | 41 (14.1%) |
| $150,000 or more | 12 (8.4%) | 55 (18.9%) |
| Total | 143 (100.0%) | 291 (100.0%) |
Property Value to Household Income Ratio in Genesee
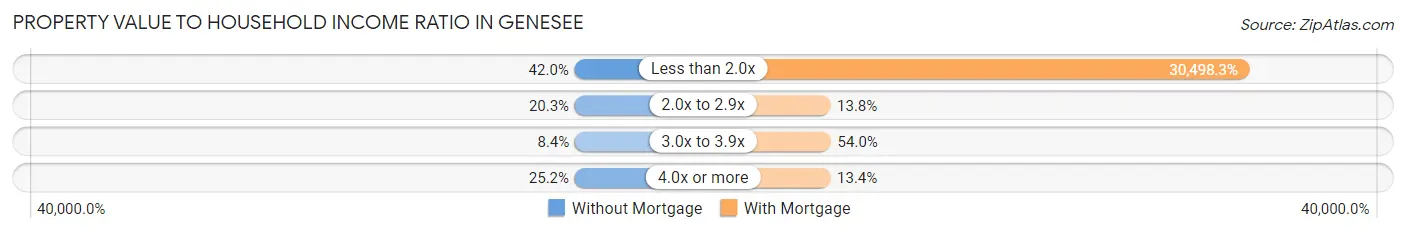
| Value-to-Income Ratio | Without Mortgage | With Mortgage |
| Less than 2.0x | 60 (42.0%) | 88,750 (30,498.3%) |
| 2.0x to 2.9x | 29 (20.3%) | 40 (13.8%) |
| 3.0x to 3.9x | 12 (8.4%) | 157 (53.9%) |
| 4.0x or more | 36 (25.2%) | 39 (13.4%) |
| Total | 143 (100.0%) | 291 (100.0%) |
Real Estate Taxes by Mortgage Status in Genesee
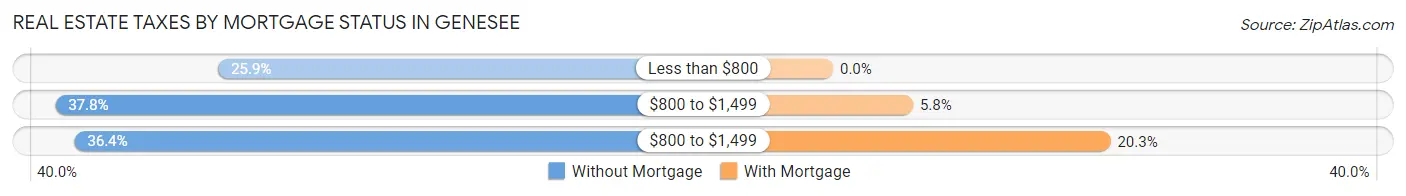
| Property Taxes | Without Mortgage | With Mortgage |
| Less than $800 | 37 (25.9%) | 0 (0.0%) |
| $800 to $1,499 | 54 (37.8%) | 17 (5.8%) |
| $800 to $1,499 | 52 (36.4%) | 59 (20.3%) |
| Total | 143 (100.0%) | 291 (100.0%) |
Health & Disability in Genesee
Health Insurance Coverage by Age in Genesee
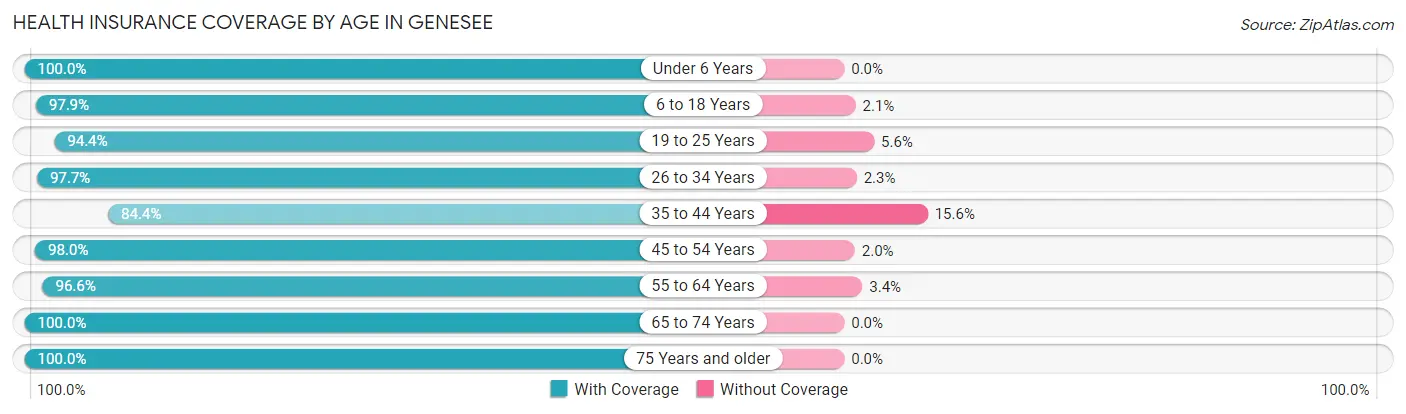
| Age Bracket | With Coverage | Without Coverage |
| Under 6 Years | 129 (100.0%) | 0 (0.0%) |
| 6 to 18 Years | 232 (97.9%) | 5 (2.1%) |
| 19 to 25 Years | 34 (94.4%) | 2 (5.6%) |
| 26 to 34 Years | 169 (97.7%) | 4 (2.3%) |
| 35 to 44 Years | 152 (84.4%) | 28 (15.6%) |
| 45 to 54 Years | 150 (98.0%) | 3 (2.0%) |
| 55 to 64 Years | 115 (96.6%) | 4 (3.4%) |
| 65 to 74 Years | 106 (100.0%) | 0 (0.0%) |
| 75 Years and older | 76 (100.0%) | 0 (0.0%) |
| Total | 1,163 (96.2%) | 46 (3.8%) |
Health Insurance Coverage by Citizenship Status in Genesee
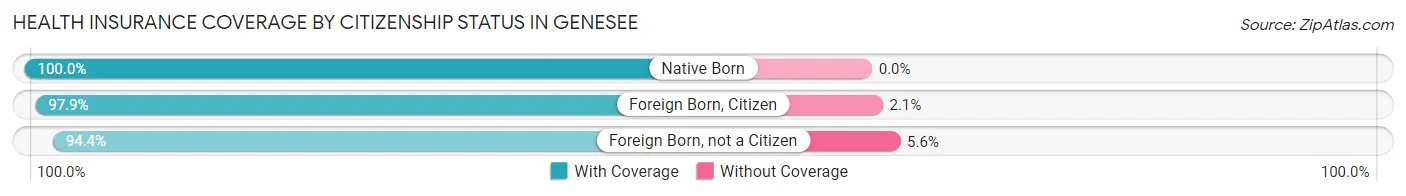
| Citizenship Status | With Coverage | Without Coverage |
| Native Born | 129 (100.0%) | 0 (0.0%) |
| Foreign Born, Citizen | 232 (97.9%) | 5 (2.1%) |
| Foreign Born, not a Citizen | 34 (94.4%) | 2 (5.6%) |
Health Insurance Coverage by Household Income in Genesee
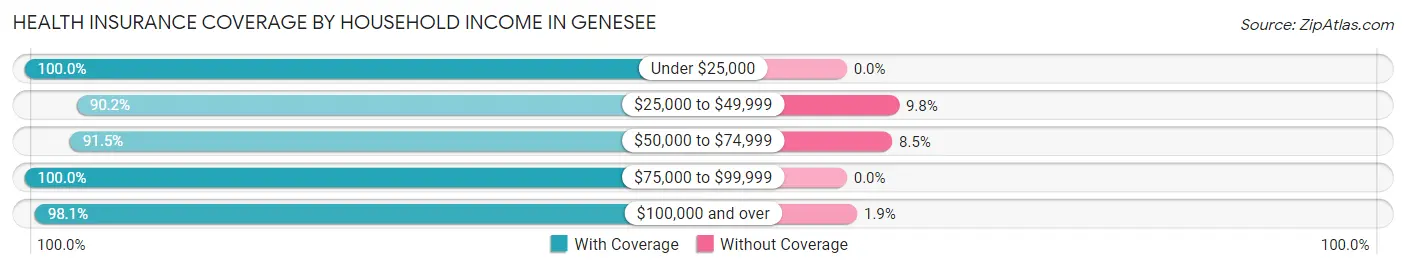
| Household Income | With Coverage | Without Coverage |
| Under $25,000 | 101 (100.0%) | 0 (0.0%) |
| $25,000 to $49,999 | 83 (90.2%) | 9 (9.8%) |
| $50,000 to $74,999 | 291 (91.5%) | 27 (8.5%) |
| $75,000 to $99,999 | 177 (100.0%) | 0 (0.0%) |
| $100,000 and over | 511 (98.1%) | 10 (1.9%) |
Public vs Private Health Insurance Coverage by Age in Genesee
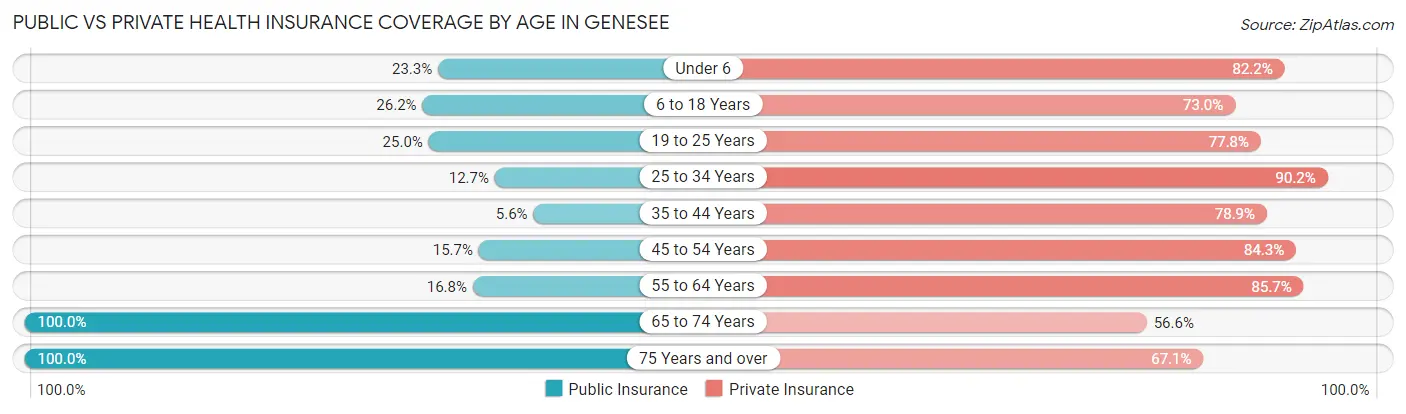
| Age Bracket | Public Insurance | Private Insurance |
| Under 6 | 30 (23.3%) | 106 (82.2%) |
| 6 to 18 Years | 62 (26.2%) | 173 (73.0%) |
| 19 to 25 Years | 9 (25.0%) | 28 (77.8%) |
| 25 to 34 Years | 22 (12.7%) | 156 (90.2%) |
| 35 to 44 Years | 10 (5.6%) | 142 (78.9%) |
| 45 to 54 Years | 24 (15.7%) | 129 (84.3%) |
| 55 to 64 Years | 20 (16.8%) | 102 (85.7%) |
| 65 to 74 Years | 106 (100.0%) | 60 (56.6%) |
| 75 Years and over | 76 (100.0%) | 51 (67.1%) |
| Total | 359 (29.7%) | 947 (78.3%) |
Disability Status by Sex by Age in Genesee
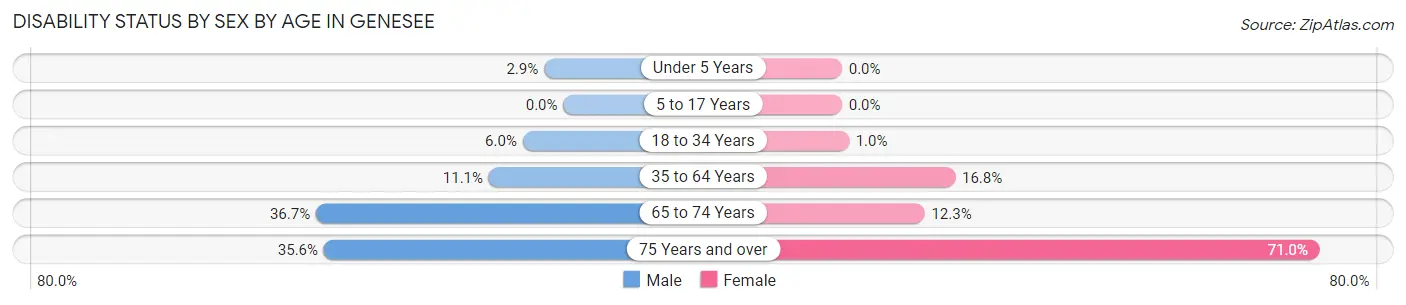
| Age Bracket | Male | Female |
| Under 5 Years | 2 (2.9%) | 0 (0.0%) |
| 5 to 17 Years | 0 (0.0%) | 0 (0.0%) |
| 18 to 34 Years | 7 (6.0%) | 1 (1.0%) |
| 35 to 64 Years | 25 (11.1%) | 38 (16.8%) |
| 65 to 74 Years | 18 (36.7%) | 7 (12.3%) |
| 75 Years and over | 16 (35.6%) | 22 (71.0%) |
Disability Class by Sex by Age in Genesee
Disability Class: Hearing Difficulty
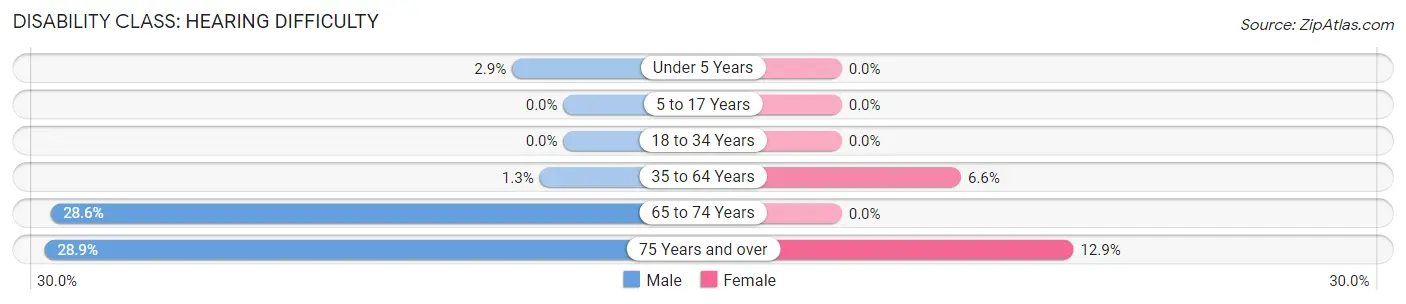
| Age Bracket | Male | Female |
| Under 5 Years | 2 (2.9%) | 0 (0.0%) |
| 5 to 17 Years | 0 (0.0%) | 0 (0.0%) |
| 18 to 34 Years | 0 (0.0%) | 0 (0.0%) |
| 35 to 64 Years | 3 (1.3%) | 15 (6.6%) |
| 65 to 74 Years | 14 (28.6%) | 0 (0.0%) |
| 75 Years and over | 13 (28.9%) | 4 (12.9%) |
Disability Class: Vision Difficulty
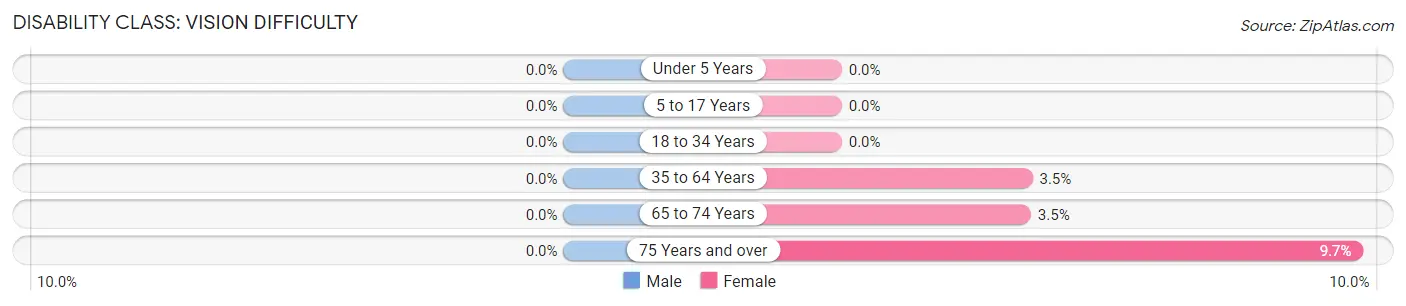
| Age Bracket | Male | Female |
| Under 5 Years | 0 (0.0%) | 0 (0.0%) |
| 5 to 17 Years | 0 (0.0%) | 0 (0.0%) |
| 18 to 34 Years | 0 (0.0%) | 0 (0.0%) |
| 35 to 64 Years | 0 (0.0%) | 8 (3.5%) |
| 65 to 74 Years | 0 (0.0%) | 2 (3.5%) |
| 75 Years and over | 0 (0.0%) | 3 (9.7%) |
Disability Class: Cognitive Difficulty
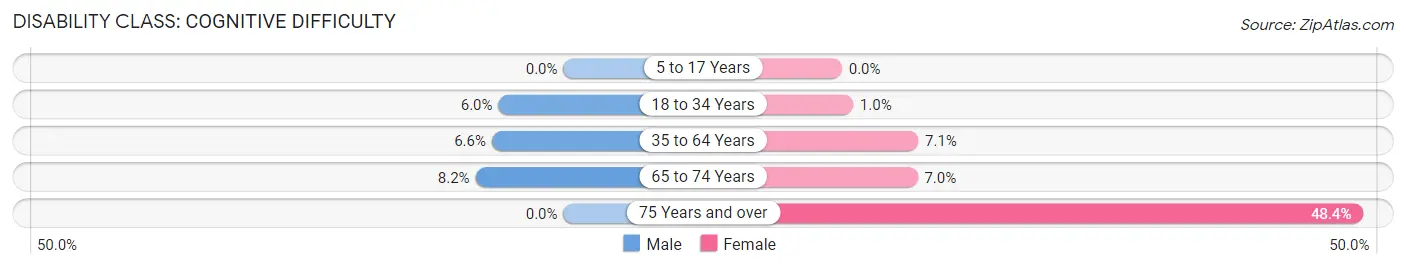
| Age Bracket | Male | Female |
| 5 to 17 Years | 0 (0.0%) | 0 (0.0%) |
| 18 to 34 Years | 7 (6.0%) | 1 (1.0%) |
| 35 to 64 Years | 15 (6.6%) | 16 (7.1%) |
| 65 to 74 Years | 4 (8.2%) | 4 (7.0%) |
| 75 Years and over | 0 (0.0%) | 15 (48.4%) |
Disability Class: Ambulatory Difficulty
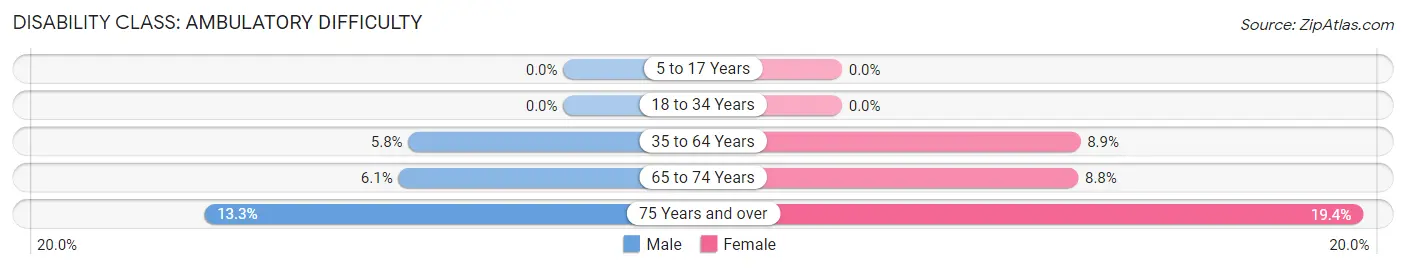
| Age Bracket | Male | Female |
| 5 to 17 Years | 0 (0.0%) | 0 (0.0%) |
| 18 to 34 Years | 0 (0.0%) | 0 (0.0%) |
| 35 to 64 Years | 13 (5.8%) | 20 (8.8%) |
| 65 to 74 Years | 3 (6.1%) | 5 (8.8%) |
| 75 Years and over | 6 (13.3%) | 6 (19.4%) |
Disability Class: Self-Care Difficulty
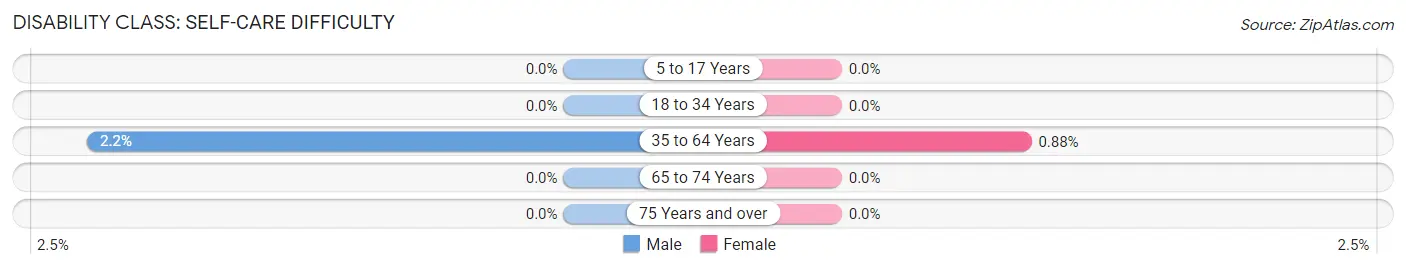
| Age Bracket | Male | Female |
| 5 to 17 Years | 0 (0.0%) | 0 (0.0%) |
| 18 to 34 Years | 0 (0.0%) | 0 (0.0%) |
| 35 to 64 Years | 5 (2.2%) | 2 (0.9%) |
| 65 to 74 Years | 0 (0.0%) | 0 (0.0%) |
| 75 Years and over | 0 (0.0%) | 0 (0.0%) |
Technology Access in Genesee
Computing Device Access in Genesee
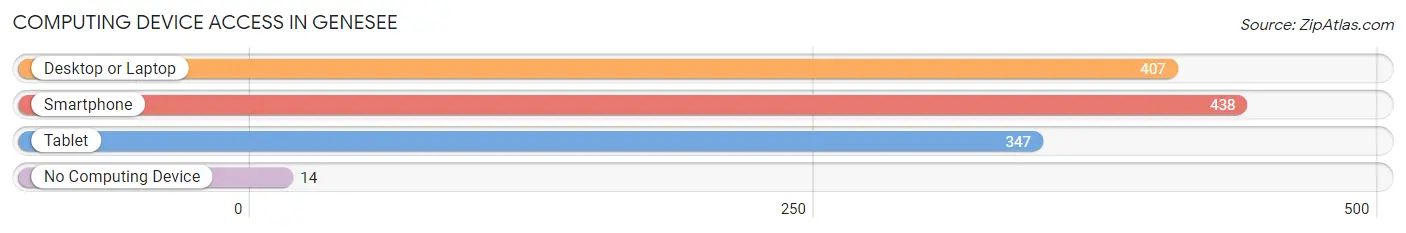
| Device Type | # Households | % Households |
| Desktop or Laptop | 407 | 86.4% |
| Smartphone | 438 | 93.0% |
| Tablet | 347 | 73.7% |
| No Computing Device | 14 | 3.0% |
| Total | 471 | 100.0% |
Internet Access in Genesee
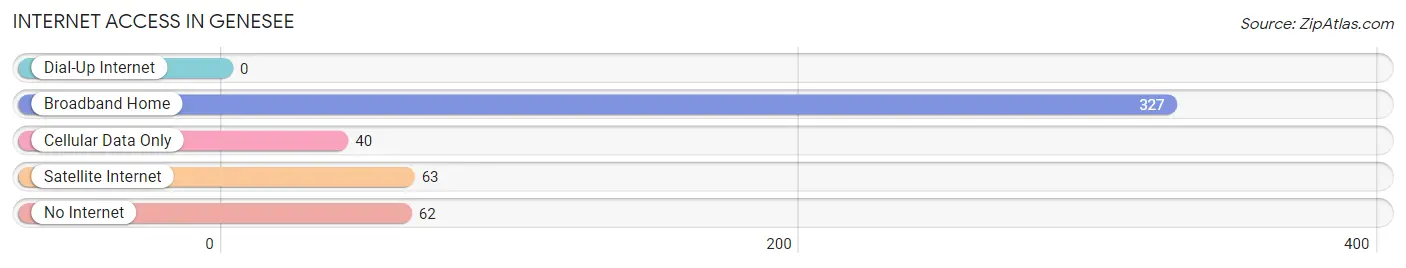
| Internet Type | # Households | % Households |
| Dial-Up Internet | 0 | 0.0% |
| Broadband Home | 327 | 69.4% |
| Cellular Data Only | 40 | 8.5% |
| Satellite Internet | 63 | 13.4% |
| No Internet | 62 | 13.2% |
| Total | 471 | 100.0% |
Genesee Summary
Genesee, Idaho is a small city located in Latah County, Idaho. It is situated in the Palouse region of the state, and is part of the Moscow-Pullman metropolitan area. The city has a population of approximately 1,000 people, and is known for its rural charm and small-town atmosphere.
Geography
Genesee is located in the Palouse region of Idaho, which is characterized by rolling hills and fertile soil. The city is situated in the foothills of the Rocky Mountains, and is surrounded by forests and farmland. The city is located at an elevation of 2,400 feet, and has a total area of 1.2 square miles. The climate in Genesee is mild, with hot summers and cold winters.
Economy
The economy of Genesee is largely based on agriculture. The city is home to several farms and ranches, and the surrounding area is known for its production of wheat, barley, and other grains. The city also has a small manufacturing sector, and is home to several small businesses.
Demographics
As of the 2010 census, the population of Genesee was 1,000. The racial makeup of the city was 95.2% White, 0.7% Native American, 0.3% Asian, 0.1% Pacific Islander, 0.1% from other races, and 3.7% from two or more races. The median household income in Genesee was $37,500, and the median family income was $45,000.
History
Genesee was founded in 1883 by a group of settlers from Wisconsin. The city was named after Genesee County, New York, and was originally intended to be a farming community. The city quickly grew, and by the early 1900s, it had become a thriving agricultural center. The city was incorporated in 1907, and has remained a small, rural community ever since.
Genesee has a long history of community involvement and volunteerism. The city is home to several civic organizations, including the Genesee Lions Club and the Genesee Historical Society. The city also hosts a number of annual events, including the Genesee County Fair and the Genesee Harvest Festival.
Conclusion
Genesee, Idaho is a small city located in Latah County, Idaho. It is situated in the Palouse region of the state, and is part of the Moscow-Pullman metropolitan area. The city has a population of approximately 1,000 people, and is known for its rural charm and small-town atmosphere. The economy of Genesee is largely based on agriculture, and the city is home to several farms and ranches. The racial makeup of the city is predominantly White, and the median household income is $37,500. Genesee has a long history of community involvement and volunteerism, and is home to several civic organizations and annual events.
Common Questions
What is the Total Population of Genesee?
Total Population of Genesee is 1,209.
What is the Total Male Population of Genesee?
Total Male Population of Genesee is 633.
What is the Total Female Population of Genesee?
Total Female Population of Genesee is 576.
What is the Ratio of Males per 100 Females in Genesee?
There are 109.90 Males per 100 Females in Genesee.
What is the Ratio of Females per 100 Males in Genesee?
There are 91.00 Females per 100 Males in Genesee.
What is the Median Population Age in Genesee?
Median Population Age in Genesee is 35.7 Years.
What is the Average Family Size in Genesee
Average Family Size in Genesee is 2.8 People.
What is the Average Household Size in Genesee
Average Household Size in Genesee is 2.6 People.
What is Per Capita Income in Genesee?
Per Capita income in Genesee is $37,304.
What is the Median Family Income in Genesee?
Median Family Income in Genesee is $86,771.
What is the Median Household income in Genesee?
Median Household Income in Genesee is $77,266.
What is Income or Wage Gap in Genesee?
Income or Wage Gap in Genesee is 30.0%.
Women in Genesee earn 70.0 cents for every dollar earned by a man.
What is Family Income Deficit in Genesee?
Family Income Deficit in Genesee is $14,629.
Families that are below poverty line in Genesee earn $14,629 less on average than the poverty threshold level.
What is Inequality or Gini Index in Genesee?
Inequality or Gini Index in Genesee is 0.35.
How Large is the Labor Force in Genesee?
There are 560 People in the Labor Forcein in Genesee.
What is the Percentage of People in the Labor Force in Genesee?
64.2% of People are in the Labor Force in Genesee.
What is the Unemployment Rate in Genesee?
Unemployment Rate in Genesee is 2.5%.