Eagle, ID Map & Demographics
Eagle Map
Eagle Overview
$61,916
PER CAPITA INCOME
$131,532
AVG FAMILY INCOME
$114,271
AVG HOUSEHOLD INCOME
47.5%
WAGE / INCOME GAP [ % ]
52.5¢/ $1
WAGE / INCOME GAP [ $ ]
$13,963
FAMILY INCOME DEFICIT
0.47
INEQUALITY / GINI INDEX
30,635
TOTAL POPULATION
14,922
MALE POPULATION
15,713
FEMALE POPULATION
94.97
MALES / 100 FEMALES
105.30
FEMALES / 100 MALES
46.8
MEDIAN AGE
3.0
AVG FAMILY SIZE
2.6
AVG HOUSEHOLD SIZE
13,895
LABOR FORCE [ PEOPLE ]
56.3%
PERCENT IN LABOR FORCE
1.5%
UNEMPLOYMENT RATE
Eagle Zip Codes
Eagle Area Codes
Income in Eagle
Income Overview in Eagle
Per Capita Income in Eagle is $61,916, while median incomes of families and households are $131,532 and $114,271 respectively.
| Characteristic | Number | Measure |
| Per Capita Income | 30,635 | $61,916 |
| Median Family Income | 9,236 | $131,532 |
| Mean Family Income | 9,236 | $177,152 |
| Median Household Income | 11,571 | $114,271 |
| Mean Household Income | 11,571 | $159,730 |
| Income Deficit | 9,236 | $13,963 |
| Wage / Income Gap (%) | 30,635 | 47.55% |
| Wage / Income Gap ($) | 30,635 | 52.45¢ per $1 |
| Gini / Inequality Index | 30,635 | 0.47 |
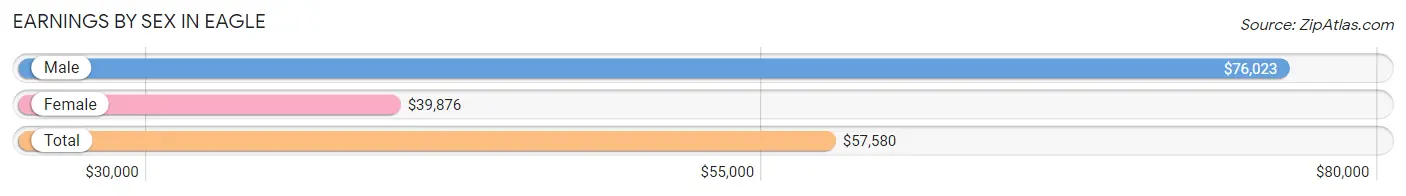
Earnings by Sex in Eagle
Average Earnings in Eagle are $57,580, $76,023 for men and $39,876 for women, a difference of 47.5%.
| Sex | Number | Average Earnings |
| Male | 8,483 (57.2%) | $76,023 |
| Female | 6,347 (42.8%) | $39,876 |
| Total | 14,830 (100.0%) | $57,580 |
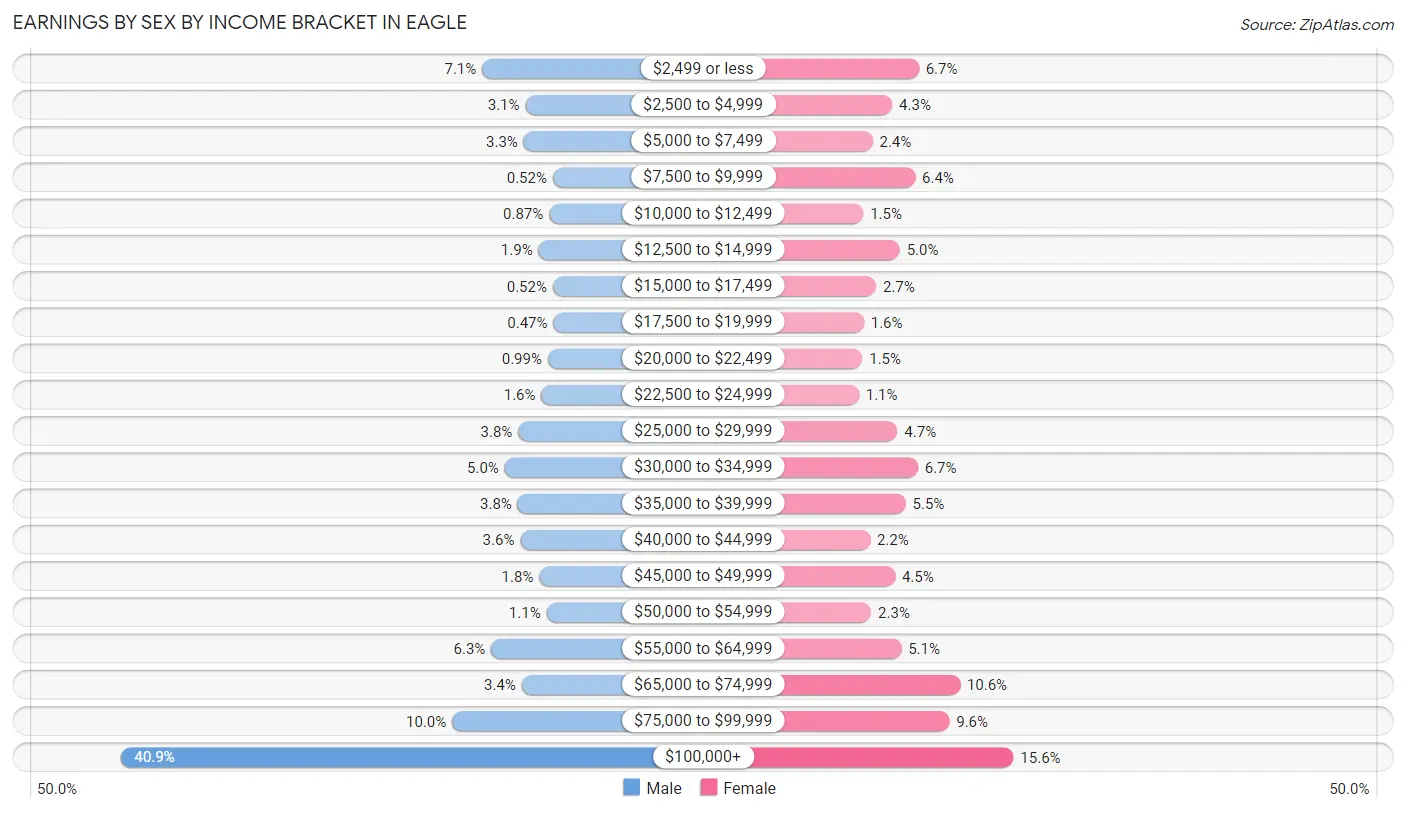
Earnings by Sex by Income Bracket in Eagle
The most common earnings brackets in Eagle are $100,000+ for men (3,472 | 40.9%) and $100,000+ for women (991 | 15.6%).
| Income | Male | Female |
| $2,499 or less | 606 (7.1%) | 428 (6.7%) |
| $2,500 to $4,999 | 262 (3.1%) | 270 (4.3%) |
| $5,000 to $7,499 | 276 (3.3%) | 153 (2.4%) |
| $7,500 to $9,999 | 44 (0.5%) | 406 (6.4%) |
| $10,000 to $12,499 | 74 (0.9%) | 98 (1.5%) |
| $12,500 to $14,999 | 158 (1.9%) | 315 (5.0%) |
| $15,000 to $17,499 | 44 (0.5%) | 174 (2.7%) |
| $17,500 to $19,999 | 40 (0.5%) | 101 (1.6%) |
| $20,000 to $22,499 | 84 (1.0%) | 92 (1.5%) |
| $22,500 to $24,999 | 135 (1.6%) | 71 (1.1%) |
| $25,000 to $29,999 | 319 (3.8%) | 301 (4.7%) |
| $30,000 to $34,999 | 427 (5.0%) | 422 (6.7%) |
| $35,000 to $39,999 | 323 (3.8%) | 350 (5.5%) |
| $40,000 to $44,999 | 303 (3.6%) | 138 (2.2%) |
| $45,000 to $49,999 | 152 (1.8%) | 286 (4.5%) |
| $50,000 to $54,999 | 94 (1.1%) | 145 (2.3%) |
| $55,000 to $64,999 | 534 (6.3%) | 324 (5.1%) |
| $65,000 to $74,999 | 292 (3.4%) | 673 (10.6%) |
| $75,000 to $99,999 | 844 (10.0%) | 609 (9.6%) |
| $100,000+ | 3,472 (40.9%) | 991 (15.6%) |
| Total | 8,483 (100.0%) | 6,347 (100.0%) |
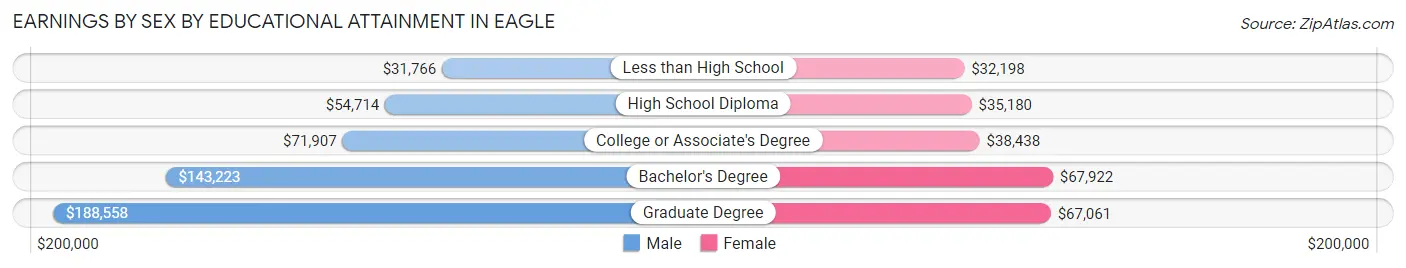
Earnings by Sex by Educational Attainment in Eagle
Average earnings in Eagle are $90,540 for men and $49,906 for women, a difference of 44.9%. Men with an educational attainment of graduate degree enjoy the highest average annual earnings of $188,558, while those with less than high school education earn the least with $31,766. Women with an educational attainment of bachelor's degree earn the most with the average annual earnings of $67,922, while those with less than high school education have the smallest earnings of $32,198.
| Educational Attainment | Male Income | Female Income |
| Less than High School | $31,766 | $32,198 |
| High School Diploma | $54,714 | $35,180 |
| College or Associate's Degree | $71,907 | $38,438 |
| Bachelor's Degree | $143,223 | $67,922 |
| Graduate Degree | $188,558 | $67,061 |
| Total | $90,540 | $49,906 |
Family Income in Eagle
Family Income Brackets in Eagle
According to the Eagle family income data, there are 2,743 families falling into the $200,000+ income range, which is the most common income bracket and makes up 29.7% of all families. Conversely, the $10,000 to $14,999 income bracket is the least frequent group with only 37 families (0.4%) belonging to this category.
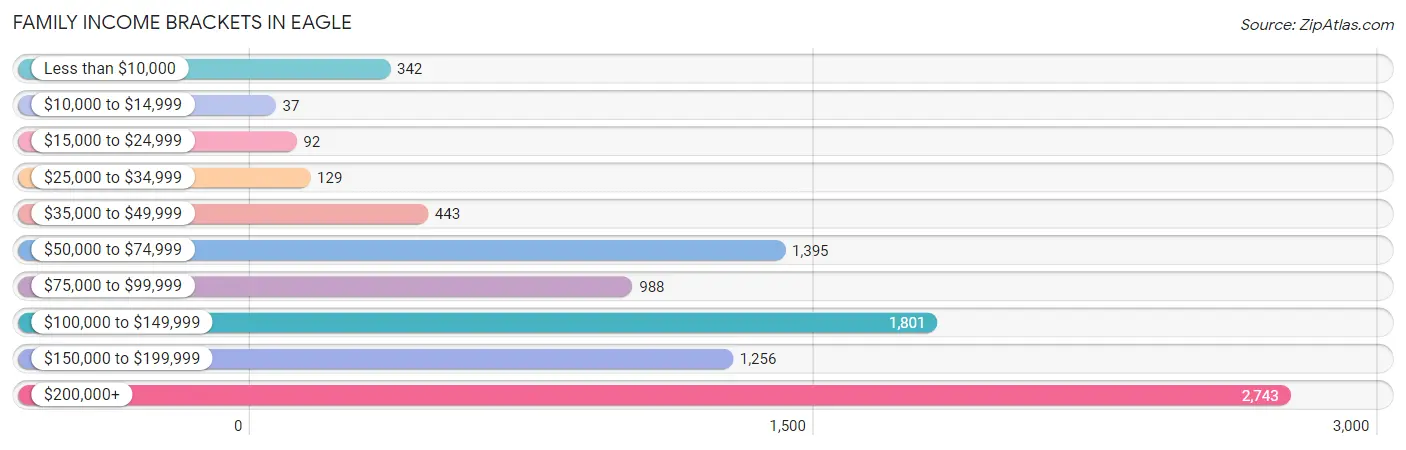
| Income Bracket | # Families | % Families |
| Less than $10,000 | 342 | 3.7% |
| $10,000 to $14,999 | 37 | 0.4% |
| $15,000 to $24,999 | 92 | 1.0% |
| $25,000 to $34,999 | 129 | 1.4% |
| $35,000 to $49,999 | 443 | 4.8% |
| $50,000 to $74,999 | 1,395 | 15.1% |
| $75,000 to $99,999 | 988 | 10.7% |
| $100,000 to $149,999 | 1,801 | 19.5% |
| $150,000 to $199,999 | 1,256 | 13.6% |
| $200,000+ | 2,743 | 29.7% |
Family Income by Famaliy Size in Eagle
7+ person families (73 | 0.8%) account for the highest median family income in Eagle with $250,001 per family, while 4-person families (1,362 | 14.7%) have the highest median income of $56,375 per family member.
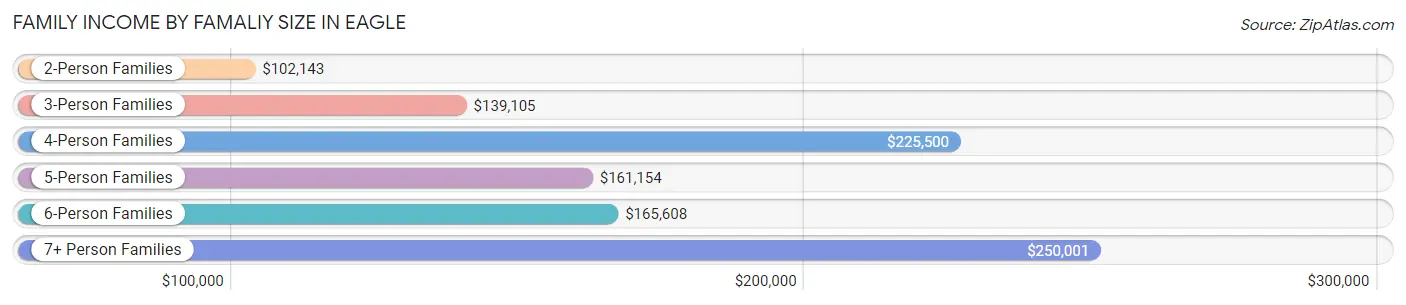
| Income Bracket | # Families | Median Income |
| 2-Person Families | 4,978 (53.9%) | $102,143 |
| 3-Person Families | 1,727 (18.7%) | $139,105 |
| 4-Person Families | 1,362 (14.7%) | $225,500 |
| 5-Person Families | 628 (6.8%) | $161,154 |
| 6-Person Families | 468 (5.1%) | $165,608 |
| 7+ Person Families | 73 (0.8%) | $250,001 |
| Total | 9,236 (100.0%) | $131,532 |
Family Income by Number of Earners in Eagle
The median family income in Eagle is $131,532, with families comprising 2 earners (3,052) having the highest median family income of $200,909, while families with no earners (1,983) have the lowest median family income of $73,617, accounting for 33.0% and 21.5% of families, respectively.
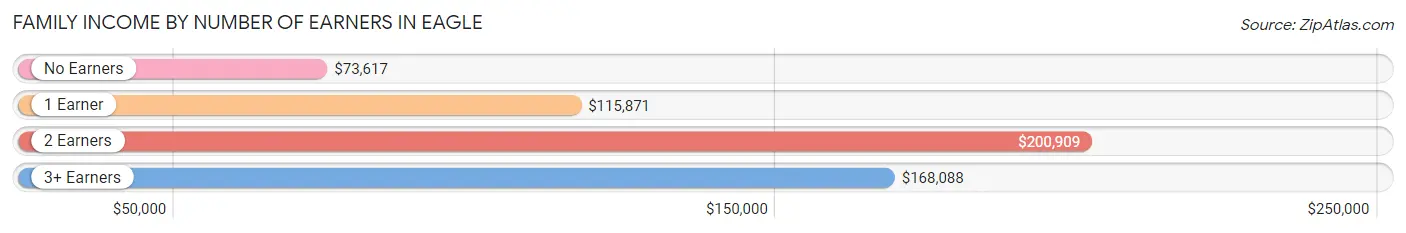
| Number of Earners | # Families | Median Income |
| No Earners | 1,983 (21.5%) | $73,617 |
| 1 Earner | 3,013 (32.6%) | $115,871 |
| 2 Earners | 3,052 (33.0%) | $200,909 |
| 3+ Earners | 1,188 (12.9%) | $168,088 |
| Total | 9,236 (100.0%) | $131,532 |
Household Income in Eagle
Household Income Brackets in Eagle
With 2,893 households falling in the category, the $200,000+ income range is the most frequent in Eagle, accounting for 25.0% of all households. In contrast, only 127 households (1.1%) fall into the $10,000 to $14,999 income bracket, making it the least populous group.
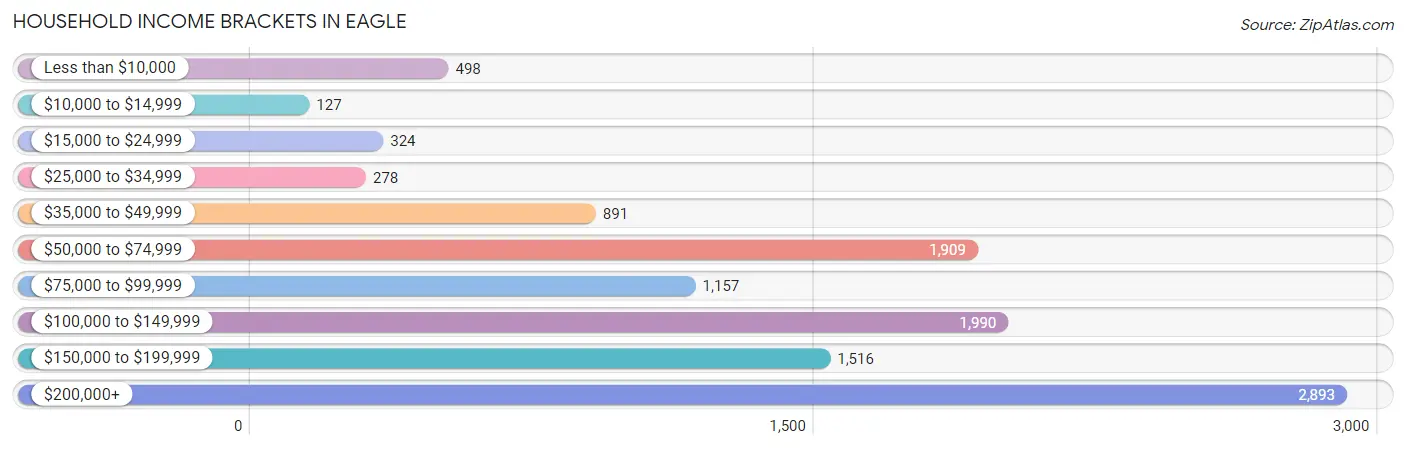
| Income Bracket | # Households | % Households |
| Less than $10,000 | 498 | 4.3% |
| $10,000 to $14,999 | 127 | 1.1% |
| $15,000 to $24,999 | 324 | 2.8% |
| $25,000 to $34,999 | 278 | 2.4% |
| $35,000 to $49,999 | 891 | 7.7% |
| $50,000 to $74,999 | 1,909 | 16.5% |
| $75,000 to $99,999 | 1,157 | 10.0% |
| $100,000 to $149,999 | 1,990 | 17.2% |
| $150,000 to $199,999 | 1,516 | 13.1% |
| $200,000+ | 2,893 | 25.0% |
Household Income by Householder Age in Eagle
The median household income in Eagle is $114,271, with the highest median household income of $157,177 found in the 45 to 64 years age bracket for the primary householder. A total of 5,102 households (44.1%) fall into this category. Meanwhile, the 15 to 24 years age bracket for the primary householder has the lowest median household income of $54,438, with 121 households (1.1%) in this group.
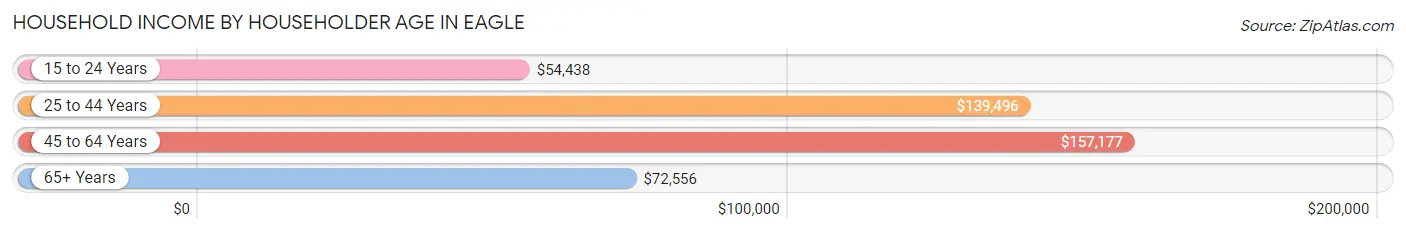
| Income Bracket | # Households | Median Income |
| 15 to 24 Years | 121 (1.1%) | $54,438 |
| 25 to 44 Years | 2,463 (21.3%) | $139,496 |
| 45 to 64 Years | 5,102 (44.1%) | $157,177 |
| 65+ Years | 3,885 (33.6%) | $72,556 |
| Total | 11,571 (100.0%) | $114,271 |
Poverty in Eagle
Income Below Poverty by Sex and Age in Eagle
With 4.7% poverty level for males and 6.2% for females among the residents of Eagle, 18 to 24 year old males and 15 year old females are the most vulnerable to poverty, with 98 males (13.7%) and 59 females (29.2%) in their respective age groups living below the poverty level.
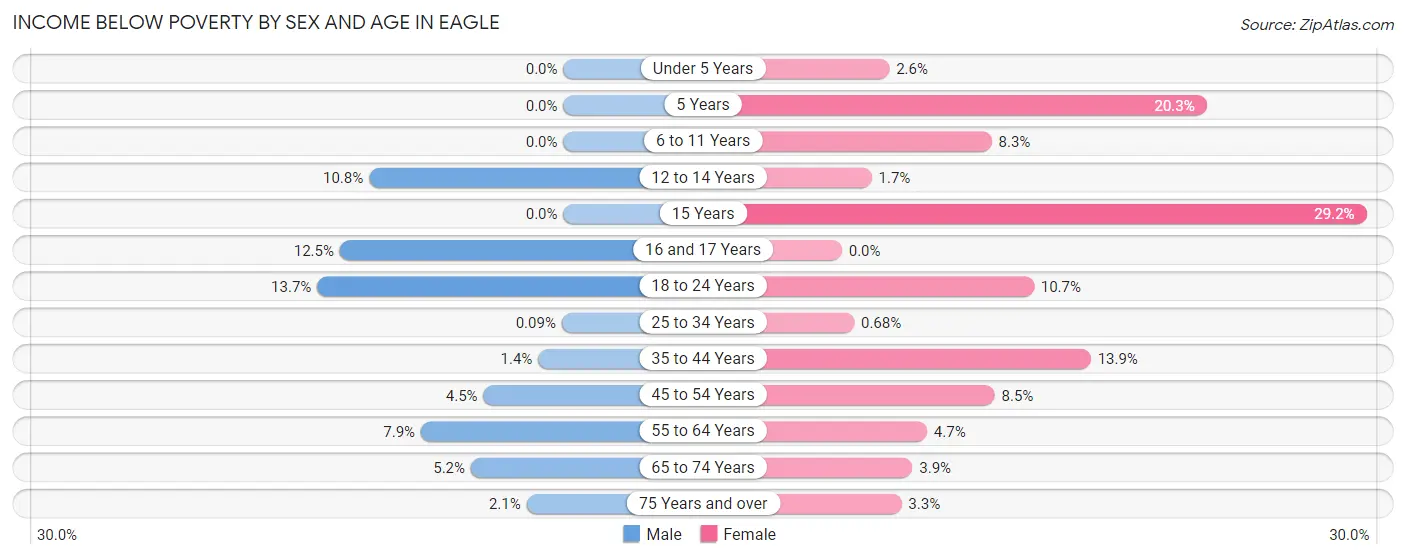
| Age Bracket | Male | Female |
| Under 5 Years | 0 (0.0%) | 15 (2.6%) |
| 5 Years | 0 (0.0%) | 13 (20.3%) |
| 6 to 11 Years | 0 (0.0%) | 124 (8.3%) |
| 12 to 14 Years | 69 (10.8%) | 13 (1.7%) |
| 15 Years | 0 (0.0%) | 59 (29.2%) |
| 16 and 17 Years | 89 (12.4%) | 0 (0.0%) |
| 18 to 24 Years | 98 (13.7%) | 77 (10.7%) |
| 25 to 34 Years | 1 (0.1%) | 9 (0.7%) |
| 35 to 44 Years | 27 (1.4%) | 223 (13.9%) |
| 45 to 54 Years | 90 (4.4%) | 199 (8.5%) |
| 55 to 64 Years | 193 (7.9%) | 114 (4.7%) |
| 65 to 74 Years | 114 (5.1%) | 85 (3.9%) |
| 75 Years and over | 20 (2.1%) | 47 (3.3%) |
| Total | 701 (4.7%) | 978 (6.2%) |
Income Above Poverty by Sex and Age in Eagle
According to the poverty statistics in Eagle, males aged under 5 years and females aged 16 and 17 years are the age groups that are most secure financially, with 100.0% of males and 100.0% of females in these age groups living above the poverty line.
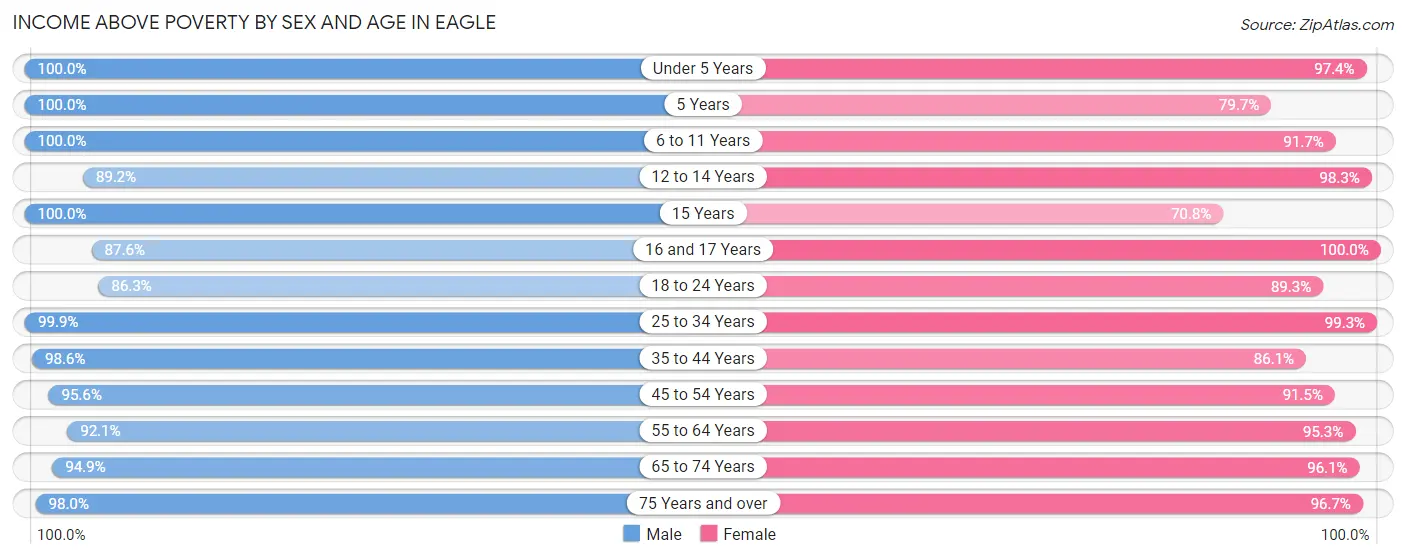
| Age Bracket | Male | Female |
| Under 5 Years | 792 (100.0%) | 554 (97.4%) |
| 5 Years | 122 (100.0%) | 51 (79.7%) |
| 6 to 11 Years | 1,066 (100.0%) | 1,363 (91.7%) |
| 12 to 14 Years | 569 (89.2%) | 772 (98.3%) |
| 15 Years | 230 (100.0%) | 143 (70.8%) |
| 16 and 17 Years | 626 (87.5%) | 572 (100.0%) |
| 18 to 24 Years | 617 (86.3%) | 643 (89.3%) |
| 25 to 34 Years | 1,054 (99.9%) | 1,319 (99.3%) |
| 35 to 44 Years | 1,901 (98.6%) | 1,386 (86.1%) |
| 45 to 54 Years | 1,934 (95.6%) | 2,140 (91.5%) |
| 55 to 64 Years | 2,240 (92.1%) | 2,293 (95.3%) |
| 65 to 74 Years | 2,098 (94.9%) | 2,078 (96.1%) |
| 75 Years and over | 954 (98.0%) | 1,368 (96.7%) |
| Total | 14,203 (95.3%) | 14,682 (93.8%) |
Income Below Poverty Among Married-Couple Families in Eagle
The poverty statistics for married-couple families in Eagle show that 4.2% or 331 of the total 7,962 families live below the poverty line. Families with 1 or 2 children have the highest poverty rate of 6.8%, comprising of 137 families. On the other hand, families with 5 or more children have the lowest poverty rate of 0.0%, which includes 0 families.
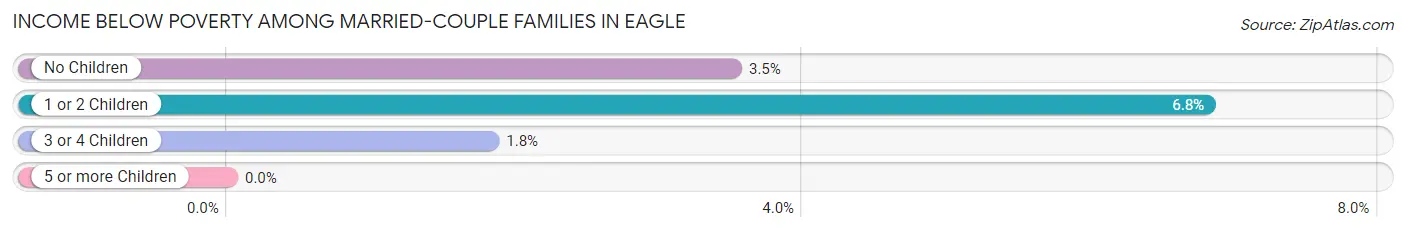
| Children | Above Poverty | Below Poverty |
| No Children | 4,949 (96.5%) | 180 (3.5%) |
| 1 or 2 Children | 1,875 (93.2%) | 137 (6.8%) |
| 3 or 4 Children | 756 (98.2%) | 14 (1.8%) |
| 5 or more Children | 51 (100.0%) | 0 (0.0%) |
| Total | 7,631 (95.8%) | 331 (4.2%) |
Income Below Poverty Among Single-Parent Households in Eagle
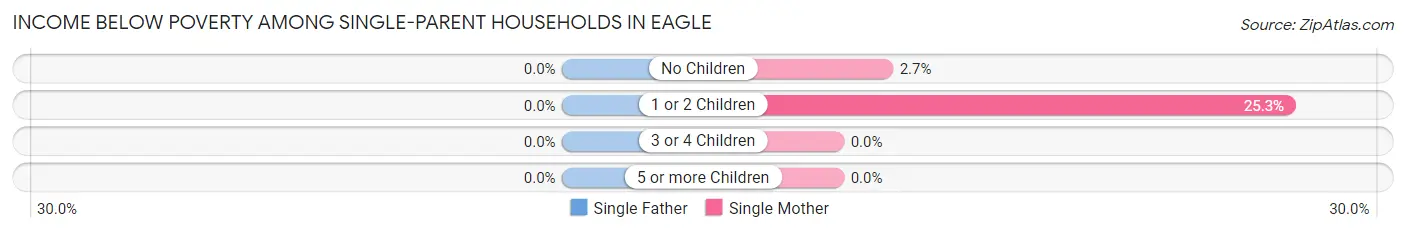
| Children | Single Father | Single Mother |
| No Children | 0 (0.0%) | 8 (2.7%) |
| 1 or 2 Children | 0 (0.0%) | 115 (25.3%) |
| 3 or 4 Children | 0 (0.0%) | 0 (0.0%) |
| 5 or more Children | 0 (0.0%) | 0 (0.0%) |
| Total | 0 (0.0%) | 123 (16.3%) |
Income Below Poverty Among Married-Couple vs Single-Parent Households in Eagle
The poverty data for Eagle shows that 331 of the married-couple family households (4.2%) and 123 of the single-parent households (9.7%) are living below the poverty level. Within the married-couple family households, those with 1 or 2 children have the highest poverty rate, with 137 households (6.8%) falling below the poverty line. Among the single-parent households, those with 1 or 2 children have the highest poverty rate, with 115 household (12.7%) living below poverty.
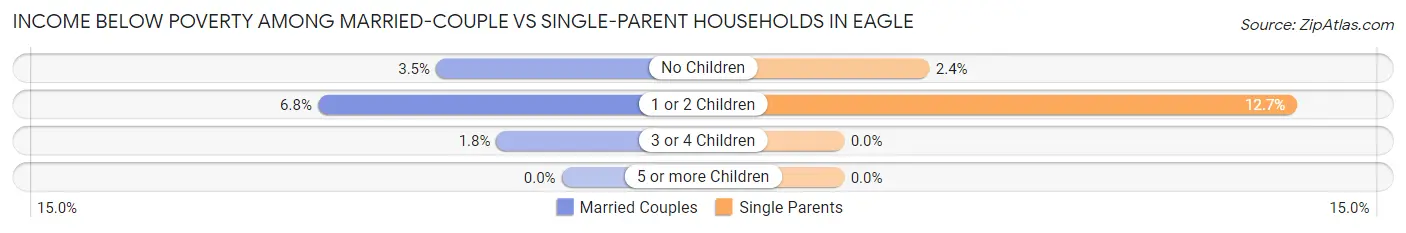
| Children | Married-Couple Families | Single-Parent Households |
| No Children | 180 (3.5%) | 8 (2.4%) |
| 1 or 2 Children | 137 (6.8%) | 115 (12.7%) |
| 3 or 4 Children | 14 (1.8%) | 0 (0.0%) |
| 5 or more Children | 0 (0.0%) | 0 (0.0%) |
| Total | 331 (4.2%) | 123 (9.7%) |
Race in Eagle
The most populous races in Eagle are White / Caucasian (27,110 | 88.5%), Hispanic or Latino (2,776 | 9.1%), and Two or more Races (1,976 | 6.5%).
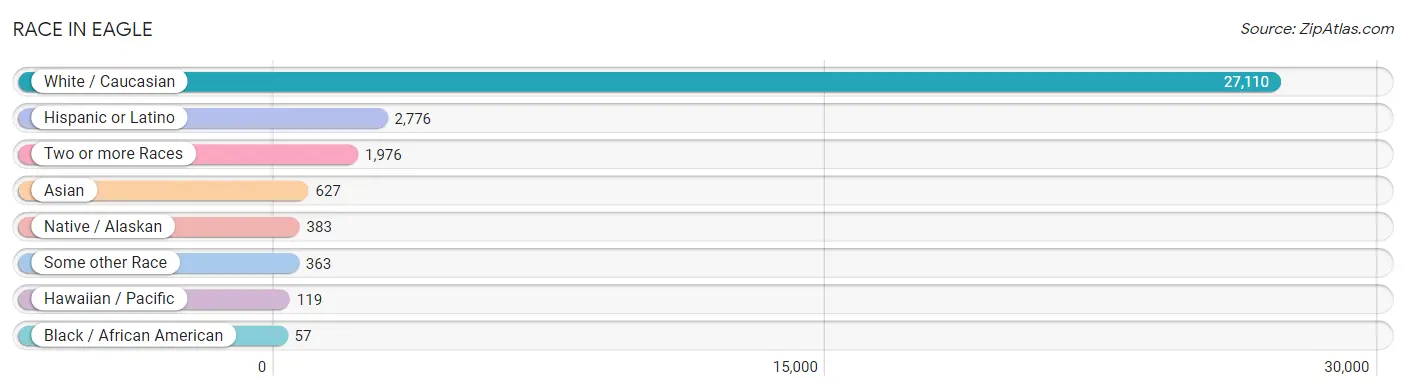
| Race | # Population | % Population |
| Asian | 627 | 2.1% |
| Black / African American | 57 | 0.2% |
| Hawaiian / Pacific | 119 | 0.4% |
| Hispanic or Latino | 2,776 | 9.1% |
| Native / Alaskan | 383 | 1.3% |
| White / Caucasian | 27,110 | 88.5% |
| Two or more Races | 1,976 | 6.5% |
| Some other Race | 363 | 1.2% |
| Total | 30,635 | 100.0% |
Ancestry in Eagle
The most populous ancestries reported in Eagle are English (7,305 | 23.8%), German (5,631 | 18.4%), Irish (3,523 | 11.5%), Mexican (2,283 | 7.4%), and Italian (1,410 | 4.6%), together accounting for 65.8% of all Eagle residents.
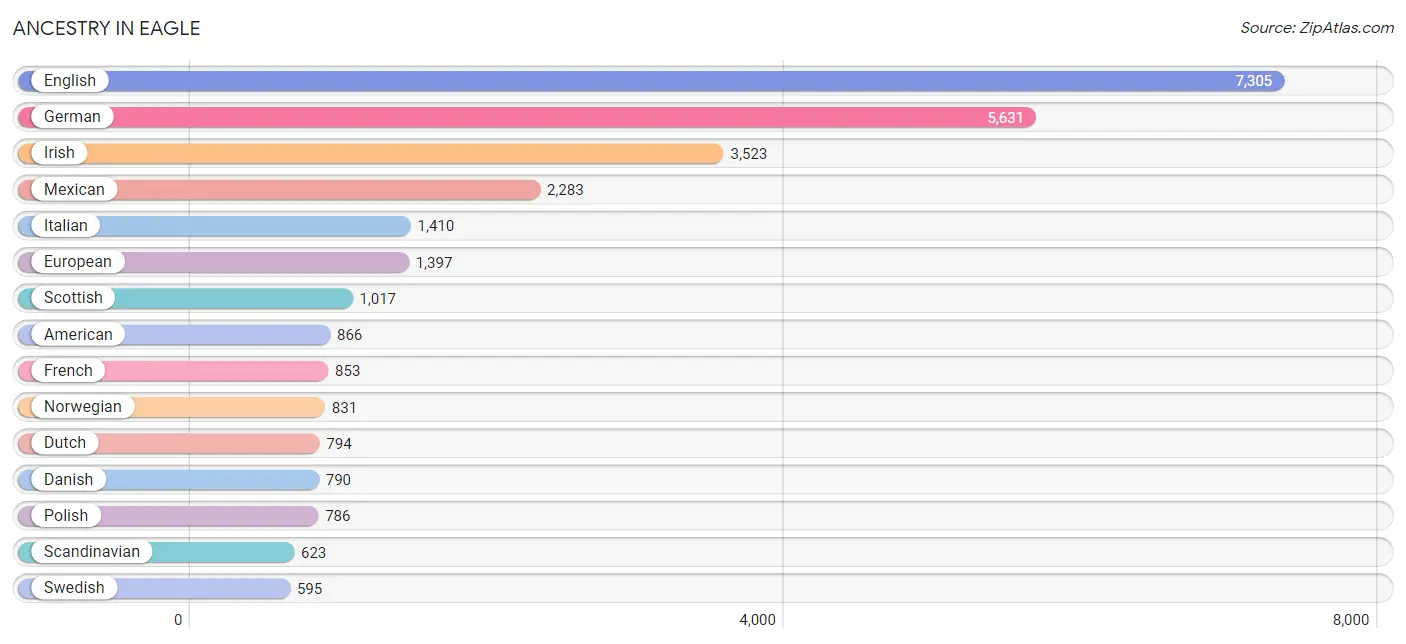
| Ancestry | # Population | % Population |
| American | 866 | 2.8% |
| Apache | 61 | 0.2% |
| Arab | 20 | 0.1% |
| Armenian | 49 | 0.2% |
| Austrian | 28 | 0.1% |
| Basque | 410 | 1.3% |
| Belgian | 34 | 0.1% |
| Bhutanese | 225 | 0.7% |
| British | 237 | 0.8% |
| Burmese | 18 | 0.1% |
| Canadian | 62 | 0.2% |
| Central American Indian | 39 | 0.1% |
| Cherokee | 129 | 0.4% |
| Colombian | 121 | 0.4% |
| Creek | 9 | 0.0% |
| Croatian | 98 | 0.3% |
| Czech | 177 | 0.6% |
| Czechoslovakian | 2 | 0.0% |
| Danish | 790 | 2.6% |
| Delaware | 7 | 0.0% |
| Dutch | 794 | 2.6% |
| Eastern European | 87 | 0.3% |
| Ecuadorian | 58 | 0.2% |
| English | 7,305 | 23.8% |
| European | 1,397 | 4.6% |
| Finnish | 80 | 0.3% |
| French | 853 | 2.8% |
| French Canadian | 150 | 0.5% |
| German | 5,631 | 18.4% |
| Greek | 149 | 0.5% |
| Guamanian / Chamorro | 55 | 0.2% |
| Hungarian | 100 | 0.3% |
| Indian (Asian) | 115 | 0.4% |
| Iranian | 24 | 0.1% |
| Irish | 3,523 | 11.5% |
| Iroquois | 32 | 0.1% |
| Israeli | 44 | 0.1% |
| Italian | 1,410 | 4.6% |
| Japanese | 39 | 0.1% |
| Korean | 188 | 0.6% |
| Laotian | 47 | 0.2% |
| Lebanese | 14 | 0.1% |
| Lithuanian | 16 | 0.1% |
| Luxembourger | 14 | 0.1% |
| Mexican | 2,283 | 7.4% |
| Mexican American Indian | 316 | 1.0% |
| Native Hawaiian | 7 | 0.0% |
| Navajo | 9 | 0.0% |
| Northern European | 489 | 1.6% |
| Norwegian | 831 | 2.7% |
| Pakistani | 13 | 0.0% |
| Pennsylvania German | 8 | 0.0% |
| Polish | 786 | 2.6% |
| Portuguese | 216 | 0.7% |
| Potawatomi | 8 | 0.0% |
| Puerto Rican | 53 | 0.2% |
| Romanian | 9 | 0.0% |
| Russian | 86 | 0.3% |
| Samoan | 127 | 0.4% |
| Scandinavian | 623 | 2.0% |
| Scotch-Irish | 166 | 0.5% |
| Scottish | 1,017 | 3.3% |
| Serbian | 80 | 0.3% |
| Sioux | 7 | 0.0% |
| Slavic | 14 | 0.1% |
| Slovak | 25 | 0.1% |
| South American | 179 | 0.6% |
| Spaniard | 74 | 0.2% |
| Spanish | 187 | 0.6% |
| Sri Lankan | 183 | 0.6% |
| Swedish | 595 | 1.9% |
| Swiss | 84 | 0.3% |
| Syrian | 6 | 0.0% |
| Thai | 49 | 0.2% |
| Turkish | 35 | 0.1% |
| Ukrainian | 101 | 0.3% |
| Welsh | 342 | 1.1% |
| West Indian | 17 | 0.1% |
| Yugoslavian | 158 | 0.5% | View All 79 Rows |
Immigrants in Eagle
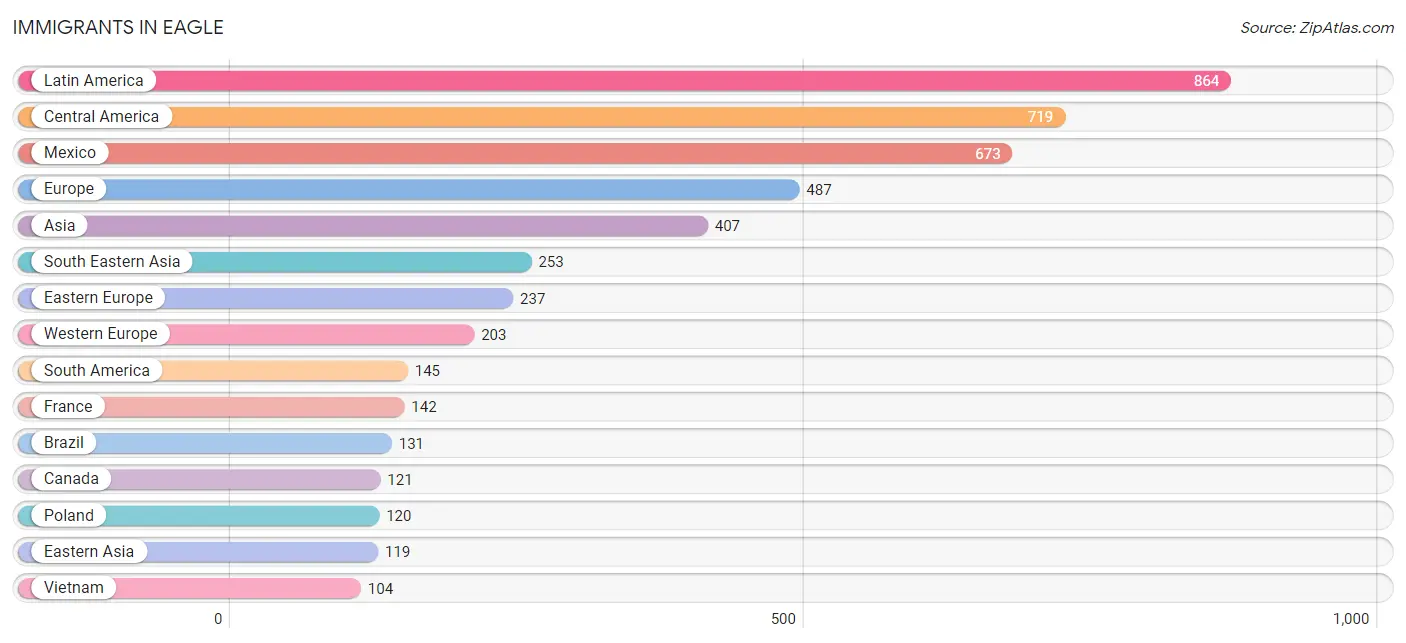
The most numerous immigrant groups reported in Eagle came from Latin America (864 | 2.8%), Central America (719 | 2.4%), Mexico (673 | 2.2%), Europe (487 | 1.6%), and Asia (407 | 1.3%), together accounting for 10.3% of all Eagle residents.
| Immigration Origin | # Population | % Population |
| Africa | 15 | 0.1% |
| Asia | 407 | 1.3% |
| Bosnia and Herzegovina | 19 | 0.1% |
| Brazil | 131 | 0.4% |
| Cambodia | 39 | 0.1% |
| Canada | 121 | 0.4% |
| Central America | 719 | 2.4% |
| China | 40 | 0.1% |
| Eastern Asia | 119 | 0.4% |
| Eastern Europe | 237 | 0.8% |
| Ecuador | 14 | 0.1% |
| Egypt | 15 | 0.1% |
| El Salvador | 46 | 0.2% |
| England | 26 | 0.1% |
| Europe | 487 | 1.6% |
| France | 142 | 0.5% |
| Germany | 40 | 0.1% |
| Greece | 14 | 0.1% |
| India | 17 | 0.1% |
| Iran | 18 | 0.1% |
| Italy | 7 | 0.0% |
| Japan | 61 | 0.2% |
| Korea | 18 | 0.1% |
| Latin America | 864 | 2.8% |
| Mexico | 673 | 2.2% |
| Netherlands | 21 | 0.1% |
| Northern Africa | 15 | 0.1% |
| Northern Europe | 26 | 0.1% |
| Philippines | 97 | 0.3% |
| Poland | 120 | 0.4% |
| Romania | 17 | 0.1% |
| Russia | 20 | 0.1% |
| South America | 145 | 0.5% |
| South Central Asia | 35 | 0.1% |
| South Eastern Asia | 253 | 0.8% |
| Southern Europe | 21 | 0.1% |
| Taiwan | 25 | 0.1% |
| Thailand | 13 | 0.0% |
| Ukraine | 47 | 0.2% |
| Vietnam | 104 | 0.3% |
| Western Europe | 203 | 0.7% | View All 41 Rows |
Sex and Age in Eagle
Sex and Age in Eagle
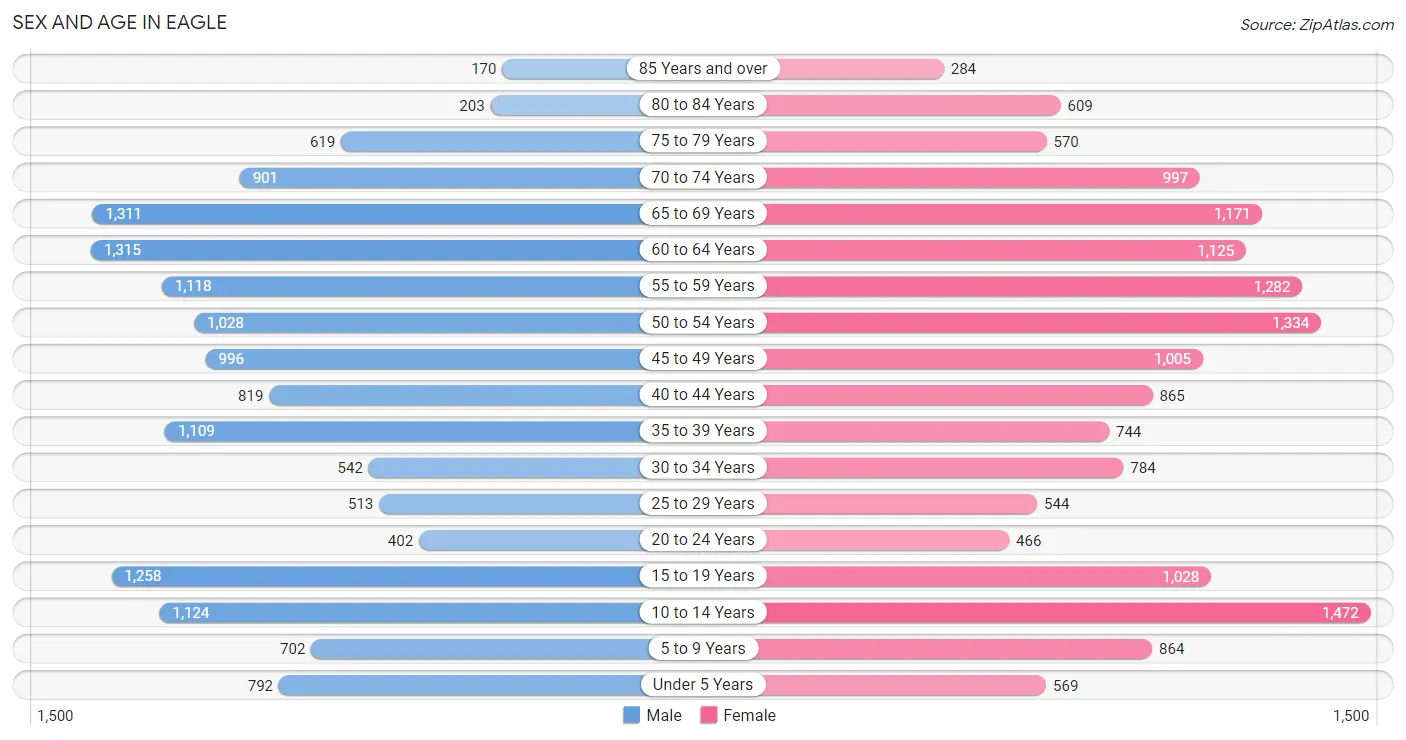
The most populous age groups in Eagle are 60 to 64 Years (1,315 | 8.8%) for men and 10 to 14 Years (1,472 | 9.4%) for women.
| Age Bracket | Male | Female |
| Under 5 Years | 792 (5.3%) | 569 (3.6%) |
| 5 to 9 Years | 702 (4.7%) | 864 (5.5%) |
| 10 to 14 Years | 1,124 (7.5%) | 1,472 (9.4%) |
| 15 to 19 Years | 1,258 (8.4%) | 1,028 (6.5%) |
| 20 to 24 Years | 402 (2.7%) | 466 (3.0%) |
| 25 to 29 Years | 513 (3.4%) | 544 (3.5%) |
| 30 to 34 Years | 542 (3.6%) | 784 (5.0%) |
| 35 to 39 Years | 1,109 (7.4%) | 744 (4.7%) |
| 40 to 44 Years | 819 (5.5%) | 865 (5.5%) |
| 45 to 49 Years | 996 (6.7%) | 1,005 (6.4%) |
| 50 to 54 Years | 1,028 (6.9%) | 1,334 (8.5%) |
| 55 to 59 Years | 1,118 (7.5%) | 1,282 (8.2%) |
| 60 to 64 Years | 1,315 (8.8%) | 1,125 (7.2%) |
| 65 to 69 Years | 1,311 (8.8%) | 1,171 (7.4%) |
| 70 to 74 Years | 901 (6.0%) | 997 (6.4%) |
| 75 to 79 Years | 619 (4.2%) | 570 (3.6%) |
| 80 to 84 Years | 203 (1.4%) | 609 (3.9%) |
| 85 Years and over | 170 (1.1%) | 284 (1.8%) |
| Total | 14,922 (100.0%) | 15,713 (100.0%) |
Families and Households in Eagle
Median Family Size in Eagle
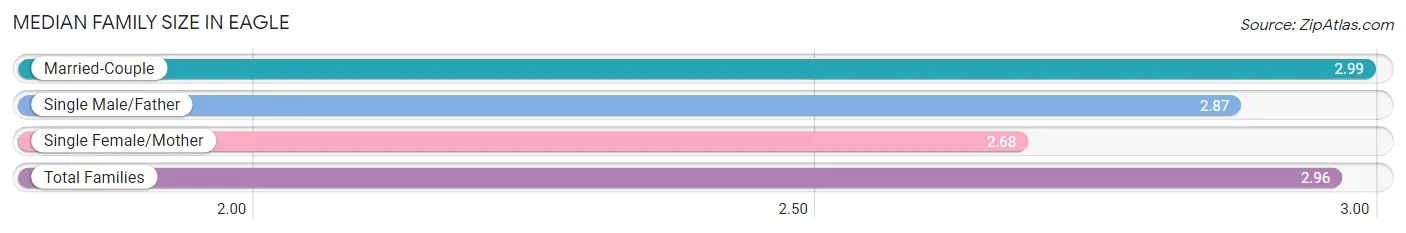
The median family size in Eagle is 2.96 persons per family, with married-couple families (7,962 | 86.2%) accounting for the largest median family size of 2.99 persons per family. On the other hand, single female/mother families (755 | 8.2%) represent the smallest median family size with 2.68 persons per family.
| Family Type | # Families | Family Size |
| Married-Couple | 7,962 (86.2%) | 2.99 |
| Single Male/Father | 519 (5.6%) | 2.87 |
| Single Female/Mother | 755 (8.2%) | 2.68 |
| Total Families | 9,236 (100.0%) | 2.96 |
Median Household Size in Eagle
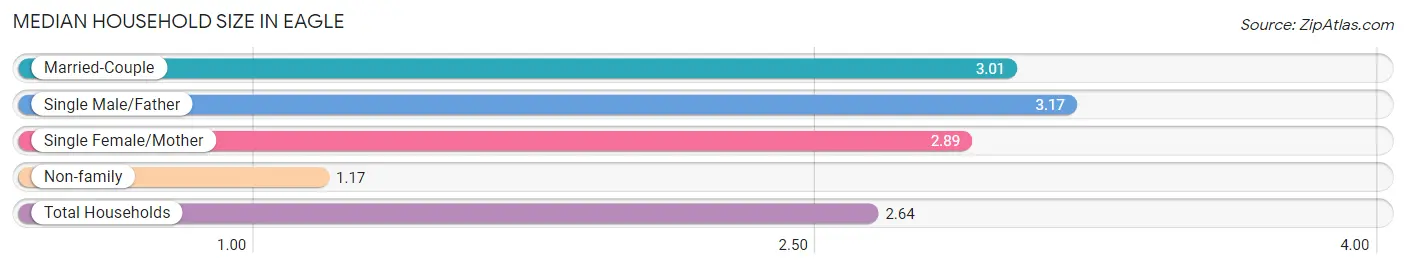
The median household size in Eagle is 2.64 persons per household, with single male/father households (519 | 4.5%) accounting for the largest median household size of 3.17 persons per household. non-family households (2,335 | 20.2%) represent the smallest median household size with 1.17 persons per household.
| Household Type | # Households | Household Size |
| Married-Couple | 7,962 (68.8%) | 3.01 |
| Single Male/Father | 519 (4.5%) | 3.17 |
| Single Female/Mother | 755 (6.5%) | 2.89 |
| Non-family | 2,335 (20.2%) | 1.17 |
| Total Households | 11,571 (100.0%) | 2.64 |
Household Size by Marriage Status in Eagle
Out of a total of 11,571 households in Eagle, 9,236 (79.8%) are family households, while 2,335 (20.2%) are nonfamily households. The most numerous type of family households are 2-person households, comprising 4,774, and the most common type of nonfamily households are 1-person households, comprising 2,077.
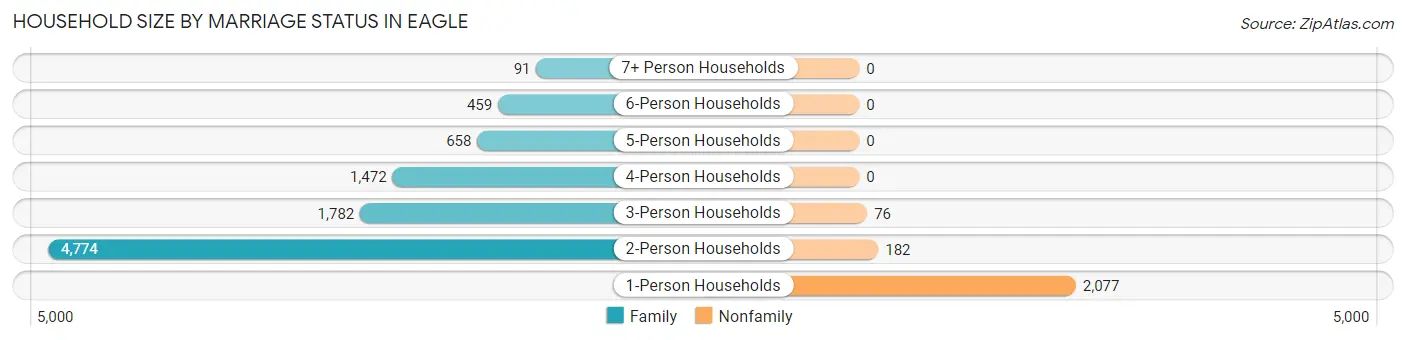
| Household Size | Family Households | Nonfamily Households |
| 1-Person Households | - | 2,077 (17.9%) |
| 2-Person Households | 4,774 (41.3%) | 182 (1.6%) |
| 3-Person Households | 1,782 (15.4%) | 76 (0.7%) |
| 4-Person Households | 1,472 (12.7%) | 0 (0.0%) |
| 5-Person Households | 658 (5.7%) | 0 (0.0%) |
| 6-Person Households | 459 (4.0%) | 0 (0.0%) |
| 7+ Person Households | 91 (0.8%) | 0 (0.0%) |
| Total | 9,236 (79.8%) | 2,335 (20.2%) |
Female Fertility in Eagle
Fertility by Age in Eagle
Average fertility rate in Eagle is 22.0 births per 1,000 women. Women in the age bracket of 20 to 34 years have the highest fertility rate with 33.0 births per 1,000 women. Women in the age bracket of 35 to 50 years acount for 51.6% of all women with births.
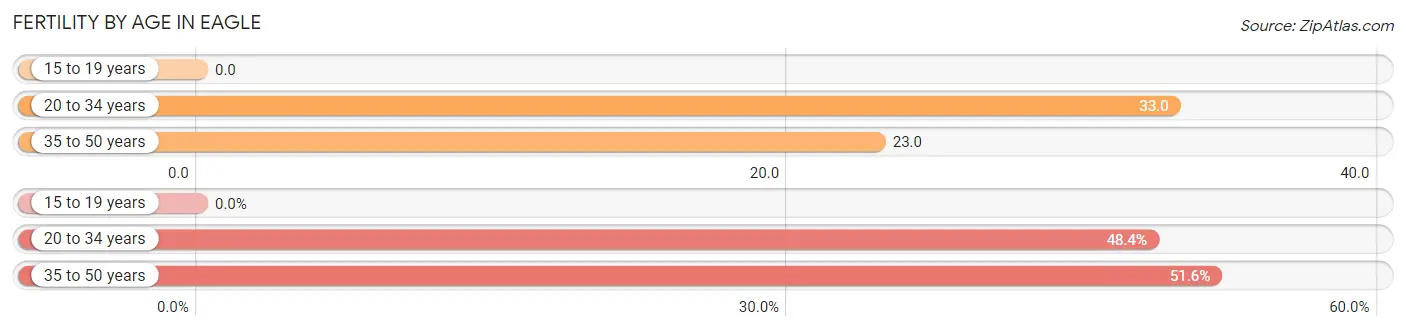
| Age Bracket | Women with Births | Births / 1,000 Women |
| 15 to 19 years | 0 (0.0%) | 0.0 |
| 20 to 34 years | 60 (48.4%) | 33.0 |
| 35 to 50 years | 64 (51.6%) | 23.0 |
| Total | 124 (100.0%) | 22.0 |
Fertility by Age by Marriage Status in Eagle
73.4% of women with births (124) in Eagle are married. The highest percentage of unmarried women with births falls into 35 to 50 years age bracket with 51.6% of them unmarried at the time of birth, while the lowest percentage of unmarried women with births belong to 20 to 34 years age bracket with 0.0% of them unmarried.
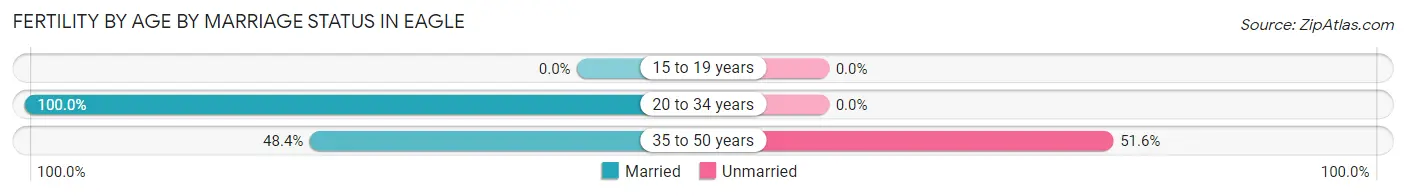
| Age Bracket | Married | Unmarried |
| 15 to 19 years | 0 (0.0%) | 0 (0.0%) |
| 20 to 34 years | 60 (100.0%) | 0 (0.0%) |
| 35 to 50 years | 31 (48.4%) | 33 (51.6%) |
| Total | 91 (73.4%) | 33 (26.6%) |
Fertility by Education in Eagle
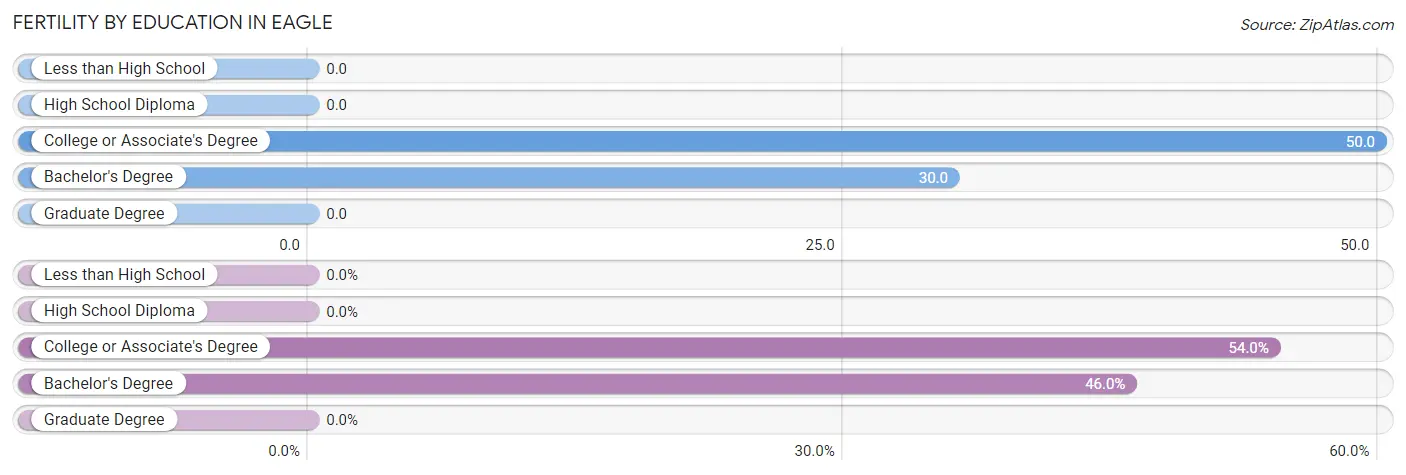
| Educational Attainment | Women with Births | Births / 1,000 Women |
| Less than High School | 0 (0.0%) | 0.0 |
| High School Diploma | 0 (0.0%) | 0.0 |
| College or Associate's Degree | 67 (54.0%) | 50.0 |
| Bachelor's Degree | 57 (46.0%) | 30.0 |
| Graduate Degree | 0 (0.0%) | 0.0 |
| Total | 124 (100.0%) | 22.0 |
Fertility by Education by Marriage Status in Eagle
26.6% of women with births in Eagle are unmarried. Women with the educational attainment of college or associate's degree are most likely to be married with 83.6% of them married at childbirth, while women with the educational attainment of bachelor's degree are least likely to be married with 38.6% of them unmarried at childbirth.
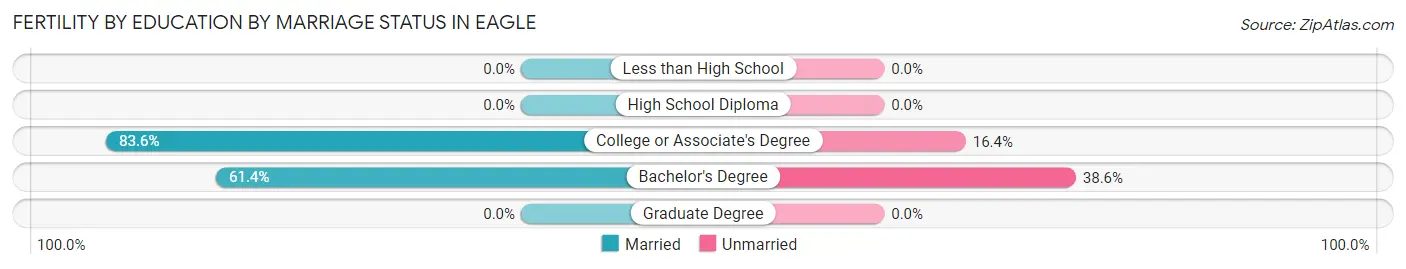
| Educational Attainment | Married | Unmarried |
| Less than High School | 0 (0.0%) | 0 (0.0%) |
| High School Diploma | 0 (0.0%) | 0 (0.0%) |
| College or Associate's Degree | 56 (83.6%) | 11 (16.4%) |
| Bachelor's Degree | 35 (61.4%) | 22 (38.6%) |
| Graduate Degree | 0 (0.0%) | 0 (0.0%) |
| Total | 91 (73.4%) | 33 (26.6%) |
Employment Characteristics in Eagle
Employment by Class of Employer in Eagle
Among the 13,589 employed individuals in Eagle, private company employees (8,566 | 63.0%), self-employed (incorporated) (1,420 | 10.4%), and self-employed (not incorporated) (1,330 | 9.8%) make up the most common classes of employment.
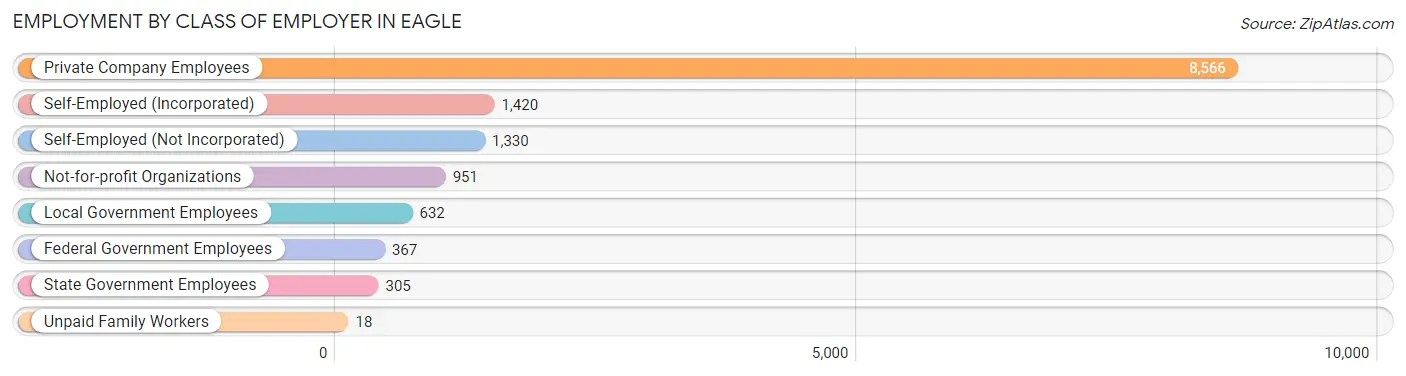
| Employer Class | # Employees | % Employees |
| Private Company Employees | 8,566 | 63.0% |
| Self-Employed (Incorporated) | 1,420 | 10.4% |
| Self-Employed (Not Incorporated) | 1,330 | 9.8% |
| Not-for-profit Organizations | 951 | 7.0% |
| Local Government Employees | 632 | 4.6% |
| State Government Employees | 305 | 2.2% |
| Federal Government Employees | 367 | 2.7% |
| Unpaid Family Workers | 18 | 0.1% |
| Total | 13,589 | 100.0% |
Employment Status by Age in Eagle
According to the labor force statistics for Eagle, out of the total population over 16 years of age (24,680), 56.3% or 13,895 individuals are in the labor force, with 1.5% or 208 of them unemployed. The age group with the highest labor force participation rate is 20 to 24 years, with 89.9% or 780 individuals in the labor force. Within the labor force, the 16 to 19 years age range has the highest percentage of unemployed individuals, with 8.7% or 78 of them being unemployed.
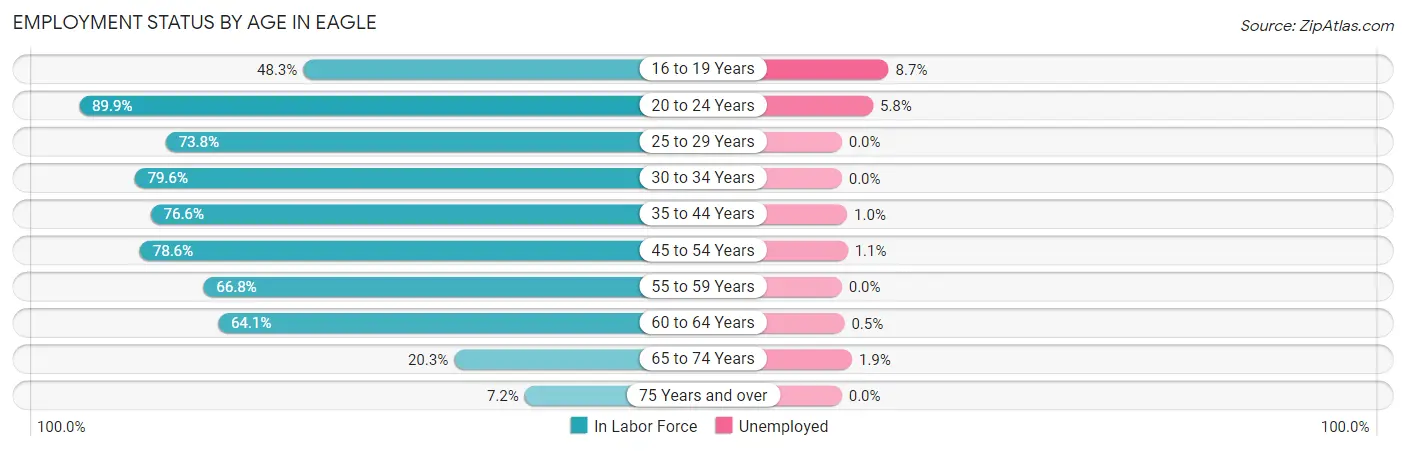
| Age Bracket | In Labor Force | Unemployed |
| 16 to 19 Years | 895 (48.3%) | 78 (8.7%) |
| 20 to 24 Years | 780 (89.9%) | 45 (5.8%) |
| 25 to 29 Years | 780 (73.8%) | 0 (0.0%) |
| 30 to 34 Years | 1,055 (79.6%) | 0 (0.0%) |
| 35 to 44 Years | 2,709 (76.6%) | 27 (1.0%) |
| 45 to 54 Years | 3,429 (78.6%) | 38 (1.1%) |
| 55 to 59 Years | 1,603 (66.8%) | 0 (0.0%) |
| 60 to 64 Years | 1,564 (64.1%) | 8 (0.5%) |
| 65 to 74 Years | 889 (20.3%) | 17 (1.9%) |
| 75 Years and over | 177 (7.2%) | 0 (0.0%) |
| Total | 13,895 (56.3%) | 208 (1.5%) |
Employment Status by Educational Attainment in Eagle
According to labor force statistics for Eagle, 73.7% of individuals (11,146) out of the total population between 25 and 64 years of age (15,123) are in the labor force, with 0.7% or 78 of them being unemployed. The group with the highest labor force participation rate are those with the educational attainment of bachelor's degree or higher, with 77.5% or 6,131 individuals in the labor force. Within the labor force, individuals with high school diploma education have the highest percentage of unemployment, with 1.3% or 19 of them being unemployed.
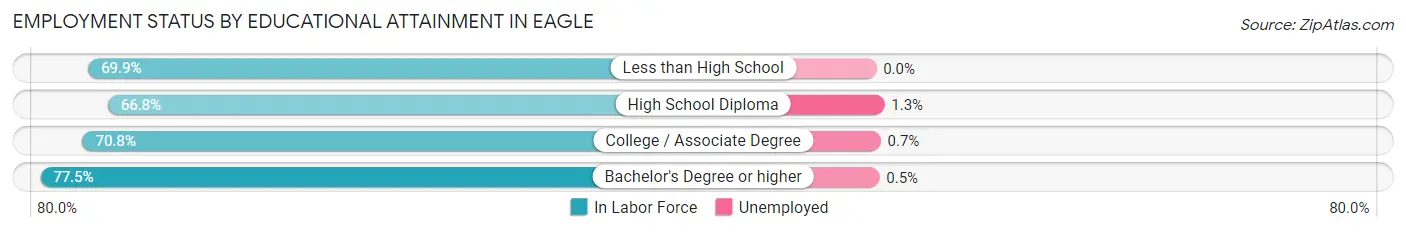
| Educational Attainment | In Labor Force | Unemployed |
| Less than High School | 446 (69.9%) | 0 (0.0%) |
| High School Diploma | 1,435 (66.8%) | 28 (1.3%) |
| College / Associate Degree | 3,134 (70.8%) | 31 (0.7%) |
| Bachelor's Degree or higher | 6,131 (77.5%) | 40 (0.5%) |
| Total | 11,146 (73.7%) | 106 (0.7%) |
Employment Occupations by Sex in Eagle
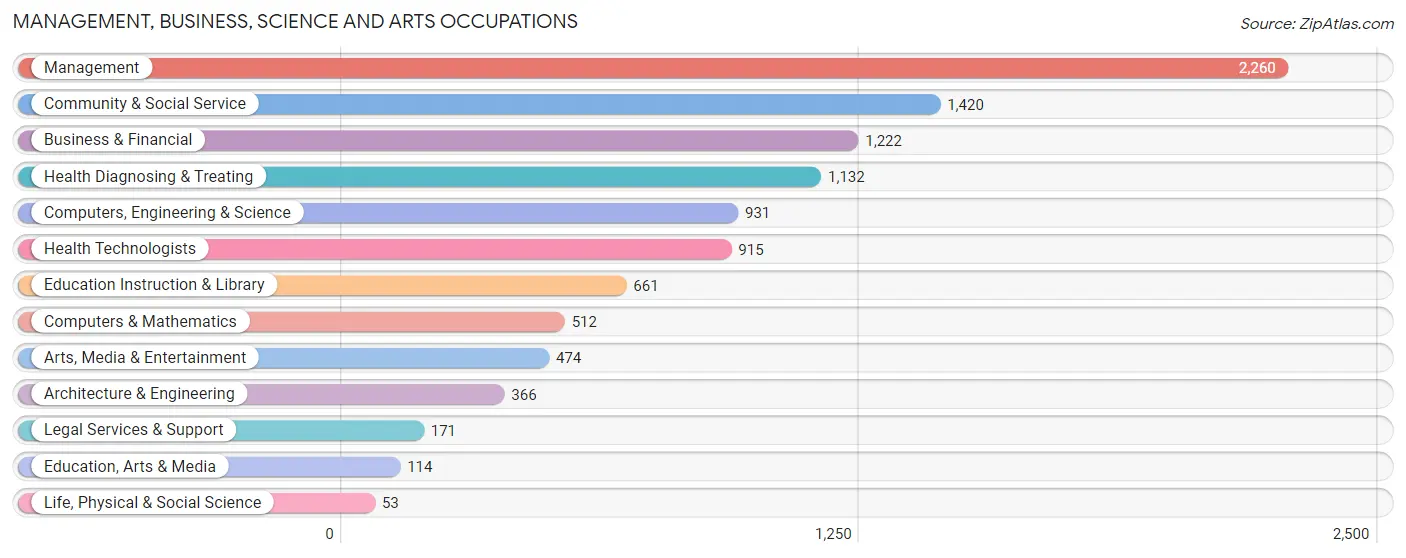
Management, Business, Science and Arts Occupations
The most common Management, Business, Science and Arts occupations in Eagle are Management (2,260 | 16.5%), Community & Social Service (1,420 | 10.4%), Business & Financial (1,222 | 8.9%), Health Diagnosing & Treating (1,132 | 8.3%), and Computers, Engineering & Science (931 | 6.8%).
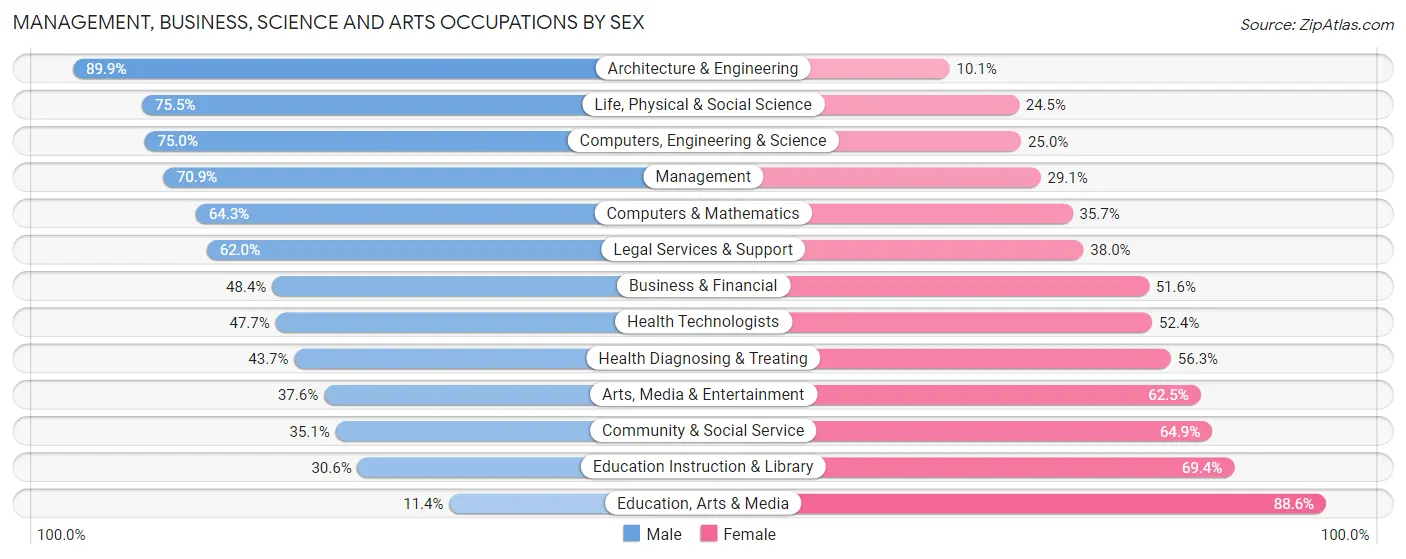
Management, Business, Science and Arts Occupations by Sex
Within the Management, Business, Science and Arts occupations in Eagle, the most male-oriented occupations are Architecture & Engineering (89.9%), Life, Physical & Social Science (75.5%), and Computers, Engineering & Science (75.0%), while the most female-oriented occupations are Education, Arts & Media (88.6%), Education Instruction & Library (69.4%), and Community & Social Service (64.9%).
| Occupation | Male | Female |
| Management | 1,603 (70.9%) | 657 (29.1%) |
| Business & Financial | 591 (48.4%) | 631 (51.6%) |
| Computers, Engineering & Science | 698 (75.0%) | 233 (25.0%) |
| Computers & Mathematics | 329 (64.3%) | 183 (35.7%) |
| Architecture & Engineering | 329 (89.9%) | 37 (10.1%) |
| Life, Physical & Social Science | 40 (75.5%) | 13 (24.5%) |
| Community & Social Service | 499 (35.1%) | 921 (64.9%) |
| Education, Arts & Media | 13 (11.4%) | 101 (88.6%) |
| Legal Services & Support | 106 (62.0%) | 65 (38.0%) |
| Education Instruction & Library | 202 (30.6%) | 459 (69.4%) |
| Arts, Media & Entertainment | 178 (37.6%) | 296 (62.5%) |
| Health Diagnosing & Treating | 495 (43.7%) | 637 (56.3%) |
| Health Technologists | 436 (47.6%) | 479 (52.3%) |
| Total (Category) | 3,886 (55.8%) | 3,079 (44.2%) |
| Total (Overall) | 7,902 (57.8%) | 5,774 (42.2%) |
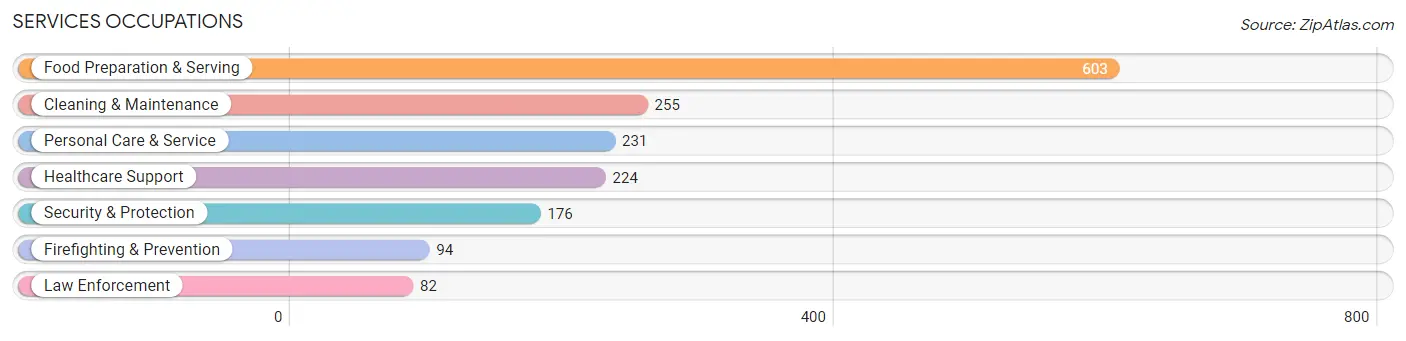
Services Occupations
The most common Services occupations in Eagle are Food Preparation & Serving (603 | 4.4%), Cleaning & Maintenance (255 | 1.9%), Personal Care & Service (231 | 1.7%), Healthcare Support (224 | 1.6%), and Security & Protection (176 | 1.3%).
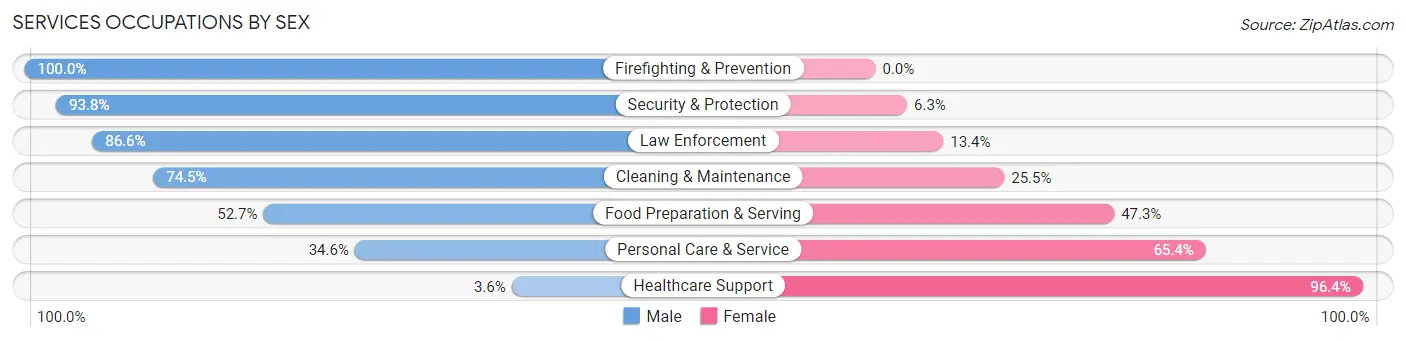
Services Occupations by Sex
Within the Services occupations in Eagle, the most male-oriented occupations are Firefighting & Prevention (100.0%), Security & Protection (93.8%), and Law Enforcement (86.6%), while the most female-oriented occupations are Healthcare Support (96.4%), Personal Care & Service (65.4%), and Food Preparation & Serving (47.3%).
| Occupation | Male | Female |
| Healthcare Support | 8 (3.6%) | 216 (96.4%) |
| Security & Protection | 165 (93.8%) | 11 (6.2%) |
| Firefighting & Prevention | 94 (100.0%) | 0 (0.0%) |
| Law Enforcement | 71 (86.6%) | 11 (13.4%) |
| Food Preparation & Serving | 318 (52.7%) | 285 (47.3%) |
| Cleaning & Maintenance | 190 (74.5%) | 65 (25.5%) |
| Personal Care & Service | 80 (34.6%) | 151 (65.4%) |
| Total (Category) | 761 (51.1%) | 728 (48.9%) |
| Total (Overall) | 7,902 (57.8%) | 5,774 (42.2%) |
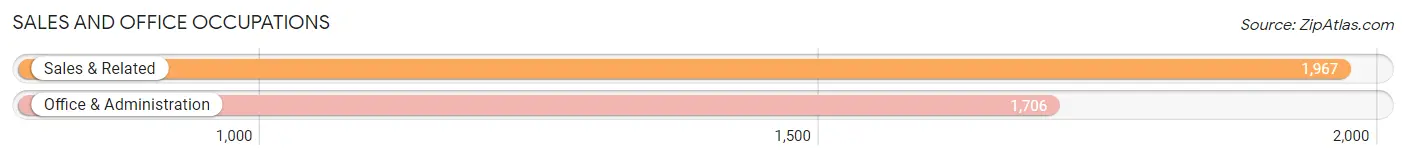
Sales and Office Occupations
The most common Sales and Office occupations in Eagle are Sales & Related (1,967 | 14.4%), and Office & Administration (1,706 | 12.5%).
Sales and Office Occupations by Sex
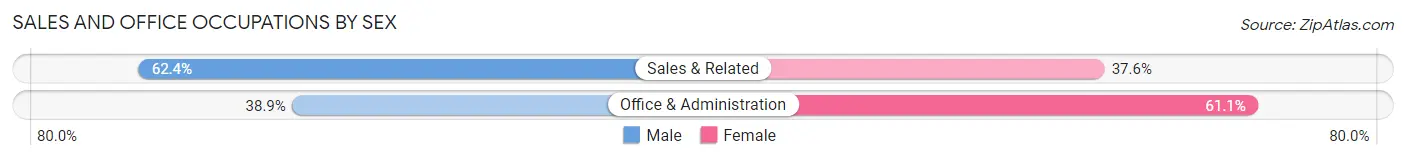
| Occupation | Male | Female |
| Sales & Related | 1,228 (62.4%) | 739 (37.6%) |
| Office & Administration | 664 (38.9%) | 1,042 (61.1%) |
| Total (Category) | 1,892 (51.5%) | 1,781 (48.5%) |
| Total (Overall) | 7,902 (57.8%) | 5,774 (42.2%) |
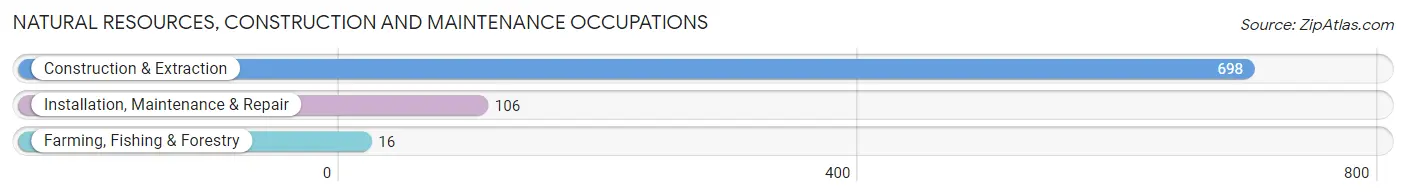
Natural Resources, Construction and Maintenance Occupations
The most common Natural Resources, Construction and Maintenance occupations in Eagle are Construction & Extraction (698 | 5.1%), Installation, Maintenance & Repair (106 | 0.8%), and Farming, Fishing & Forestry (16 | 0.1%).
Natural Resources, Construction and Maintenance Occupations by Sex
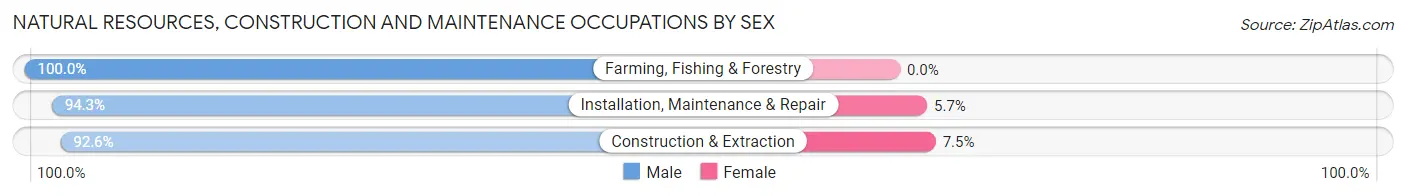
| Occupation | Male | Female |
| Farming, Fishing & Forestry | 16 (100.0%) | 0 (0.0%) |
| Construction & Extraction | 646 (92.5%) | 52 (7.4%) |
| Installation, Maintenance & Repair | 100 (94.3%) | 6 (5.7%) |
| Total (Category) | 762 (92.9%) | 58 (7.1%) |
| Total (Overall) | 7,902 (57.8%) | 5,774 (42.2%) |
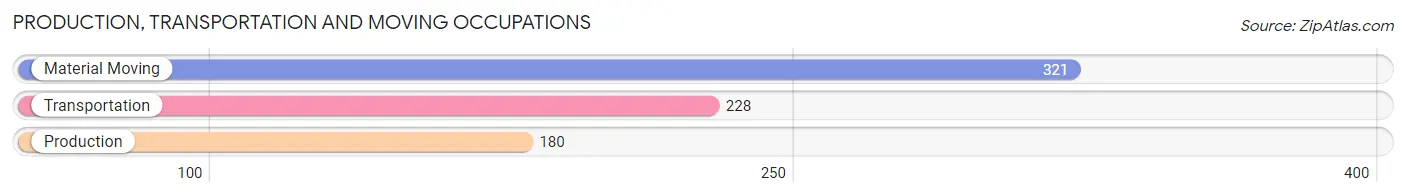
Production, Transportation and Moving Occupations
The most common Production, Transportation and Moving occupations in Eagle are Material Moving (321 | 2.4%), Transportation (228 | 1.7%), and Production (180 | 1.3%).
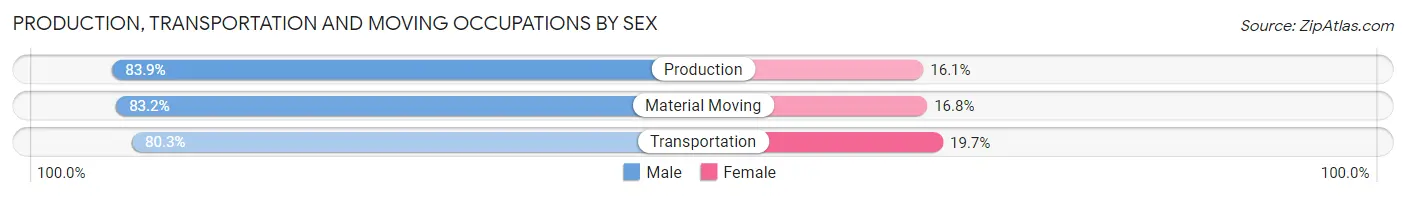
Production, Transportation and Moving Occupations by Sex
| Occupation | Male | Female |
| Production | 151 (83.9%) | 29 (16.1%) |
| Transportation | 183 (80.3%) | 45 (19.7%) |
| Material Moving | 267 (83.2%) | 54 (16.8%) |
| Total (Category) | 601 (82.4%) | 128 (17.6%) |
| Total (Overall) | 7,902 (57.8%) | 5,774 (42.2%) |
Employment Industries by Sex in Eagle
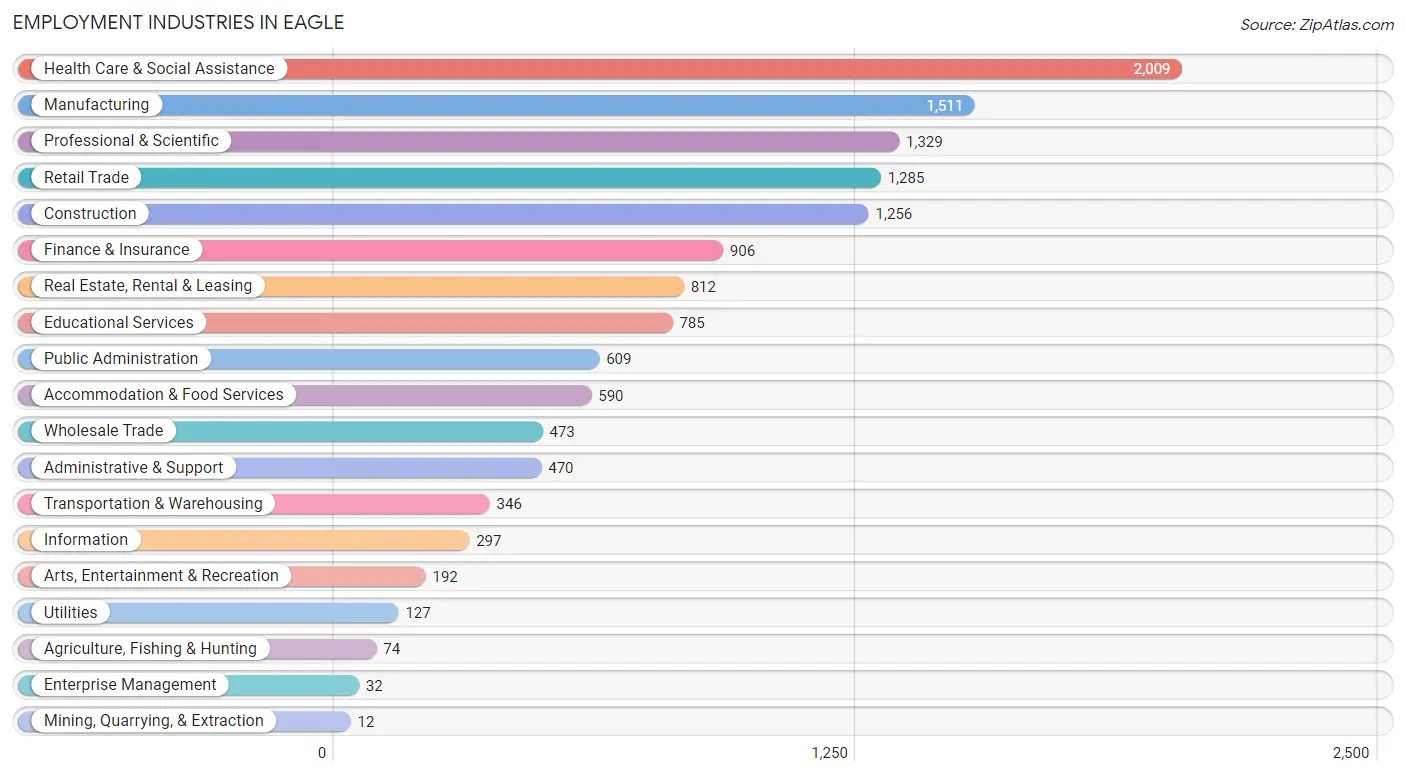
Employment Industries in Eagle
The major employment industries in Eagle include Health Care & Social Assistance (2,009 | 14.7%), Manufacturing (1,511 | 11.1%), Professional & Scientific (1,329 | 9.7%), Retail Trade (1,285 | 9.4%), and Construction (1,256 | 9.2%).
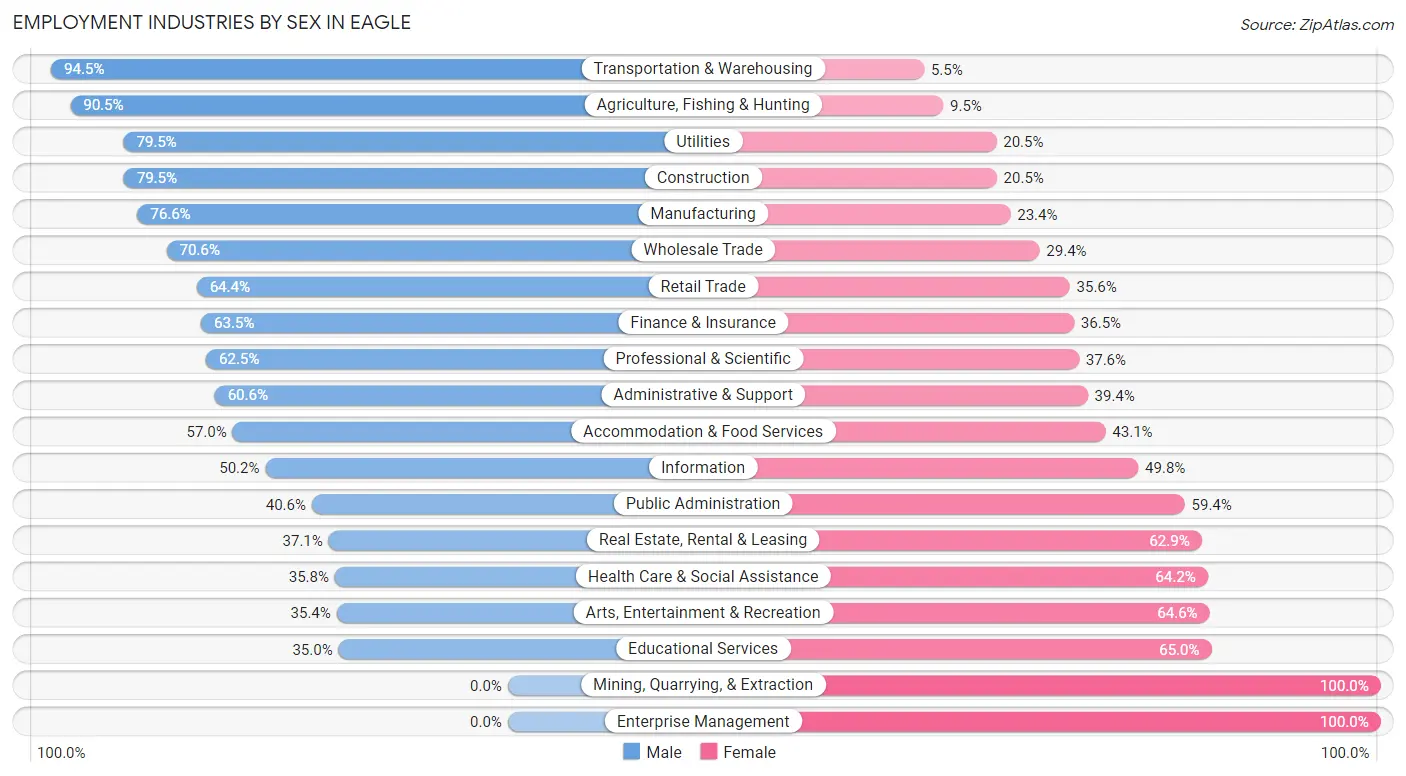
Employment Industries by Sex in Eagle
The Eagle industries that see more men than women are Transportation & Warehousing (94.5%), Agriculture, Fishing & Hunting (90.5%), and Utilities (79.5%), whereas the industries that tend to have a higher number of women are Mining, Quarrying, & Extraction (100.0%), Enterprise Management (100.0%), and Educational Services (65.0%).
| Industry | Male | Female |
| Agriculture, Fishing & Hunting | 67 (90.5%) | 7 (9.5%) |
| Mining, Quarrying, & Extraction | 0 (0.0%) | 12 (100.0%) |
| Construction | 998 (79.5%) | 258 (20.5%) |
| Manufacturing | 1,158 (76.6%) | 353 (23.4%) |
| Wholesale Trade | 334 (70.6%) | 139 (29.4%) |
| Retail Trade | 827 (64.4%) | 458 (35.6%) |
| Transportation & Warehousing | 327 (94.5%) | 19 (5.5%) |
| Utilities | 101 (79.5%) | 26 (20.5%) |
| Information | 149 (50.2%) | 148 (49.8%) |
| Finance & Insurance | 575 (63.5%) | 331 (36.5%) |
| Real Estate, Rental & Leasing | 301 (37.1%) | 511 (62.9%) |
| Professional & Scientific | 830 (62.5%) | 499 (37.6%) |
| Enterprise Management | 0 (0.0%) | 32 (100.0%) |
| Administrative & Support | 285 (60.6%) | 185 (39.4%) |
| Educational Services | 275 (35.0%) | 510 (65.0%) |
| Health Care & Social Assistance | 719 (35.8%) | 1,290 (64.2%) |
| Arts, Entertainment & Recreation | 68 (35.4%) | 124 (64.6%) |
| Accommodation & Food Services | 336 (57.0%) | 254 (43.0%) |
| Public Administration | 247 (40.6%) | 362 (59.4%) |
| Total | 7,902 (57.8%) | 5,774 (42.2%) |
Education in Eagle
School Enrollment in Eagle
The most common levels of schooling among the 7,435 students in Eagle are high school (2,204 | 29.6%), middle school (2,095 | 28.2%), and elementary school (1,472 | 19.8%).
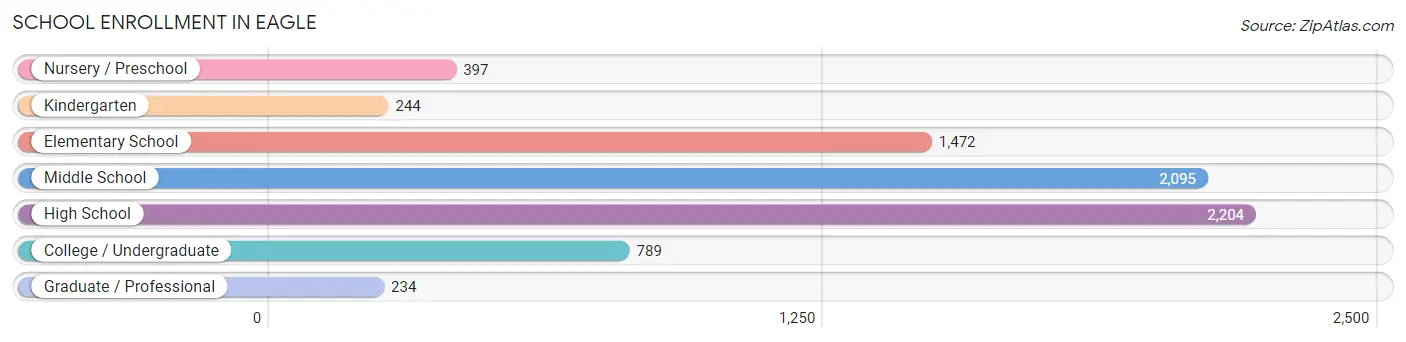
| School Level | # Students | % Students |
| Nursery / Preschool | 397 | 5.3% |
| Kindergarten | 244 | 3.3% |
| Elementary School | 1,472 | 19.8% |
| Middle School | 2,095 | 28.2% |
| High School | 2,204 | 29.6% |
| College / Undergraduate | 789 | 10.6% |
| Graduate / Professional | 234 | 3.2% |
| Total | 7,435 | 100.0% |
School Enrollment by Age by Funding Source in Eagle
Out of a total of 7,435 students who are enrolled in schools in Eagle, 1,874 (25.2%) attend a private institution, while the remaining 5,561 (74.8%) are enrolled in public schools. The age group of 3 to 4 year olds has the highest likelihood of being enrolled in private schools, with 262 (85.1% in the age bracket) enrolled. Conversely, the age group of 18 to 19 year olds has the lowest likelihood of being enrolled in a private school, with 380 (93.8% in the age bracket) attending a public institution.
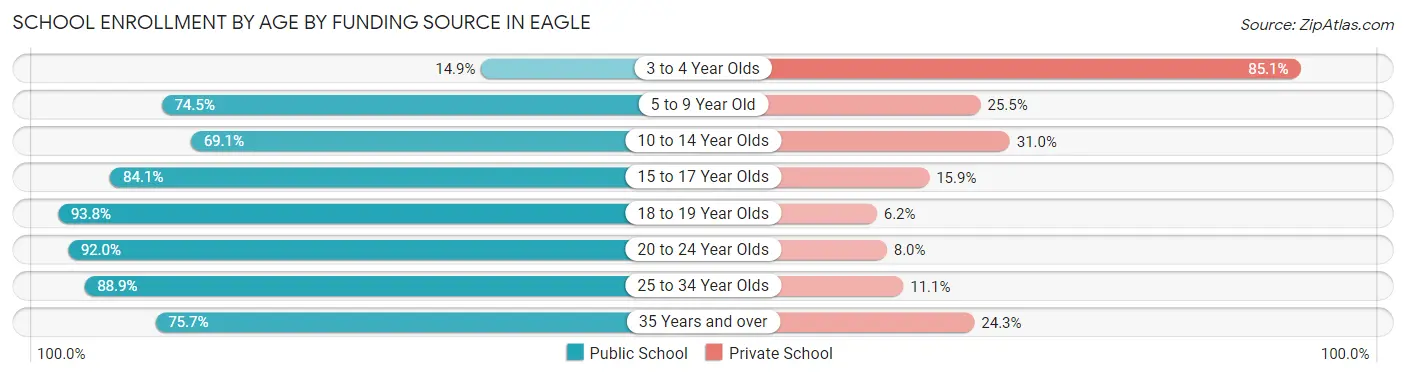
| Age Bracket | Public School | Private School |
| 3 to 4 Year Olds | 46 (14.9%) | 262 (85.1%) |
| 5 to 9 Year Old | 1,128 (74.5%) | 386 (25.5%) |
| 10 to 14 Year Olds | 1,787 (69.1%) | 801 (30.9%) |
| 15 to 17 Year Olds | 1,434 (84.1%) | 272 (15.9%) |
| 18 to 19 Year Olds | 380 (93.8%) | 25 (6.2%) |
| 20 to 24 Year Olds | 355 (92.0%) | 31 (8.0%) |
| 25 to 34 Year Olds | 232 (88.9%) | 29 (11.1%) |
| 35 Years and over | 202 (75.7%) | 65 (24.3%) |
| Total | 5,561 (74.8%) | 1,874 (25.2%) |
Educational Attainment by Field of Study in Eagle
Business (3,330 | 28.0%), education (1,515 | 12.7%), science & technology (1,366 | 11.5%), engineering (1,308 | 11.0%), and bio, nature & agricultural (842 | 7.1%) are the most common fields of study among 11,888 individuals in Eagle who have obtained a bachelor's degree or higher.
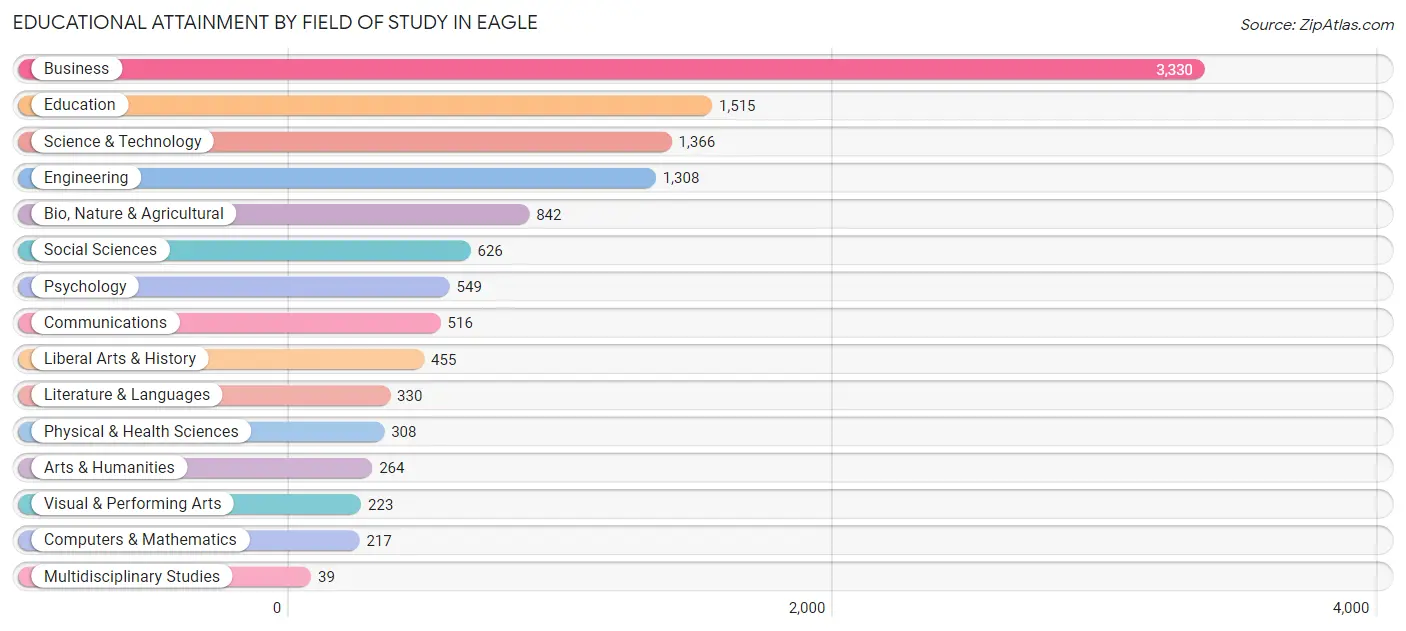
| Field of Study | # Graduates | % Graduates |
| Computers & Mathematics | 217 | 1.8% |
| Bio, Nature & Agricultural | 842 | 7.1% |
| Physical & Health Sciences | 308 | 2.6% |
| Psychology | 549 | 4.6% |
| Social Sciences | 626 | 5.3% |
| Engineering | 1,308 | 11.0% |
| Multidisciplinary Studies | 39 | 0.3% |
| Science & Technology | 1,366 | 11.5% |
| Business | 3,330 | 28.0% |
| Education | 1,515 | 12.7% |
| Literature & Languages | 330 | 2.8% |
| Liberal Arts & History | 455 | 3.8% |
| Visual & Performing Arts | 223 | 1.9% |
| Communications | 516 | 4.3% |
| Arts & Humanities | 264 | 2.2% |
| Total | 11,888 | 100.0% |
Transportation & Commute in Eagle
Vehicle Availability by Sex in Eagle
The most prevalent vehicle ownership categories in Eagle are males with 2 vehicles (3,339, accounting for 42.3%) and females with 2 vehicles (2,444, making up 58.7%).
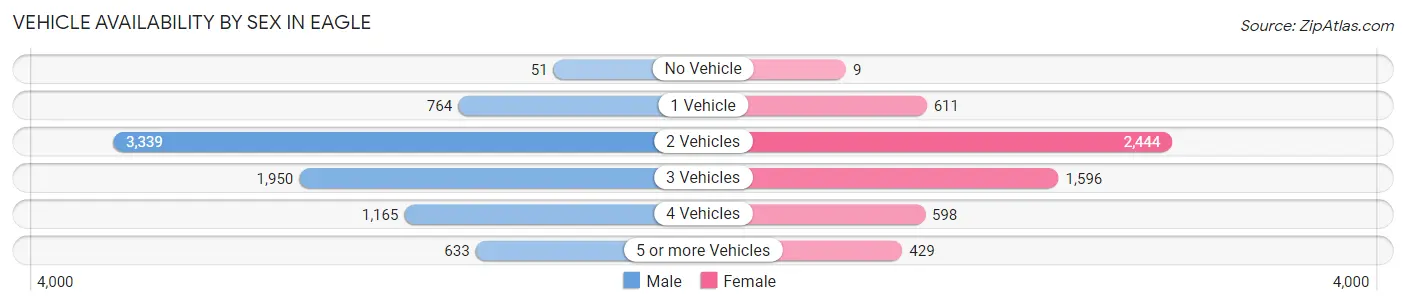
| Vehicles Available | Male | Female |
| No Vehicle | 51 (0.6%) | 9 (0.2%) |
| 1 Vehicle | 764 (9.7%) | 611 (10.7%) |
| 2 Vehicles | 3,339 (42.3%) | 2,444 (43.0%) |
| 3 Vehicles | 1,950 (24.7%) | 1,596 (28.1%) |
| 4 Vehicles | 1,165 (14.7%) | 598 (10.5%) |
| 5 or more Vehicles | 633 (8.0%) | 429 (7.5%) |
| Total | 7,902 (100.0%) | 5,687 (100.0%) |
Commute Time in Eagle
The most frequently occuring commute durations in Eagle are 30 to 34 minutes (2,690 commuters, 25.9%), 20 to 24 minutes (1,959 commuters, 18.9%), and 15 to 19 minutes (1,650 commuters, 15.9%).
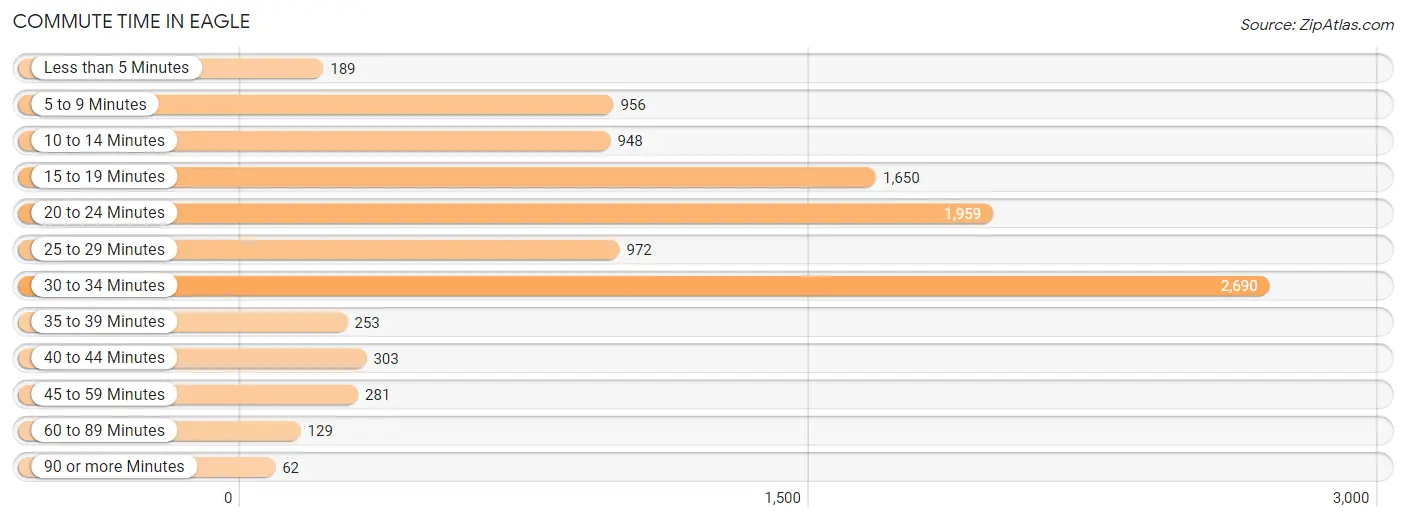
| Commute Time | # Commuters | % Commuters |
| Less than 5 Minutes | 189 | 1.8% |
| 5 to 9 Minutes | 956 | 9.2% |
| 10 to 14 Minutes | 948 | 9.1% |
| 15 to 19 Minutes | 1,650 | 15.9% |
| 20 to 24 Minutes | 1,959 | 18.9% |
| 25 to 29 Minutes | 972 | 9.3% |
| 30 to 34 Minutes | 2,690 | 25.9% |
| 35 to 39 Minutes | 253 | 2.4% |
| 40 to 44 Minutes | 303 | 2.9% |
| 45 to 59 Minutes | 281 | 2.7% |
| 60 to 89 Minutes | 129 | 1.2% |
| 90 or more Minutes | 62 | 0.6% |
Commute Time by Sex in Eagle
The most common commute times in Eagle are 30 to 34 minutes (1,709 commuters, 27.9%) for males and 20 to 24 minutes (1,030 commuters, 24.1%) for females.
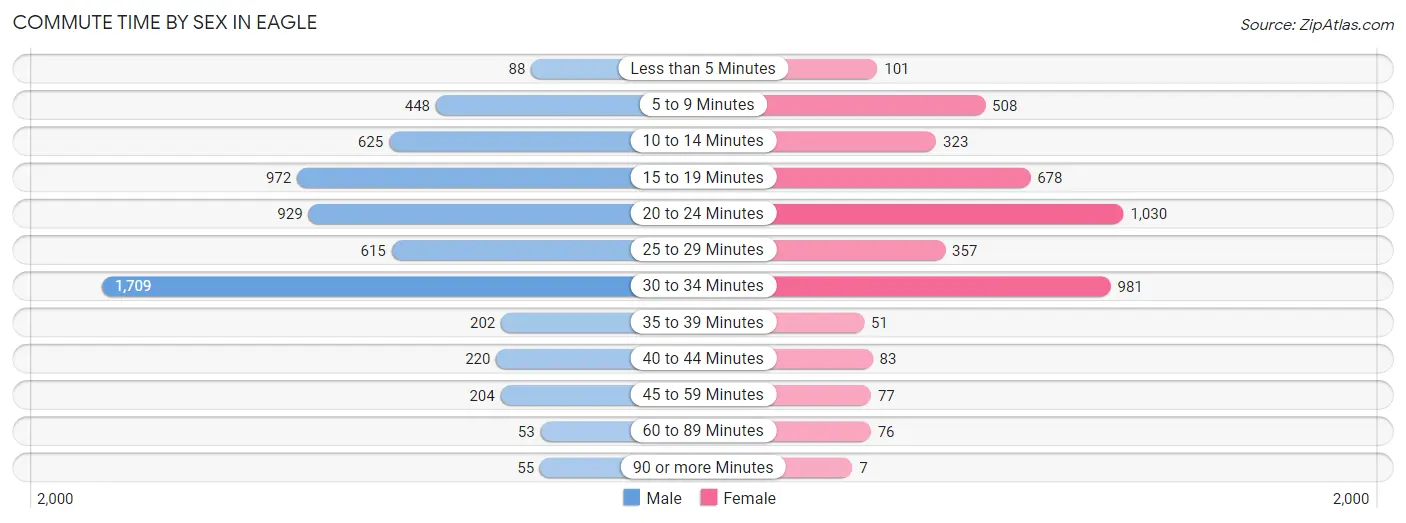
| Commute Time | Male | Female |
| Less than 5 Minutes | 88 (1.4%) | 101 (2.4%) |
| 5 to 9 Minutes | 448 (7.3%) | 508 (11.9%) |
| 10 to 14 Minutes | 625 (10.2%) | 323 (7.6%) |
| 15 to 19 Minutes | 972 (15.9%) | 678 (15.9%) |
| 20 to 24 Minutes | 929 (15.2%) | 1,030 (24.1%) |
| 25 to 29 Minutes | 615 (10.1%) | 357 (8.4%) |
| 30 to 34 Minutes | 1,709 (27.9%) | 981 (23.0%) |
| 35 to 39 Minutes | 202 (3.3%) | 51 (1.2%) |
| 40 to 44 Minutes | 220 (3.6%) | 83 (1.9%) |
| 45 to 59 Minutes | 204 (3.3%) | 77 (1.8%) |
| 60 to 89 Minutes | 53 (0.9%) | 76 (1.8%) |
| 90 or more Minutes | 55 (0.9%) | 7 (0.2%) |
Time of Departure to Work by Sex in Eagle
The most frequent times of departure to work in Eagle are 7:00 AM to 7:29 AM (1,158, 18.9%) for males and 7:30 AM to 7:59 AM (495, 11.6%) for females.
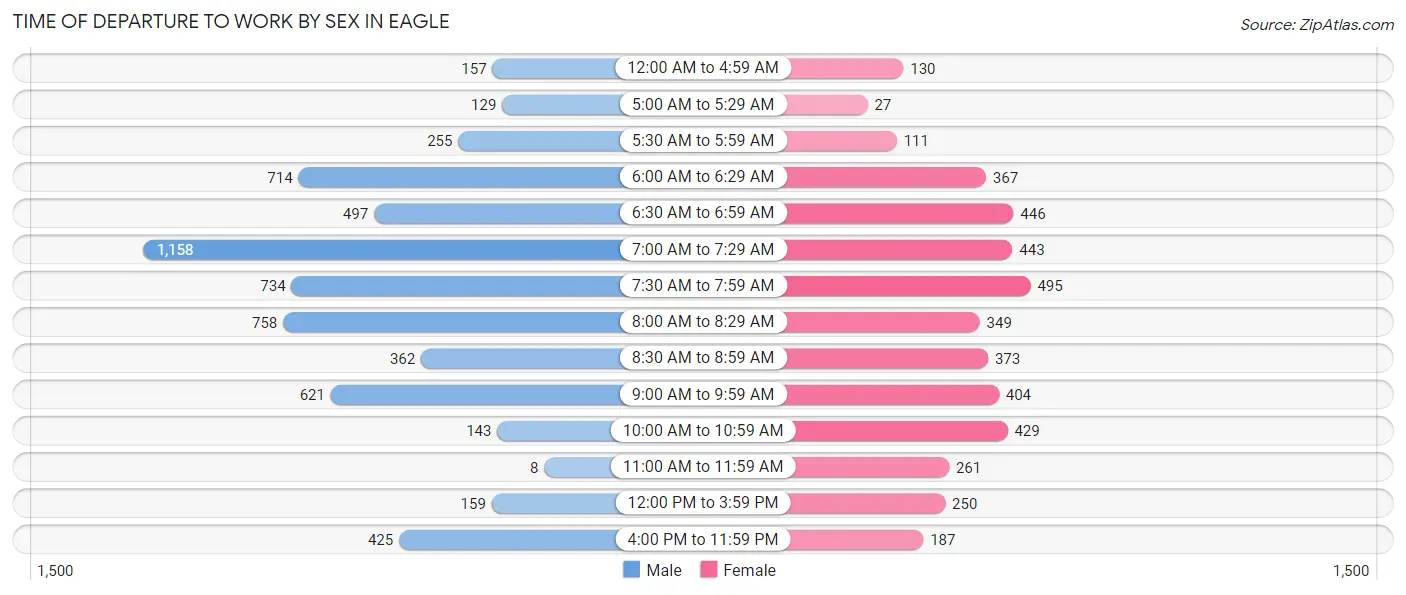
| Time of Departure | Male | Female |
| 12:00 AM to 4:59 AM | 157 (2.6%) | 130 (3.0%) |
| 5:00 AM to 5:29 AM | 129 (2.1%) | 27 (0.6%) |
| 5:30 AM to 5:59 AM | 255 (4.2%) | 111 (2.6%) |
| 6:00 AM to 6:29 AM | 714 (11.7%) | 367 (8.6%) |
| 6:30 AM to 6:59 AM | 497 (8.1%) | 446 (10.4%) |
| 7:00 AM to 7:29 AM | 1,158 (18.9%) | 443 (10.4%) |
| 7:30 AM to 7:59 AM | 734 (12.0%) | 495 (11.6%) |
| 8:00 AM to 8:29 AM | 758 (12.4%) | 349 (8.2%) |
| 8:30 AM to 8:59 AM | 362 (5.9%) | 373 (8.7%) |
| 9:00 AM to 9:59 AM | 621 (10.2%) | 404 (9.5%) |
| 10:00 AM to 10:59 AM | 143 (2.3%) | 429 (10.0%) |
| 11:00 AM to 11:59 AM | 8 (0.1%) | 261 (6.1%) |
| 12:00 PM to 3:59 PM | 159 (2.6%) | 250 (5.9%) |
| 4:00 PM to 11:59 PM | 425 (6.9%) | 187 (4.4%) |
| Total | 6,120 (100.0%) | 4,272 (100.0%) |
Housing Occupancy in Eagle
Occupancy by Ownership in Eagle
Of the total 11,571 dwellings in Eagle, owner-occupied units account for 10,045 (86.8%), while renter-occupied units make up 1,526 (13.2%).
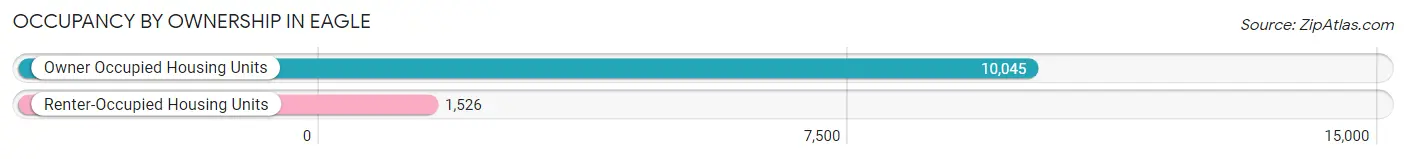
| Occupancy | # Housing Units | % Housing Units |
| Owner Occupied Housing Units | 10,045 | 86.8% |
| Renter-Occupied Housing Units | 1,526 | 13.2% |
| Total Occupied Housing Units | 11,571 | 100.0% |
Occupancy by Household Size in Eagle
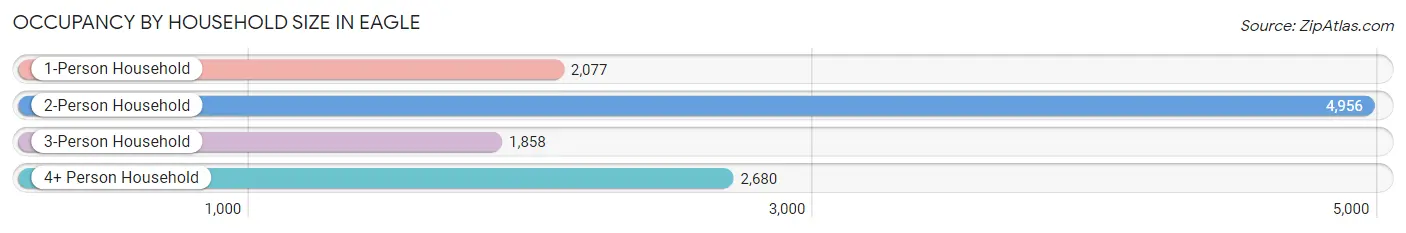
| Household Size | # Housing Units | % Housing Units |
| 1-Person Household | 2,077 | 17.9% |
| 2-Person Household | 4,956 | 42.8% |
| 3-Person Household | 1,858 | 16.1% |
| 4+ Person Household | 2,680 | 23.2% |
| Total Housing Units | 11,571 | 100.0% |
Occupancy by Ownership by Household Size in Eagle
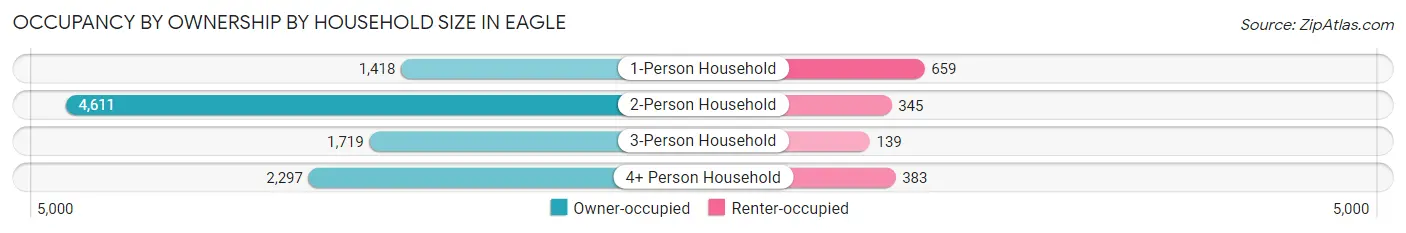
| Household Size | Owner-occupied | Renter-occupied |
| 1-Person Household | 1,418 (68.3%) | 659 (31.7%) |
| 2-Person Household | 4,611 (93.0%) | 345 (7.0%) |
| 3-Person Household | 1,719 (92.5%) | 139 (7.5%) |
| 4+ Person Household | 2,297 (85.7%) | 383 (14.3%) |
| Total Housing Units | 10,045 (86.8%) | 1,526 (13.2%) |
Occupancy by Educational Attainment in Eagle
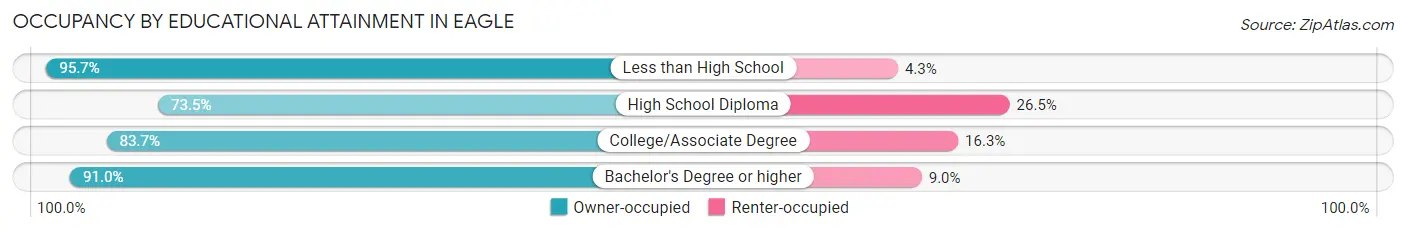
| Household Size | Owner-occupied | Renter-occupied |
| Less than High School | 310 (95.7%) | 14 (4.3%) |
| High School Diploma | 970 (73.5%) | 349 (26.5%) |
| College/Associate Degree | 3,079 (83.7%) | 598 (16.3%) |
| Bachelor's Degree or higher | 5,686 (91.0%) | 565 (9.0%) |
Occupancy by Age of Householder in Eagle
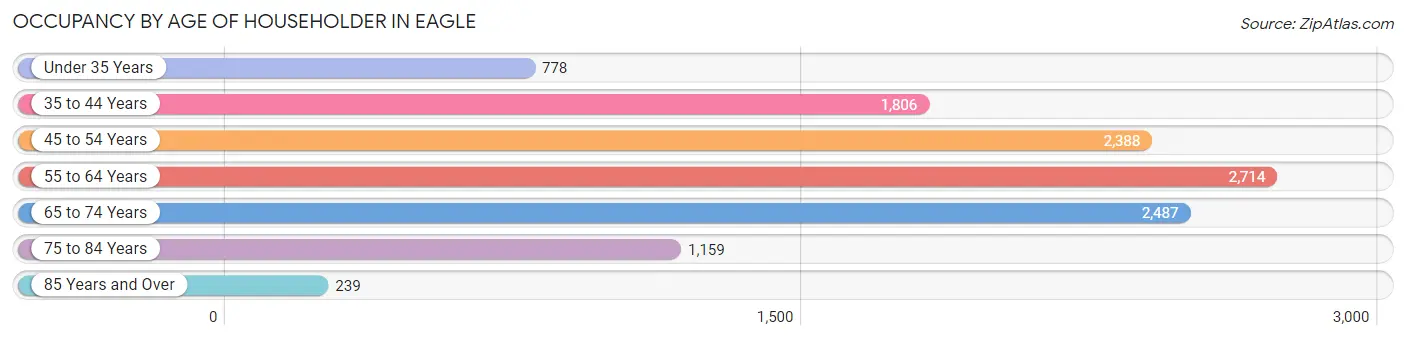
| Age Bracket | # Households | % Households |
| Under 35 Years | 778 | 6.7% |
| 35 to 44 Years | 1,806 | 15.6% |
| 45 to 54 Years | 2,388 | 20.6% |
| 55 to 64 Years | 2,714 | 23.5% |
| 65 to 74 Years | 2,487 | 21.5% |
| 75 to 84 Years | 1,159 | 10.0% |
| 85 Years and Over | 239 | 2.1% |
| Total | 11,571 | 100.0% |
Housing Finances in Eagle
Median Income by Occupancy in Eagle
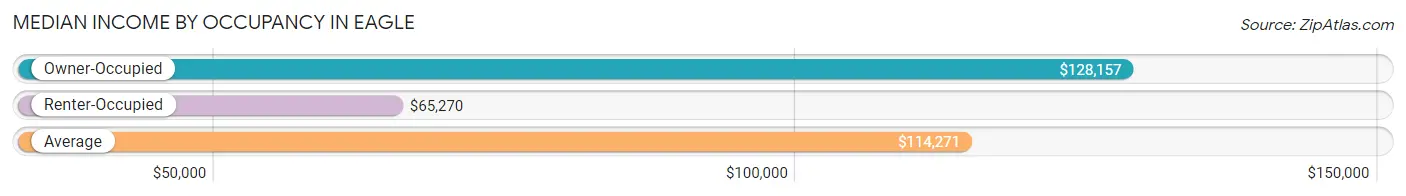
| Occupancy Type | # Households | Median Income |
| Owner-Occupied | 10,045 (86.8%) | $128,157 |
| Renter-Occupied | 1,526 (13.2%) | $65,270 |
| Average | 11,571 (100.0%) | $114,271 |
Occupancy by Householder Income Bracket in Eagle
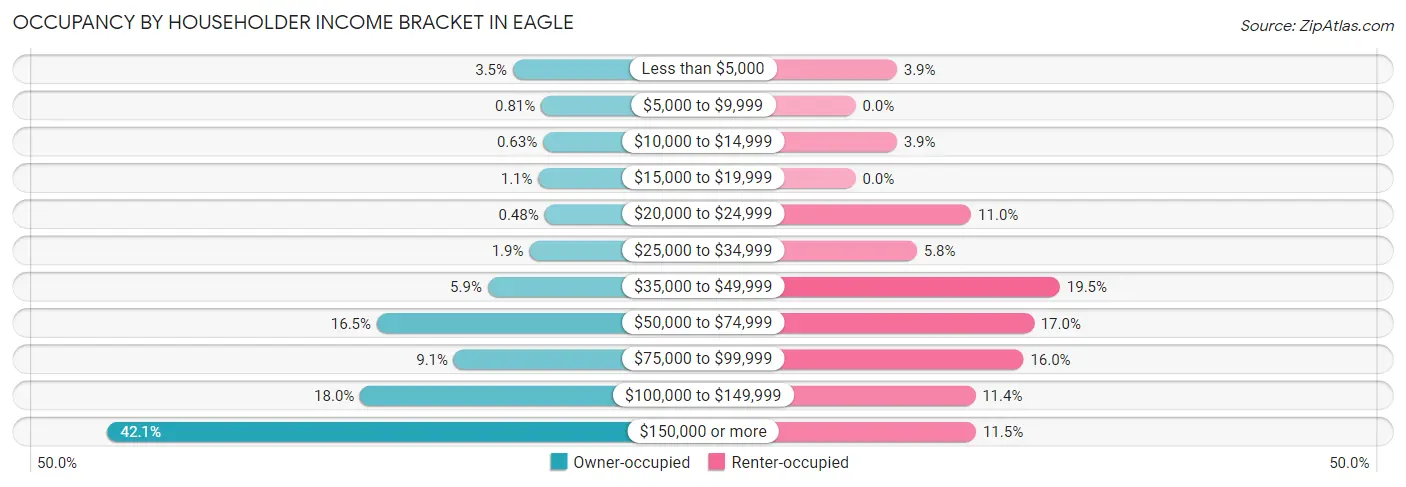
| Income Bracket | Owner-occupied | Renter-occupied |
| Less than $5,000 | 352 (3.5%) | 60 (3.9%) |
| $5,000 to $9,999 | 81 (0.8%) | 0 (0.0%) |
| $10,000 to $14,999 | 63 (0.6%) | 60 (3.9%) |
| $15,000 to $19,999 | 107 (1.1%) | 0 (0.0%) |
| $20,000 to $24,999 | 48 (0.5%) | 168 (11.0%) |
| $25,000 to $34,999 | 194 (1.9%) | 89 (5.8%) |
| $35,000 to $49,999 | 592 (5.9%) | 297 (19.5%) |
| $50,000 to $74,999 | 1,652 (16.5%) | 259 (17.0%) |
| $75,000 to $99,999 | 916 (9.1%) | 244 (16.0%) |
| $100,000 to $149,999 | 1,812 (18.0%) | 174 (11.4%) |
| $150,000 or more | 4,228 (42.1%) | 175 (11.5%) |
| Total | 10,045 (100.0%) | 1,526 (100.0%) |
Monthly Housing Cost Tiers in Eagle
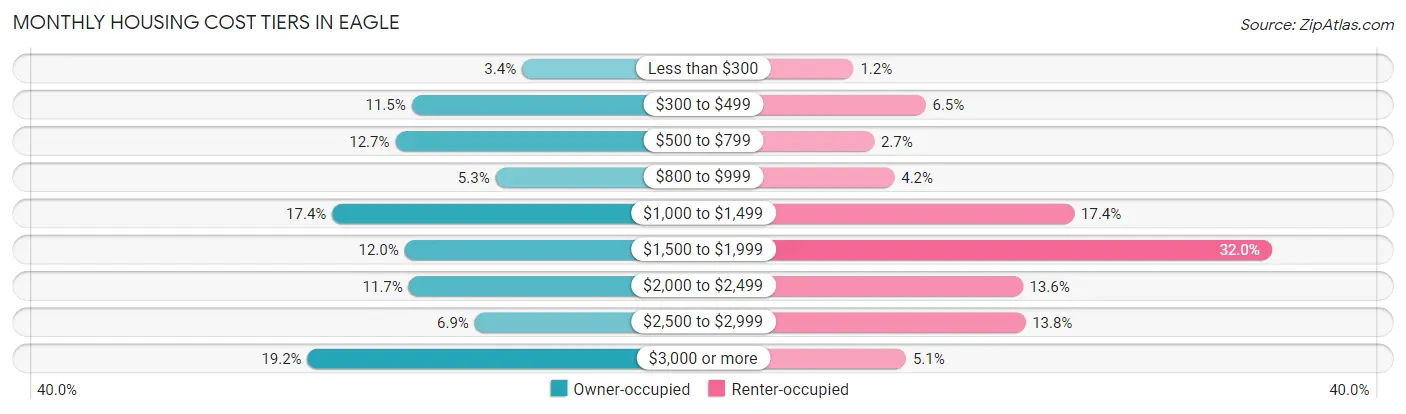
| Monthly Cost | Owner-occupied | Renter-occupied |
| Less than $300 | 339 (3.4%) | 18 (1.2%) |
| $300 to $499 | 1,155 (11.5%) | 99 (6.5%) |
| $500 to $799 | 1,276 (12.7%) | 41 (2.7%) |
| $800 to $999 | 534 (5.3%) | 64 (4.2%) |
| $1,000 to $1,499 | 1,743 (17.3%) | 266 (17.4%) |
| $1,500 to $1,999 | 1,207 (12.0%) | 488 (32.0%) |
| $2,000 to $2,499 | 1,177 (11.7%) | 208 (13.6%) |
| $2,500 to $2,999 | 688 (6.9%) | 211 (13.8%) |
| $3,000 or more | 1,926 (19.2%) | 77 (5.1%) |
| Total | 10,045 (100.0%) | 1,526 (100.0%) |
Physical Housing Characteristics in Eagle
Housing Structures in Eagle
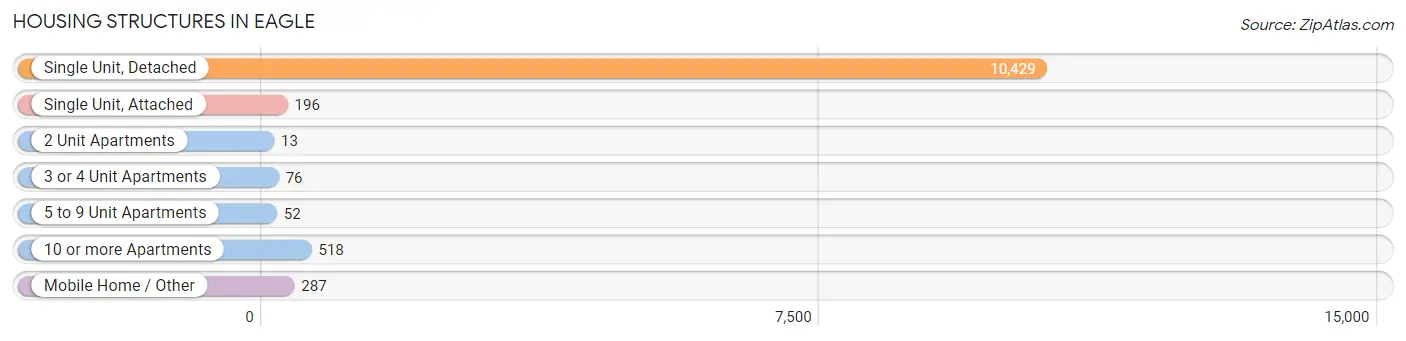
| Structure Type | # Housing Units | % Housing Units |
| Single Unit, Detached | 10,429 | 90.1% |
| Single Unit, Attached | 196 | 1.7% |
| 2 Unit Apartments | 13 | 0.1% |
| 3 or 4 Unit Apartments | 76 | 0.7% |
| 5 to 9 Unit Apartments | 52 | 0.4% |
| 10 or more Apartments | 518 | 4.5% |
| Mobile Home / Other | 287 | 2.5% |
| Total | 11,571 | 100.0% |
Housing Structures by Occupancy in Eagle
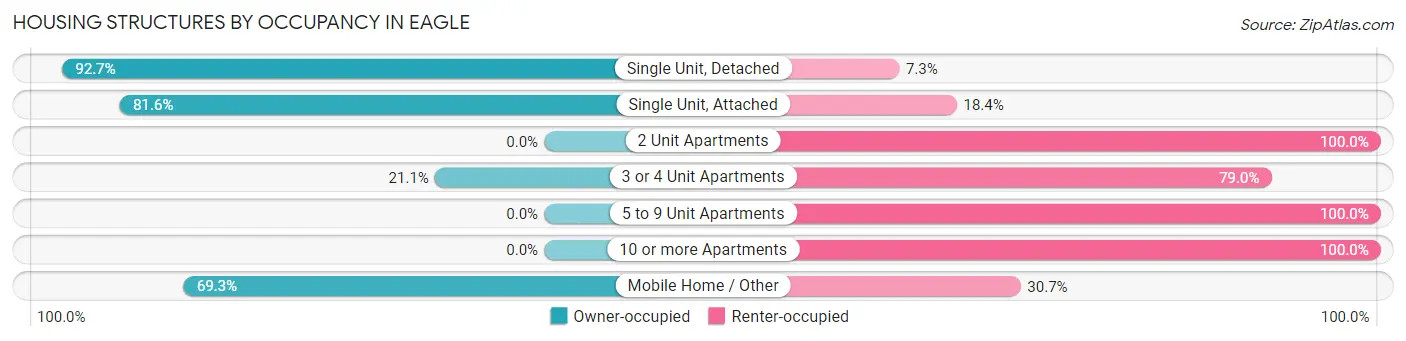
| Structure Type | Owner-occupied | Renter-occupied |
| Single Unit, Detached | 9,670 (92.7%) | 759 (7.3%) |
| Single Unit, Attached | 160 (81.6%) | 36 (18.4%) |
| 2 Unit Apartments | 0 (0.0%) | 13 (100.0%) |
| 3 or 4 Unit Apartments | 16 (21.0%) | 60 (78.9%) |
| 5 to 9 Unit Apartments | 0 (0.0%) | 52 (100.0%) |
| 10 or more Apartments | 0 (0.0%) | 518 (100.0%) |
| Mobile Home / Other | 199 (69.3%) | 88 (30.7%) |
| Total | 10,045 (86.8%) | 1,526 (13.2%) |
Housing Structures by Number of Rooms in Eagle
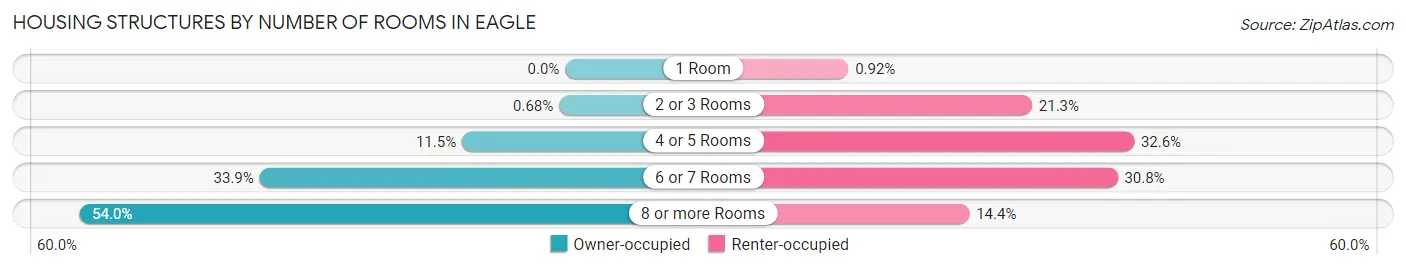
| Number of Rooms | Owner-occupied | Renter-occupied |
| 1 Room | 0 (0.0%) | 14 (0.9%) |
| 2 or 3 Rooms | 68 (0.7%) | 325 (21.3%) |
| 4 or 5 Rooms | 1,151 (11.5%) | 498 (32.6%) |
| 6 or 7 Rooms | 3,407 (33.9%) | 470 (30.8%) |
| 8 or more Rooms | 5,419 (53.9%) | 219 (14.3%) |
| Total | 10,045 (100.0%) | 1,526 (100.0%) |
Housing Structure by Heating Type in Eagle
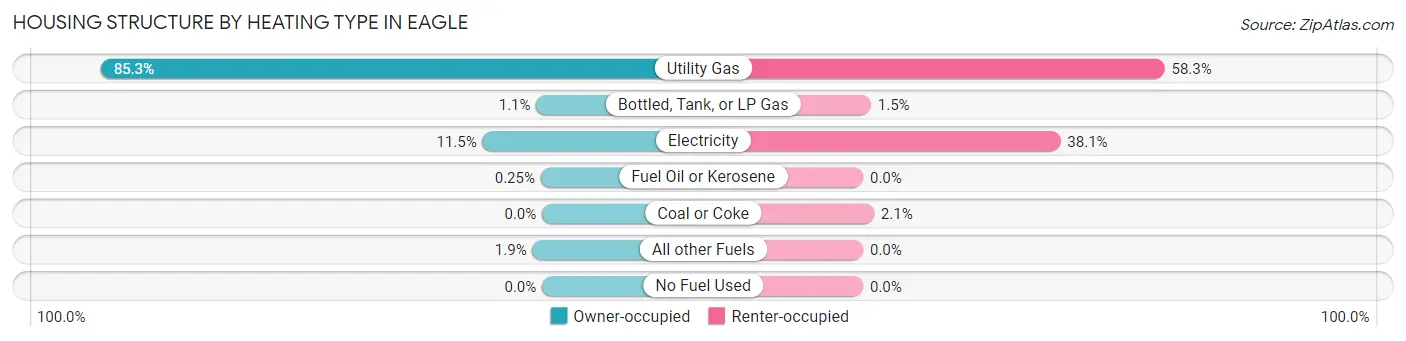
| Heating Type | Owner-occupied | Renter-occupied |
| Utility Gas | 8,566 (85.3%) | 889 (58.3%) |
| Bottled, Tank, or LP Gas | 111 (1.1%) | 23 (1.5%) |
| Electricity | 1,156 (11.5%) | 582 (38.1%) |
| Fuel Oil or Kerosene | 25 (0.3%) | 0 (0.0%) |
| Coal or Coke | 0 (0.0%) | 32 (2.1%) |
| All other Fuels | 187 (1.9%) | 0 (0.0%) |
| No Fuel Used | 0 (0.0%) | 0 (0.0%) |
| Total | 10,045 (100.0%) | 1,526 (100.0%) |
Household Vehicle Usage in Eagle
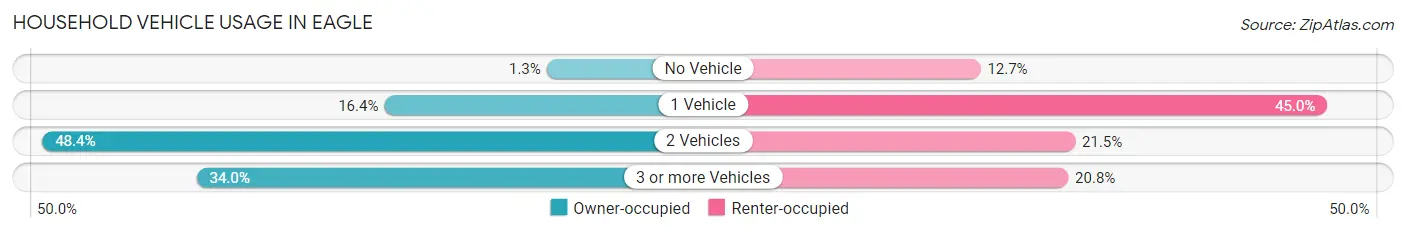
| Vehicles per Household | Owner-occupied | Renter-occupied |
| No Vehicle | 128 (1.3%) | 193 (12.7%) |
| 1 Vehicle | 1,650 (16.4%) | 687 (45.0%) |
| 2 Vehicles | 4,857 (48.3%) | 328 (21.5%) |
| 3 or more Vehicles | 3,410 (34.0%) | 318 (20.8%) |
| Total | 10,045 (100.0%) | 1,526 (100.0%) |
Real Estate & Mortgages in Eagle
Real Estate and Mortgage Overview in Eagle
| Characteristic | Without Mortgage | With Mortgage |
| Housing Units | 3,493 | 6,552 |
| Median Property Value | $614,200 | $651,500 |
| Median Household Income | $93,707 | $3,175 |
| Monthly Housing Costs | $579 | $1,926 |
| Real Estate Taxes | $3,315 | $91 |
Property Value by Mortgage Status in Eagle
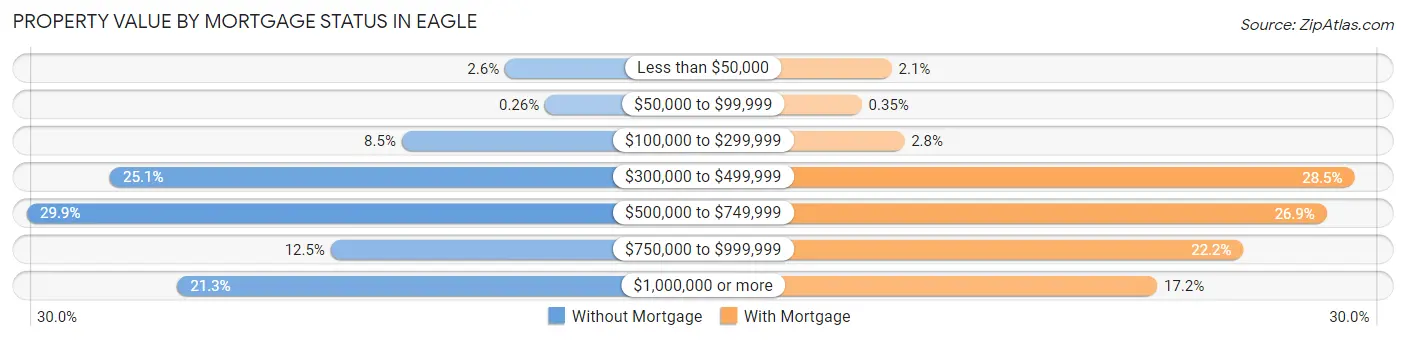
| Property Value | Without Mortgage | With Mortgage |
| Less than $50,000 | 89 (2.5%) | 135 (2.1%) |
| $50,000 to $99,999 | 9 (0.3%) | 23 (0.4%) |
| $100,000 to $299,999 | 295 (8.5%) | 182 (2.8%) |
| $300,000 to $499,999 | 877 (25.1%) | 1,867 (28.5%) |
| $500,000 to $749,999 | 1,043 (29.9%) | 1,764 (26.9%) |
| $750,000 to $999,999 | 437 (12.5%) | 1,452 (22.2%) |
| $1,000,000 or more | 743 (21.3%) | 1,129 (17.2%) |
| Total | 3,493 (100.0%) | 6,552 (100.0%) |
Household Income by Mortgage Status in Eagle
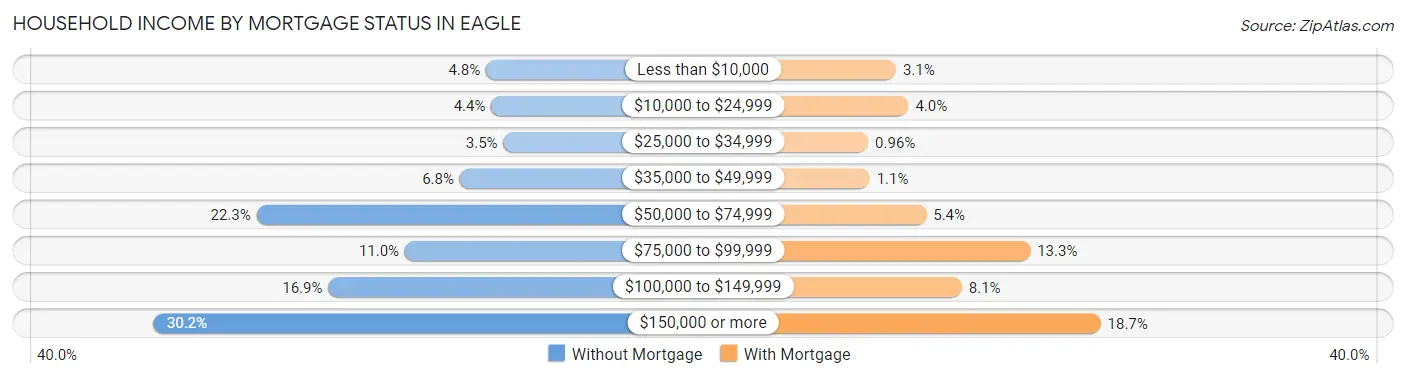
| Household Income | Without Mortgage | With Mortgage |
| Less than $10,000 | 169 (4.8%) | 202 (3.1%) |
| $10,000 to $24,999 | 155 (4.4%) | 264 (4.0%) |
| $25,000 to $34,999 | 123 (3.5%) | 63 (1.0%) |
| $35,000 to $49,999 | 239 (6.8%) | 71 (1.1%) |
| $50,000 to $74,999 | 780 (22.3%) | 353 (5.4%) |
| $75,000 to $99,999 | 385 (11.0%) | 872 (13.3%) |
| $100,000 to $149,999 | 589 (16.9%) | 531 (8.1%) |
| $150,000 or more | 1,053 (30.1%) | 1,223 (18.7%) |
| Total | 3,493 (100.0%) | 6,552 (100.0%) |
Property Value to Household Income Ratio in Eagle
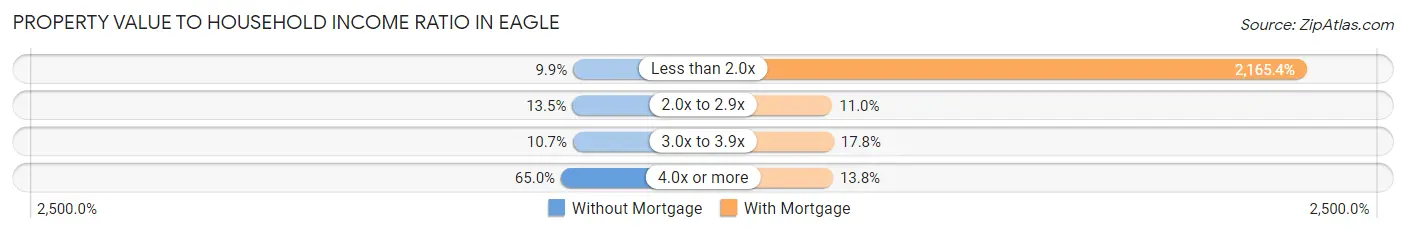
| Value-to-Income Ratio | Without Mortgage | With Mortgage |
| Less than 2.0x | 346 (9.9%) | 141,875 (2,165.4%) |
| 2.0x to 2.9x | 472 (13.5%) | 722 (11.0%) |
| 3.0x to 3.9x | 374 (10.7%) | 1,168 (17.8%) |
| 4.0x or more | 2,272 (65.0%) | 904 (13.8%) |
| Total | 3,493 (100.0%) | 6,552 (100.0%) |
Real Estate Taxes by Mortgage Status in Eagle
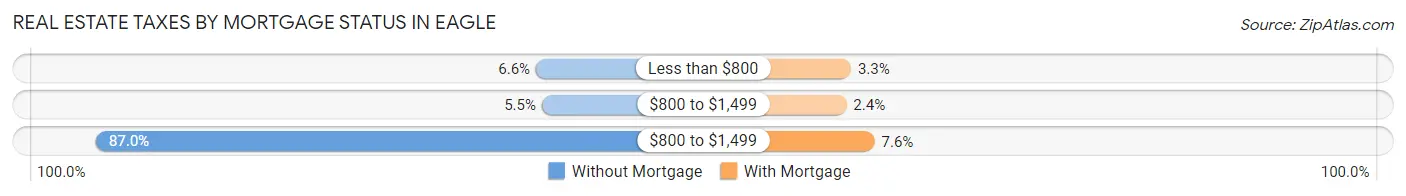
| Property Taxes | Without Mortgage | With Mortgage |
| Less than $800 | 231 (6.6%) | 214 (3.3%) |
| $800 to $1,499 | 193 (5.5%) | 160 (2.4%) |
| $800 to $1,499 | 3,038 (87.0%) | 497 (7.6%) |
| Total | 3,493 (100.0%) | 6,552 (100.0%) |
Health & Disability in Eagle
Health Insurance Coverage by Age in Eagle
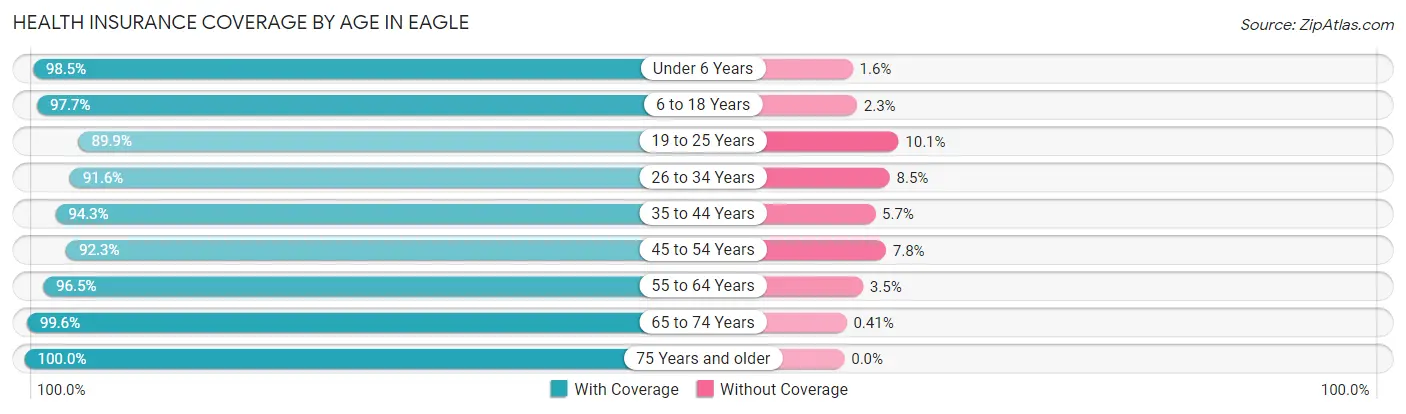
| Age Bracket | With Coverage | Without Coverage |
| Under 6 Years | 1,523 (98.5%) | 24 (1.5%) |
| 6 to 18 Years | 6,000 (97.7%) | 144 (2.3%) |
| 19 to 25 Years | 1,071 (89.9%) | 120 (10.1%) |
| 26 to 34 Years | 1,994 (91.5%) | 184 (8.5%) |
| 35 to 44 Years | 3,334 (94.3%) | 203 (5.7%) |
| 45 to 54 Years | 4,025 (92.2%) | 338 (7.7%) |
| 55 to 64 Years | 4,672 (96.5%) | 168 (3.5%) |
| 65 to 74 Years | 4,357 (99.6%) | 18 (0.4%) |
| 75 Years and older | 2,389 (100.0%) | 0 (0.0%) |
| Total | 29,365 (96.1%) | 1,199 (3.9%) |
Health Insurance Coverage by Citizenship Status in Eagle
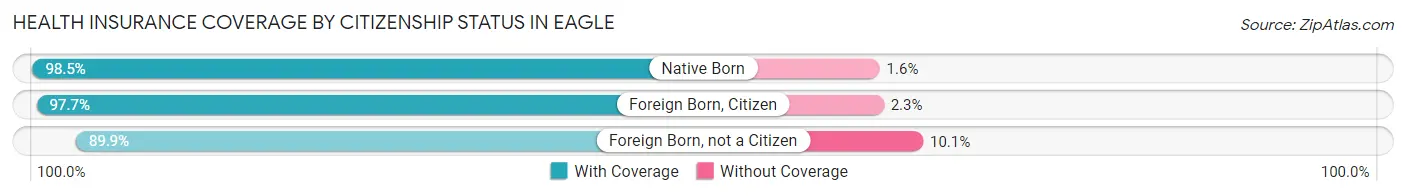
| Citizenship Status | With Coverage | Without Coverage |
| Native Born | 1,523 (98.5%) | 24 (1.5%) |
| Foreign Born, Citizen | 6,000 (97.7%) | 144 (2.3%) |
| Foreign Born, not a Citizen | 1,071 (89.9%) | 120 (10.1%) |
Health Insurance Coverage by Household Income in Eagle
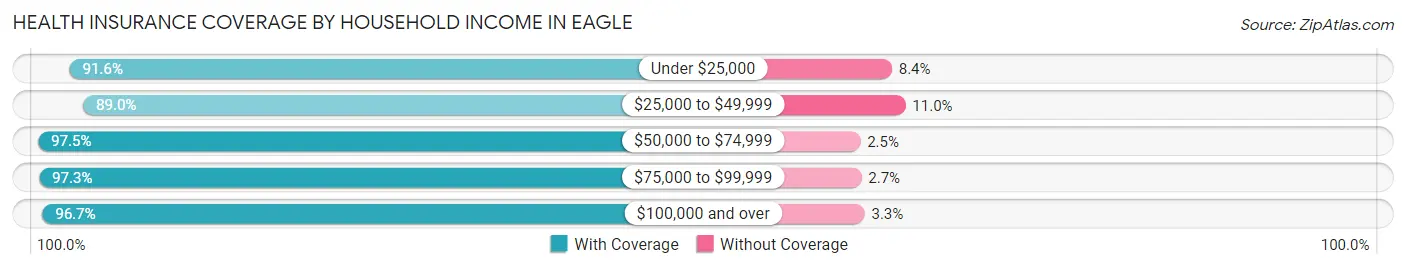
| Household Income | With Coverage | Without Coverage |
| Under $25,000 | 1,478 (91.6%) | 136 (8.4%) |
| $25,000 to $49,999 | 1,775 (89.0%) | 219 (11.0%) |
| $50,000 to $74,999 | 3,944 (97.5%) | 102 (2.5%) |
| $75,000 to $99,999 | 3,006 (97.3%) | 84 (2.7%) |
| $100,000 and over | 19,145 (96.7%) | 658 (3.3%) |
Public vs Private Health Insurance Coverage by Age in Eagle
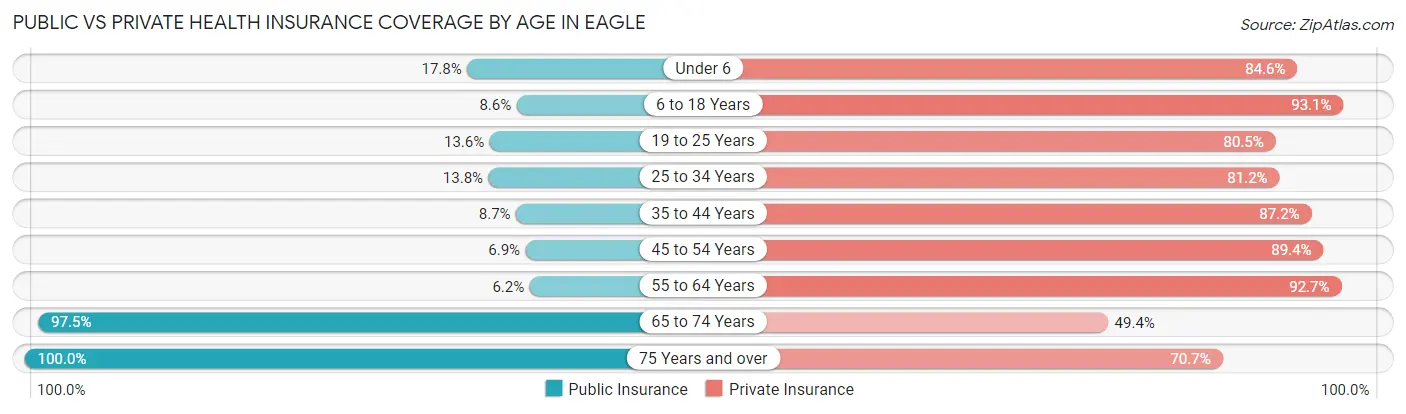
| Age Bracket | Public Insurance | Private Insurance |
| Under 6 | 275 (17.8%) | 1,308 (84.6%) |
| 6 to 18 Years | 528 (8.6%) | 5,719 (93.1%) |
| 19 to 25 Years | 162 (13.6%) | 959 (80.5%) |
| 25 to 34 Years | 301 (13.8%) | 1,769 (81.2%) |
| 35 to 44 Years | 308 (8.7%) | 3,083 (87.2%) |
| 45 to 54 Years | 303 (6.9%) | 3,900 (89.4%) |
| 55 to 64 Years | 299 (6.2%) | 4,487 (92.7%) |
| 65 to 74 Years | 4,265 (97.5%) | 2,159 (49.3%) |
| 75 Years and over | 2,389 (100.0%) | 1,688 (70.7%) |
| Total | 8,830 (28.9%) | 25,072 (82.0%) |
Disability Status by Sex by Age in Eagle
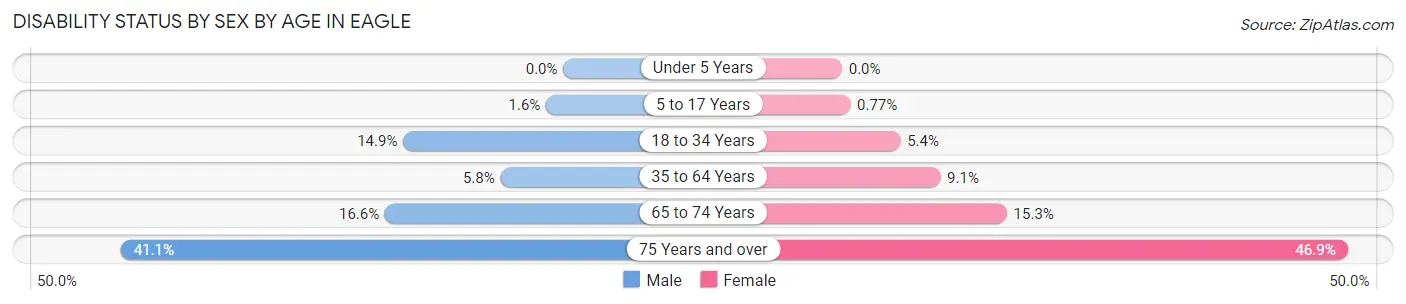
| Age Bracket | Male | Female |
| Under 5 Years | 0 (0.0%) | 0 (0.0%) |
| 5 to 17 Years | 44 (1.6%) | 24 (0.8%) |
| 18 to 34 Years | 263 (14.9%) | 111 (5.4%) |
| 35 to 64 Years | 372 (5.8%) | 580 (9.1%) |
| 65 to 74 Years | 366 (16.6%) | 331 (15.3%) |
| 75 Years and over | 400 (41.1%) | 664 (46.9%) |
Disability Class by Sex by Age in Eagle
Disability Class: Hearing Difficulty
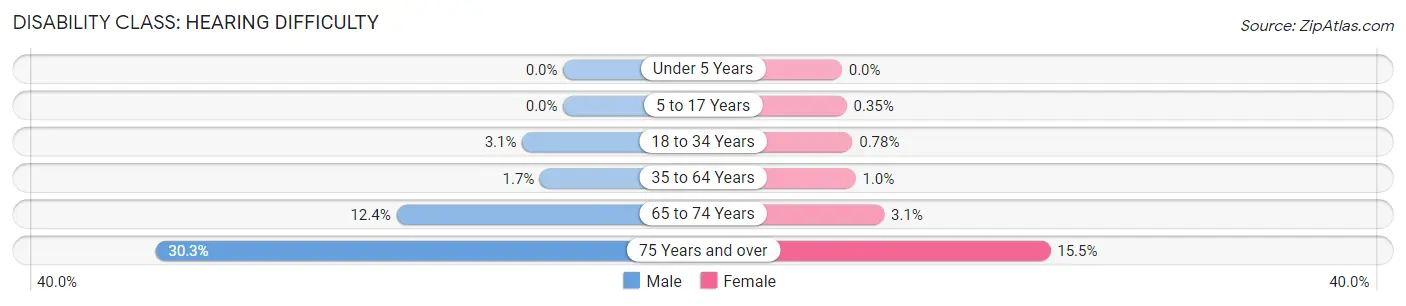
| Age Bracket | Male | Female |
| Under 5 Years | 0 (0.0%) | 0 (0.0%) |
| 5 to 17 Years | 0 (0.0%) | 11 (0.4%) |
| 18 to 34 Years | 54 (3.0%) | 16 (0.8%) |
| 35 to 64 Years | 110 (1.7%) | 65 (1.0%) |
| 65 to 74 Years | 274 (12.4%) | 68 (3.1%) |
| 75 Years and over | 295 (30.3%) | 219 (15.5%) |
Disability Class: Vision Difficulty
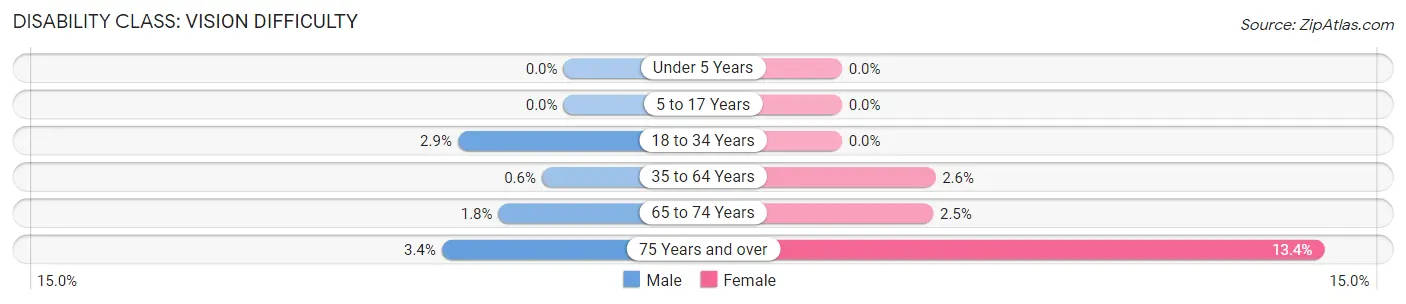
| Age Bracket | Male | Female |
| Under 5 Years | 0 (0.0%) | 0 (0.0%) |
| 5 to 17 Years | 0 (0.0%) | 0 (0.0%) |
| 18 to 34 Years | 52 (2.9%) | 0 (0.0%) |
| 35 to 64 Years | 38 (0.6%) | 165 (2.6%) |
| 65 to 74 Years | 40 (1.8%) | 55 (2.5%) |
| 75 Years and over | 33 (3.4%) | 190 (13.4%) |
Disability Class: Cognitive Difficulty
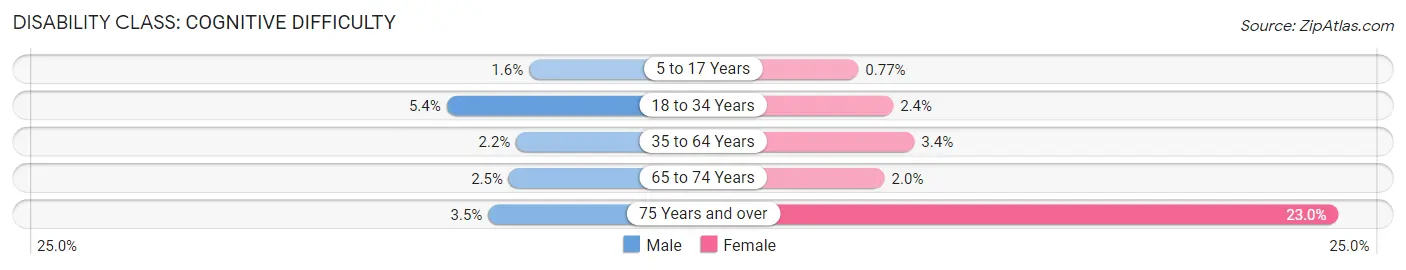
| Age Bracket | Male | Female |
| 5 to 17 Years | 44 (1.6%) | 24 (0.8%) |
| 18 to 34 Years | 96 (5.4%) | 49 (2.4%) |
| 35 to 64 Years | 140 (2.2%) | 214 (3.4%) |
| 65 to 74 Years | 56 (2.5%) | 43 (2.0%) |
| 75 Years and over | 34 (3.5%) | 326 (23.0%) |
Disability Class: Ambulatory Difficulty
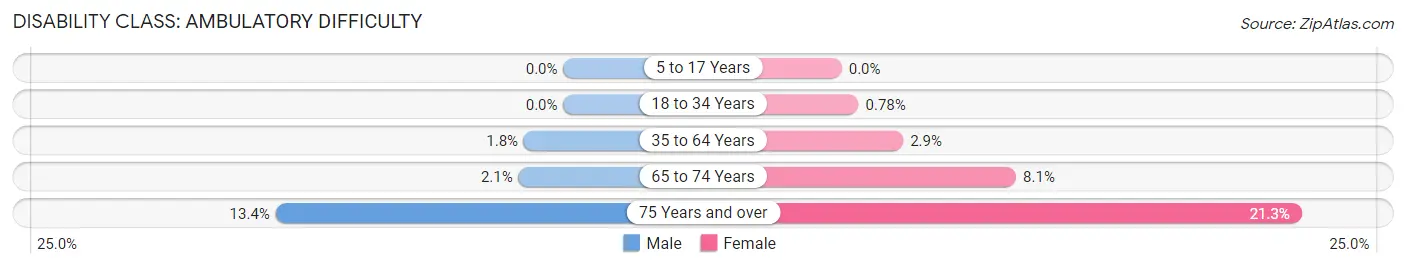
| Age Bracket | Male | Female |
| 5 to 17 Years | 0 (0.0%) | 0 (0.0%) |
| 18 to 34 Years | 0 (0.0%) | 16 (0.8%) |
| 35 to 64 Years | 117 (1.8%) | 181 (2.9%) |
| 65 to 74 Years | 46 (2.1%) | 175 (8.1%) |
| 75 Years and over | 130 (13.4%) | 302 (21.3%) |
Disability Class: Self-Care Difficulty
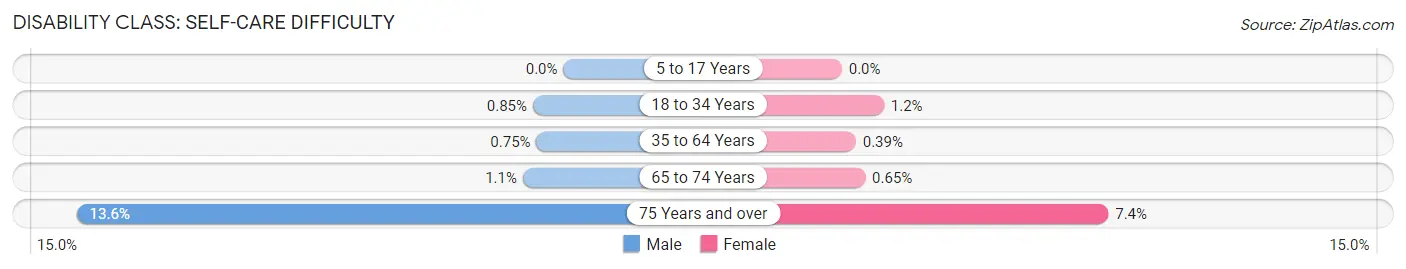
| Age Bracket | Male | Female |
| 5 to 17 Years | 0 (0.0%) | 0 (0.0%) |
| 18 to 34 Years | 15 (0.9%) | 24 (1.2%) |
| 35 to 64 Years | 48 (0.7%) | 25 (0.4%) |
| 65 to 74 Years | 25 (1.1%) | 14 (0.6%) |
| 75 Years and over | 132 (13.6%) | 105 (7.4%) |
Technology Access in Eagle
Computing Device Access in Eagle
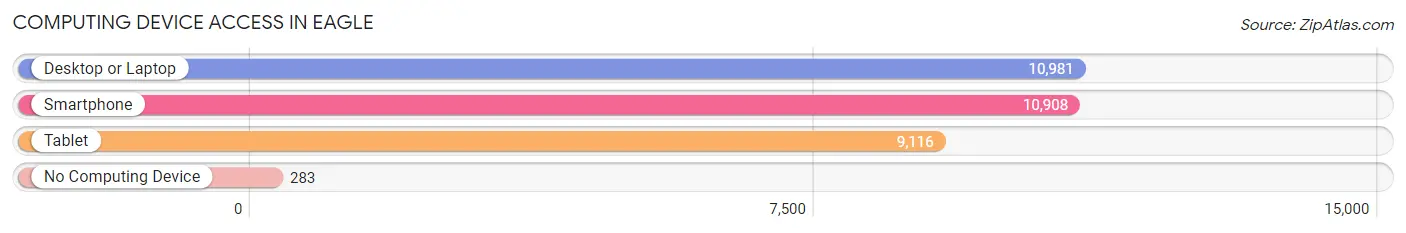
| Device Type | # Households | % Households |
| Desktop or Laptop | 10,981 | 94.9% |
| Smartphone | 10,908 | 94.3% |
| Tablet | 9,116 | 78.8% |
| No Computing Device | 283 | 2.5% |
| Total | 11,571 | 100.0% |
Internet Access in Eagle
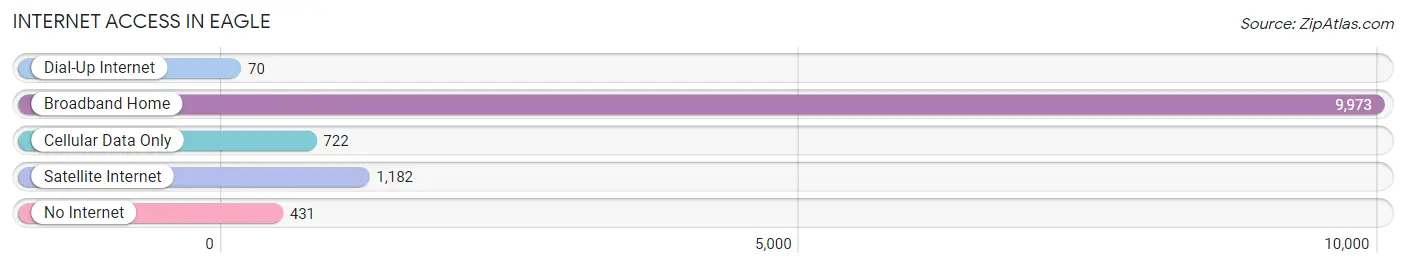
| Internet Type | # Households | % Households |
| Dial-Up Internet | 70 | 0.6% |
| Broadband Home | 9,973 | 86.2% |
| Cellular Data Only | 722 | 6.2% |
| Satellite Internet | 1,182 | 10.2% |
| No Internet | 431 | 3.7% |
| Total | 11,571 | 100.0% |
Eagle Summary
Eagle, Idaho is a small city located in the southwestern part of the state, about 20 miles west of Boise. It is the county seat of Ada County and is part of the Boise metropolitan area. The city has a population of about 22,000 people and is known for its small-town charm and rural atmosphere.
Geography
Eagle is located in the Treasure Valley, a region of the Snake River Plain in southwestern Idaho. The city is situated at an elevation of 2,845 feet above sea level and is surrounded by rolling hills and farmland. The Boise River runs through the city, providing a scenic backdrop. The city is located in a semi-arid climate, with hot summers and cold winters.
Economy
Eagle’s economy is largely based on agriculture and tourism. The city is home to several large farms, including the Eagle Dairy Farm, which produces milk, cheese, and other dairy products. The city is also home to several wineries, including the Eagle Winery, which produces a variety of wines.
Tourism is also an important part of the city’s economy. The city is home to several popular attractions, including the Eagle Historical Museum, the Eagle River Nature Center, and the Eagle Golf Course. The city also hosts several annual events, such as the Eagle Days Festival and the Eagle County Fair.
Demographics
As of the 2010 census, the population of Eagle was 22,636. The racial makeup of the city was 94.3% White, 0.7% African American, 0.7% Native American, 1.2% Asian, 0.1% Pacific Islander, 1.2% from other races, and 2.0% from two or more races. Hispanic or Latino of any race were 4.2% of the population.
The median income for a household in the city was $50,945, and the median income for a family was $60,945. The per capita income for the city was $25,945. About 6.2% of families and 8.2% of the population were below the poverty line, including 10.2% of those under age 18 and 5.2% of those age 65 or over.
Eagle is a small city with a rural atmosphere and a strong sense of community. The city is home to a diverse population and a thriving economy based on agriculture and tourism. The city is also home to several popular attractions and hosts several annual events.
Common Questions
What is Per Capita Income in Eagle?
Per Capita income in Eagle is $61,916.
What is the Median Family Income in Eagle?
Median Family Income in Eagle is $131,532.
What is the Median Household income in Eagle?
Median Household Income in Eagle is $114,271.
What is Income or Wage Gap in Eagle?
Income or Wage Gap in Eagle is 47.5%.
Women in Eagle earn 52.5 cents for every dollar earned by a man.
What is Family Income Deficit in Eagle?
Family Income Deficit in Eagle is $13,963.
Families that are below poverty line in Eagle earn $13,963 less on average than the poverty threshold level.
What is Inequality or Gini Index in Eagle?
Inequality or Gini Index in Eagle is 0.47.
What is the Total Population of Eagle?
Total Population of Eagle is 30,635.
What is the Total Male Population of Eagle?
Total Male Population of Eagle is 14,922.
What is the Total Female Population of Eagle?
Total Female Population of Eagle is 15,713.
What is the Ratio of Males per 100 Females in Eagle?
There are 94.97 Males per 100 Females in Eagle.
What is the Ratio of Females per 100 Males in Eagle?
There are 105.30 Females per 100 Males in Eagle.
What is the Median Population Age in Eagle?
Median Population Age in Eagle is 46.8 Years.
What is the Average Family Size in Eagle
Average Family Size in Eagle is 3.0 People.
What is the Average Household Size in Eagle
Average Household Size in Eagle is 2.6 People.
How Large is the Labor Force in Eagle?
There are 13,895 People in the Labor Forcein in Eagle.
What is the Percentage of People in the Labor Force in Eagle?
56.3% of People are in the Labor Force in Eagle.
What is the Unemployment Rate in Eagle?
Unemployment Rate in Eagle is 1.5%.