Driggs, ID Map & Demographics
Driggs Map
Driggs Overview
$37,655
PER CAPITA INCOME
$91,115
AVG FAMILY INCOME
$86,587
AVG HOUSEHOLD INCOME
26.4%
WAGE / INCOME GAP [ % ]
73.6¢/ $1
WAGE / INCOME GAP [ $ ]
0.43
INEQUALITY / GINI INDEX
2,548
TOTAL POPULATION
1,117
MALE POPULATION
1,431
FEMALE POPULATION
78.06
MALES / 100 FEMALES
128.11
FEMALES / 100 MALES
38.5
MEDIAN AGE
3.4
AVG FAMILY SIZE
3.0
AVG HOUSEHOLD SIZE
1,539
LABOR FORCE [ PEOPLE ]
76.3%
PERCENT IN LABOR FORCE
0.7%
UNEMPLOYMENT RATE
Driggs Zip Codes
Driggs Area Codes
Income in Driggs
Income Overview in Driggs
Per Capita Income in Driggs is $37,655, while median incomes of families and households are $91,115 and $86,587 respectively.
| Characteristic | Number | Measure |
| Per Capita Income | 2,548 | $37,655 |
| Median Family Income | 570 | $91,115 |
| Mean Family Income | 570 | $118,141 |
| Median Household Income | 849 | $86,587 |
| Mean Household Income | 849 | $105,960 |
| Income Deficit | 570 | $0 |
| Wage / Income Gap (%) | 2,548 | 26.36% |
| Wage / Income Gap ($) | 2,548 | 73.64¢ per $1 |
| Gini / Inequality Index | 2,548 | 0.43 |
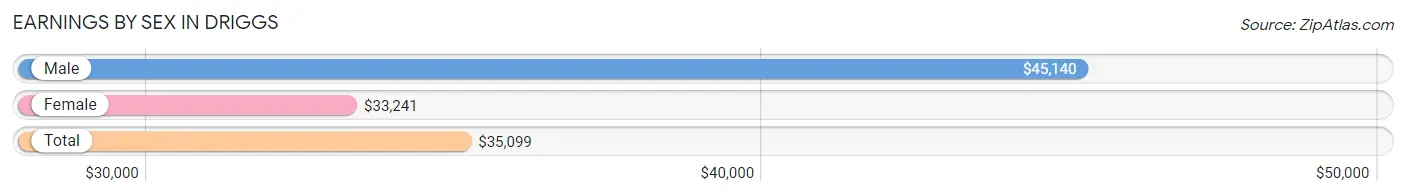
Earnings by Sex in Driggs
Average Earnings in Driggs are $35,099, $45,140 for men and $33,241 for women, a difference of 26.4%.
| Sex | Number | Average Earnings |
| Male | 842 (50.7%) | $45,140 |
| Female | 819 (49.3%) | $33,241 |
| Total | 1,661 (100.0%) | $35,099 |
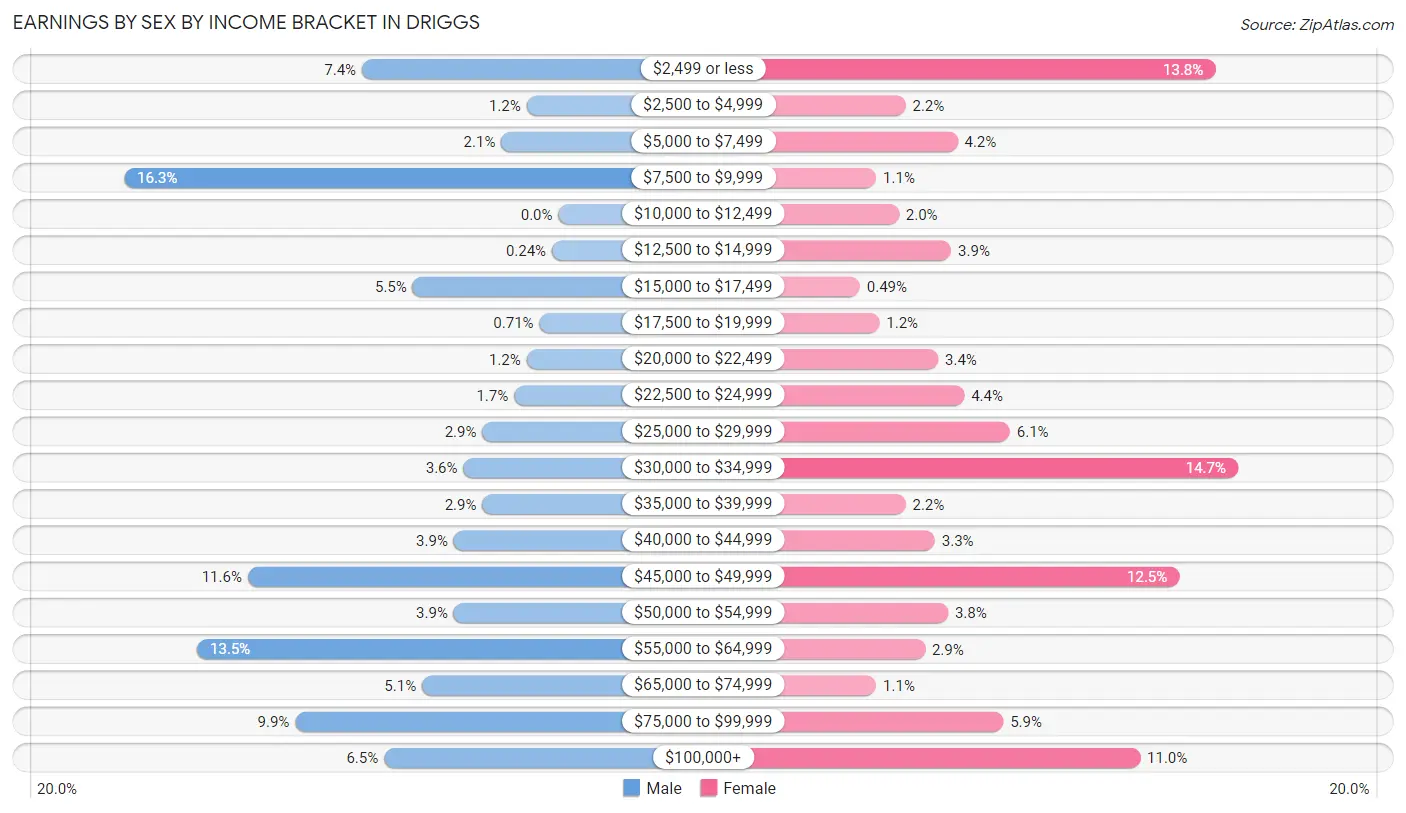
Earnings by Sex by Income Bracket in Driggs
The most common earnings brackets in Driggs are $7,500 to $9,999 for men (137 | 16.3%) and $30,000 to $34,999 for women (120 | 14.6%).
| Income | Male | Female |
| $2,499 or less | 62 (7.4%) | 113 (13.8%) |
| $2,500 to $4,999 | 10 (1.2%) | 18 (2.2%) |
| $5,000 to $7,499 | 18 (2.1%) | 34 (4.2%) |
| $7,500 to $9,999 | 137 (16.3%) | 9 (1.1%) |
| $10,000 to $12,499 | 0 (0.0%) | 16 (1.9%) |
| $12,500 to $14,999 | 2 (0.2%) | 32 (3.9%) |
| $15,000 to $17,499 | 46 (5.5%) | 4 (0.5%) |
| $17,500 to $19,999 | 6 (0.7%) | 10 (1.2%) |
| $20,000 to $22,499 | 10 (1.2%) | 28 (3.4%) |
| $22,500 to $24,999 | 14 (1.7%) | 36 (4.4%) |
| $25,000 to $29,999 | 24 (2.9%) | 50 (6.1%) |
| $30,000 to $34,999 | 30 (3.6%) | 120 (14.6%) |
| $35,000 to $39,999 | 24 (2.9%) | 18 (2.2%) |
| $40,000 to $44,999 | 33 (3.9%) | 27 (3.3%) |
| $45,000 to $49,999 | 98 (11.6%) | 102 (12.4%) |
| $50,000 to $54,999 | 33 (3.9%) | 31 (3.8%) |
| $55,000 to $64,999 | 114 (13.5%) | 24 (2.9%) |
| $65,000 to $74,999 | 43 (5.1%) | 9 (1.1%) |
| $75,000 to $99,999 | 83 (9.9%) | 48 (5.9%) |
| $100,000+ | 55 (6.5%) | 90 (11.0%) |
| Total | 842 (100.0%) | 819 (100.0%) |
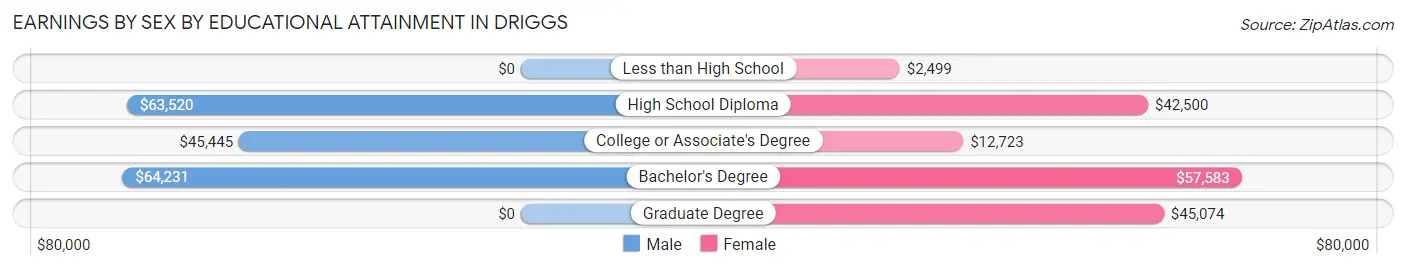
Earnings by Sex by Educational Attainment in Driggs
Average earnings in Driggs are $46,966 for men and $33,719 for women, a difference of 28.2%. Men with an educational attainment of bachelor's degree enjoy the highest average annual earnings of $64,231, while those with college or associate's degree education earn the least with $45,445. Women with an educational attainment of bachelor's degree earn the most with the average annual earnings of $57,583, while those with less than high school education have the smallest earnings of $2,499.
| Educational Attainment | Male Income | Female Income |
| Less than High School | - | - |
| High School Diploma | $63,520 | $42,500 |
| College or Associate's Degree | $45,445 | $12,723 |
| Bachelor's Degree | $64,231 | $57,583 |
| Graduate Degree | - | - |
| Total | $46,966 | $33,719 |
Family Income in Driggs
Family Income Brackets in Driggs
According to the Driggs family income data, there are 110 families falling into the $75,000 to $99,999 income range, which is the most common income bracket and makes up 19.3% of all families.
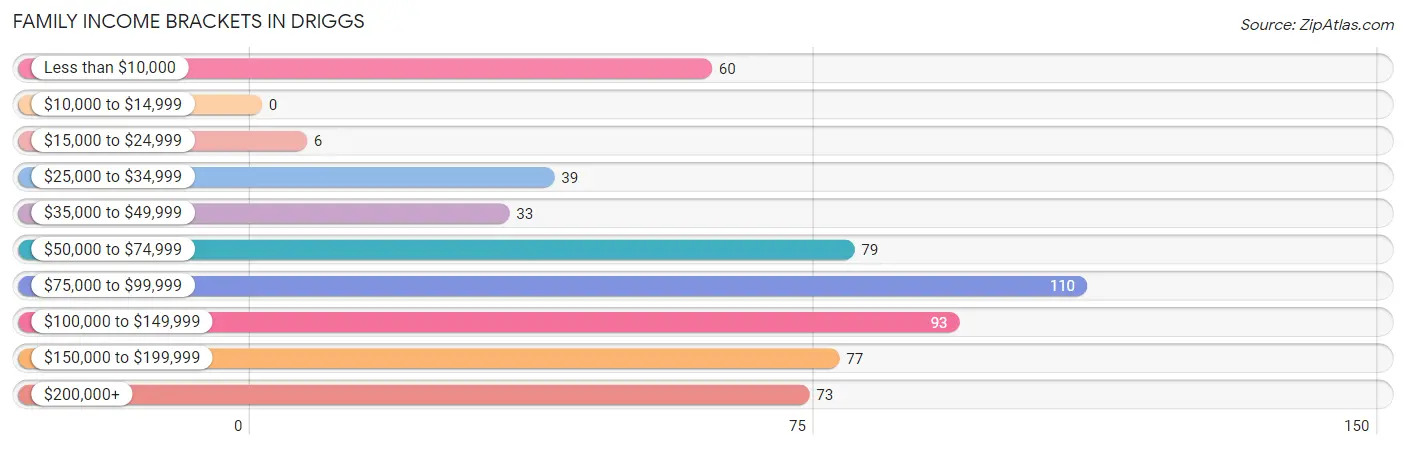
| Income Bracket | # Families | % Families |
| Less than $10,000 | 60 | 10.5% |
| $10,000 to $14,999 | 0 | 0.0% |
| $15,000 to $24,999 | 6 | 1.1% |
| $25,000 to $34,999 | 39 | 6.8% |
| $35,000 to $49,999 | 33 | 5.8% |
| $50,000 to $74,999 | 79 | 13.9% |
| $75,000 to $99,999 | 110 | 19.3% |
| $100,000 to $149,999 | 93 | 16.3% |
| $150,000 to $199,999 | 77 | 13.5% |
| $200,000+ | 73 | 12.8% |
Family Income by Famaliy Size in Driggs
3-person families (107 | 18.8%) account for the highest median family income in Driggs with $107,083 per family, while 2-person families (291 | 51.0%) have the highest median income of $50,208 per family member.
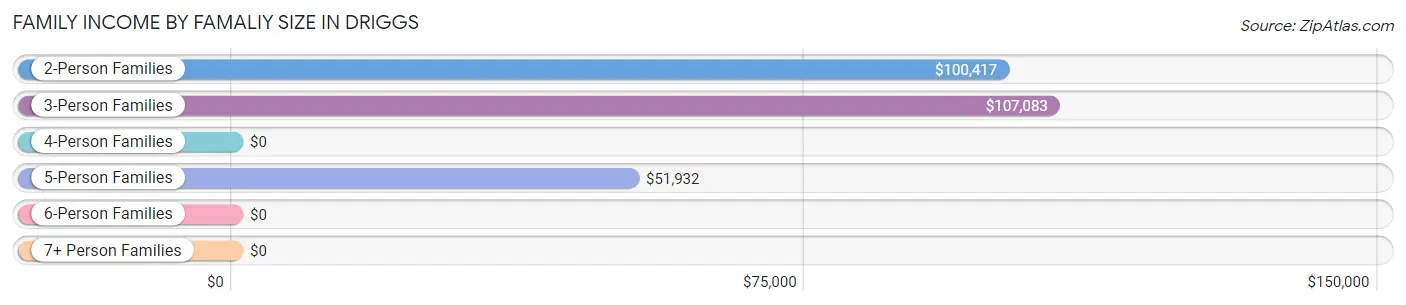
| Income Bracket | # Families | Median Income |
| 2-Person Families | 291 (51.0%) | $100,417 |
| 3-Person Families | 107 (18.8%) | $107,083 |
| 4-Person Families | 136 (23.9%) | $0 |
| 5-Person Families | 17 (3.0%) | $51,932 |
| 6-Person Families | 6 (1.1%) | $0 |
| 7+ Person Families | 13 (2.3%) | $0 |
| Total | 570 (100.0%) | $91,115 |
Family Income by Number of Earners in Driggs
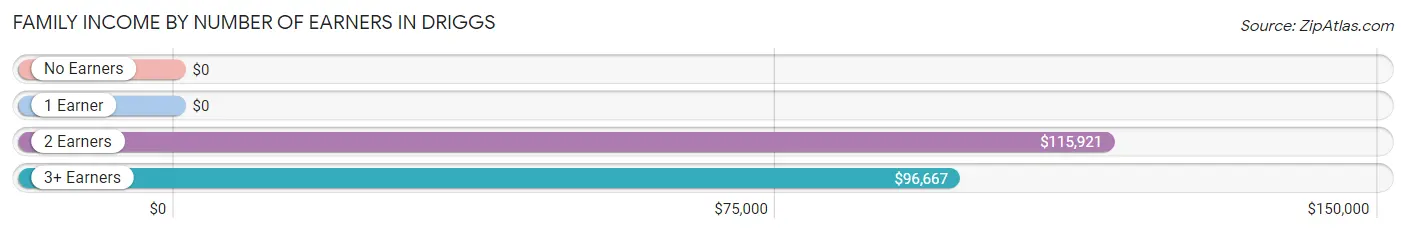
| Number of Earners | # Families | Median Income |
| No Earners | 37 (6.5%) | $0 |
| 1 Earner | 129 (22.6%) | $0 |
| 2 Earners | 376 (66.0%) | $115,921 |
| 3+ Earners | 28 (4.9%) | $96,667 |
| Total | 570 (100.0%) | $91,115 |
Household Income in Driggs
Household Income Brackets in Driggs
With 182 households falling in the category, the $75,000 to $99,999 income range is the most frequent in Driggs, accounting for 21.4% of all households.
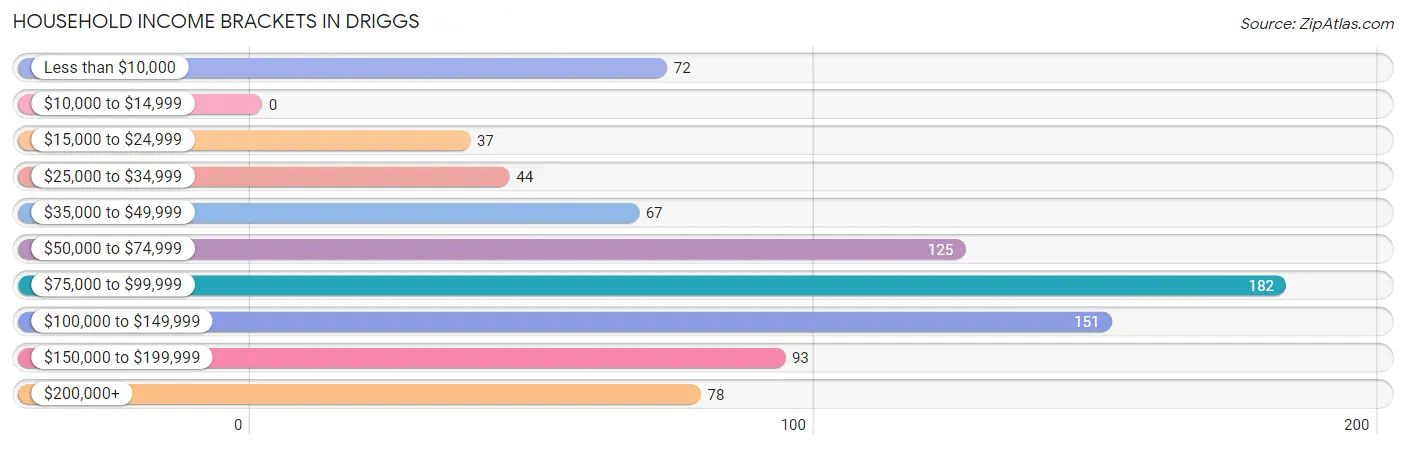
| Income Bracket | # Households | % Households |
| Less than $10,000 | 72 | 8.5% |
| $10,000 to $14,999 | 0 | 0.0% |
| $15,000 to $24,999 | 37 | 4.4% |
| $25,000 to $34,999 | 44 | 5.2% |
| $35,000 to $49,999 | 67 | 7.9% |
| $50,000 to $74,999 | 125 | 14.7% |
| $75,000 to $99,999 | 182 | 21.4% |
| $100,000 to $149,999 | 151 | 17.8% |
| $150,000 to $199,999 | 93 | 11.0% |
| $200,000+ | 78 | 9.2% |
Household Income by Householder Age in Driggs
The median household income in Driggs is $86,587, with the highest median household income of $91,660 found in the 45 to 64 years age bracket for the primary householder. A total of 357 households (42.0%) fall into this category. Meanwhile, the 15 to 24 years age bracket for the primary householder has the lowest median household income of $0, with 12 households (1.4%) in this group.
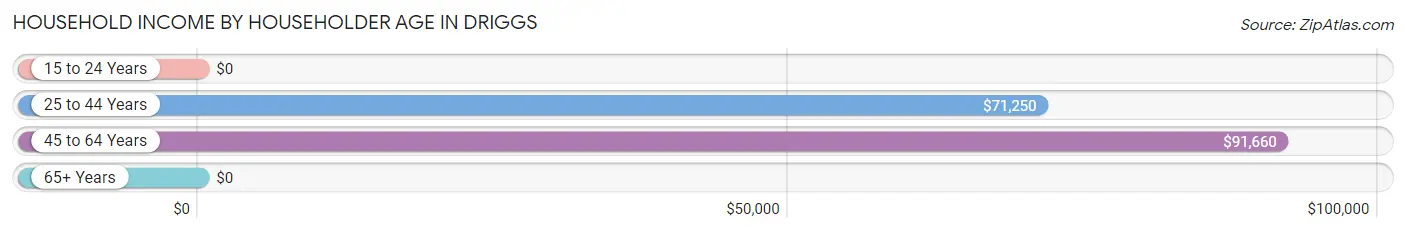
| Income Bracket | # Households | Median Income |
| 15 to 24 Years | 12 (1.4%) | $0 |
| 25 to 44 Years | 334 (39.3%) | $71,250 |
| 45 to 64 Years | 357 (42.0%) | $91,660 |
| 65+ Years | 146 (17.2%) | $0 |
| Total | 849 (100.0%) | $86,587 |
Poverty in Driggs
Income Below Poverty by Sex and Age in Driggs
With 11.6% poverty level for males and 18.9% for females among the residents of Driggs, 35 to 44 year old males and 16 and 17 year old females are the most vulnerable to poverty, with 55 males (22.5%) and 60 females (69.8%) in their respective age groups living below the poverty level.
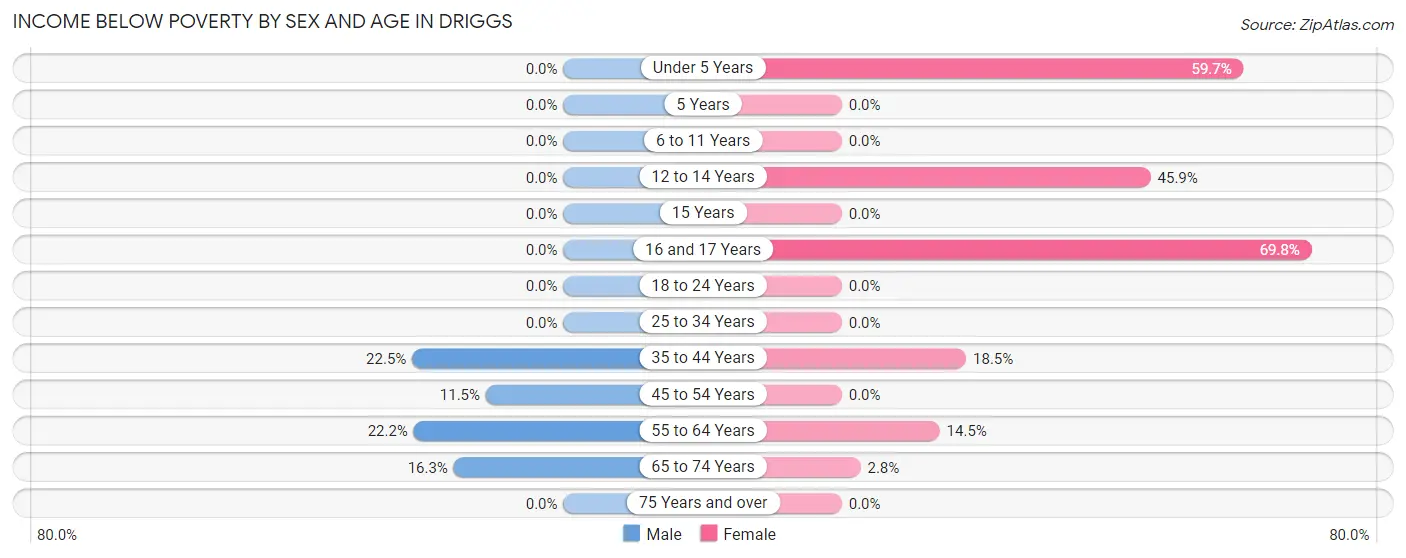
| Age Bracket | Male | Female |
| Under 5 Years | 0 (0.0%) | 68 (59.7%) |
| 5 Years | 0 (0.0%) | 0 (0.0%) |
| 6 to 11 Years | 0 (0.0%) | 0 (0.0%) |
| 12 to 14 Years | 0 (0.0%) | 61 (45.9%) |
| 15 Years | 0 (0.0%) | 0 (0.0%) |
| 16 and 17 Years | 0 (0.0%) | 60 (69.8%) |
| 18 to 24 Years | 0 (0.0%) | 0 (0.0%) |
| 25 to 34 Years | 0 (0.0%) | 0 (0.0%) |
| 35 to 44 Years | 55 (22.5%) | 60 (18.5%) |
| 45 to 54 Years | 29 (11.5%) | 0 (0.0%) |
| 55 to 64 Years | 32 (22.2%) | 17 (14.5%) |
| 65 to 74 Years | 14 (16.3%) | 4 (2.8%) |
| 75 Years and over | 0 (0.0%) | 0 (0.0%) |
| Total | 130 (11.6%) | 270 (18.9%) |
Income Above Poverty by Sex and Age in Driggs
According to the poverty statistics in Driggs, males aged under 5 years and females aged 5 years are the age groups that are most secure financially, with 100.0% of males and 100.0% of females in these age groups living above the poverty line.
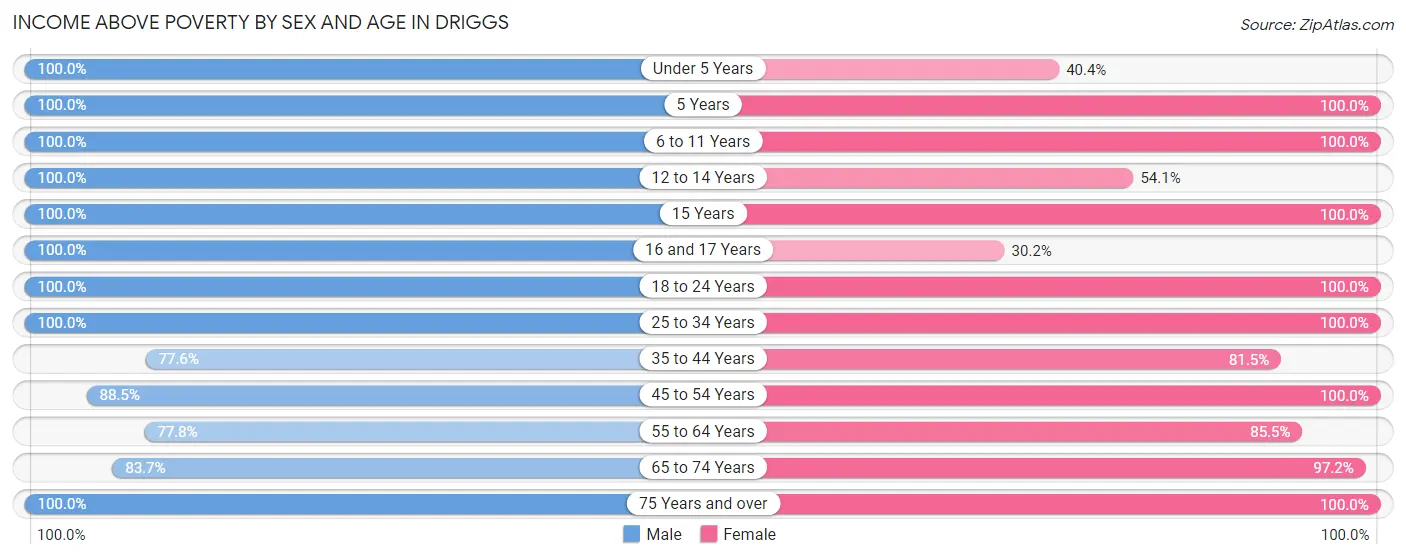
| Age Bracket | Male | Female |
| Under 5 Years | 8 (100.0%) | 46 (40.4%) |
| 5 Years | 7 (100.0%) | 19 (100.0%) |
| 6 to 11 Years | 90 (100.0%) | 68 (100.0%) |
| 12 to 14 Years | 14 (100.0%) | 72 (54.1%) |
| 15 Years | 67 (100.0%) | 11 (100.0%) |
| 16 and 17 Years | 60 (100.0%) | 26 (30.2%) |
| 18 to 24 Years | 76 (100.0%) | 61 (100.0%) |
| 25 to 34 Years | 57 (100.0%) | 184 (100.0%) |
| 35 to 44 Years | 190 (77.5%) | 265 (81.5%) |
| 45 to 54 Years | 223 (88.5%) | 152 (100.0%) |
| 55 to 64 Years | 112 (77.8%) | 100 (85.5%) |
| 65 to 74 Years | 72 (83.7%) | 140 (97.2%) |
| 75 Years and over | 11 (100.0%) | 17 (100.0%) |
| Total | 987 (88.4%) | 1,161 (81.1%) |
Income Below Poverty Among Married-Couple Families in Driggs
The poverty statistics for married-couple families in Driggs show that 0.5% or 2 of the total 423 families live below the poverty line. Families with no children have the highest poverty rate of 0.8%, comprising of 2 families. On the other hand, families with 1 or 2 children have the lowest poverty rate of 0.0%, which includes 0 families.
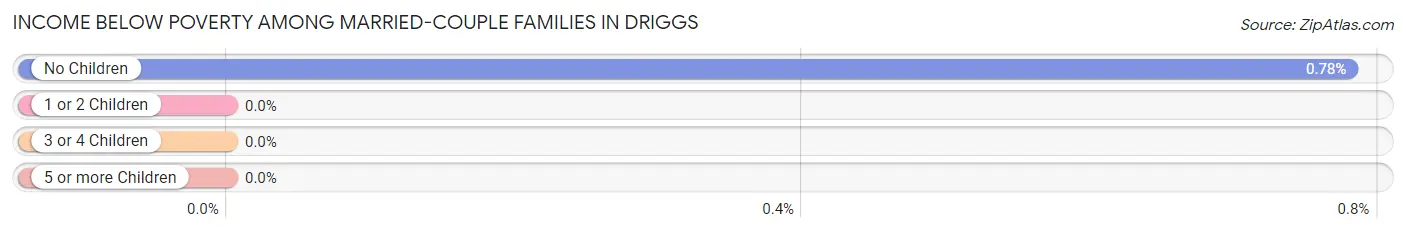
| Children | Above Poverty | Below Poverty |
| No Children | 254 (99.2%) | 2 (0.8%) |
| 1 or 2 Children | 145 (100.0%) | 0 (0.0%) |
| 3 or 4 Children | 9 (100.0%) | 0 (0.0%) |
| 5 or more Children | 13 (100.0%) | 0 (0.0%) |
| Total | 421 (99.5%) | 2 (0.5%) |
Income Below Poverty Among Single-Parent Households in Driggs
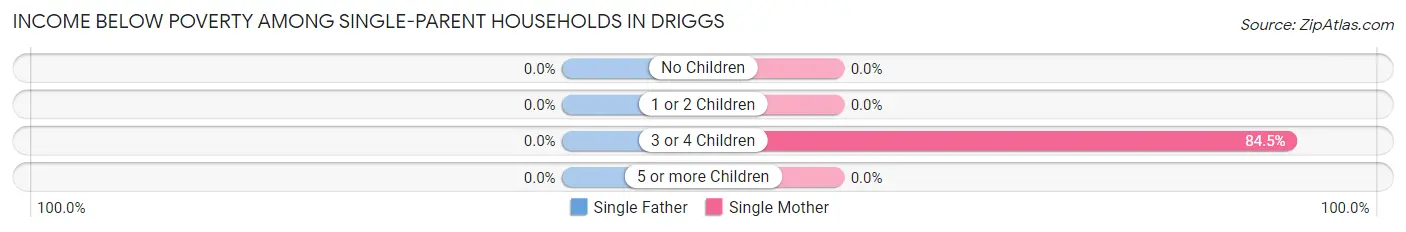
| Children | Single Father | Single Mother |
| No Children | 0 (0.0%) | 0 (0.0%) |
| 1 or 2 Children | 0 (0.0%) | 0 (0.0%) |
| 3 or 4 Children | 0 (0.0%) | 60 (84.5%) |
| 5 or more Children | 0 (0.0%) | 0 (0.0%) |
| Total | 0 (0.0%) | 60 (46.9%) |
Income Below Poverty Among Married-Couple vs Single-Parent Households in Driggs
The poverty data for Driggs shows that 2 of the married-couple family households (0.5%) and 60 of the single-parent households (40.8%) are living below the poverty level. Within the married-couple family households, those with no children have the highest poverty rate, with 2 households (0.8%) falling below the poverty line. Among the single-parent households, those with 3 or 4 children have the highest poverty rate, with 60 household (84.5%) living below poverty.
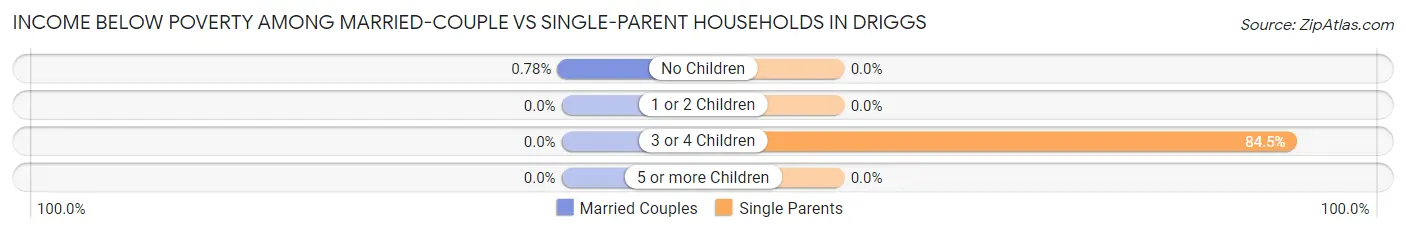
| Children | Married-Couple Families | Single-Parent Households |
| No Children | 2 (0.8%) | 0 (0.0%) |
| 1 or 2 Children | 0 (0.0%) | 0 (0.0%) |
| 3 or 4 Children | 0 (0.0%) | 60 (84.5%) |
| 5 or more Children | 0 (0.0%) | 0 (0.0%) |
| Total | 2 (0.5%) | 60 (40.8%) |
Race in Driggs
The most populous races in Driggs are White / Caucasian (1,720 | 67.5%), Hispanic or Latino (959 | 37.6%), and Some other Race (661 | 25.9%).
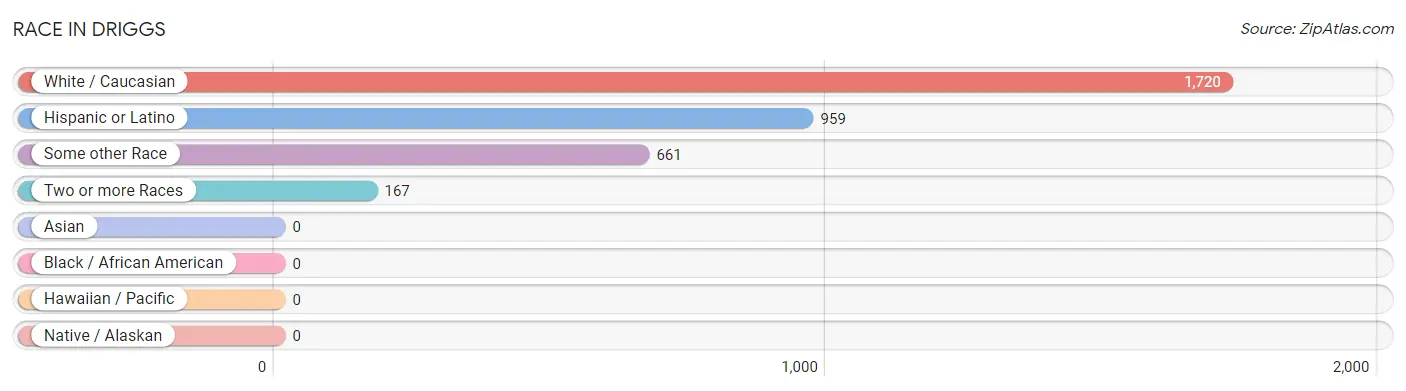
| Race | # Population | % Population |
| Asian | 0 | 0.0% |
| Black / African American | 0 | 0.0% |
| Hawaiian / Pacific | 0 | 0.0% |
| Hispanic or Latino | 959 | 37.6% |
| Native / Alaskan | 0 | 0.0% |
| White / Caucasian | 1,720 | 67.5% |
| Two or more Races | 167 | 6.6% |
| Some other Race | 661 | 25.9% |
| Total | 2,548 | 100.0% |
Ancestry in Driggs
The most populous ancestries reported in Driggs are Mexican (785 | 30.8%), English (347 | 13.6%), German (307 | 12.0%), Irish (223 | 8.7%), and Italian (204 | 8.0%), together accounting for 73.2% of all Driggs residents.
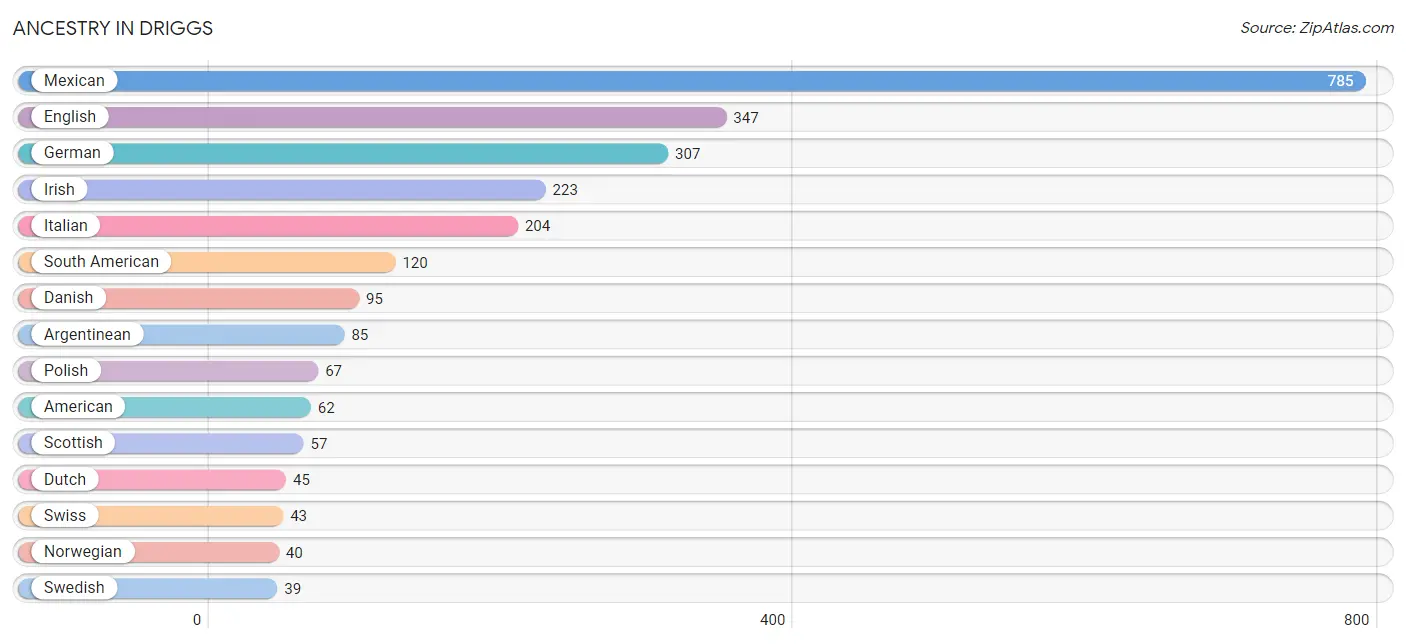
| Ancestry | # Population | % Population |
| American | 62 | 2.4% |
| Argentinean | 85 | 3.3% |
| Bhutanese | 3 | 0.1% |
| British | 27 | 1.1% |
| Celtic | 12 | 0.5% |
| Cherokee | 8 | 0.3% |
| Choctaw | 8 | 0.3% |
| Colombian | 14 | 0.5% |
| Czech | 7 | 0.3% |
| Czechoslovakian | 16 | 0.6% |
| Danish | 95 | 3.7% |
| Dutch | 45 | 1.8% |
| English | 347 | 13.6% |
| European | 35 | 1.4% |
| French | 38 | 1.5% |
| German | 307 | 12.0% |
| Greek | 4 | 0.2% |
| Icelander | 23 | 0.9% |
| Irish | 223 | 8.7% |
| Italian | 204 | 8.0% |
| Latvian | 3 | 0.1% |
| Lithuanian | 10 | 0.4% |
| Mexican | 785 | 30.8% |
| Norwegian | 40 | 1.6% |
| Paraguayan | 21 | 0.8% |
| Polish | 67 | 2.6% |
| Portuguese | 4 | 0.2% |
| Puerto Rican | 37 | 1.5% |
| Russian | 8 | 0.3% |
| Scandinavian | 4 | 0.2% |
| Scotch-Irish | 17 | 0.7% |
| Scottish | 57 | 2.2% |
| Slavic | 6 | 0.2% |
| Slovak | 5 | 0.2% |
| Slovene | 3 | 0.1% |
| South American | 120 | 4.7% |
| Spaniard | 11 | 0.4% |
| Spanish | 6 | 0.2% |
| Swedish | 39 | 1.5% |
| Swiss | 43 | 1.7% |
| Ukrainian | 13 | 0.5% |
| Welsh | 13 | 0.5% | View All 42 Rows |
Immigrants in Driggs
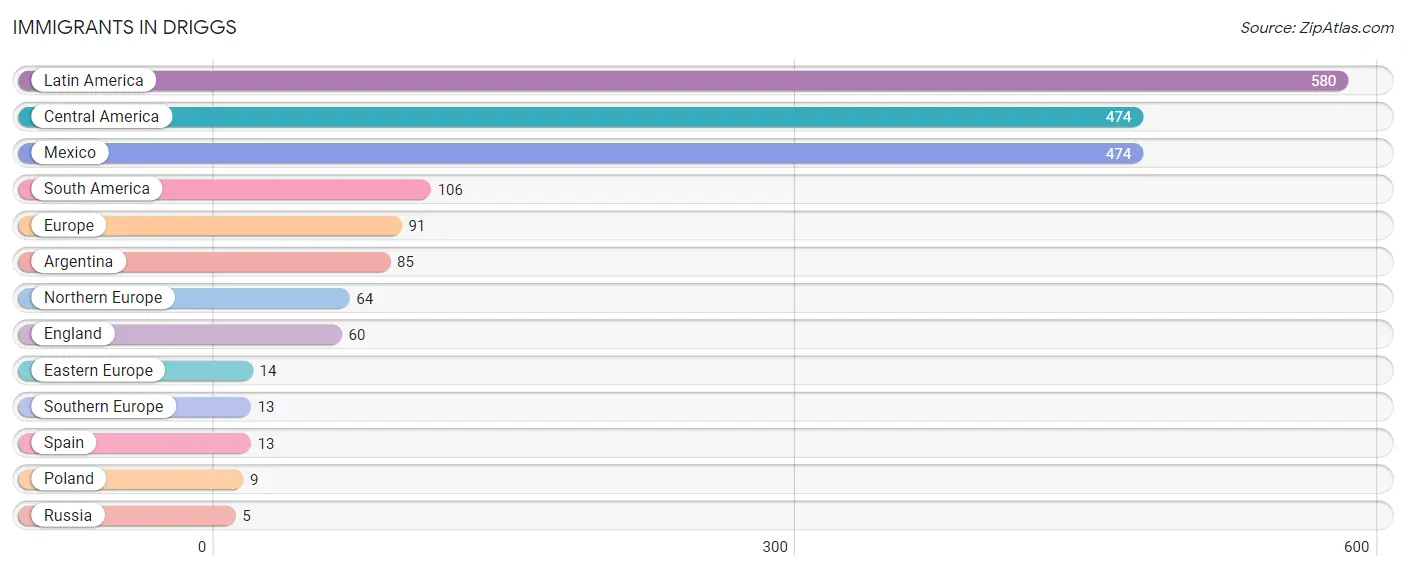
The most numerous immigrant groups reported in Driggs came from Latin America (580 | 22.8%), Central America (474 | 18.6%), Mexico (474 | 18.6%), South America (106 | 4.2%), and Europe (91 | 3.6%), together accounting for 67.7% of all Driggs residents.
| Immigration Origin | # Population | % Population |
| Argentina | 85 | 3.3% |
| Central America | 474 | 18.6% |
| Eastern Europe | 14 | 0.5% |
| England | 60 | 2.4% |
| Europe | 91 | 3.6% |
| Latin America | 580 | 22.8% |
| Mexico | 474 | 18.6% |
| Northern Europe | 64 | 2.5% |
| Poland | 9 | 0.4% |
| Russia | 5 | 0.2% |
| South America | 106 | 4.2% |
| Southern Europe | 13 | 0.5% |
| Spain | 13 | 0.5% | View All 13 Rows |
Sex and Age in Driggs
Sex and Age in Driggs
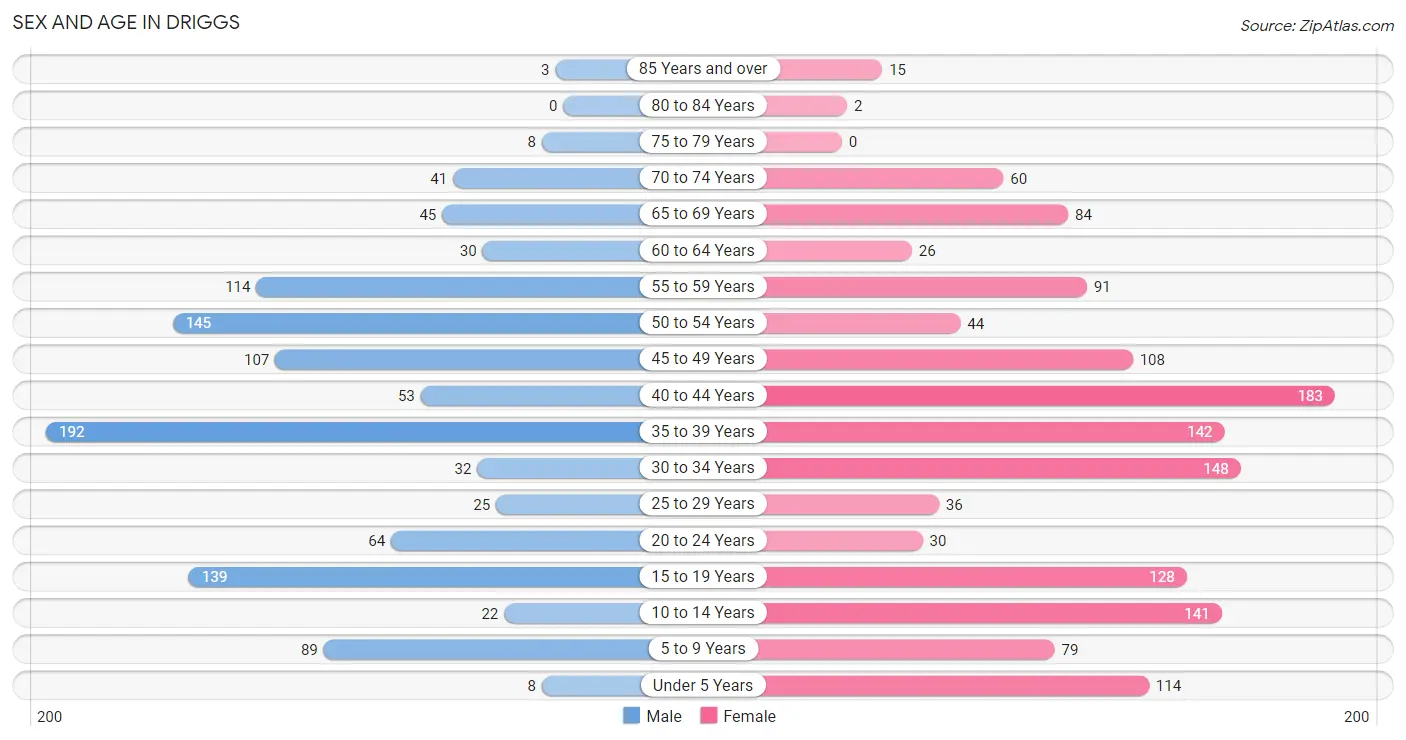
The most populous age groups in Driggs are 35 to 39 Years (192 | 17.2%) for men and 40 to 44 Years (183 | 12.8%) for women.
| Age Bracket | Male | Female |
| Under 5 Years | 8 (0.7%) | 114 (8.0%) |
| 5 to 9 Years | 89 (8.0%) | 79 (5.5%) |
| 10 to 14 Years | 22 (2.0%) | 141 (9.9%) |
| 15 to 19 Years | 139 (12.4%) | 128 (8.9%) |
| 20 to 24 Years | 64 (5.7%) | 30 (2.1%) |
| 25 to 29 Years | 25 (2.2%) | 36 (2.5%) |
| 30 to 34 Years | 32 (2.9%) | 148 (10.3%) |
| 35 to 39 Years | 192 (17.2%) | 142 (9.9%) |
| 40 to 44 Years | 53 (4.7%) | 183 (12.8%) |
| 45 to 49 Years | 107 (9.6%) | 108 (7.5%) |
| 50 to 54 Years | 145 (13.0%) | 44 (3.1%) |
| 55 to 59 Years | 114 (10.2%) | 91 (6.4%) |
| 60 to 64 Years | 30 (2.7%) | 26 (1.8%) |
| 65 to 69 Years | 45 (4.0%) | 84 (5.9%) |
| 70 to 74 Years | 41 (3.7%) | 60 (4.2%) |
| 75 to 79 Years | 8 (0.7%) | 0 (0.0%) |
| 80 to 84 Years | 0 (0.0%) | 2 (0.1%) |
| 85 Years and over | 3 (0.3%) | 15 (1.1%) |
| Total | 1,117 (100.0%) | 1,431 (100.0%) |
Families and Households in Driggs
Median Family Size in Driggs
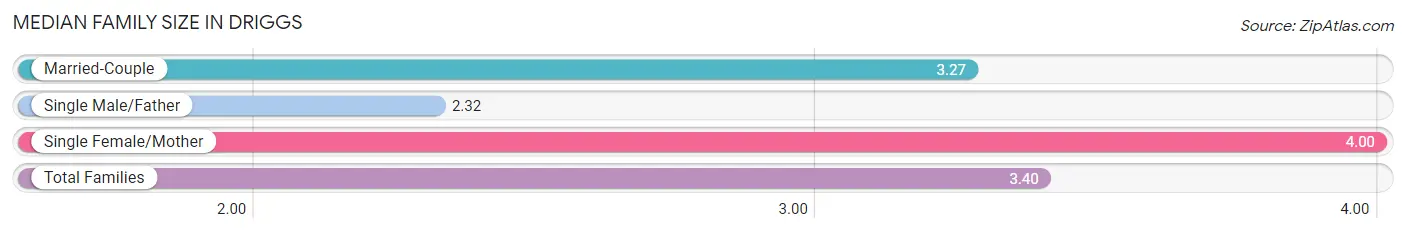
The median family size in Driggs is 3.40 persons per family, with single female/mother families (128 | 22.5%) accounting for the largest median family size of 4 persons per family. On the other hand, single male/father families (19 | 3.3%) represent the smallest median family size with 2.32 persons per family.
| Family Type | # Families | Family Size |
| Married-Couple | 423 (74.2%) | 3.27 |
| Single Male/Father | 19 (3.3%) | 2.32 |
| Single Female/Mother | 128 (22.5%) | 4.00 |
| Total Families | 570 (100.0%) | 3.40 |
Median Household Size in Driggs
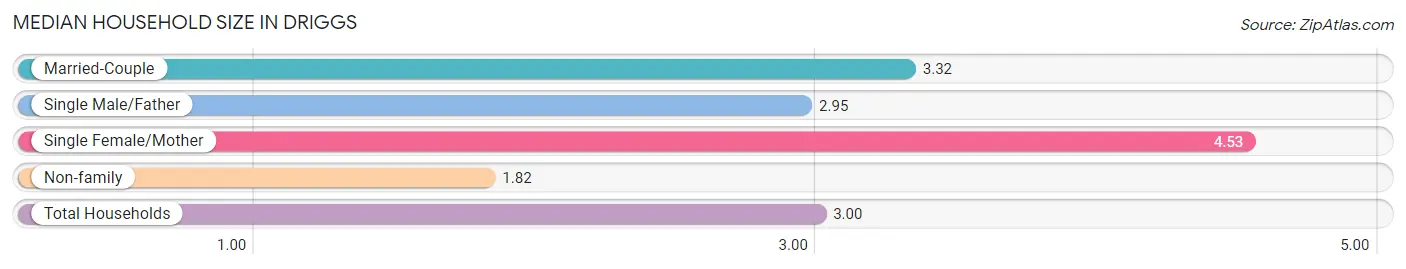
The median household size in Driggs is 3.00 persons per household, with single female/mother households (128 | 15.1%) accounting for the largest median household size of 4.53 persons per household. non-family households (279 | 32.9%) represent the smallest median household size with 1.82 persons per household.
| Household Type | # Households | Household Size |
| Married-Couple | 423 (49.8%) | 3.32 |
| Single Male/Father | 19 (2.2%) | 2.95 |
| Single Female/Mother | 128 (15.1%) | 4.53 |
| Non-family | 279 (32.9%) | 1.82 |
| Total Households | 849 (100.0%) | 3.00 |
Household Size by Marriage Status in Driggs
Out of a total of 849 households in Driggs, 570 (67.1%) are family households, while 279 (32.9%) are nonfamily households. The most numerous type of family households are 2-person households, comprising 271, and the most common type of nonfamily households are 2-person households, comprising 160.
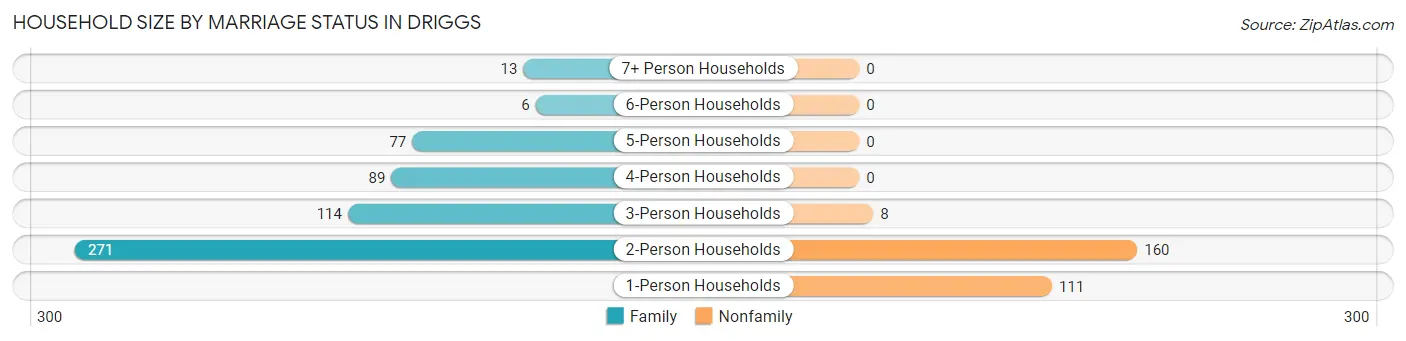
| Household Size | Family Households | Nonfamily Households |
| 1-Person Households | - | 111 (13.1%) |
| 2-Person Households | 271 (31.9%) | 160 (18.9%) |
| 3-Person Households | 114 (13.4%) | 8 (0.9%) |
| 4-Person Households | 89 (10.5%) | 0 (0.0%) |
| 5-Person Households | 77 (9.1%) | 0 (0.0%) |
| 6-Person Households | 6 (0.7%) | 0 (0.0%) |
| 7+ Person Households | 13 (1.5%) | 0 (0.0%) |
| Total | 570 (67.1%) | 279 (32.9%) |
Female Fertility in Driggs
Fertility by Age in Driggs
Average fertility rate in Driggs is 107.0 births per 1,000 women. Women in the age bracket of 35 to 50 years have the highest fertility rate with 173.0 births per 1,000 women. Women in the age bracket of 35 to 50 years acount for 90.4% of all women with births.
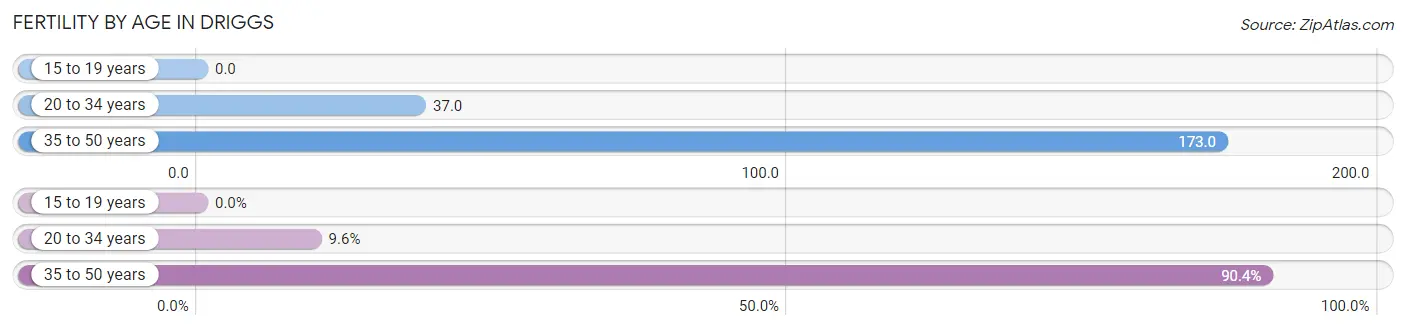
| Age Bracket | Women with Births | Births / 1,000 Women |
| 15 to 19 years | 0 (0.0%) | 0.0 |
| 20 to 34 years | 8 (9.6%) | 37.0 |
| 35 to 50 years | 75 (90.4%) | 173.0 |
| Total | 83 (100.0%) | 107.0 |
Fertility by Age by Marriage Status in Driggs
27.7% of women with births (83) in Driggs are married. The highest percentage of unmarried women with births falls into 35 to 50 years age bracket with 80.0% of them unmarried at the time of birth, while the lowest percentage of unmarried women with births belong to 20 to 34 years age bracket with 0.0% of them unmarried.
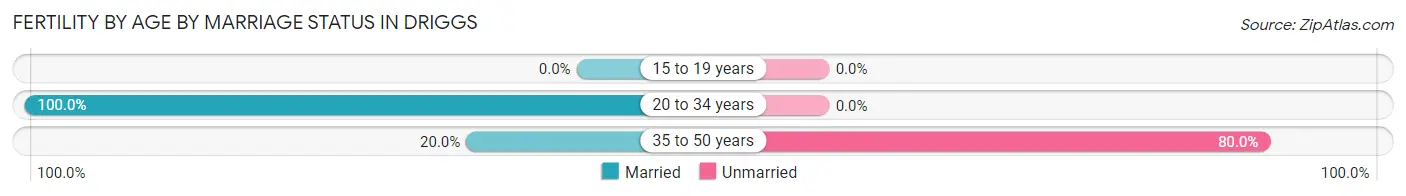
| Age Bracket | Married | Unmarried |
| 15 to 19 years | 0 (0.0%) | 0 (0.0%) |
| 20 to 34 years | 8 (100.0%) | 0 (0.0%) |
| 35 to 50 years | 15 (20.0%) | 60 (80.0%) |
| Total | 23 (27.7%) | 60 (72.3%) |
Fertility by Education in Driggs
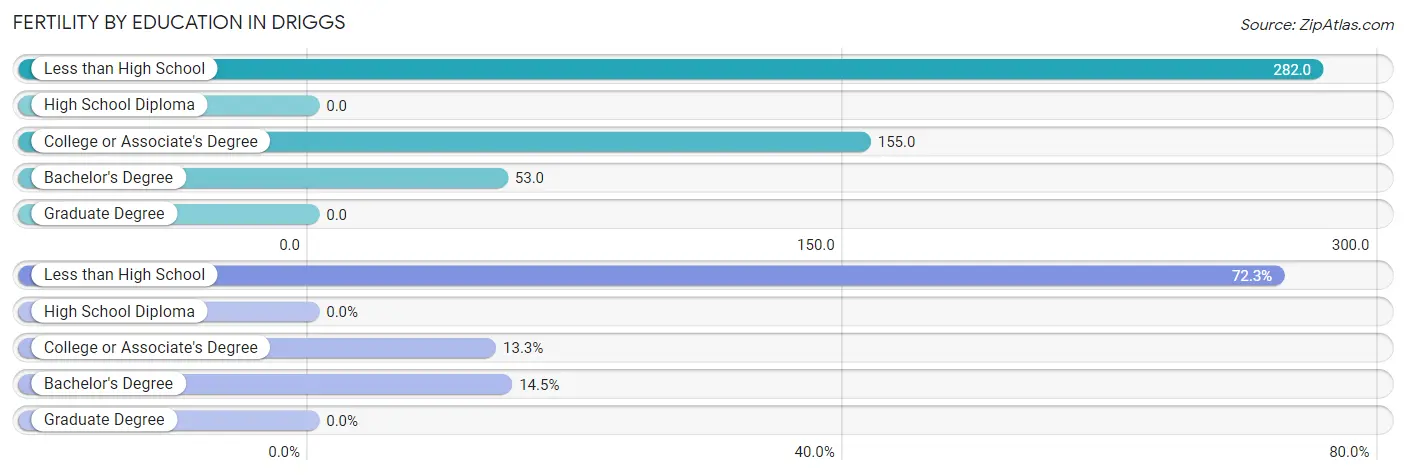
| Educational Attainment | Women with Births | Births / 1,000 Women |
| Less than High School | 60 (72.3%) | 282.0 |
| High School Diploma | 0 (0.0%) | 0.0 |
| College or Associate's Degree | 11 (13.3%) | 155.0 |
| Bachelor's Degree | 12 (14.5%) | 53.0 |
| Graduate Degree | 0 (0.0%) | 0.0 |
| Total | 83 (100.0%) | 107.0 |
Fertility by Education by Marriage Status in Driggs
72.3% of women with births in Driggs are unmarried. Women with the educational attainment of college or associate's degree are most likely to be married with 100.0% of them married at childbirth, while women with the educational attainment of less than high school are least likely to be married with 100.0% of them unmarried at childbirth.
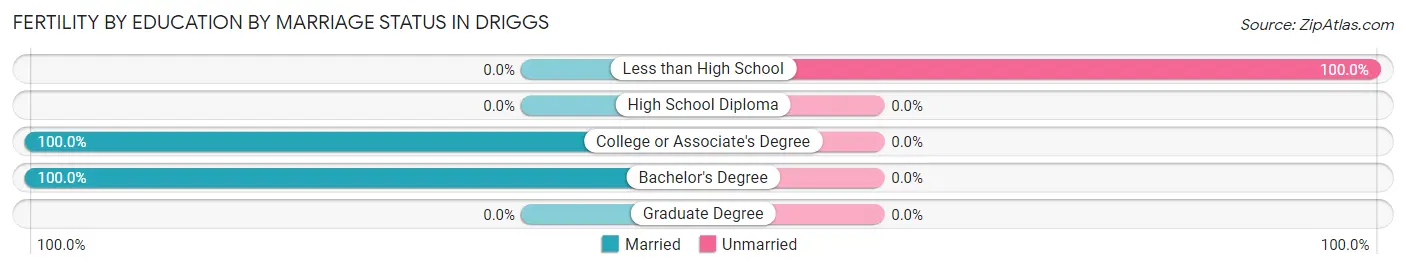
| Educational Attainment | Married | Unmarried |
| Less than High School | 0 (0.0%) | 60 (100.0%) |
| High School Diploma | 0 (0.0%) | 0 (0.0%) |
| College or Associate's Degree | 11 (100.0%) | 0 (0.0%) |
| Bachelor's Degree | 12 (100.0%) | 0 (0.0%) |
| Graduate Degree | 0 (0.0%) | 0 (0.0%) |
| Total | 23 (27.7%) | 60 (72.3%) |
Employment Characteristics in Driggs
Employment by Class of Employer in Driggs
Among the 1,499 employed individuals in Driggs, private company employees (911 | 60.8%), self-employed (not incorporated) (218 | 14.5%), and not-for-profit organizations (150 | 10.0%) make up the most common classes of employment.
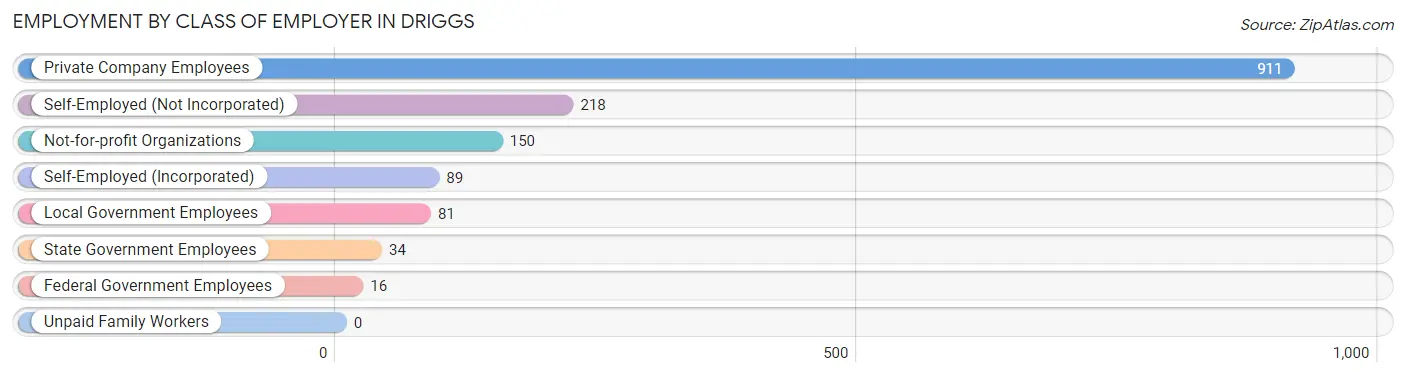
| Employer Class | # Employees | % Employees |
| Private Company Employees | 911 | 60.8% |
| Self-Employed (Incorporated) | 89 | 5.9% |
| Self-Employed (Not Incorporated) | 218 | 14.5% |
| Not-for-profit Organizations | 150 | 10.0% |
| Local Government Employees | 81 | 5.4% |
| State Government Employees | 34 | 2.3% |
| Federal Government Employees | 16 | 1.1% |
| Unpaid Family Workers | 0 | 0.0% |
| Total | 1,499 | 100.0% |
Employment Status by Age in Driggs
According to the labor force statistics for Driggs, out of the total population over 16 years of age (2,017), 76.3% or 1,539 individuals are in the labor force, with 0.7% or 11 of them unemployed. The age group with the highest labor force participation rate is 45 to 54 years, with 98.8% or 399 individuals in the labor force. Within the labor force, the 30 to 34 years age range has the highest percentage of unemployed individuals, with 2.6% or 4 of them being unemployed.
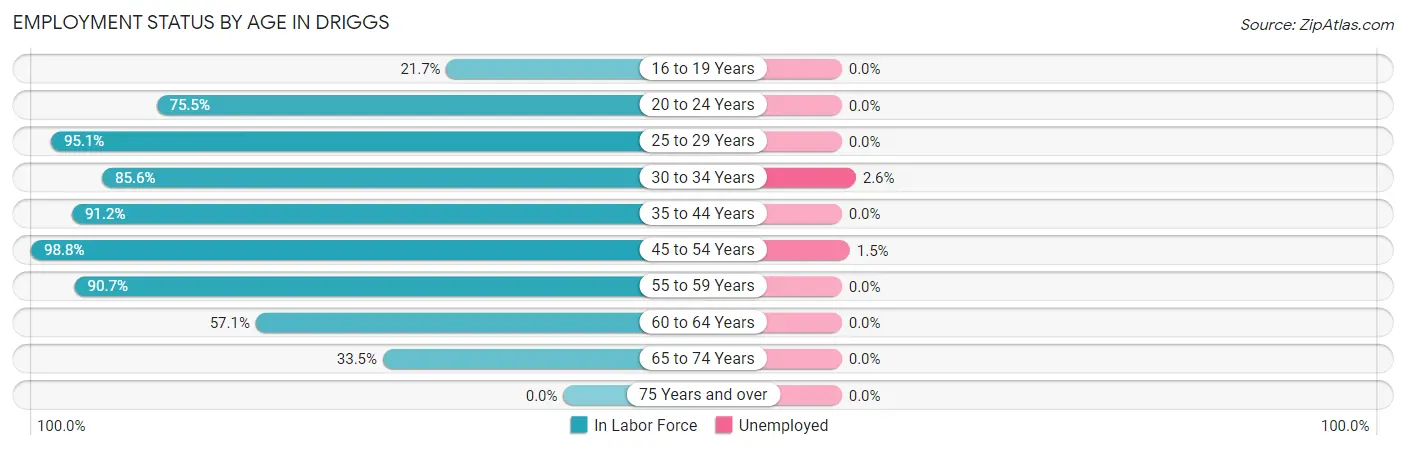
| Age Bracket | In Labor Force | Unemployed |
| 16 to 19 Years | 41 (21.7%) | 0 (0.0%) |
| 20 to 24 Years | 71 (75.5%) | 0 (0.0%) |
| 25 to 29 Years | 58 (95.1%) | 0 (0.0%) |
| 30 to 34 Years | 154 (85.6%) | 4 (2.6%) |
| 35 to 44 Years | 520 (91.2%) | 0 (0.0%) |
| 45 to 54 Years | 399 (98.8%) | 6 (1.5%) |
| 55 to 59 Years | 186 (90.7%) | 0 (0.0%) |
| 60 to 64 Years | 32 (57.1%) | 0 (0.0%) |
| 65 to 74 Years | 77 (33.5%) | 0 (0.0%) |
| 75 Years and over | 0 (0.0%) | 0 (0.0%) |
| Total | 1,539 (76.3%) | 11 (0.7%) |
Employment Status by Educational Attainment in Driggs
According to labor force statistics for Driggs, 91.4% of individuals (1,349) out of the total population between 25 and 64 years of age (1,476) are in the labor force, with 0.7% or 9 of them being unemployed. The group with the highest labor force participation rate are those with the educational attainment of high school diploma, with 98.1% or 105 individuals in the labor force. Within the labor force, individuals with college / associate degree education have the highest percentage of unemployment, with 3.0% or 10 of them being unemployed.
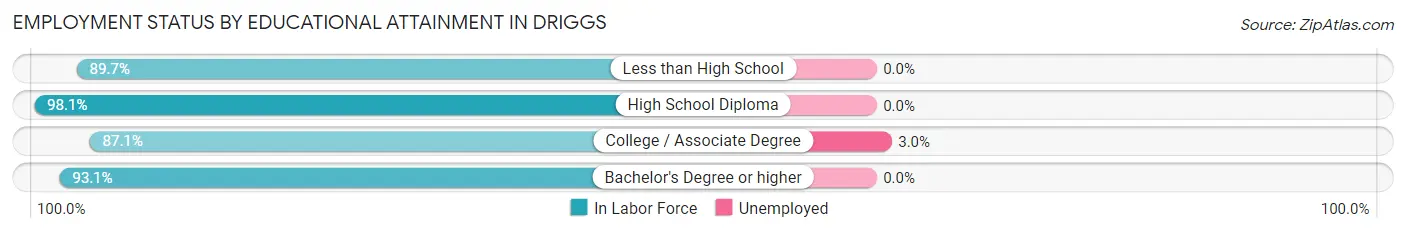
| Educational Attainment | In Labor Force | Unemployed |
| Less than High School | 192 (89.7%) | 0 (0.0%) |
| High School Diploma | 105 (98.1%) | 0 (0.0%) |
| College / Associate Degree | 338 (87.1%) | 12 (3.0%) |
| Bachelor's Degree or higher | 714 (93.1%) | 0 (0.0%) |
| Total | 1,349 (91.4%) | 10 (0.7%) |
Employment Occupations by Sex in Driggs
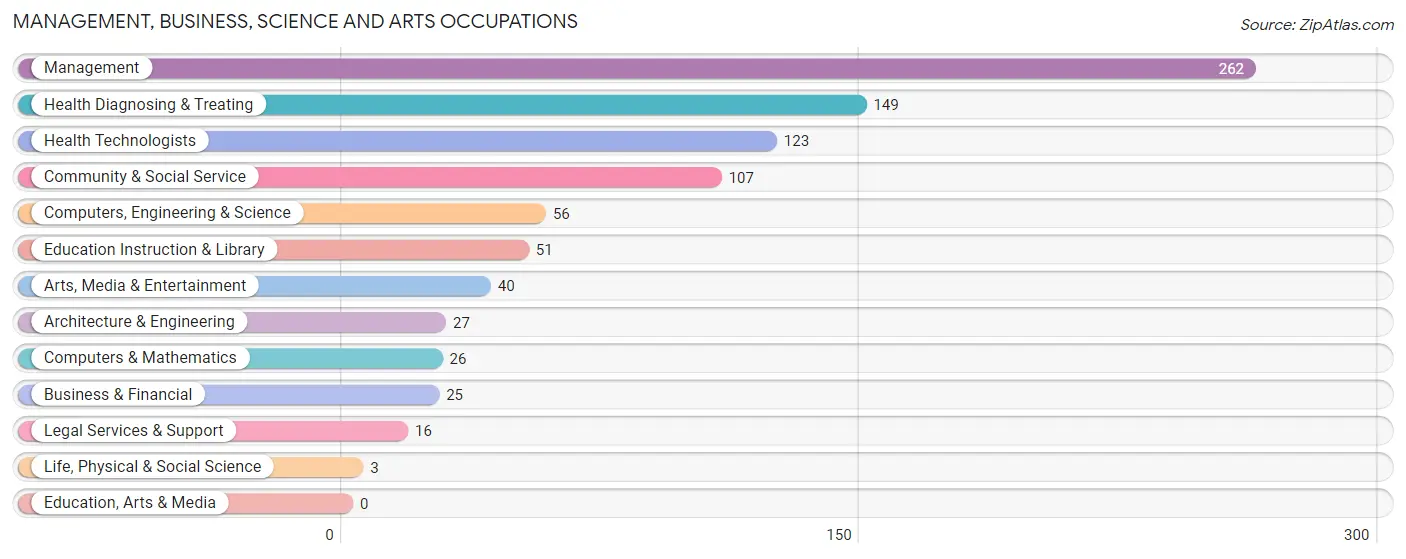
Management, Business, Science and Arts Occupations
The most common Management, Business, Science and Arts occupations in Driggs are Management (262 | 17.2%), Health Diagnosing & Treating (149 | 9.8%), Health Technologists (123 | 8.1%), Community & Social Service (107 | 7.0%), and Computers, Engineering & Science (56 | 3.7%).
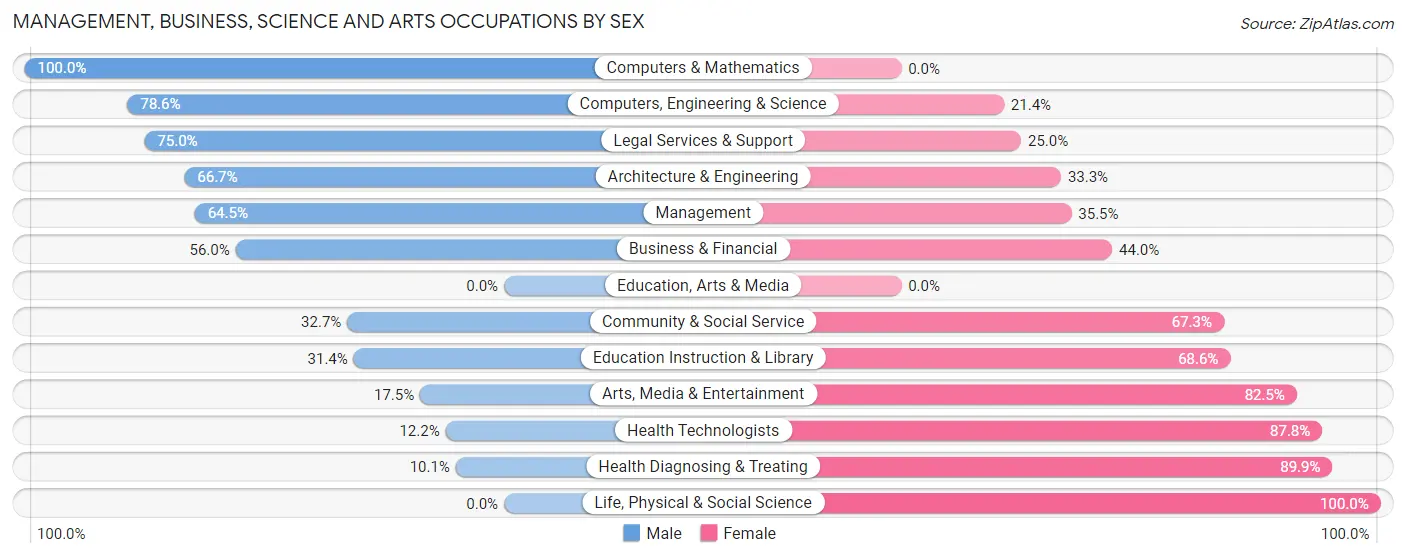
Management, Business, Science and Arts Occupations by Sex
Within the Management, Business, Science and Arts occupations in Driggs, the most male-oriented occupations are Computers & Mathematics (100.0%), Computers, Engineering & Science (78.6%), and Legal Services & Support (75.0%), while the most female-oriented occupations are Life, Physical & Social Science (100.0%), Health Diagnosing & Treating (89.9%), and Health Technologists (87.8%).
| Occupation | Male | Female |
| Management | 169 (64.5%) | 93 (35.5%) |
| Business & Financial | 14 (56.0%) | 11 (44.0%) |
| Computers, Engineering & Science | 44 (78.6%) | 12 (21.4%) |
| Computers & Mathematics | 26 (100.0%) | 0 (0.0%) |
| Architecture & Engineering | 18 (66.7%) | 9 (33.3%) |
| Life, Physical & Social Science | 0 (0.0%) | 3 (100.0%) |
| Community & Social Service | 35 (32.7%) | 72 (67.3%) |
| Education, Arts & Media | 0 (0.0%) | 0 (0.0%) |
| Legal Services & Support | 12 (75.0%) | 4 (25.0%) |
| Education Instruction & Library | 16 (31.4%) | 35 (68.6%) |
| Arts, Media & Entertainment | 7 (17.5%) | 33 (82.5%) |
| Health Diagnosing & Treating | 15 (10.1%) | 134 (89.9%) |
| Health Technologists | 15 (12.2%) | 108 (87.8%) |
| Total (Category) | 277 (46.2%) | 322 (53.8%) |
| Total (Overall) | 775 (50.7%) | 753 (49.3%) |
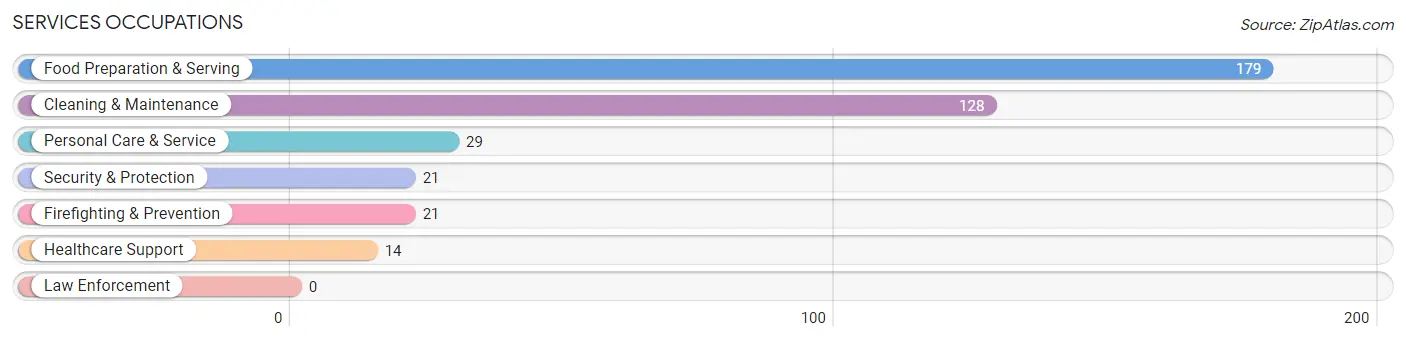
Services Occupations
The most common Services occupations in Driggs are Food Preparation & Serving (179 | 11.7%), Cleaning & Maintenance (128 | 8.4%), Personal Care & Service (29 | 1.9%), Security & Protection (21 | 1.4%), and Firefighting & Prevention (21 | 1.4%).
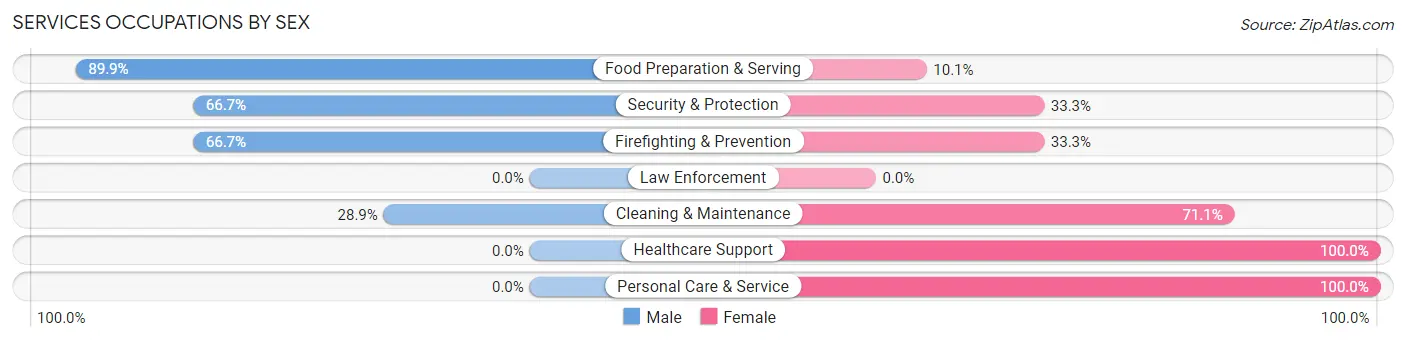
Services Occupations by Sex
Within the Services occupations in Driggs, the most male-oriented occupations are Food Preparation & Serving (89.9%), Security & Protection (66.7%), and Firefighting & Prevention (66.7%), while the most female-oriented occupations are Healthcare Support (100.0%), Personal Care & Service (100.0%), and Cleaning & Maintenance (71.1%).
| Occupation | Male | Female |
| Healthcare Support | 0 (0.0%) | 14 (100.0%) |
| Security & Protection | 14 (66.7%) | 7 (33.3%) |
| Firefighting & Prevention | 14 (66.7%) | 7 (33.3%) |
| Law Enforcement | 0 (0.0%) | 0 (0.0%) |
| Food Preparation & Serving | 161 (89.9%) | 18 (10.1%) |
| Cleaning & Maintenance | 37 (28.9%) | 91 (71.1%) |
| Personal Care & Service | 0 (0.0%) | 29 (100.0%) |
| Total (Category) | 212 (57.1%) | 159 (42.9%) |
| Total (Overall) | 775 (50.7%) | 753 (49.3%) |
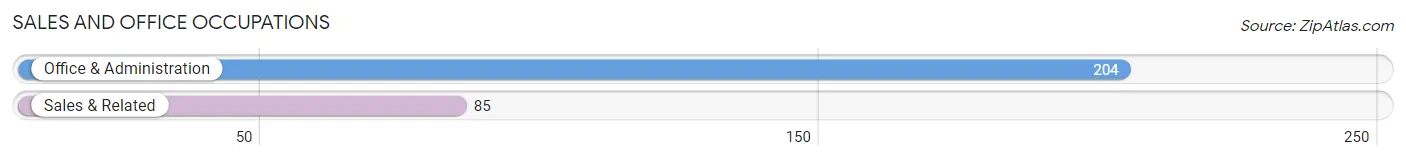
Sales and Office Occupations
The most common Sales and Office occupations in Driggs are Office & Administration (204 | 13.4%), and Sales & Related (85 | 5.6%).
Sales and Office Occupations by Sex
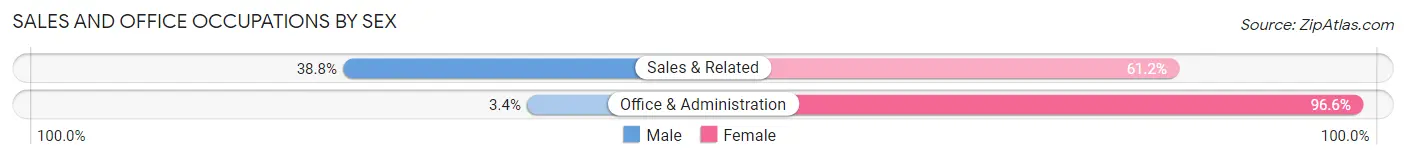
| Occupation | Male | Female |
| Sales & Related | 33 (38.8%) | 52 (61.2%) |
| Office & Administration | 7 (3.4%) | 197 (96.6%) |
| Total (Category) | 40 (13.8%) | 249 (86.2%) |
| Total (Overall) | 775 (50.7%) | 753 (49.3%) |
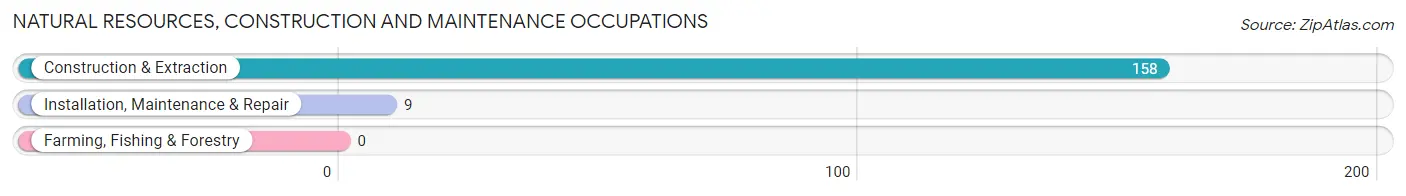
Natural Resources, Construction and Maintenance Occupations
The most common Natural Resources, Construction and Maintenance occupations in Driggs are Construction & Extraction (158 | 10.3%), and Installation, Maintenance & Repair (9 | 0.6%).
Natural Resources, Construction and Maintenance Occupations by Sex
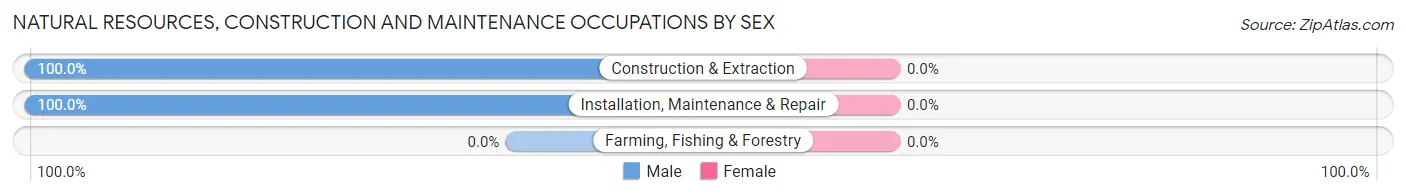
| Occupation | Male | Female |
| Farming, Fishing & Forestry | 0 (0.0%) | 0 (0.0%) |
| Construction & Extraction | 158 (100.0%) | 0 (0.0%) |
| Installation, Maintenance & Repair | 9 (100.0%) | 0 (0.0%) |
| Total (Category) | 167 (100.0%) | 0 (0.0%) |
| Total (Overall) | 775 (50.7%) | 753 (49.3%) |
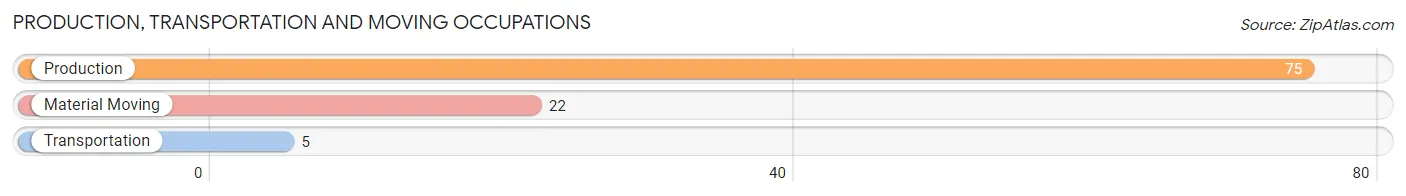
Production, Transportation and Moving Occupations
The most common Production, Transportation and Moving occupations in Driggs are Production (75 | 4.9%), Material Moving (22 | 1.4%), and Transportation (5 | 0.3%).
Production, Transportation and Moving Occupations by Sex
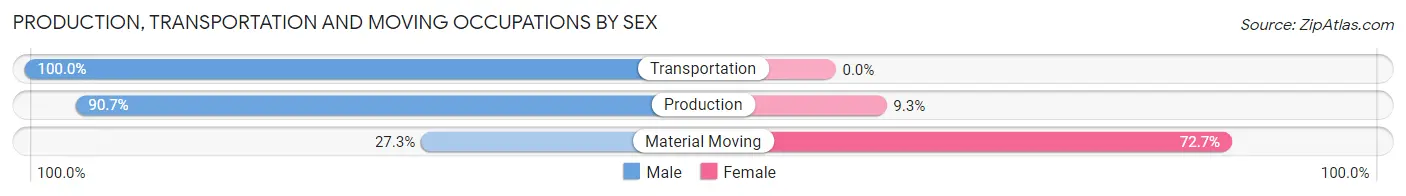
| Occupation | Male | Female |
| Production | 68 (90.7%) | 7 (9.3%) |
| Transportation | 5 (100.0%) | 0 (0.0%) |
| Material Moving | 6 (27.3%) | 16 (72.7%) |
| Total (Category) | 79 (77.4%) | 23 (22.6%) |
| Total (Overall) | 775 (50.7%) | 753 (49.3%) |
Employment Industries by Sex in Driggs
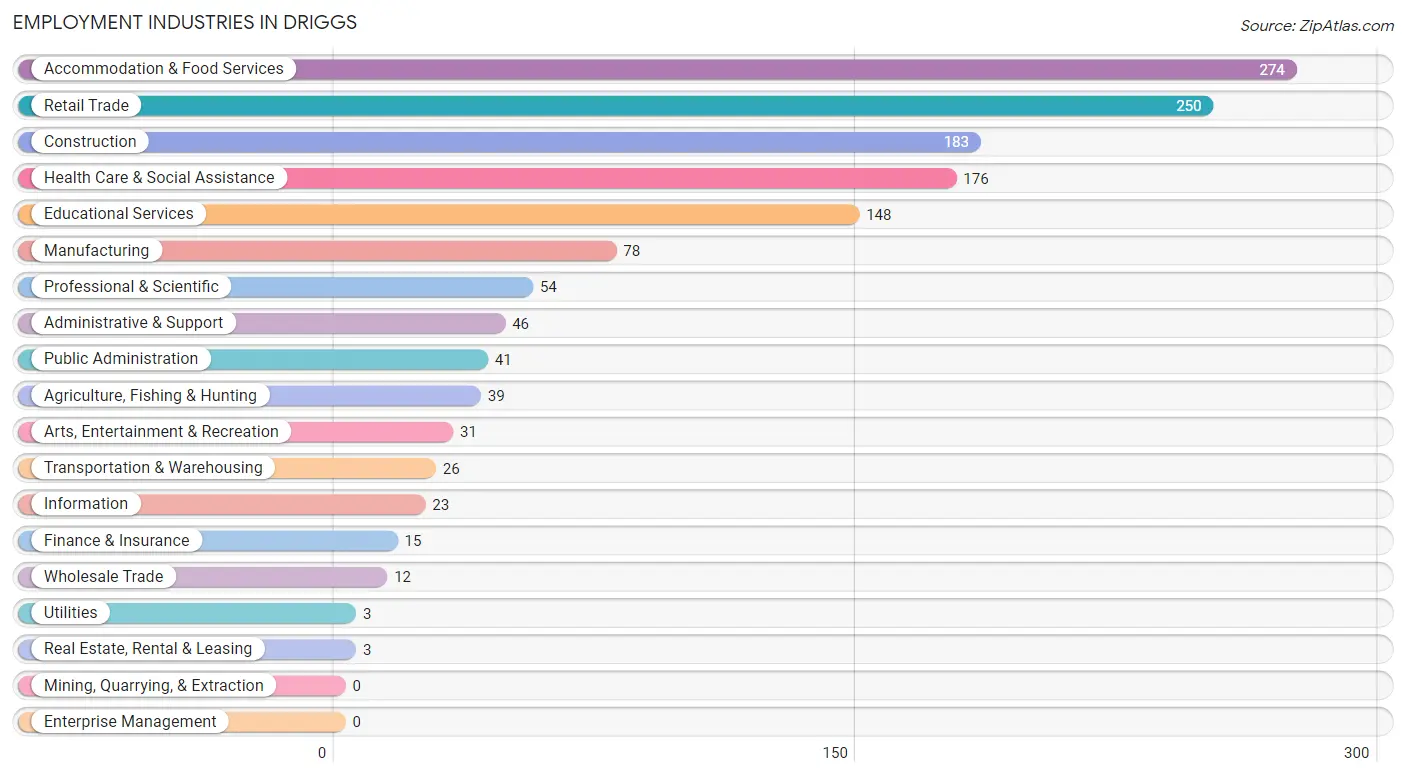
Employment Industries in Driggs
The major employment industries in Driggs include Accommodation & Food Services (274 | 17.9%), Retail Trade (250 | 16.4%), Construction (183 | 12.0%), Health Care & Social Assistance (176 | 11.5%), and Educational Services (148 | 9.7%).
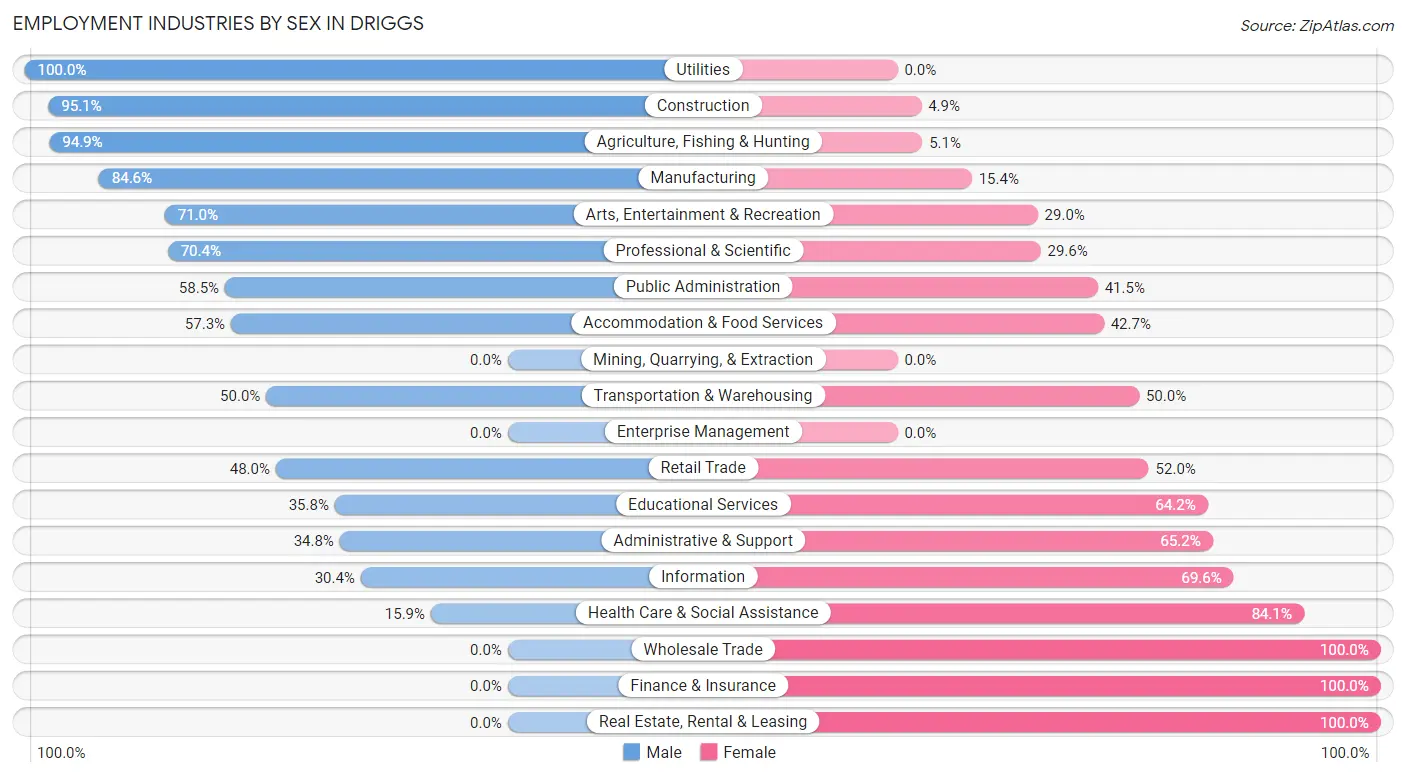
Employment Industries by Sex in Driggs
The Driggs industries that see more men than women are Utilities (100.0%), Construction (95.1%), and Agriculture, Fishing & Hunting (94.9%), whereas the industries that tend to have a higher number of women are Wholesale Trade (100.0%), Finance & Insurance (100.0%), and Real Estate, Rental & Leasing (100.0%).
| Industry | Male | Female |
| Agriculture, Fishing & Hunting | 37 (94.9%) | 2 (5.1%) |
| Mining, Quarrying, & Extraction | 0 (0.0%) | 0 (0.0%) |
| Construction | 174 (95.1%) | 9 (4.9%) |
| Manufacturing | 66 (84.6%) | 12 (15.4%) |
| Wholesale Trade | 0 (0.0%) | 12 (100.0%) |
| Retail Trade | 120 (48.0%) | 130 (52.0%) |
| Transportation & Warehousing | 13 (50.0%) | 13 (50.0%) |
| Utilities | 3 (100.0%) | 0 (0.0%) |
| Information | 7 (30.4%) | 16 (69.6%) |
| Finance & Insurance | 0 (0.0%) | 15 (100.0%) |
| Real Estate, Rental & Leasing | 0 (0.0%) | 3 (100.0%) |
| Professional & Scientific | 38 (70.4%) | 16 (29.6%) |
| Enterprise Management | 0 (0.0%) | 0 (0.0%) |
| Administrative & Support | 16 (34.8%) | 30 (65.2%) |
| Educational Services | 53 (35.8%) | 95 (64.2%) |
| Health Care & Social Assistance | 28 (15.9%) | 148 (84.1%) |
| Arts, Entertainment & Recreation | 22 (71.0%) | 9 (29.0%) |
| Accommodation & Food Services | 157 (57.3%) | 117 (42.7%) |
| Public Administration | 24 (58.5%) | 17 (41.5%) |
| Total | 775 (50.7%) | 753 (49.3%) |
Education in Driggs
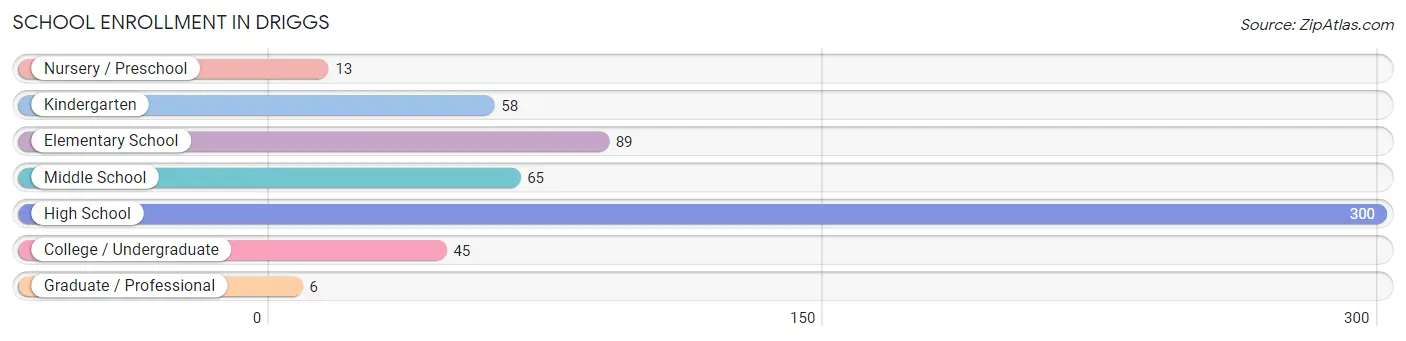
School Enrollment in Driggs
The most common levels of schooling among the 576 students in Driggs are high school (300 | 52.1%), elementary school (89 | 15.4%), and middle school (65 | 11.3%).
| School Level | # Students | % Students |
| Nursery / Preschool | 13 | 2.3% |
| Kindergarten | 58 | 10.1% |
| Elementary School | 89 | 15.4% |
| Middle School | 65 | 11.3% |
| High School | 300 | 52.1% |
| College / Undergraduate | 45 | 7.8% |
| Graduate / Professional | 6 | 1.0% |
| Total | 576 | 100.0% |
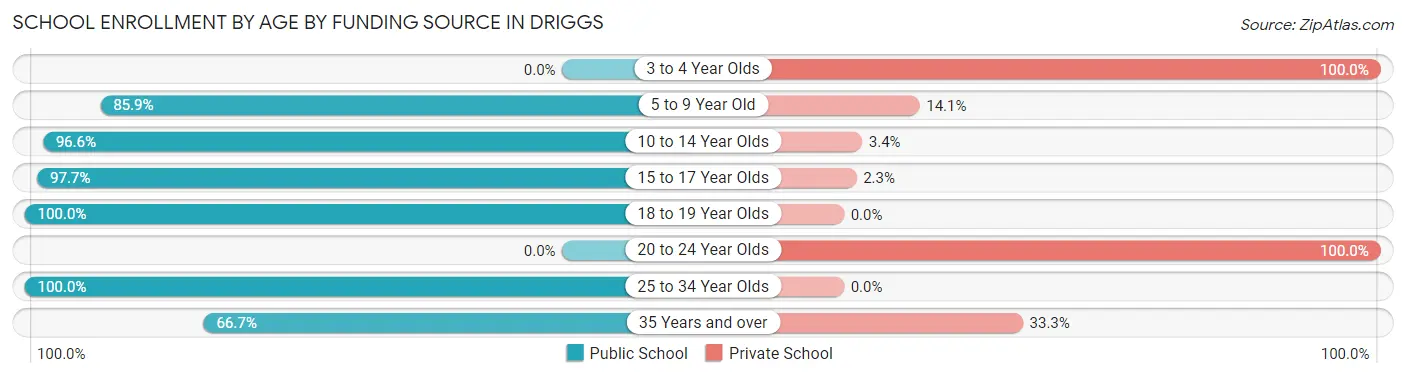
School Enrollment by Age by Funding Source in Driggs
Out of a total of 576 students who are enrolled in schools in Driggs, 56 (9.7%) attend a private institution, while the remaining 520 (90.3%) are enrolled in public schools. The age group of 3 to 4 year olds has the highest likelihood of being enrolled in private schools, with 9 (100.0% in the age bracket) enrolled. Conversely, the age group of 18 to 19 year olds has the lowest likelihood of being enrolled in a private school, with 17 (100.0% in the age bracket) attending a public institution.
| Age Bracket | Public School | Private School |
| 3 to 4 Year Olds | 0 (0.0%) | 9 (100.0%) |
| 5 to 9 Year Old | 128 (85.9%) | 21 (14.1%) |
| 10 to 14 Year Olds | 143 (96.6%) | 5 (3.4%) |
| 15 to 17 Year Olds | 209 (97.7%) | 5 (2.3%) |
| 18 to 19 Year Olds | 17 (100.0%) | 0 (0.0%) |
| 20 to 24 Year Olds | 0 (0.0%) | 13 (100.0%) |
| 25 to 34 Year Olds | 17 (100.0%) | 0 (0.0%) |
| 35 Years and over | 6 (66.7%) | 3 (33.3%) |
| Total | 520 (90.3%) | 56 (9.7%) |
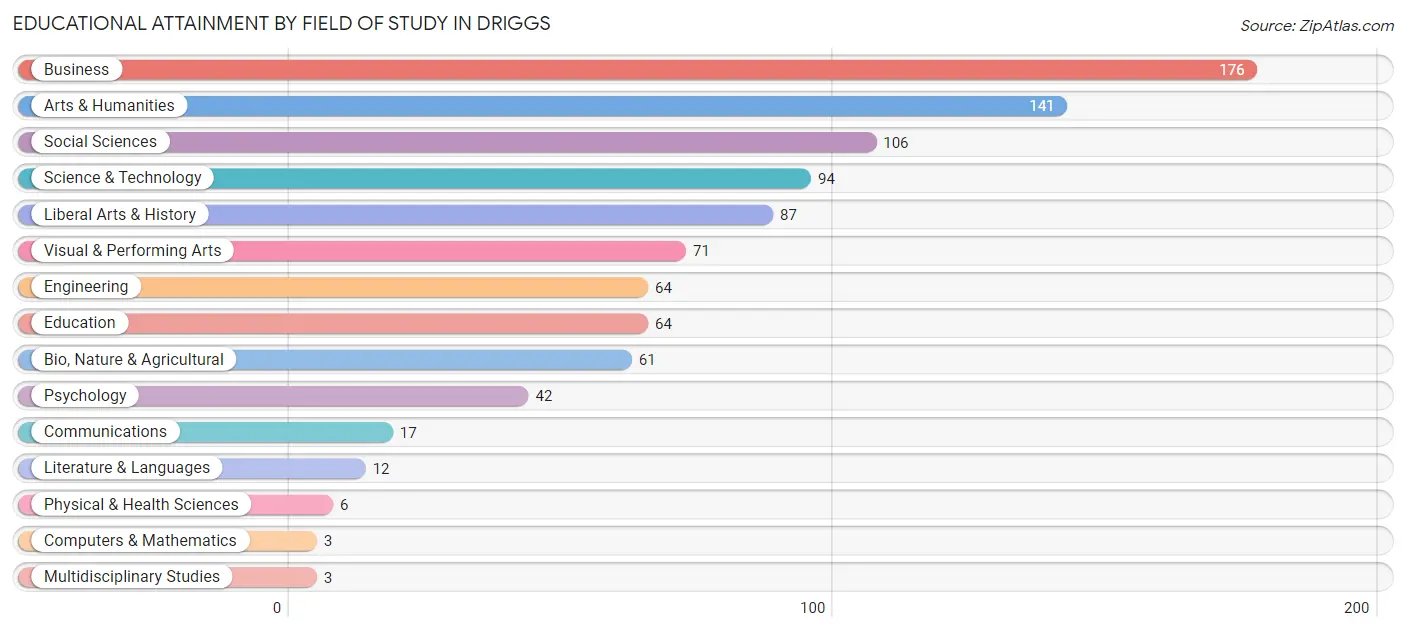
Educational Attainment by Field of Study in Driggs
Business (176 | 18.6%), arts & humanities (141 | 14.9%), social sciences (106 | 11.2%), science & technology (94 | 9.9%), and liberal arts & history (87 | 9.2%) are the most common fields of study among 947 individuals in Driggs who have obtained a bachelor's degree or higher.
| Field of Study | # Graduates | % Graduates |
| Computers & Mathematics | 3 | 0.3% |
| Bio, Nature & Agricultural | 61 | 6.4% |
| Physical & Health Sciences | 6 | 0.6% |
| Psychology | 42 | 4.4% |
| Social Sciences | 106 | 11.2% |
| Engineering | 64 | 6.8% |
| Multidisciplinary Studies | 3 | 0.3% |
| Science & Technology | 94 | 9.9% |
| Business | 176 | 18.6% |
| Education | 64 | 6.8% |
| Literature & Languages | 12 | 1.3% |
| Liberal Arts & History | 87 | 9.2% |
| Visual & Performing Arts | 71 | 7.5% |
| Communications | 17 | 1.8% |
| Arts & Humanities | 141 | 14.9% |
| Total | 947 | 100.0% |
Transportation & Commute in Driggs
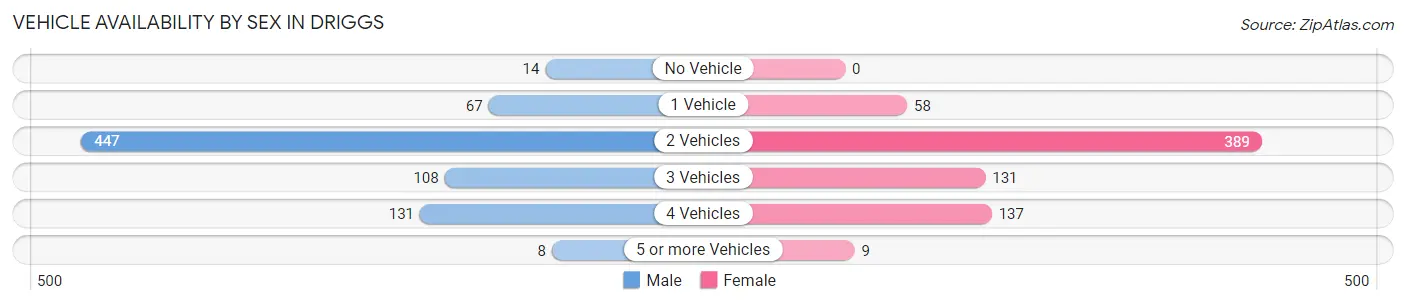
Vehicle Availability by Sex in Driggs
The most prevalent vehicle ownership categories in Driggs are males with 2 vehicles (447, accounting for 57.7%) and females with 2 vehicles (389, making up 61.7%).
| Vehicles Available | Male | Female |
| No Vehicle | 14 (1.8%) | 0 (0.0%) |
| 1 Vehicle | 67 (8.6%) | 58 (8.0%) |
| 2 Vehicles | 447 (57.7%) | 389 (53.7%) |
| 3 Vehicles | 108 (13.9%) | 131 (18.1%) |
| 4 Vehicles | 131 (16.9%) | 137 (18.9%) |
| 5 or more Vehicles | 8 (1.0%) | 9 (1.2%) |
| Total | 775 (100.0%) | 724 (100.0%) |
Commute Time in Driggs
The most frequently occuring commute durations in Driggs are 5 to 9 minutes (503 commuters, 37.7%), 10 to 14 minutes (217 commuters, 16.3%), and less than 5 minutes (193 commuters, 14.5%).
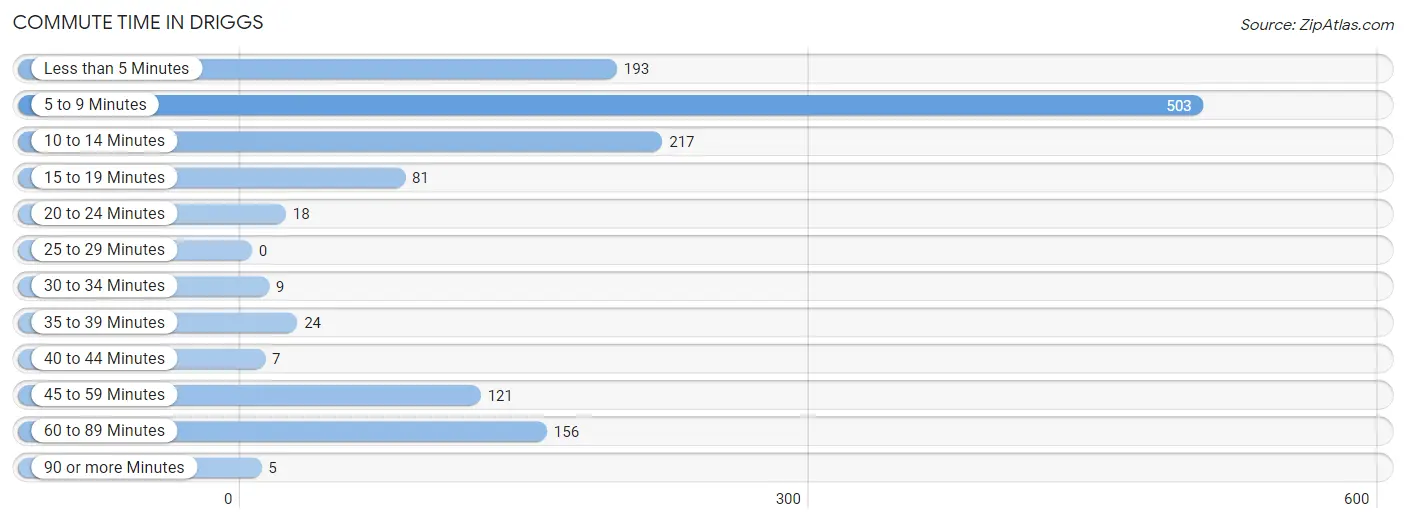
| Commute Time | # Commuters | % Commuters |
| Less than 5 Minutes | 193 | 14.5% |
| 5 to 9 Minutes | 503 | 37.7% |
| 10 to 14 Minutes | 217 | 16.3% |
| 15 to 19 Minutes | 81 | 6.1% |
| 20 to 24 Minutes | 18 | 1.3% |
| 25 to 29 Minutes | 0 | 0.0% |
| 30 to 34 Minutes | 9 | 0.7% |
| 35 to 39 Minutes | 24 | 1.8% |
| 40 to 44 Minutes | 7 | 0.5% |
| 45 to 59 Minutes | 121 | 9.1% |
| 60 to 89 Minutes | 156 | 11.7% |
| 90 or more Minutes | 5 | 0.4% |
Commute Time by Sex in Driggs
The most common commute times in Driggs are 5 to 9 minutes (134 commuters, 19.5%) for males and 5 to 9 minutes (369 commuters, 57.0%) for females.
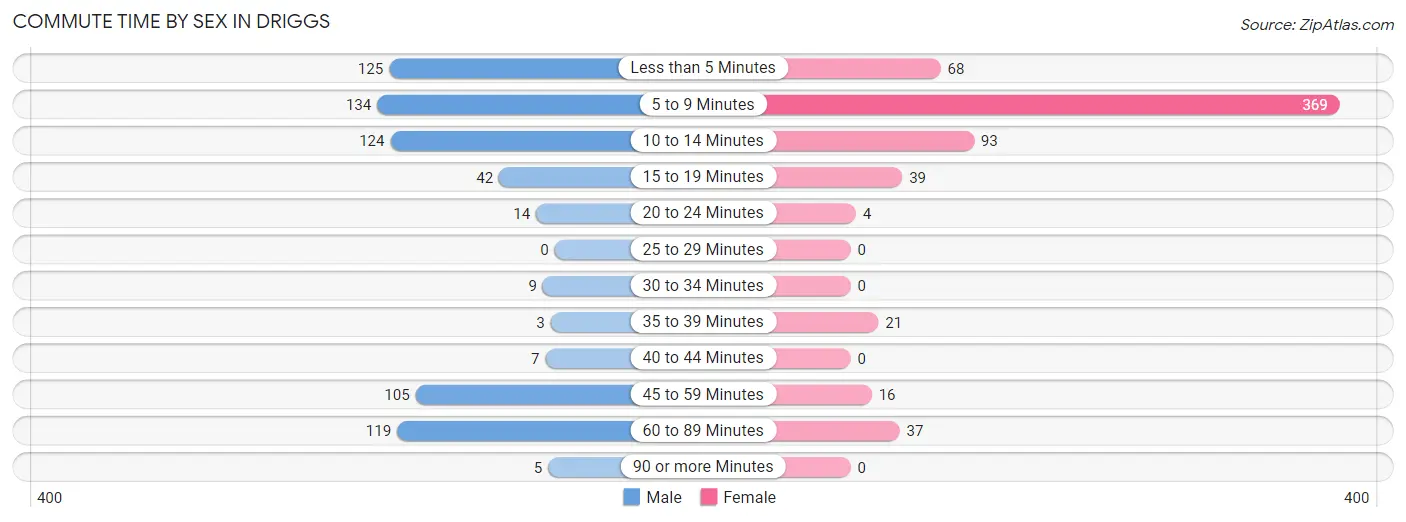
| Commute Time | Male | Female |
| Less than 5 Minutes | 125 (18.2%) | 68 (10.5%) |
| 5 to 9 Minutes | 134 (19.5%) | 369 (57.0%) |
| 10 to 14 Minutes | 124 (18.0%) | 93 (14.4%) |
| 15 to 19 Minutes | 42 (6.1%) | 39 (6.0%) |
| 20 to 24 Minutes | 14 (2.0%) | 4 (0.6%) |
| 25 to 29 Minutes | 0 (0.0%) | 0 (0.0%) |
| 30 to 34 Minutes | 9 (1.3%) | 0 (0.0%) |
| 35 to 39 Minutes | 3 (0.4%) | 21 (3.3%) |
| 40 to 44 Minutes | 7 (1.0%) | 0 (0.0%) |
| 45 to 59 Minutes | 105 (15.3%) | 16 (2.5%) |
| 60 to 89 Minutes | 119 (17.3%) | 37 (5.7%) |
| 90 or more Minutes | 5 (0.7%) | 0 (0.0%) |
Time of Departure to Work by Sex in Driggs
The most frequent times of departure to work in Driggs are 8:00 AM to 8:29 AM (111, 16.2%) for males and 7:30 AM to 7:59 AM (182, 28.1%) for females.
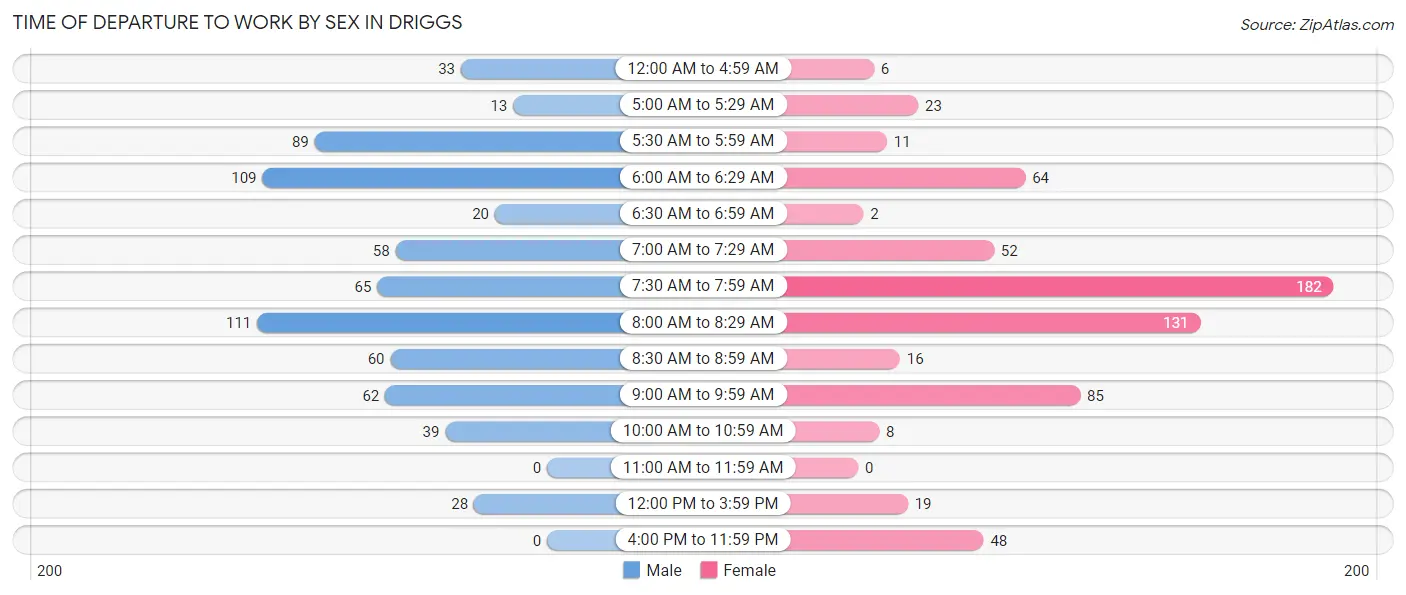
| Time of Departure | Male | Female |
| 12:00 AM to 4:59 AM | 33 (4.8%) | 6 (0.9%) |
| 5:00 AM to 5:29 AM | 13 (1.9%) | 23 (3.5%) |
| 5:30 AM to 5:59 AM | 89 (13.0%) | 11 (1.7%) |
| 6:00 AM to 6:29 AM | 109 (15.9%) | 64 (9.9%) |
| 6:30 AM to 6:59 AM | 20 (2.9%) | 2 (0.3%) |
| 7:00 AM to 7:29 AM | 58 (8.4%) | 52 (8.0%) |
| 7:30 AM to 7:59 AM | 65 (9.5%) | 182 (28.1%) |
| 8:00 AM to 8:29 AM | 111 (16.2%) | 131 (20.3%) |
| 8:30 AM to 8:59 AM | 60 (8.7%) | 16 (2.5%) |
| 9:00 AM to 9:59 AM | 62 (9.0%) | 85 (13.1%) |
| 10:00 AM to 10:59 AM | 39 (5.7%) | 8 (1.2%) |
| 11:00 AM to 11:59 AM | 0 (0.0%) | 0 (0.0%) |
| 12:00 PM to 3:59 PM | 28 (4.1%) | 19 (2.9%) |
| 4:00 PM to 11:59 PM | 0 (0.0%) | 48 (7.4%) |
| Total | 687 (100.0%) | 647 (100.0%) |
Housing Occupancy in Driggs
Occupancy by Ownership in Driggs
Of the total 849 dwellings in Driggs, owner-occupied units account for 515 (60.7%), while renter-occupied units make up 334 (39.3%).
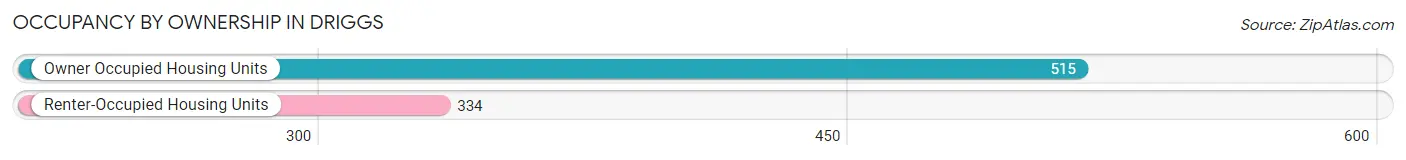
| Occupancy | # Housing Units | % Housing Units |
| Owner Occupied Housing Units | 515 | 60.7% |
| Renter-Occupied Housing Units | 334 | 39.3% |
| Total Occupied Housing Units | 849 | 100.0% |
Occupancy by Household Size in Driggs
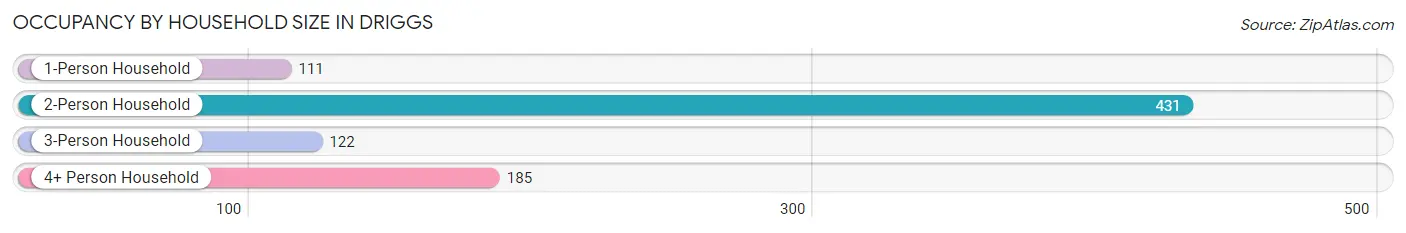
| Household Size | # Housing Units | % Housing Units |
| 1-Person Household | 111 | 13.1% |
| 2-Person Household | 431 | 50.8% |
| 3-Person Household | 122 | 14.4% |
| 4+ Person Household | 185 | 21.8% |
| Total Housing Units | 849 | 100.0% |
Occupancy by Ownership by Household Size in Driggs
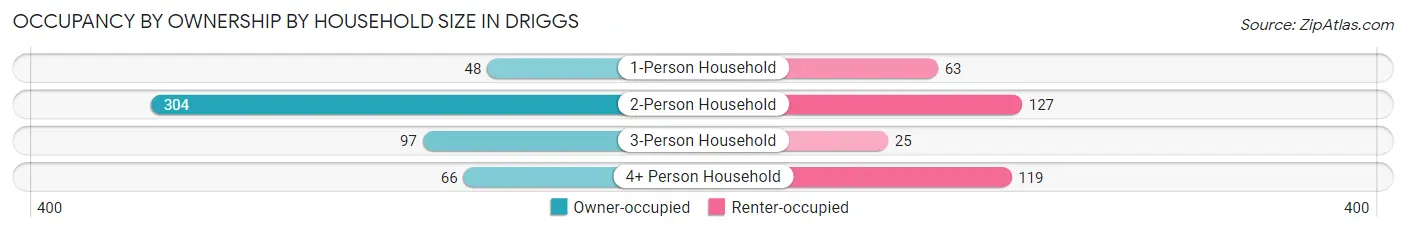
| Household Size | Owner-occupied | Renter-occupied |
| 1-Person Household | 48 (43.2%) | 63 (56.8%) |
| 2-Person Household | 304 (70.5%) | 127 (29.5%) |
| 3-Person Household | 97 (79.5%) | 25 (20.5%) |
| 4+ Person Household | 66 (35.7%) | 119 (64.3%) |
| Total Housing Units | 515 (60.7%) | 334 (39.3%) |
Occupancy by Educational Attainment in Driggs
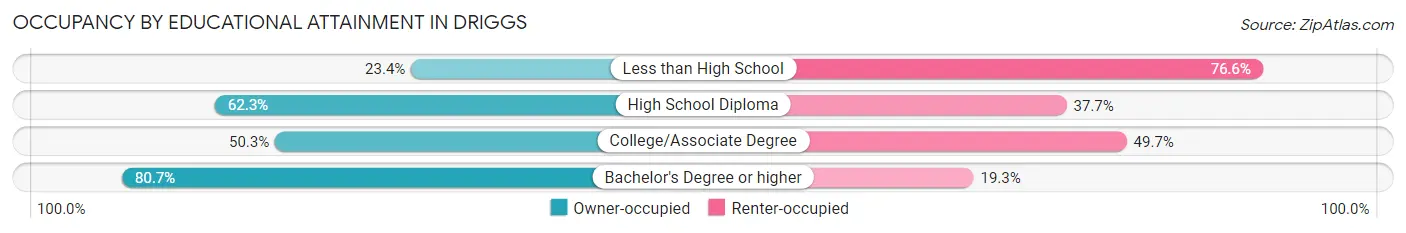
| Household Size | Owner-occupied | Renter-occupied |
| Less than High School | 25 (23.4%) | 82 (76.6%) |
| High School Diploma | 66 (62.3%) | 40 (37.7%) |
| College/Associate Degree | 148 (50.3%) | 146 (49.7%) |
| Bachelor's Degree or higher | 276 (80.7%) | 66 (19.3%) |
Occupancy by Age of Householder in Driggs
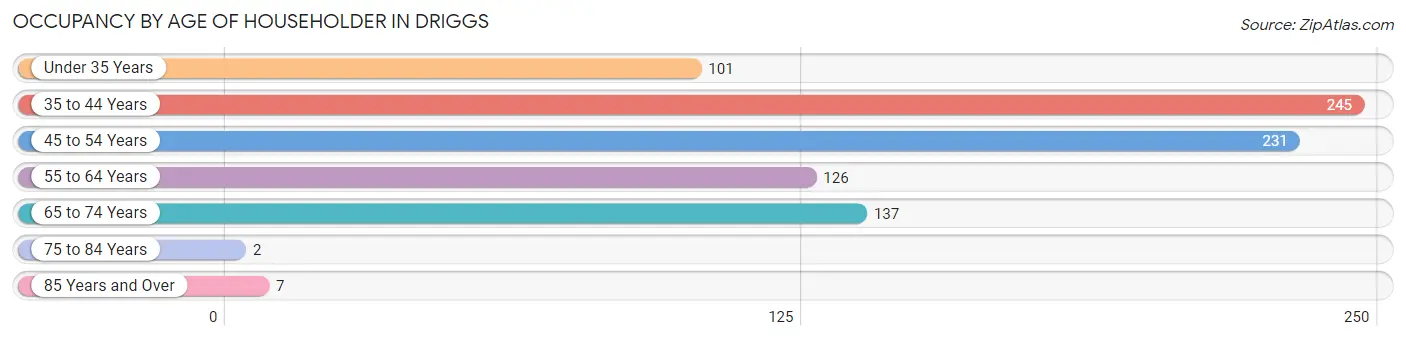
| Age Bracket | # Households | % Households |
| Under 35 Years | 101 | 11.9% |
| 35 to 44 Years | 245 | 28.9% |
| 45 to 54 Years | 231 | 27.2% |
| 55 to 64 Years | 126 | 14.8% |
| 65 to 74 Years | 137 | 16.1% |
| 75 to 84 Years | 2 | 0.2% |
| 85 Years and Over | 7 | 0.8% |
| Total | 849 | 100.0% |
Housing Finances in Driggs
Median Income by Occupancy in Driggs
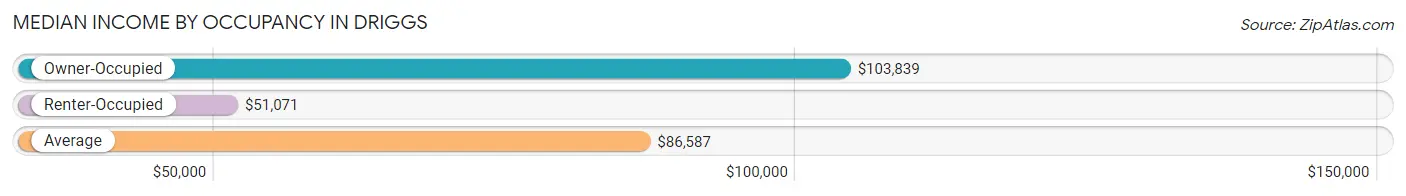
| Occupancy Type | # Households | Median Income |
| Owner-Occupied | 515 (60.7%) | $103,839 |
| Renter-Occupied | 334 (39.3%) | $51,071 |
| Average | 849 (100.0%) | $86,587 |
Occupancy by Householder Income Bracket in Driggs
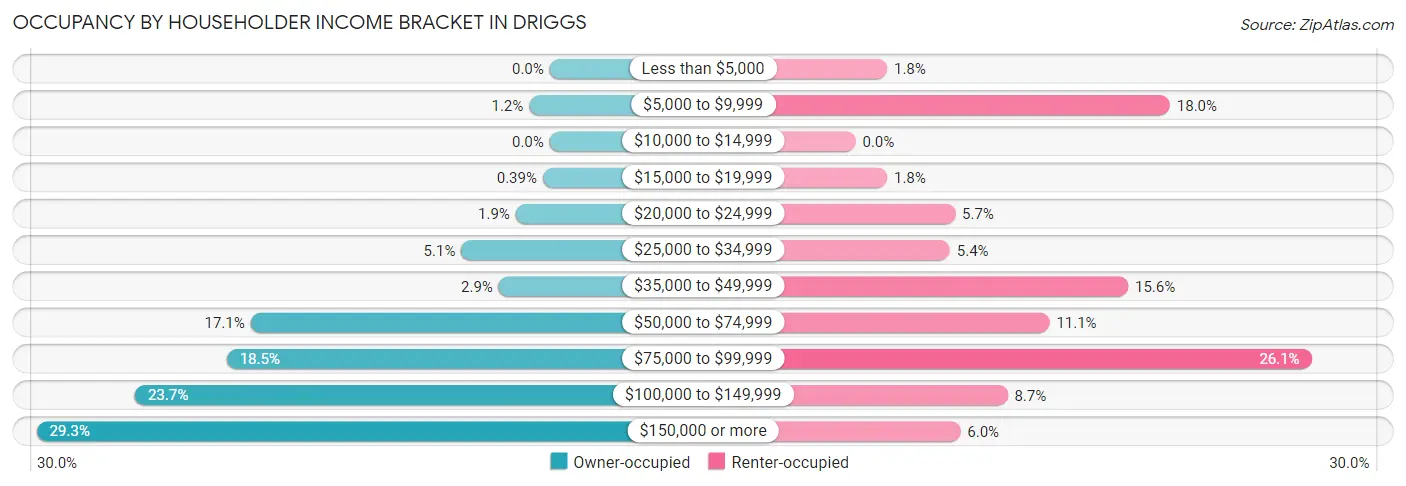
| Income Bracket | Owner-occupied | Renter-occupied |
| Less than $5,000 | 0 (0.0%) | 6 (1.8%) |
| $5,000 to $9,999 | 6 (1.2%) | 60 (18.0%) |
| $10,000 to $14,999 | 0 (0.0%) | 0 (0.0%) |
| $15,000 to $19,999 | 2 (0.4%) | 6 (1.8%) |
| $20,000 to $24,999 | 10 (1.9%) | 19 (5.7%) |
| $25,000 to $34,999 | 26 (5.1%) | 18 (5.4%) |
| $35,000 to $49,999 | 15 (2.9%) | 52 (15.6%) |
| $50,000 to $74,999 | 88 (17.1%) | 37 (11.1%) |
| $75,000 to $99,999 | 95 (18.4%) | 87 (26.1%) |
| $100,000 to $149,999 | 122 (23.7%) | 29 (8.7%) |
| $150,000 or more | 151 (29.3%) | 20 (6.0%) |
| Total | 515 (100.0%) | 334 (100.0%) |
Monthly Housing Cost Tiers in Driggs
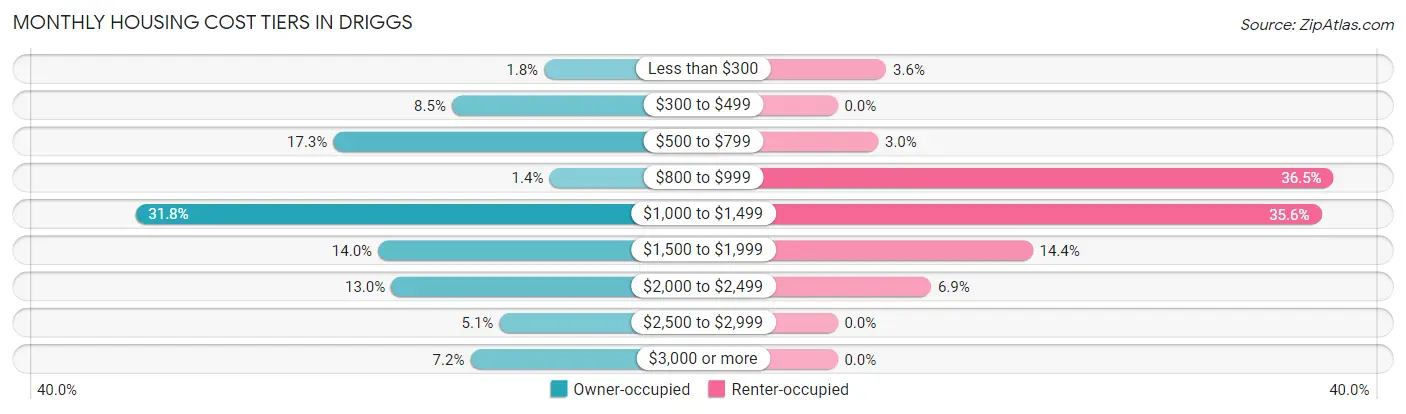
| Monthly Cost | Owner-occupied | Renter-occupied |
| Less than $300 | 9 (1.8%) | 12 (3.6%) |
| $300 to $499 | 44 (8.5%) | 0 (0.0%) |
| $500 to $799 | 89 (17.3%) | 10 (3.0%) |
| $800 to $999 | 7 (1.4%) | 122 (36.5%) |
| $1,000 to $1,499 | 164 (31.8%) | 119 (35.6%) |
| $1,500 to $1,999 | 72 (14.0%) | 48 (14.4%) |
| $2,000 to $2,499 | 67 (13.0%) | 23 (6.9%) |
| $2,500 to $2,999 | 26 (5.1%) | 0 (0.0%) |
| $3,000 or more | 37 (7.2%) | 0 (0.0%) |
| Total | 515 (100.0%) | 334 (100.0%) |
Physical Housing Characteristics in Driggs
Housing Structures in Driggs
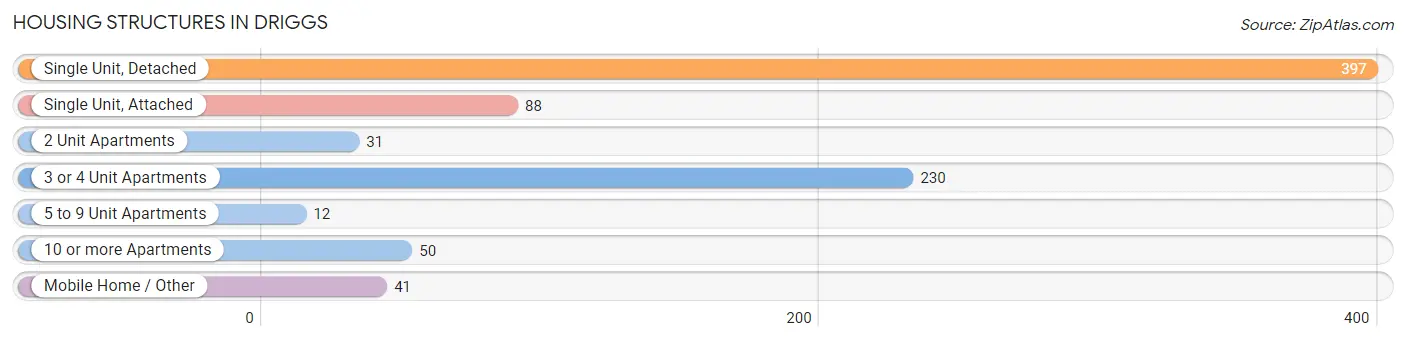
| Structure Type | # Housing Units | % Housing Units |
| Single Unit, Detached | 397 | 46.8% |
| Single Unit, Attached | 88 | 10.4% |
| 2 Unit Apartments | 31 | 3.6% |
| 3 or 4 Unit Apartments | 230 | 27.1% |
| 5 to 9 Unit Apartments | 12 | 1.4% |
| 10 or more Apartments | 50 | 5.9% |
| Mobile Home / Other | 41 | 4.8% |
| Total | 849 | 100.0% |
Housing Structures by Occupancy in Driggs
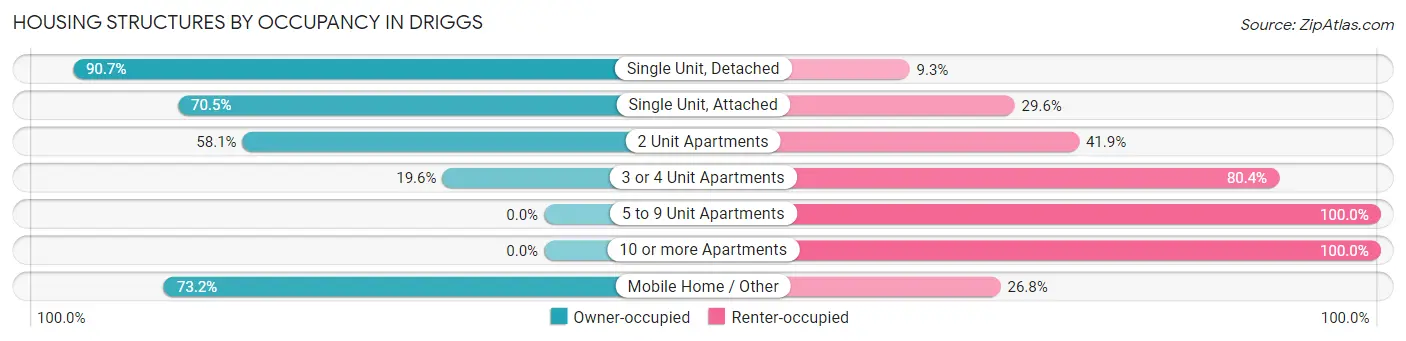
| Structure Type | Owner-occupied | Renter-occupied |
| Single Unit, Detached | 360 (90.7%) | 37 (9.3%) |
| Single Unit, Attached | 62 (70.5%) | 26 (29.5%) |
| 2 Unit Apartments | 18 (58.1%) | 13 (41.9%) |
| 3 or 4 Unit Apartments | 45 (19.6%) | 185 (80.4%) |
| 5 to 9 Unit Apartments | 0 (0.0%) | 12 (100.0%) |
| 10 or more Apartments | 0 (0.0%) | 50 (100.0%) |
| Mobile Home / Other | 30 (73.2%) | 11 (26.8%) |
| Total | 515 (60.7%) | 334 (39.3%) |
Housing Structures by Number of Rooms in Driggs
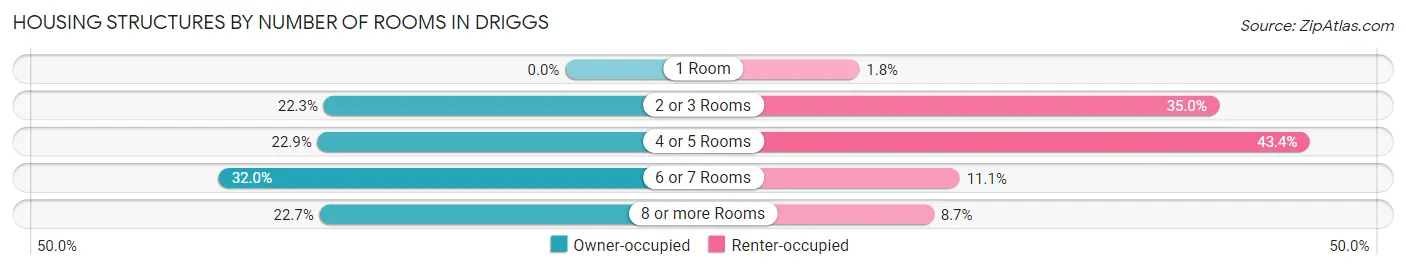
| Number of Rooms | Owner-occupied | Renter-occupied |
| 1 Room | 0 (0.0%) | 6 (1.8%) |
| 2 or 3 Rooms | 115 (22.3%) | 117 (35.0%) |
| 4 or 5 Rooms | 118 (22.9%) | 145 (43.4%) |
| 6 or 7 Rooms | 165 (32.0%) | 37 (11.1%) |
| 8 or more Rooms | 117 (22.7%) | 29 (8.7%) |
| Total | 515 (100.0%) | 334 (100.0%) |
Housing Structure by Heating Type in Driggs
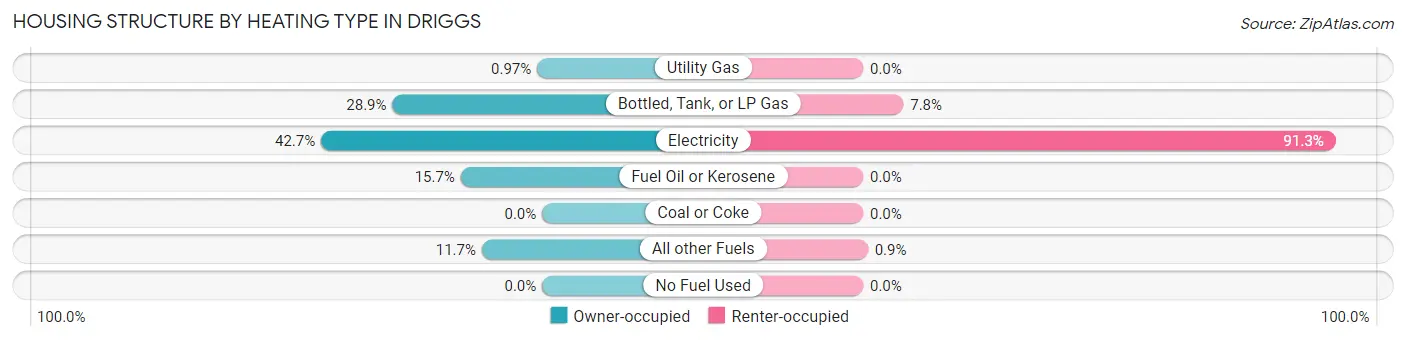
| Heating Type | Owner-occupied | Renter-occupied |
| Utility Gas | 5 (1.0%) | 0 (0.0%) |
| Bottled, Tank, or LP Gas | 149 (28.9%) | 26 (7.8%) |
| Electricity | 220 (42.7%) | 305 (91.3%) |
| Fuel Oil or Kerosene | 81 (15.7%) | 0 (0.0%) |
| Coal or Coke | 0 (0.0%) | 0 (0.0%) |
| All other Fuels | 60 (11.7%) | 3 (0.9%) |
| No Fuel Used | 0 (0.0%) | 0 (0.0%) |
| Total | 515 (100.0%) | 334 (100.0%) |
Household Vehicle Usage in Driggs
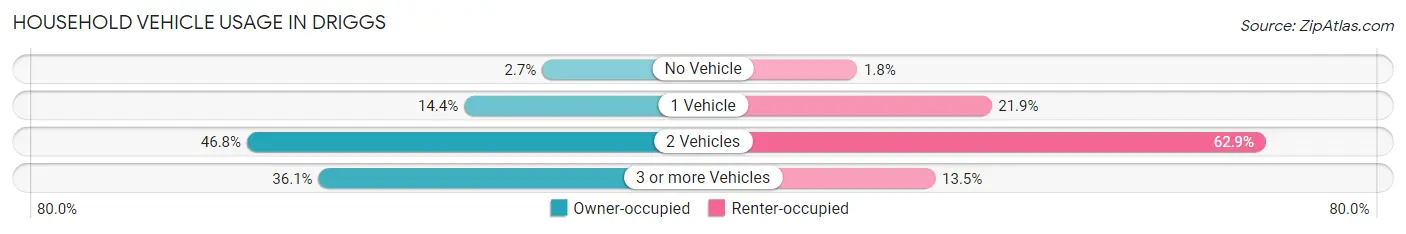
| Vehicles per Household | Owner-occupied | Renter-occupied |
| No Vehicle | 14 (2.7%) | 6 (1.8%) |
| 1 Vehicle | 74 (14.4%) | 73 (21.9%) |
| 2 Vehicles | 241 (46.8%) | 210 (62.9%) |
| 3 or more Vehicles | 186 (36.1%) | 45 (13.5%) |
| Total | 515 (100.0%) | 334 (100.0%) |
Real Estate & Mortgages in Driggs
Real Estate and Mortgage Overview in Driggs
| Characteristic | Without Mortgage | With Mortgage |
| Housing Units | 223 | 292 |
| Median Property Value | $407,900 | $400,000 |
| Median Household Income | $83,125 | $89 |
| Monthly Housing Costs | $681 | $37 |
| Real Estate Taxes | $1,796 | $6 |
Property Value by Mortgage Status in Driggs
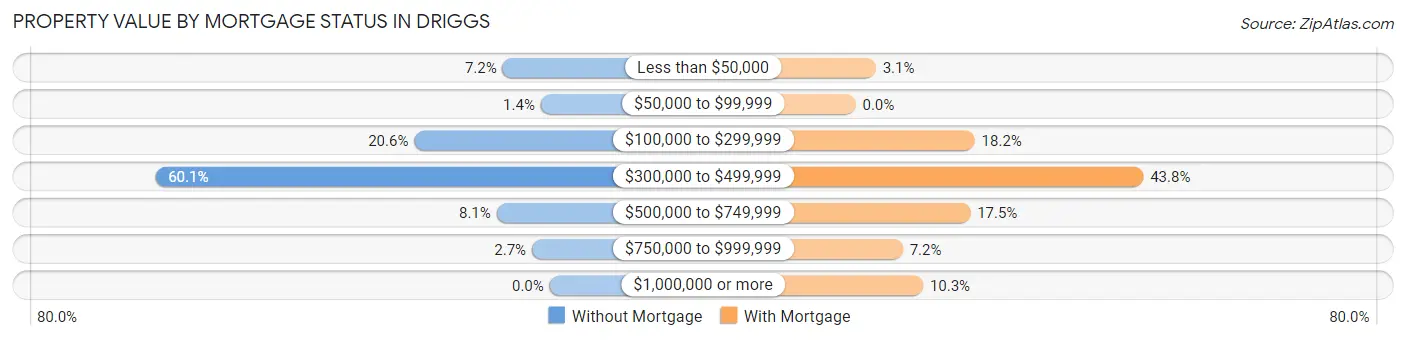
| Property Value | Without Mortgage | With Mortgage |
| Less than $50,000 | 16 (7.2%) | 9 (3.1%) |
| $50,000 to $99,999 | 3 (1.3%) | 0 (0.0%) |
| $100,000 to $299,999 | 46 (20.6%) | 53 (18.1%) |
| $300,000 to $499,999 | 134 (60.1%) | 128 (43.8%) |
| $500,000 to $749,999 | 18 (8.1%) | 51 (17.5%) |
| $750,000 to $999,999 | 6 (2.7%) | 21 (7.2%) |
| $1,000,000 or more | 0 (0.0%) | 30 (10.3%) |
| Total | 223 (100.0%) | 292 (100.0%) |
Household Income by Mortgage Status in Driggs
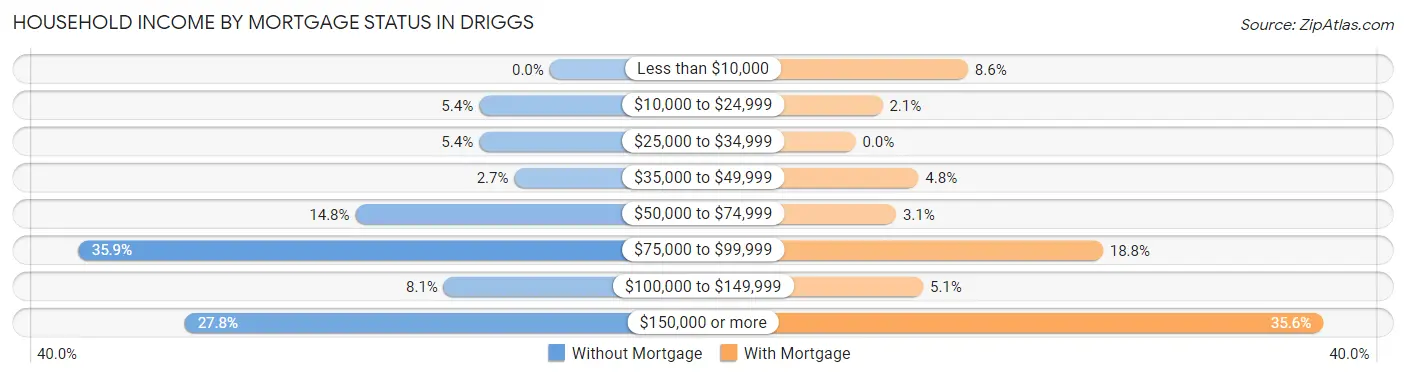
| Household Income | Without Mortgage | With Mortgage |
| Less than $10,000 | 0 (0.0%) | 25 (8.6%) |
| $10,000 to $24,999 | 12 (5.4%) | 6 (2.1%) |
| $25,000 to $34,999 | 12 (5.4%) | 0 (0.0%) |
| $35,000 to $49,999 | 6 (2.7%) | 14 (4.8%) |
| $50,000 to $74,999 | 33 (14.8%) | 9 (3.1%) |
| $75,000 to $99,999 | 80 (35.9%) | 55 (18.8%) |
| $100,000 to $149,999 | 18 (8.1%) | 15 (5.1%) |
| $150,000 or more | 62 (27.8%) | 104 (35.6%) |
| Total | 223 (100.0%) | 292 (100.0%) |
Property Value to Household Income Ratio in Driggs
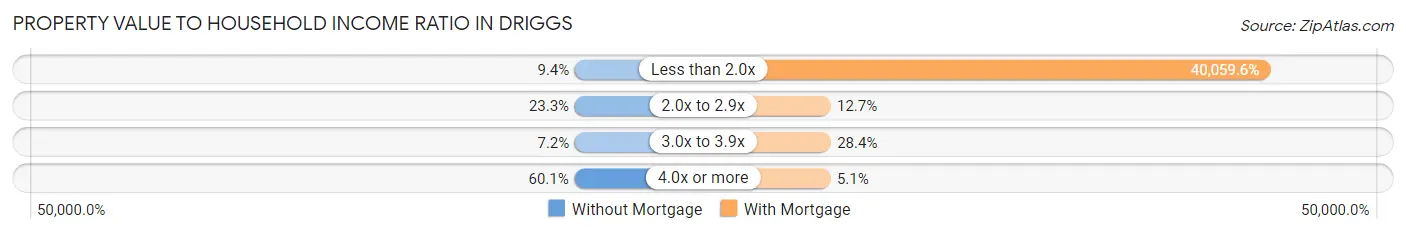
| Value-to-Income Ratio | Without Mortgage | With Mortgage |
| Less than 2.0x | 21 (9.4%) | 116,974 (40,059.6%) |
| 2.0x to 2.9x | 52 (23.3%) | 37 (12.7%) |
| 3.0x to 3.9x | 16 (7.2%) | 83 (28.4%) |
| 4.0x or more | 134 (60.1%) | 15 (5.1%) |
| Total | 223 (100.0%) | 292 (100.0%) |
Real Estate Taxes by Mortgage Status in Driggs
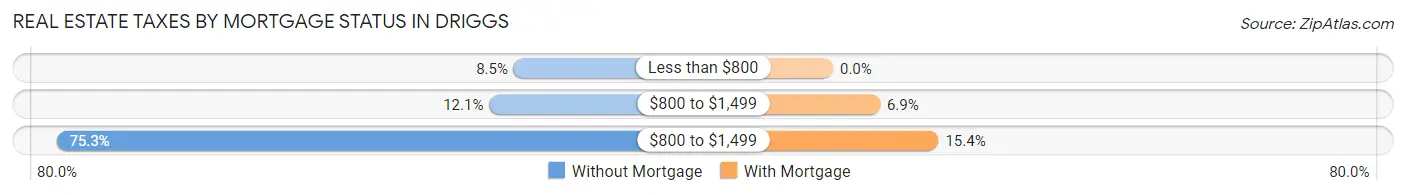
| Property Taxes | Without Mortgage | With Mortgage |
| Less than $800 | 19 (8.5%) | 0 (0.0%) |
| $800 to $1,499 | 27 (12.1%) | 20 (6.9%) |
| $800 to $1,499 | 168 (75.3%) | 45 (15.4%) |
| Total | 223 (100.0%) | 292 (100.0%) |
Health & Disability in Driggs
Health Insurance Coverage by Age in Driggs
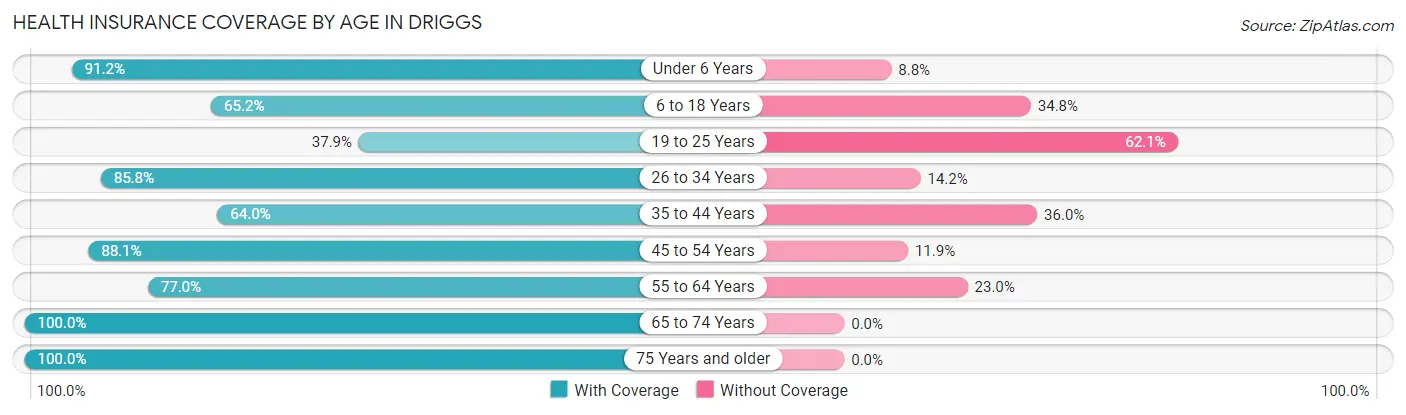
| Age Bracket | With Coverage | Without Coverage |
| Under 6 Years | 135 (91.2%) | 13 (8.8%) |
| 6 to 18 Years | 373 (65.2%) | 199 (34.8%) |
| 19 to 25 Years | 39 (37.9%) | 64 (62.1%) |
| 26 to 34 Years | 199 (85.8%) | 33 (14.2%) |
| 35 to 44 Years | 365 (64.0%) | 205 (36.0%) |
| 45 to 54 Years | 356 (88.1%) | 48 (11.9%) |
| 55 to 64 Years | 201 (77.0%) | 60 (23.0%) |
| 65 to 74 Years | 230 (100.0%) | 0 (0.0%) |
| 75 Years and older | 28 (100.0%) | 0 (0.0%) |
| Total | 1,926 (75.6%) | 622 (24.4%) |
Health Insurance Coverage by Citizenship Status in Driggs
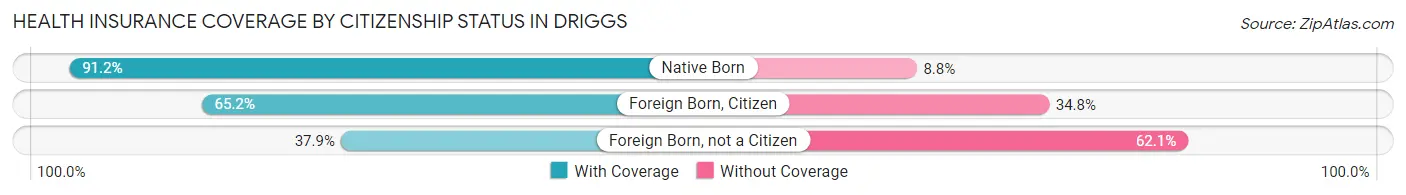
| Citizenship Status | With Coverage | Without Coverage |
| Native Born | 135 (91.2%) | 13 (8.8%) |
| Foreign Born, Citizen | 373 (65.2%) | 199 (34.8%) |
| Foreign Born, not a Citizen | 39 (37.9%) | 64 (62.1%) |
Health Insurance Coverage by Household Income in Driggs
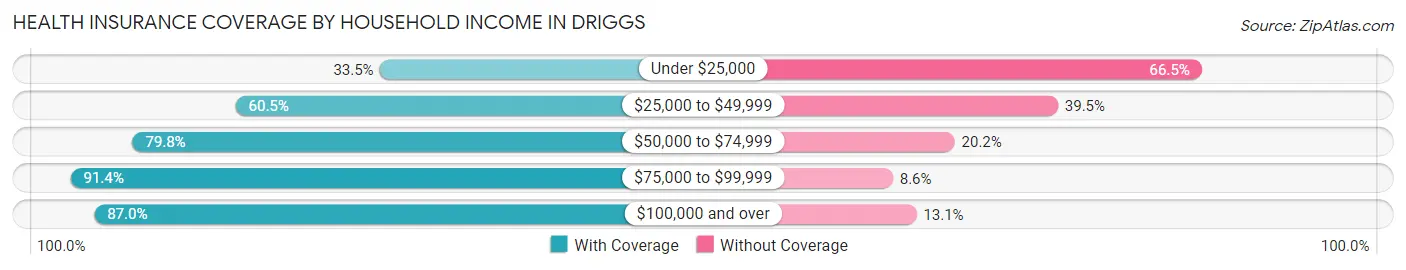
| Household Income | With Coverage | Without Coverage |
| Under $25,000 | 121 (33.5%) | 240 (66.5%) |
| $25,000 to $49,999 | 185 (60.5%) | 121 (39.5%) |
| $50,000 to $74,999 | 391 (79.8%) | 99 (20.2%) |
| $75,000 to $99,999 | 403 (91.4%) | 38 (8.6%) |
| $100,000 and over | 826 (87.0%) | 124 (13.1%) |
Public vs Private Health Insurance Coverage by Age in Driggs
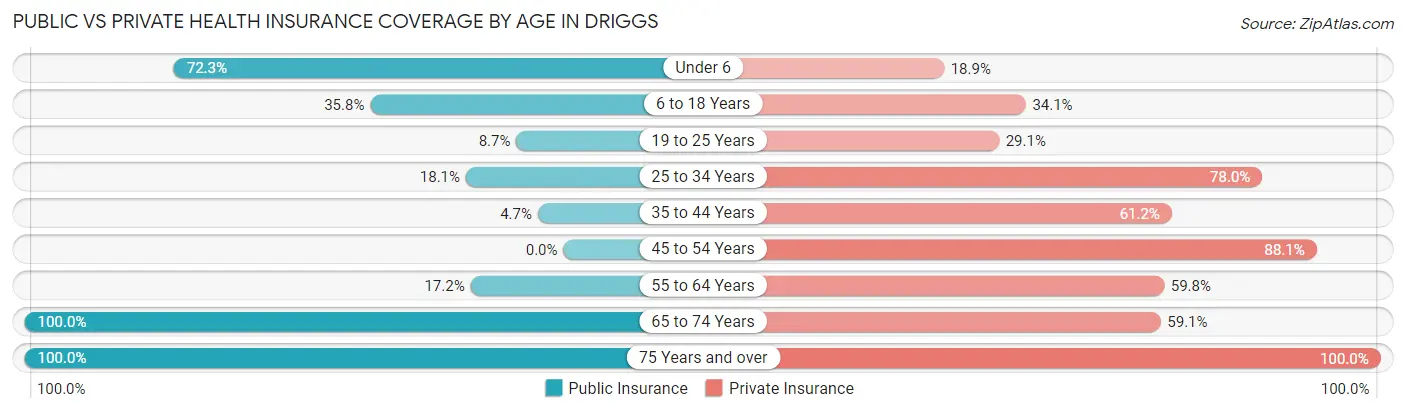
| Age Bracket | Public Insurance | Private Insurance |
| Under 6 | 107 (72.3%) | 28 (18.9%) |
| 6 to 18 Years | 205 (35.8%) | 195 (34.1%) |
| 19 to 25 Years | 9 (8.7%) | 30 (29.1%) |
| 25 to 34 Years | 42 (18.1%) | 181 (78.0%) |
| 35 to 44 Years | 27 (4.7%) | 349 (61.2%) |
| 45 to 54 Years | 0 (0.0%) | 356 (88.1%) |
| 55 to 64 Years | 45 (17.2%) | 156 (59.8%) |
| 65 to 74 Years | 230 (100.0%) | 136 (59.1%) |
| 75 Years and over | 28 (100.0%) | 28 (100.0%) |
| Total | 693 (27.2%) | 1,459 (57.3%) |
Disability Status by Sex by Age in Driggs
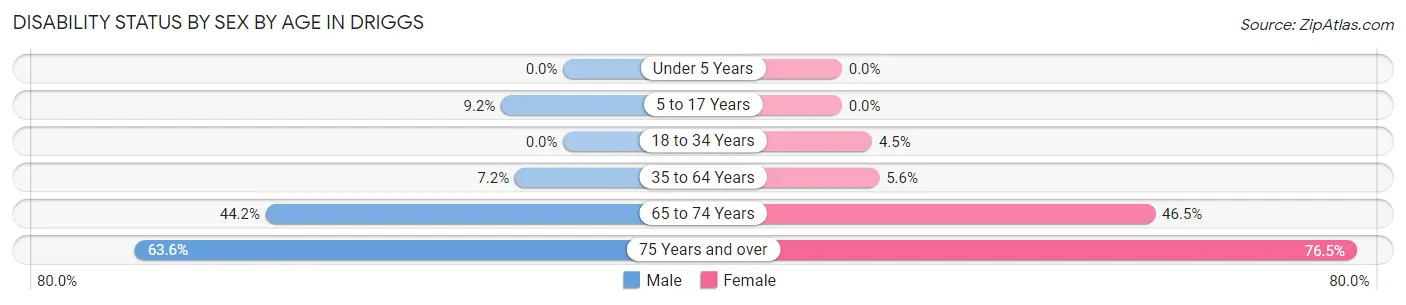
| Age Bracket | Male | Female |
| Under 5 Years | 0 (0.0%) | 0 (0.0%) |
| 5 to 17 Years | 22 (9.2%) | 0 (0.0%) |
| 18 to 34 Years | 0 (0.0%) | 11 (4.5%) |
| 35 to 64 Years | 46 (7.2%) | 33 (5.6%) |
| 65 to 74 Years | 38 (44.2%) | 67 (46.5%) |
| 75 Years and over | 7 (63.6%) | 13 (76.5%) |
Disability Class by Sex by Age in Driggs
Disability Class: Hearing Difficulty
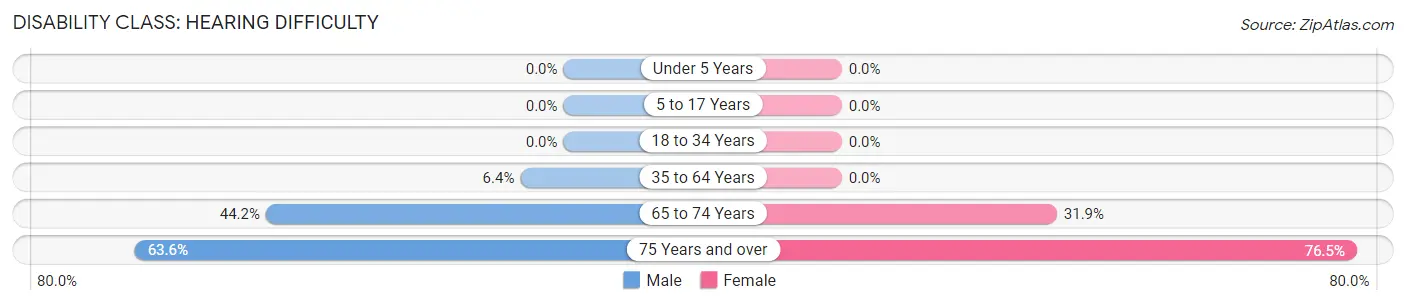
| Age Bracket | Male | Female |
| Under 5 Years | 0 (0.0%) | 0 (0.0%) |
| 5 to 17 Years | 0 (0.0%) | 0 (0.0%) |
| 18 to 34 Years | 0 (0.0%) | 0 (0.0%) |
| 35 to 64 Years | 41 (6.4%) | 0 (0.0%) |
| 65 to 74 Years | 38 (44.2%) | 46 (31.9%) |
| 75 Years and over | 7 (63.6%) | 13 (76.5%) |
Disability Class: Vision Difficulty
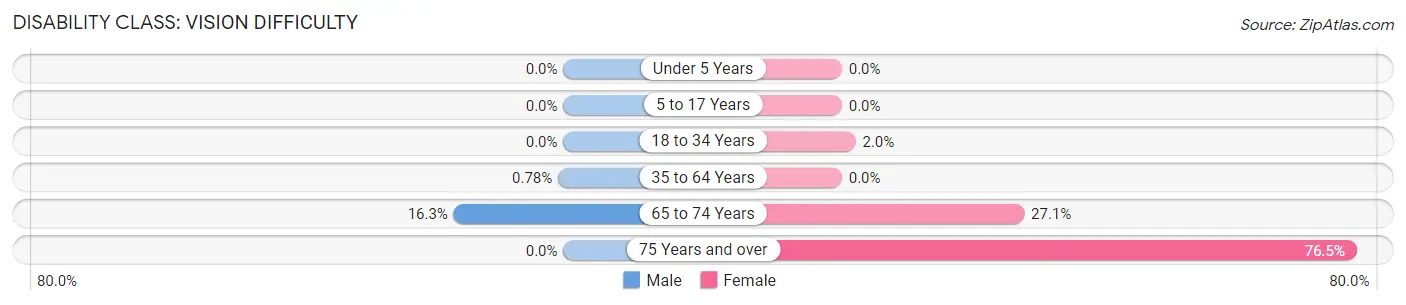
| Age Bracket | Male | Female |
| Under 5 Years | 0 (0.0%) | 0 (0.0%) |
| 5 to 17 Years | 0 (0.0%) | 0 (0.0%) |
| 18 to 34 Years | 0 (0.0%) | 5 (2.0%) |
| 35 to 64 Years | 5 (0.8%) | 0 (0.0%) |
| 65 to 74 Years | 14 (16.3%) | 39 (27.1%) |
| 75 Years and over | 0 (0.0%) | 13 (76.5%) |
Disability Class: Cognitive Difficulty
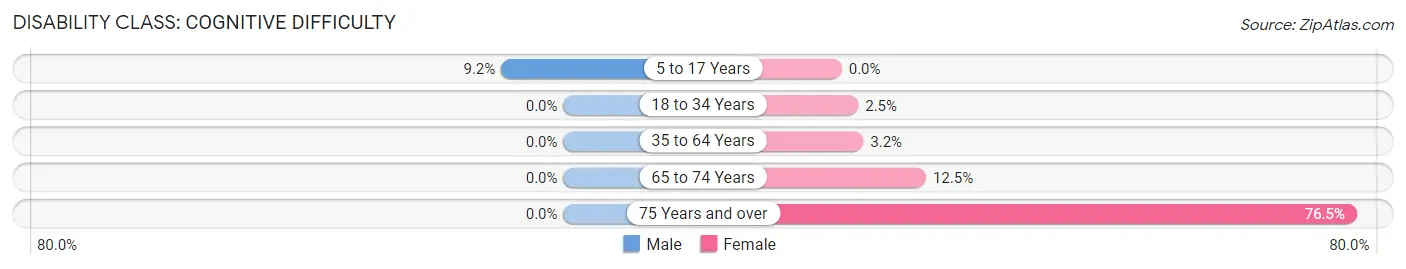
| Age Bracket | Male | Female |
| 5 to 17 Years | 22 (9.2%) | 0 (0.0%) |
| 18 to 34 Years | 0 (0.0%) | 6 (2.5%) |
| 35 to 64 Years | 0 (0.0%) | 19 (3.2%) |
| 65 to 74 Years | 0 (0.0%) | 18 (12.5%) |
| 75 Years and over | 0 (0.0%) | 13 (76.5%) |
Disability Class: Ambulatory Difficulty
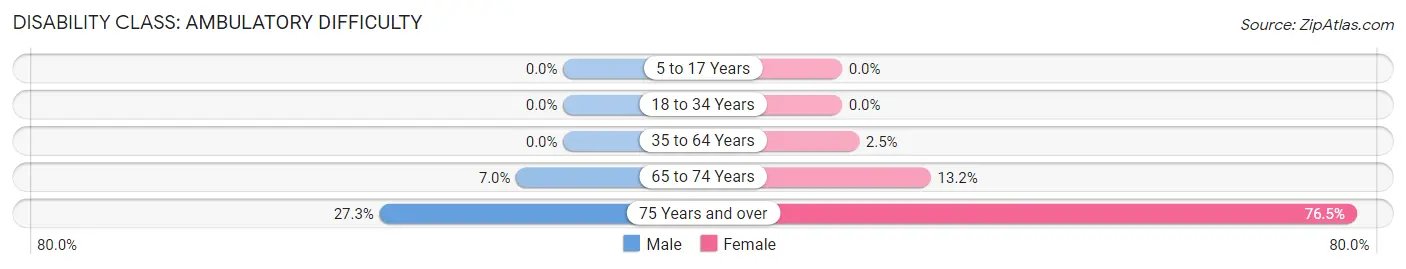
| Age Bracket | Male | Female |
| 5 to 17 Years | 0 (0.0%) | 0 (0.0%) |
| 18 to 34 Years | 0 (0.0%) | 0 (0.0%) |
| 35 to 64 Years | 0 (0.0%) | 15 (2.5%) |
| 65 to 74 Years | 6 (7.0%) | 19 (13.2%) |
| 75 Years and over | 3 (27.3%) | 13 (76.5%) |
Disability Class: Self-Care Difficulty
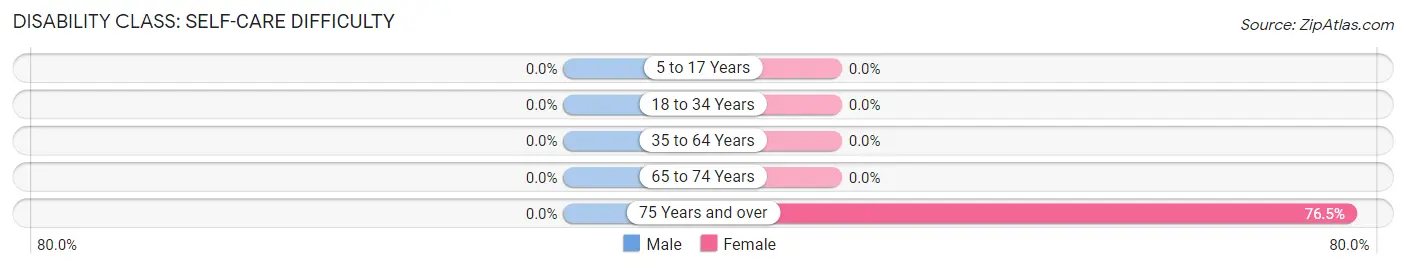
| Age Bracket | Male | Female |
| 5 to 17 Years | 0 (0.0%) | 0 (0.0%) |
| 18 to 34 Years | 0 (0.0%) | 0 (0.0%) |
| 35 to 64 Years | 0 (0.0%) | 0 (0.0%) |
| 65 to 74 Years | 0 (0.0%) | 0 (0.0%) |
| 75 Years and over | 0 (0.0%) | 13 (76.5%) |
Technology Access in Driggs
Computing Device Access in Driggs
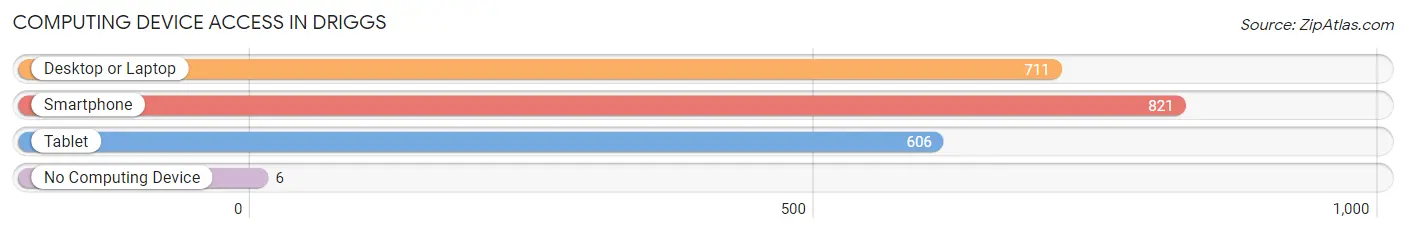
| Device Type | # Households | % Households |
| Desktop or Laptop | 711 | 83.8% |
| Smartphone | 821 | 96.7% |
| Tablet | 606 | 71.4% |
| No Computing Device | 6 | 0.7% |
| Total | 849 | 100.0% |
Internet Access in Driggs
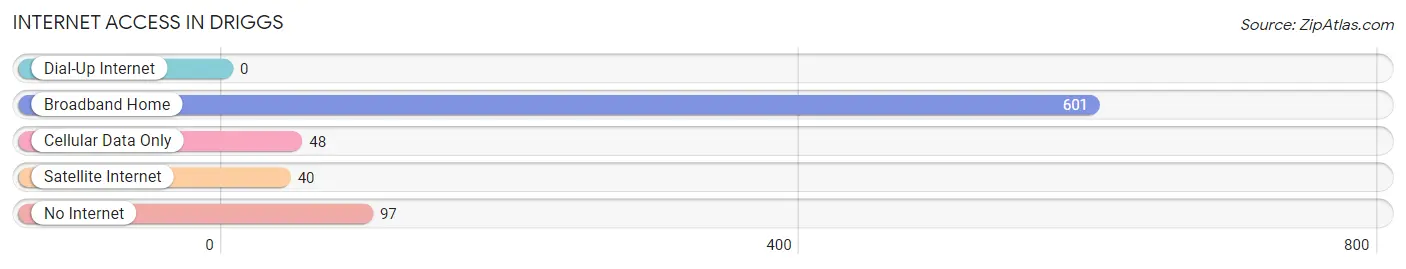
| Internet Type | # Households | % Households |
| Dial-Up Internet | 0 | 0.0% |
| Broadband Home | 601 | 70.8% |
| Cellular Data Only | 48 | 5.7% |
| Satellite Internet | 40 | 4.7% |
| No Internet | 97 | 11.4% |
| Total | 849 | 100.0% |
Driggs Summary
Driggs is a small city located in the Teton Valley of eastern Idaho, near the Wyoming border. It is the county seat of Teton County and is part of the Jackson, WY-ID Metropolitan Statistical Area. The city has a population of 1,660 as of the 2010 census, and is the largest city in the valley.
History
The area that is now Driggs was first settled in the late 1800s by Mormon pioneers. The city was originally known as “Teton”, after the nearby Teton Range, but was later renamed “Driggs” after a local rancher, William Driggs. The city was officially incorporated in 1907.
In the early 1900s, Driggs was a thriving agricultural community, with many farms and ranches in the area. The city was also home to a number of businesses, including a bank, a hotel, a newspaper, and a movie theater.
Geography
Driggs is located in the Teton Valley of eastern Idaho, near the Wyoming border. The city is situated at an elevation of 6,000 feet, and is surrounded by the Teton Range to the east and the Big Hole Mountains to the west. The city is located approximately 30 miles south of Jackson, Wyoming, and is accessible via US Highway 26.
Economy
Driggs is a small, rural community with a largely agricultural economy. The city is home to a number of farms and ranches, as well as a few small businesses. The city is also home to a number of tourist attractions, including the Teton Valley Historical Museum and the Teton Valley Ski Resort.
Demographics
As of the 2010 census, the population of Driggs was 1,660. The racial makeup of the city was 95.2% White, 0.7% Native American, 0.3% Asian, 0.2% African American, 0.1% Pacific Islander, and 3.5% from other races. The median household income was $41,250, and the median family income was $50,000. The per capita income was $20,945.
Conclusion
Driggs is a small city located in the Teton Valley of eastern Idaho, near the Wyoming border. It is the county seat of Teton County and is part of the Jackson, WY-ID Metropolitan Statistical Area. The city has a population of 1,660 as of the 2010 census, and is the largest city in the valley. Driggs has a largely agricultural economy, with many farms and ranches in the area, as well as a few small businesses. The city is also home to a number of tourist attractions, including the Teton Valley Historical Museum and the Teton Valley Ski Resort.
Common Questions
What is Per Capita Income in Driggs?
Per Capita income in Driggs is $37,655.
What is the Median Family Income in Driggs?
Median Family Income in Driggs is $91,115.
What is the Median Household income in Driggs?
Median Household Income in Driggs is $86,587.
What is Income or Wage Gap in Driggs?
Income or Wage Gap in Driggs is 26.4%.
Women in Driggs earn 73.6 cents for every dollar earned by a man.
What is Inequality or Gini Index in Driggs?
Inequality or Gini Index in Driggs is 0.43.
What is the Total Population of Driggs?
Total Population of Driggs is 2,548.
What is the Total Male Population of Driggs?
Total Male Population of Driggs is 1,117.
What is the Total Female Population of Driggs?
Total Female Population of Driggs is 1,431.
What is the Ratio of Males per 100 Females in Driggs?
There are 78.06 Males per 100 Females in Driggs.
What is the Ratio of Females per 100 Males in Driggs?
There are 128.11 Females per 100 Males in Driggs.
What is the Median Population Age in Driggs?
Median Population Age in Driggs is 38.5 Years.
What is the Average Family Size in Driggs
Average Family Size in Driggs is 3.4 People.
What is the Average Household Size in Driggs
Average Household Size in Driggs is 3.0 People.
How Large is the Labor Force in Driggs?
There are 1,539 People in the Labor Forcein in Driggs.
What is the Percentage of People in the Labor Force in Driggs?
76.3% of People are in the Labor Force in Driggs.
What is the Unemployment Rate in Driggs?
Unemployment Rate in Driggs is 0.7%.