Cascade, ID Map & Demographics
Cascade Map
Cascade Overview
$21,003
PER CAPITA INCOME
$60,962
AVG FAMILY INCOME
$48,700
AVG HOUSEHOLD INCOME
57.7%
WAGE / INCOME GAP [ % ]
42.3¢/ $1
WAGE / INCOME GAP [ $ ]
0.50
INEQUALITY / GINI INDEX
1,197
TOTAL POPULATION
588
MALE POPULATION
609
FEMALE POPULATION
96.55
MALES / 100 FEMALES
103.57
FEMALES / 100 MALES
53.4
MEDIAN AGE
4.0
AVG FAMILY SIZE
3.1
AVG HOUSEHOLD SIZE
234
LABOR FORCE [ PEOPLE ]
23.1%
PERCENT IN LABOR FORCE
4.7%
UNEMPLOYMENT RATE
Cascade Zip Codes
Cascade Area Codes
Income in Cascade
Income Overview in Cascade
Per Capita Income in Cascade is $21,003, while median incomes of families and households are $60,962 and $48,700 respectively.
| Characteristic | Number | Measure |
| Per Capita Income | 1,197 | $21,003 |
| Median Family Income | 210 | $60,962 |
| Mean Family Income | 210 | $87,989 |
| Median Household Income | 358 | $48,700 |
| Mean Household Income | 358 | $61,630 |
| Income Deficit | 210 | $0 |
| Wage / Income Gap (%) | 1,197 | 57.71% |
| Wage / Income Gap ($) | 1,197 | 42.29¢ per $1 |
| Gini / Inequality Index | 1,197 | 0.50 |
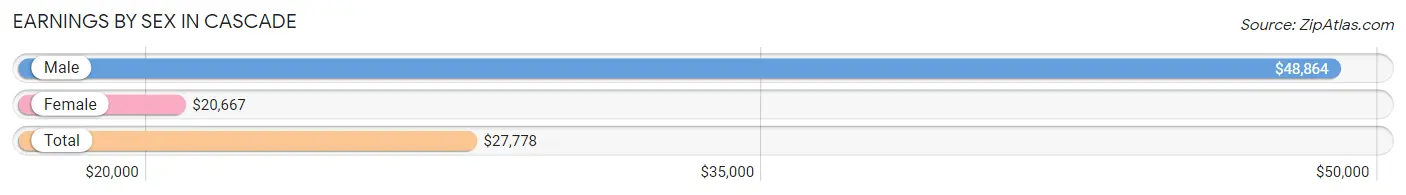
Earnings by Sex in Cascade
Average Earnings in Cascade are $27,778, $48,864 for men and $20,667 for women, a difference of 57.7%.
| Sex | Number | Average Earnings |
| Male | 166 (58.0%) | $48,864 |
| Female | 120 (42.0%) | $20,667 |
| Total | 286 (100.0%) | $27,778 |
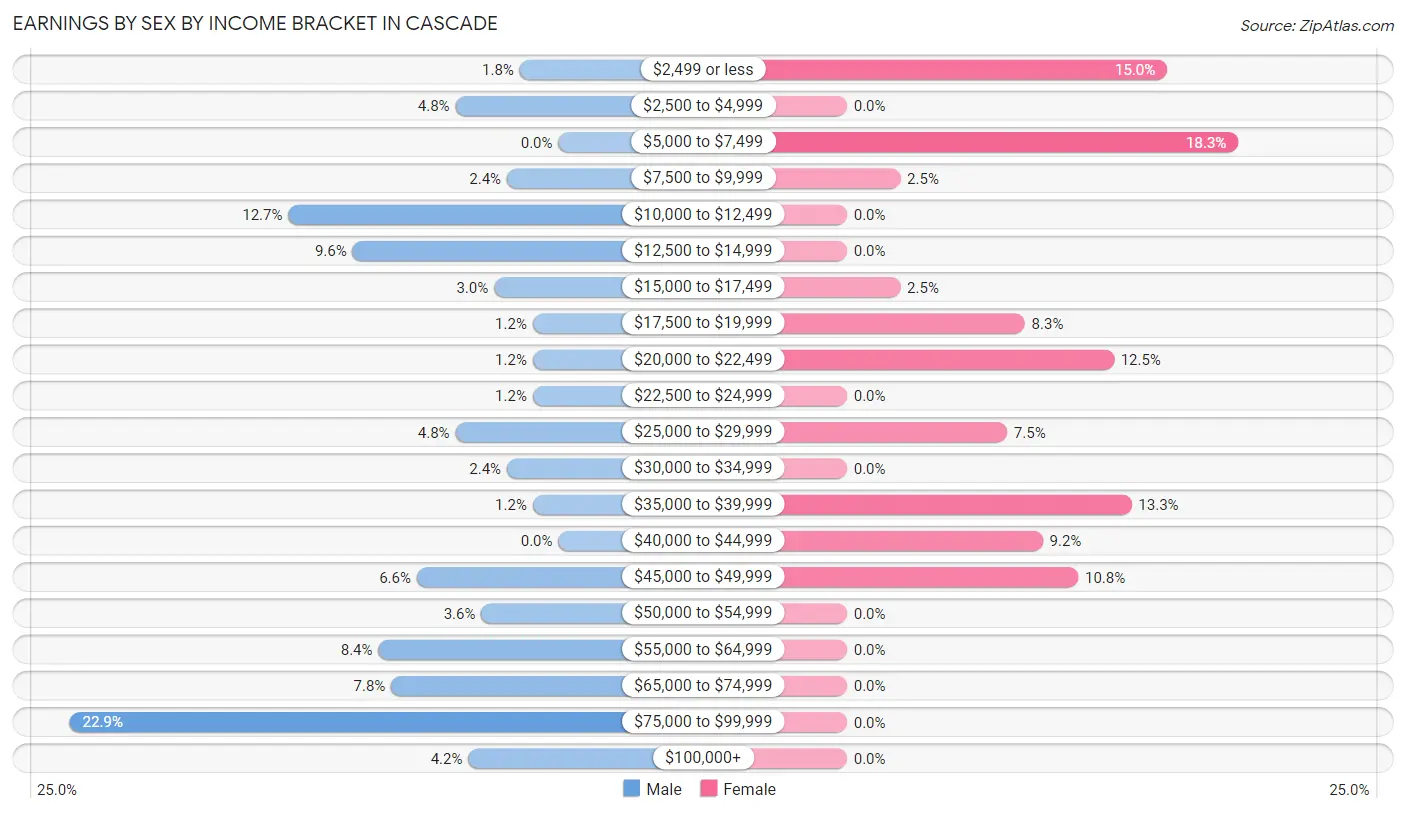
Earnings by Sex by Income Bracket in Cascade
The most common earnings brackets in Cascade are $75,000 to $99,999 for men (38 | 22.9%) and $5,000 to $7,499 for women (22 | 18.3%).
| Income | Male | Female |
| $2,499 or less | 3 (1.8%) | 18 (15.0%) |
| $2,500 to $4,999 | 8 (4.8%) | 0 (0.0%) |
| $5,000 to $7,499 | 0 (0.0%) | 22 (18.3%) |
| $7,500 to $9,999 | 4 (2.4%) | 3 (2.5%) |
| $10,000 to $12,499 | 21 (12.7%) | 0 (0.0%) |
| $12,500 to $14,999 | 16 (9.6%) | 0 (0.0%) |
| $15,000 to $17,499 | 5 (3.0%) | 3 (2.5%) |
| $17,500 to $19,999 | 2 (1.2%) | 10 (8.3%) |
| $20,000 to $22,499 | 2 (1.2%) | 15 (12.5%) |
| $22,500 to $24,999 | 2 (1.2%) | 0 (0.0%) |
| $25,000 to $29,999 | 8 (4.8%) | 9 (7.5%) |
| $30,000 to $34,999 | 4 (2.4%) | 0 (0.0%) |
| $35,000 to $39,999 | 2 (1.2%) | 16 (13.3%) |
| $40,000 to $44,999 | 0 (0.0%) | 11 (9.2%) |
| $45,000 to $49,999 | 11 (6.6%) | 13 (10.8%) |
| $50,000 to $54,999 | 6 (3.6%) | 0 (0.0%) |
| $55,000 to $64,999 | 14 (8.4%) | 0 (0.0%) |
| $65,000 to $74,999 | 13 (7.8%) | 0 (0.0%) |
| $75,000 to $99,999 | 38 (22.9%) | 0 (0.0%) |
| $100,000+ | 7 (4.2%) | 0 (0.0%) |
| Total | 166 (100.0%) | 120 (100.0%) |
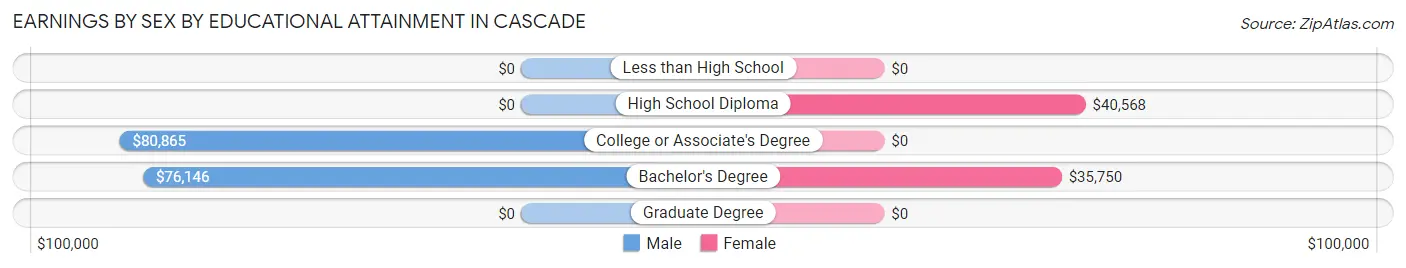
Earnings by Sex by Educational Attainment in Cascade
Average earnings in Cascade are $54,375 for men and $27,778 for women, a difference of 48.9%. Men with an educational attainment of college or associate's degree enjoy the highest average annual earnings of $80,865, while those with bachelor's degree education earn the least with $76,146. Women with an educational attainment of high school diploma earn the most with the average annual earnings of $40,568, while those with bachelor's degree education have the smallest earnings of $35,750.
| Educational Attainment | Male Income | Female Income |
| Less than High School | - | - |
| High School Diploma | - | - |
| College or Associate's Degree | $80,865 | $0 |
| Bachelor's Degree | $76,146 | $35,750 |
| Graduate Degree | - | - |
| Total | $54,375 | $27,778 |
Family Income in Cascade
Family Income Brackets in Cascade
According to the Cascade family income data, there are 56 families falling into the $35,000 to $49,999 income range, which is the most common income bracket and makes up 26.7% of all families.
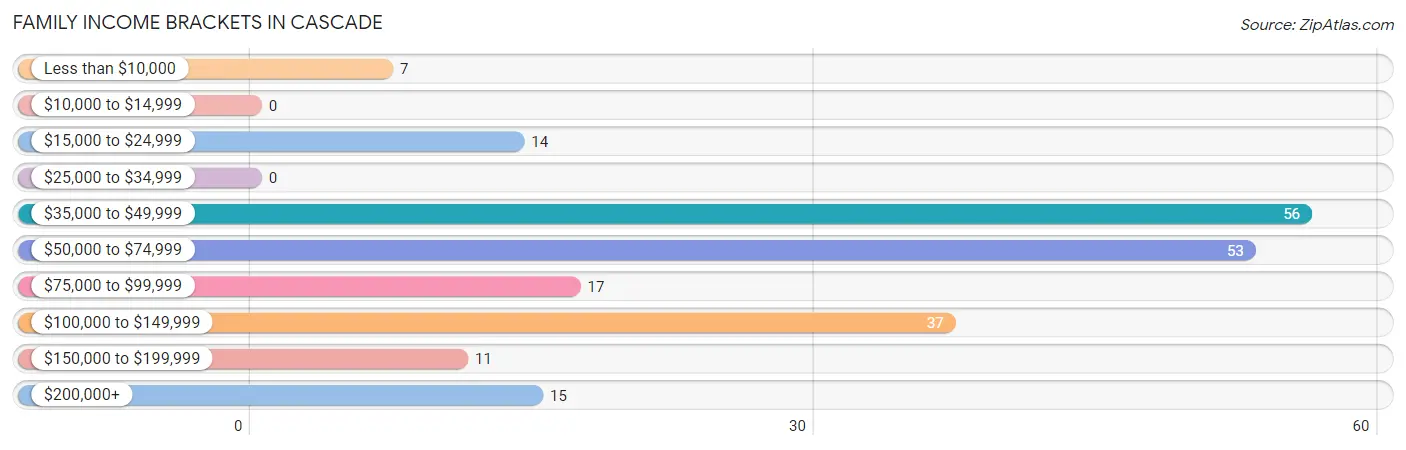
| Income Bracket | # Families | % Families |
| Less than $10,000 | 7 | 3.3% |
| $10,000 to $14,999 | 0 | 0.0% |
| $15,000 to $24,999 | 14 | 6.7% |
| $25,000 to $34,999 | 0 | 0.0% |
| $35,000 to $49,999 | 56 | 26.7% |
| $50,000 to $74,999 | 53 | 25.2% |
| $75,000 to $99,999 | 17 | 8.1% |
| $100,000 to $149,999 | 37 | 17.6% |
| $150,000 to $199,999 | 11 | 5.2% |
| $200,000+ | 15 | 7.1% |
Family Income by Famaliy Size in Cascade
3-person families (35 | 16.7%) account for the highest median family income in Cascade with $60,865 per family, while 2-person families (139 | 66.2%) have the highest median income of $24,988 per family member.
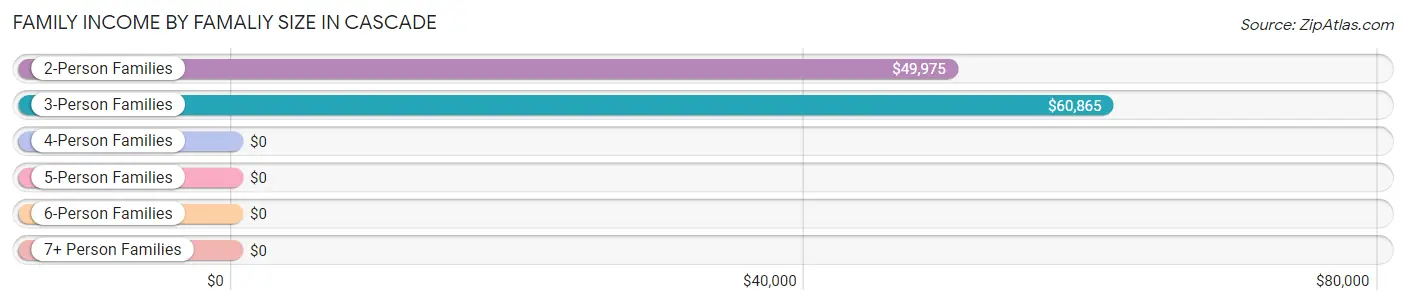
| Income Bracket | # Families | Median Income |
| 2-Person Families | 139 (66.2%) | $49,975 |
| 3-Person Families | 35 (16.7%) | $60,865 |
| 4-Person Families | 11 (5.2%) | $0 |
| 5-Person Families | 7 (3.3%) | $0 |
| 6-Person Families | 9 (4.3%) | $0 |
| 7+ Person Families | 9 (4.3%) | $0 |
| Total | 210 (100.0%) | $60,962 |
Family Income by Number of Earners in Cascade
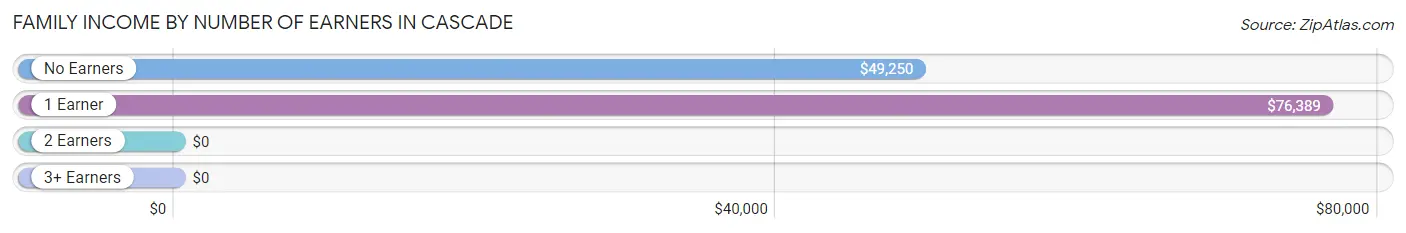
| Number of Earners | # Families | Median Income |
| No Earners | 118 (56.2%) | $49,250 |
| 1 Earner | 44 (20.9%) | $76,389 |
| 2 Earners | 35 (16.7%) | $0 |
| 3+ Earners | 13 (6.2%) | $0 |
| Total | 210 (100.0%) | $60,962 |
Household Income in Cascade
Household Income Brackets in Cascade
With 64 households falling in the category, the $15,000 to $24,999 income range is the most frequent in Cascade, accounting for 17.9% of all households. In contrast, only 11 households (3.1%) fall into the $150,000 to $199,999 income bracket, making it the least populous group.
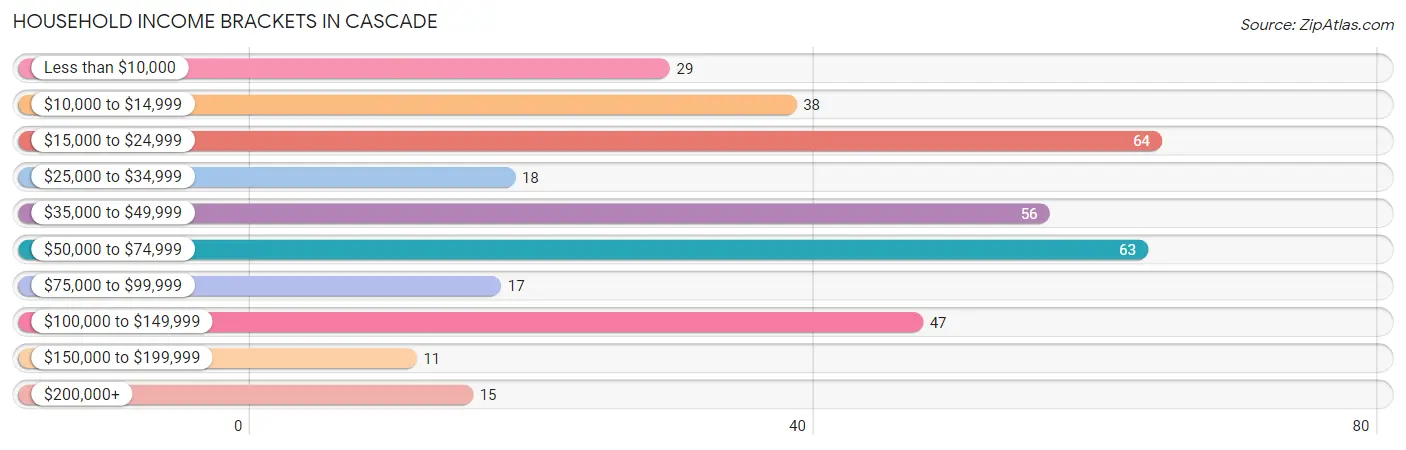
| Income Bracket | # Households | % Households |
| Less than $10,000 | 29 | 8.1% |
| $10,000 to $14,999 | 38 | 10.6% |
| $15,000 to $24,999 | 64 | 17.9% |
| $25,000 to $34,999 | 18 | 5.0% |
| $35,000 to $49,999 | 56 | 15.6% |
| $50,000 to $74,999 | 63 | 17.6% |
| $75,000 to $99,999 | 17 | 4.7% |
| $100,000 to $149,999 | 47 | 13.1% |
| $150,000 to $199,999 | 11 | 3.1% |
| $200,000+ | 15 | 4.2% |
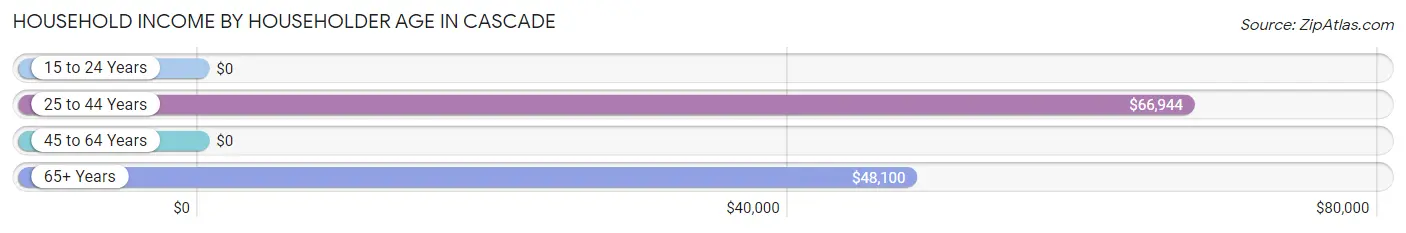
Household Income by Householder Age in Cascade
The median household income in Cascade is $48,700, with the highest median household income of $66,944 found in the 25 to 44 years age bracket for the primary householder. A total of 44 households (12.3%) fall into this category.
| Income Bracket | # Households | Median Income |
| 15 to 24 Years | 0 (0.0%) | $0 |
| 25 to 44 Years | 44 (12.3%) | $66,944 |
| 45 to 64 Years | 118 (33.0%) | $0 |
| 65+ Years | 196 (54.7%) | $48,100 |
| Total | 358 (100.0%) | $48,700 |
Poverty in Cascade
Income Below Poverty by Sex and Age in Cascade
With 29.7% poverty level for males and 29.4% for females among the residents of Cascade, 45 to 54 year old males and 18 to 24 year old females are the most vulnerable to poverty, with 65 males (69.9%) and 23 females (100.0%) in their respective age groups living below the poverty level.
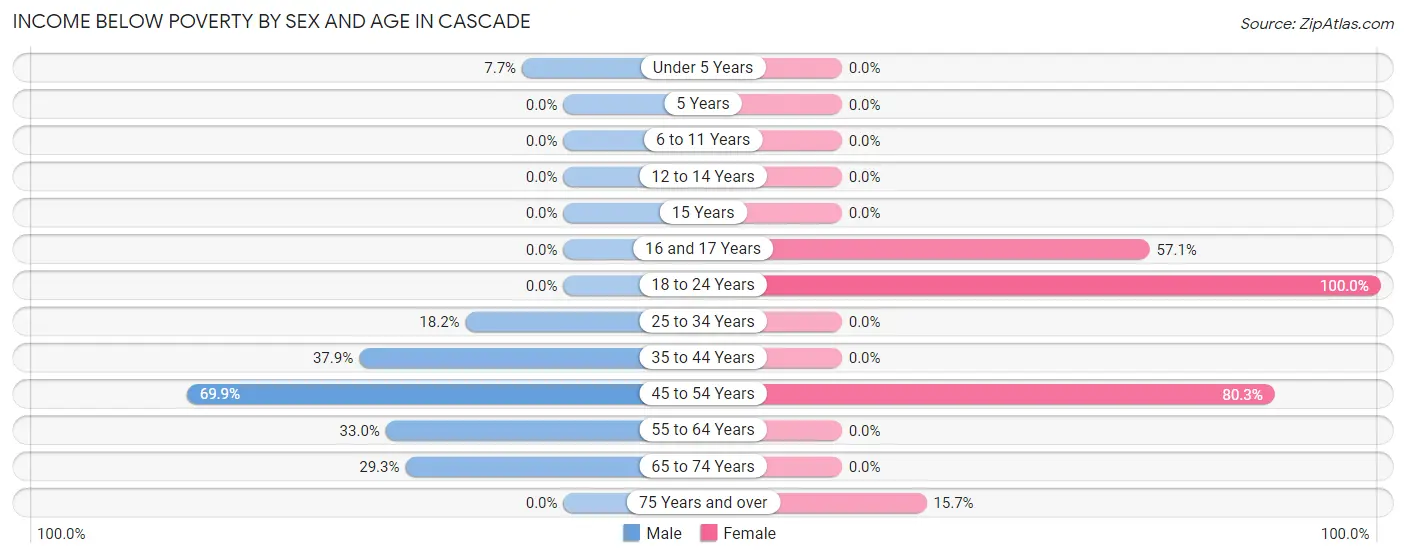
| Age Bracket | Male | Female |
| Under 5 Years | 4 (7.7%) | 0 (0.0%) |
| 5 Years | 0 (0.0%) | 0 (0.0%) |
| 6 to 11 Years | 0 (0.0%) | 0 (0.0%) |
| 12 to 14 Years | 0 (0.0%) | 0 (0.0%) |
| 15 Years | 0 (0.0%) | 0 (0.0%) |
| 16 and 17 Years | 0 (0.0%) | 24 (57.1%) |
| 18 to 24 Years | 0 (0.0%) | 23 (100.0%) |
| 25 to 34 Years | 2 (18.2%) | 0 (0.0%) |
| 35 to 44 Years | 11 (37.9%) | 0 (0.0%) |
| 45 to 54 Years | 65 (69.9%) | 98 (80.3%) |
| 55 to 64 Years | 31 (33.0%) | 0 (0.0%) |
| 65 to 74 Years | 49 (29.3%) | 0 (0.0%) |
| 75 Years and over | 0 (0.0%) | 22 (15.7%) |
| Total | 162 (29.7%) | 167 (29.4%) |
Income Above Poverty by Sex and Age in Cascade
According to the poverty statistics in Cascade, males aged 5 years and females aged under 5 years are the age groups that are most secure financially, with 100.0% of males and 100.0% of females in these age groups living above the poverty line.
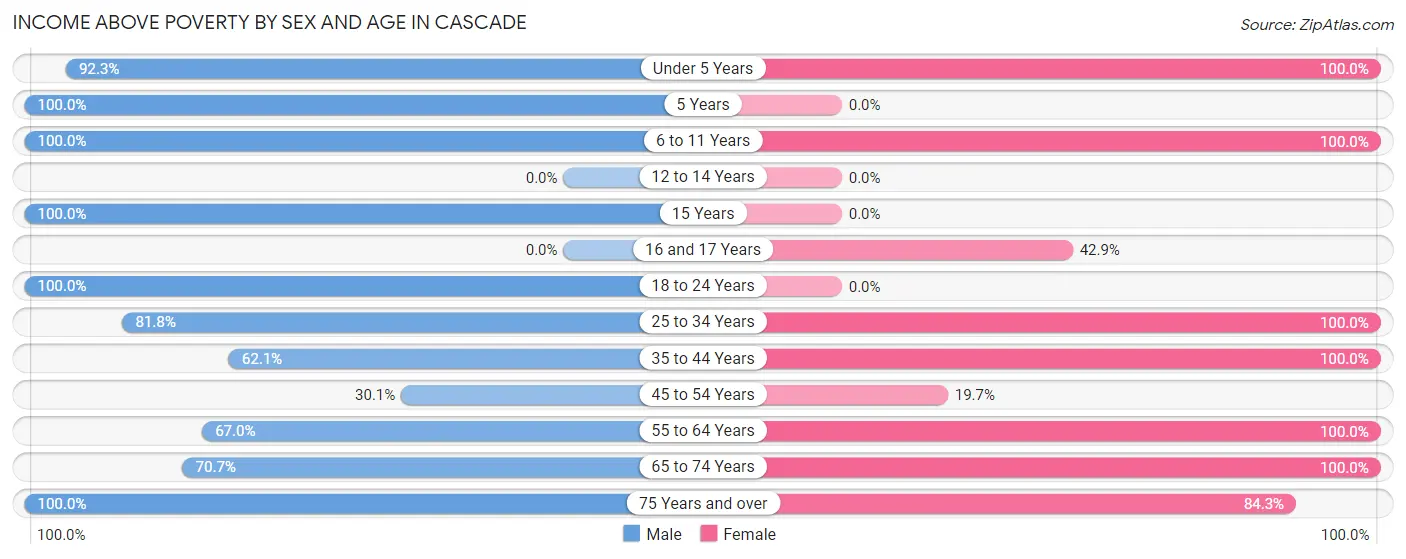
| Age Bracket | Male | Female |
| Under 5 Years | 48 (92.3%) | 23 (100.0%) |
| 5 Years | 11 (100.0%) | 0 (0.0%) |
| 6 to 11 Years | 25 (100.0%) | 38 (100.0%) |
| 12 to 14 Years | 0 (0.0%) | 0 (0.0%) |
| 15 Years | 25 (100.0%) | 0 (0.0%) |
| 16 and 17 Years | 0 (0.0%) | 18 (42.9%) |
| 18 to 24 Years | 14 (100.0%) | 0 (0.0%) |
| 25 to 34 Years | 9 (81.8%) | 19 (100.0%) |
| 35 to 44 Years | 18 (62.1%) | 32 (100.0%) |
| 45 to 54 Years | 28 (30.1%) | 24 (19.7%) |
| 55 to 64 Years | 63 (67.0%) | 41 (100.0%) |
| 65 to 74 Years | 118 (70.7%) | 87 (100.0%) |
| 75 Years and over | 25 (100.0%) | 118 (84.3%) |
| Total | 384 (70.3%) | 400 (70.6%) |
Income Below Poverty Among Married-Couple Families in Cascade
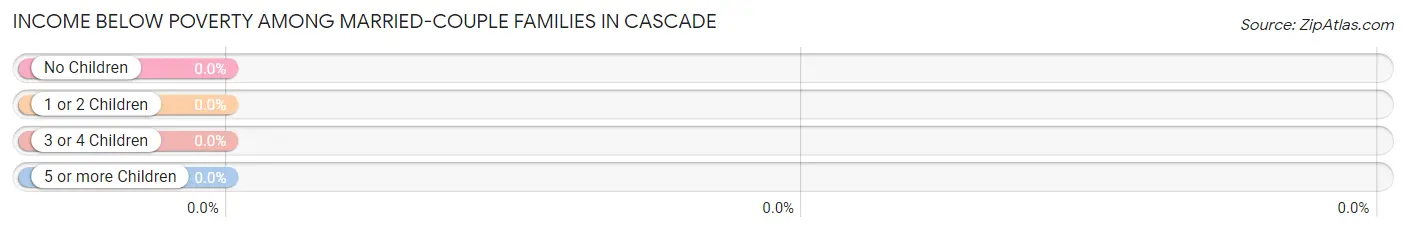
| Children | Above Poverty | Below Poverty |
| No Children | 137 (100.0%) | 0 (0.0%) |
| 1 or 2 Children | 22 (100.0%) | 0 (0.0%) |
| 3 or 4 Children | 9 (100.0%) | 0 (0.0%) |
| 5 or more Children | 9 (100.0%) | 0 (0.0%) |
| Total | 177 (100.0%) | 0 (0.0%) |
Income Below Poverty Among Single-Parent Households in Cascade
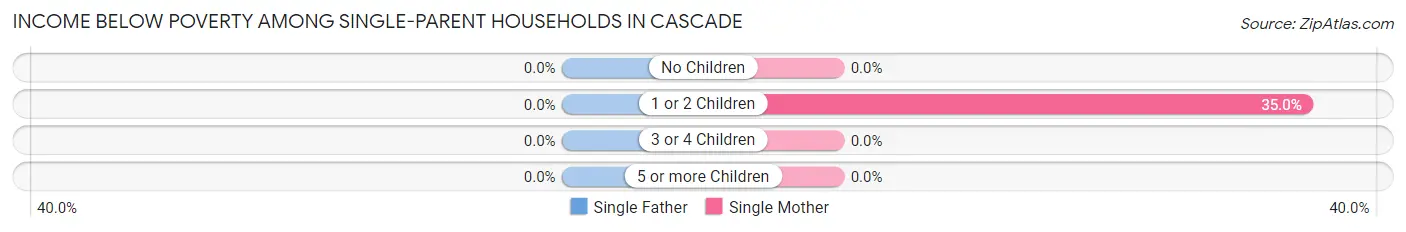
| Children | Single Father | Single Mother |
| No Children | 0 (0.0%) | 0 (0.0%) |
| 1 or 2 Children | 0 (0.0%) | 7 (35.0%) |
| 3 or 4 Children | 0 (0.0%) | 0 (0.0%) |
| 5 or more Children | 0 (0.0%) | 0 (0.0%) |
| Total | 0 (0.0%) | 7 (22.6%) |
Income Below Poverty Among Married-Couple vs Single-Parent Households in Cascade
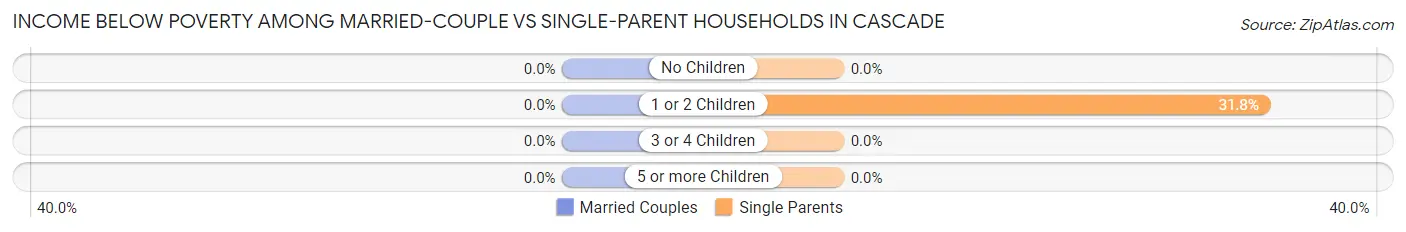
| Children | Married-Couple Families | Single-Parent Households |
| No Children | 0 (0.0%) | 0 (0.0%) |
| 1 or 2 Children | 0 (0.0%) | 7 (31.8%) |
| 3 or 4 Children | 0 (0.0%) | 0 (0.0%) |
| 5 or more Children | 0 (0.0%) | 0 (0.0%) |
| Total | 0 (0.0%) | 7 (21.2%) |
Race in Cascade
The most populous races in Cascade are White / Caucasian (1,156 | 96.6%), Two or more Races (19 | 1.6%), and Hispanic or Latino (17 | 1.4%).
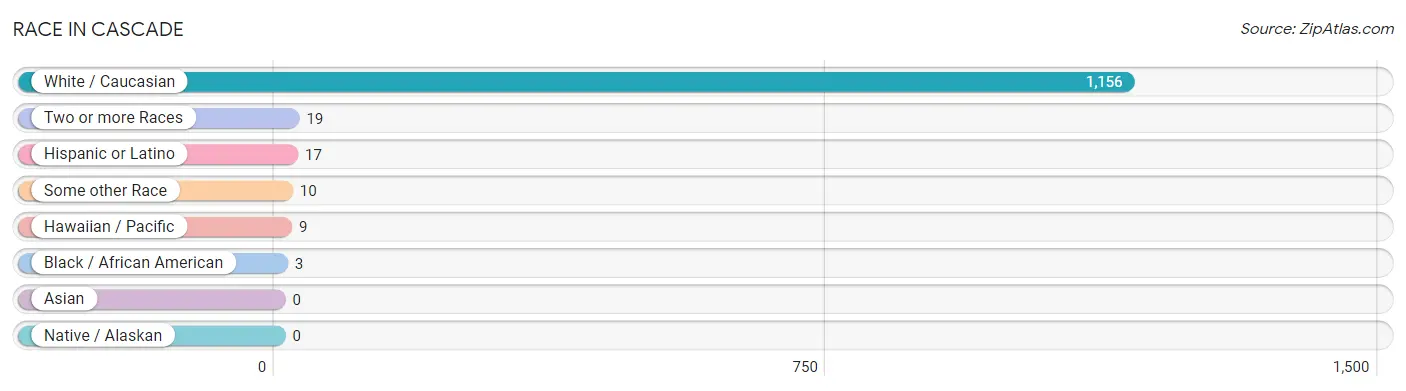
| Race | # Population | % Population |
| Asian | 0 | 0.0% |
| Black / African American | 3 | 0.3% |
| Hawaiian / Pacific | 9 | 0.7% |
| Hispanic or Latino | 17 | 1.4% |
| Native / Alaskan | 0 | 0.0% |
| White / Caucasian | 1,156 | 96.6% |
| Two or more Races | 19 | 1.6% |
| Some other Race | 10 | 0.8% |
| Total | 1,197 | 100.0% |
Ancestry in Cascade
The most populous ancestries reported in Cascade are English (416 | 34.7%), German (163 | 13.6%), Irish (156 | 13.0%), Scottish (140 | 11.7%), and British (72 | 6.0%), together accounting for 79.1% of all Cascade residents.
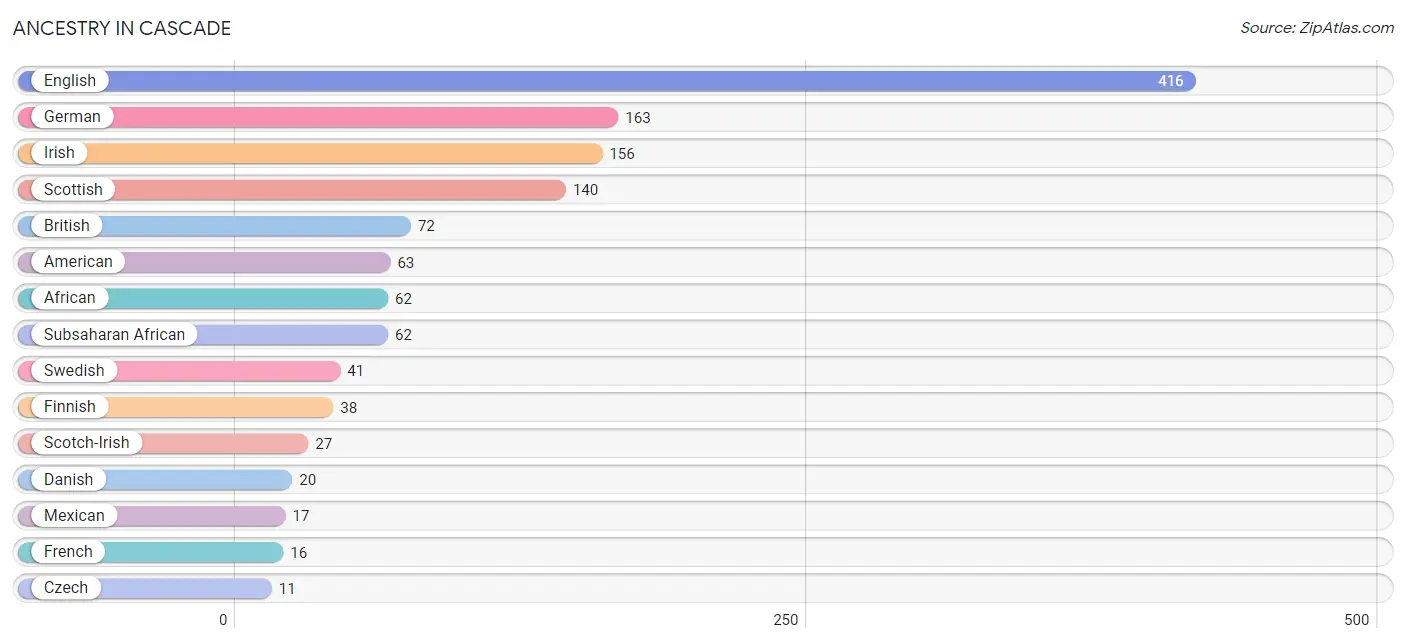
| Ancestry | # Population | % Population |
| African | 62 | 5.2% |
| American | 63 | 5.3% |
| Basque | 2 | 0.2% |
| Belgian | 6 | 0.5% |
| Blackfeet | 2 | 0.2% |
| British | 72 | 6.0% |
| Cherokee | 10 | 0.8% |
| Czech | 11 | 0.9% |
| Danish | 20 | 1.7% |
| Dutch | 8 | 0.7% |
| English | 416 | 34.7% |
| European | 2 | 0.2% |
| Finnish | 38 | 3.2% |
| French | 16 | 1.3% |
| German | 163 | 13.6% |
| Irish | 156 | 13.0% |
| Italian | 10 | 0.8% |
| Mexican | 17 | 1.4% |
| Native Hawaiian | 9 | 0.7% |
| Russian | 10 | 0.8% |
| Scotch-Irish | 27 | 2.3% |
| Scottish | 140 | 11.7% |
| Subsaharan African | 62 | 5.2% |
| Swedish | 41 | 3.4% |
| Welsh | 2 | 0.2% | View All 25 Rows |
Immigrants in Cascade
The most numerous immigrant groups reported in Cascade came from Europe (11 | 0.9%), Germany (11 | 0.9%), Western Europe (11 | 0.9%), Central America (10 | 0.8%), and Latin America (10 | 0.8%), together accounting for 4.4% of all Cascade residents.
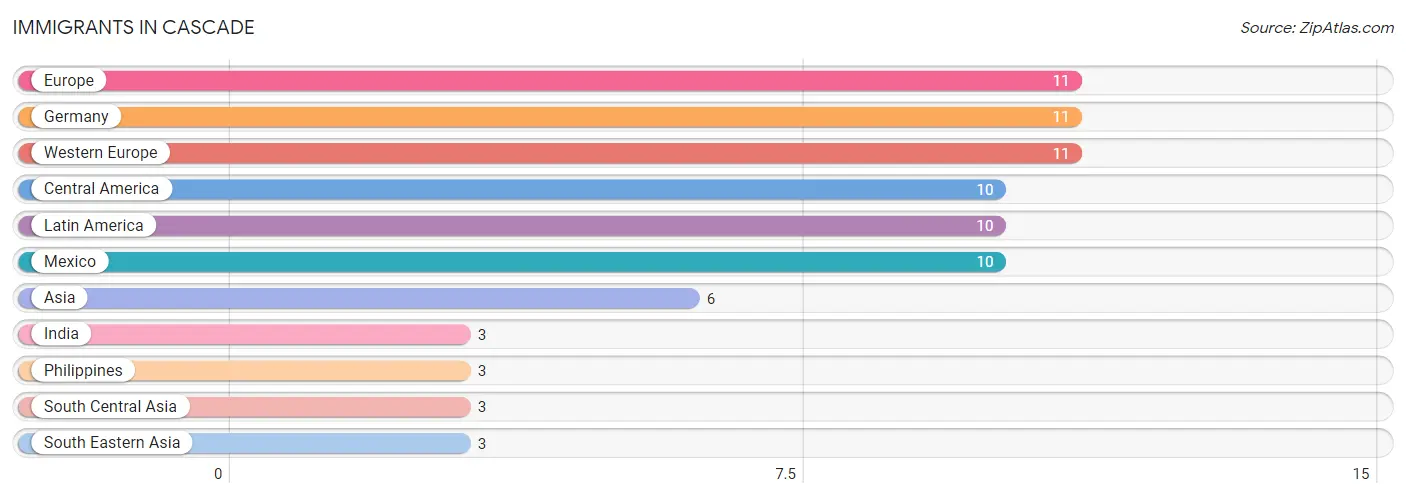
| Immigration Origin | # Population | % Population |
| Asia | 6 | 0.5% |
| Central America | 10 | 0.8% |
| Europe | 11 | 0.9% |
| Germany | 11 | 0.9% |
| India | 3 | 0.3% |
| Latin America | 10 | 0.8% |
| Mexico | 10 | 0.8% |
| Philippines | 3 | 0.3% |
| South Central Asia | 3 | 0.3% |
| South Eastern Asia | 3 | 0.3% |
| Western Europe | 11 | 0.9% | View All 11 Rows |
Sex and Age in Cascade
Sex and Age in Cascade
The most populous age groups in Cascade are 65 to 69 Years (100 | 17.0%) for men and 45 to 49 Years (114 | 18.7%) for women.
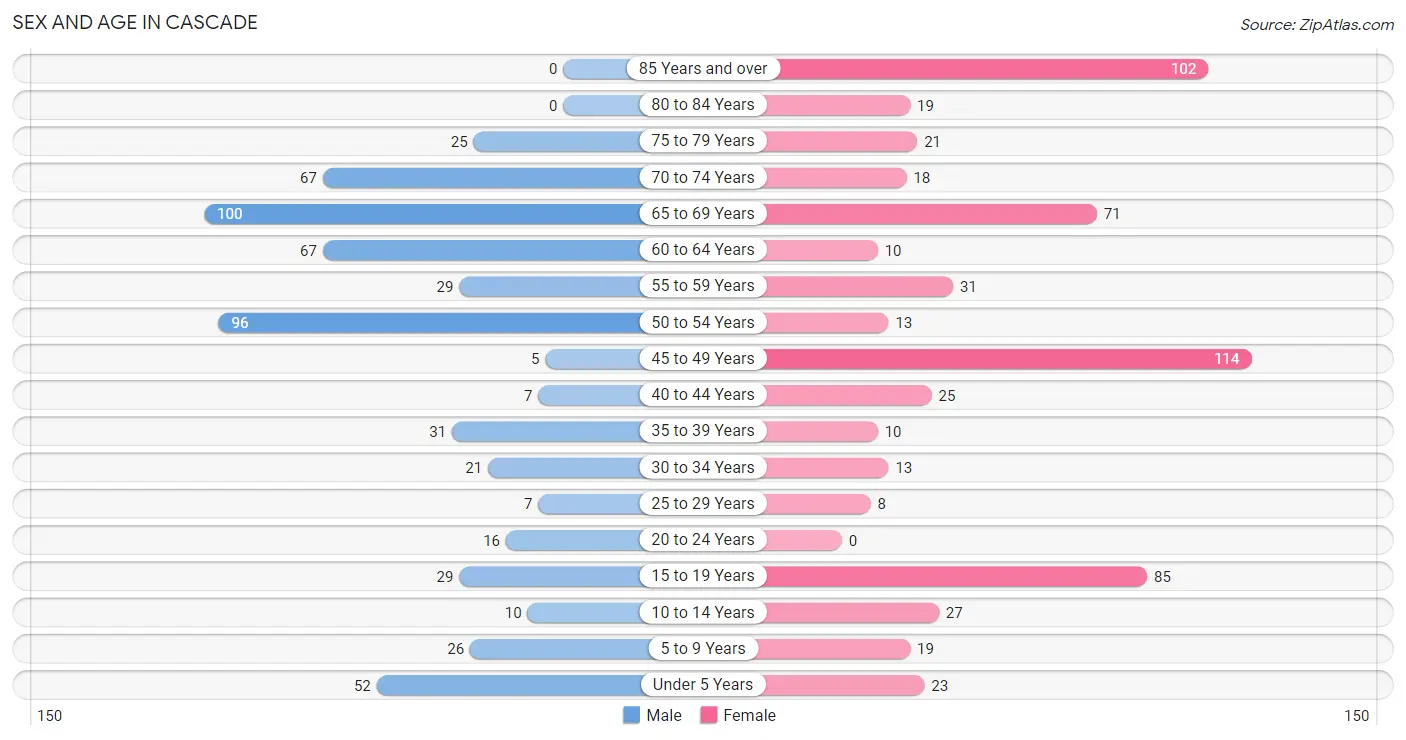
| Age Bracket | Male | Female |
| Under 5 Years | 52 (8.8%) | 23 (3.8%) |
| 5 to 9 Years | 26 (4.4%) | 19 (3.1%) |
| 10 to 14 Years | 10 (1.7%) | 27 (4.4%) |
| 15 to 19 Years | 29 (4.9%) | 85 (14.0%) |
| 20 to 24 Years | 16 (2.7%) | 0 (0.0%) |
| 25 to 29 Years | 7 (1.2%) | 8 (1.3%) |
| 30 to 34 Years | 21 (3.6%) | 13 (2.1%) |
| 35 to 39 Years | 31 (5.3%) | 10 (1.6%) |
| 40 to 44 Years | 7 (1.2%) | 25 (4.1%) |
| 45 to 49 Years | 5 (0.9%) | 114 (18.7%) |
| 50 to 54 Years | 96 (16.3%) | 13 (2.1%) |
| 55 to 59 Years | 29 (4.9%) | 31 (5.1%) |
| 60 to 64 Years | 67 (11.4%) | 10 (1.6%) |
| 65 to 69 Years | 100 (17.0%) | 71 (11.7%) |
| 70 to 74 Years | 67 (11.4%) | 18 (3.0%) |
| 75 to 79 Years | 25 (4.3%) | 21 (3.5%) |
| 80 to 84 Years | 0 (0.0%) | 19 (3.1%) |
| 85 Years and over | 0 (0.0%) | 102 (16.8%) |
| Total | 588 (100.0%) | 609 (100.0%) |
Families and Households in Cascade
Median Family Size in Cascade
The median family size in Cascade is 3.99 persons per family, with single female/mother families (31 | 14.8%) accounting for the largest median family size of 7.55 persons per family. On the other hand, married-couple families (177 | 84.3%) represent the smallest median family size with 3.34 persons per family.
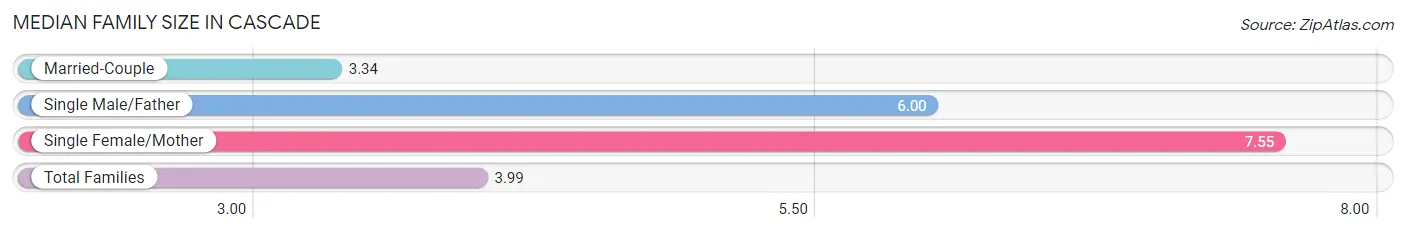
| Family Type | # Families | Family Size |
| Married-Couple | 177 (84.3%) | 3.34 |
| Single Male/Father | 2 (0.9%) | 6.00 |
| Single Female/Mother | 31 (14.8%) | 7.55 |
| Total Families | 210 (100.0%) | 3.99 |
Median Household Size in Cascade
The median household size in Cascade is 3.11 persons per household, with single male/father households (2 | 0.6%) accounting for the largest median household size of 11.5 persons per household. non-family households (148 | 41.3%) represent the smallest median household size with 1.59 persons per household.
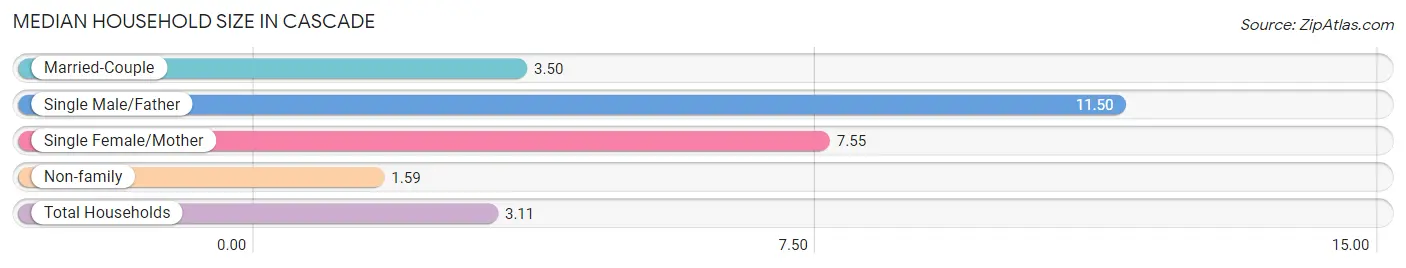
| Household Type | # Households | Household Size |
| Married-Couple | 177 (49.4%) | 3.50 |
| Single Male/Father | 2 (0.6%) | 11.50 |
| Single Female/Mother | 31 (8.7%) | 7.55 |
| Non-family | 148 (41.3%) | 1.59 |
| Total Households | 358 (100.0%) | 3.11 |
Household Size by Marriage Status in Cascade
Out of a total of 358 households in Cascade, 210 (58.7%) are family households, while 148 (41.3%) are nonfamily households. The most numerous type of family households are 2-person households, comprising 138, and the most common type of nonfamily households are 1-person households, comprising 111.
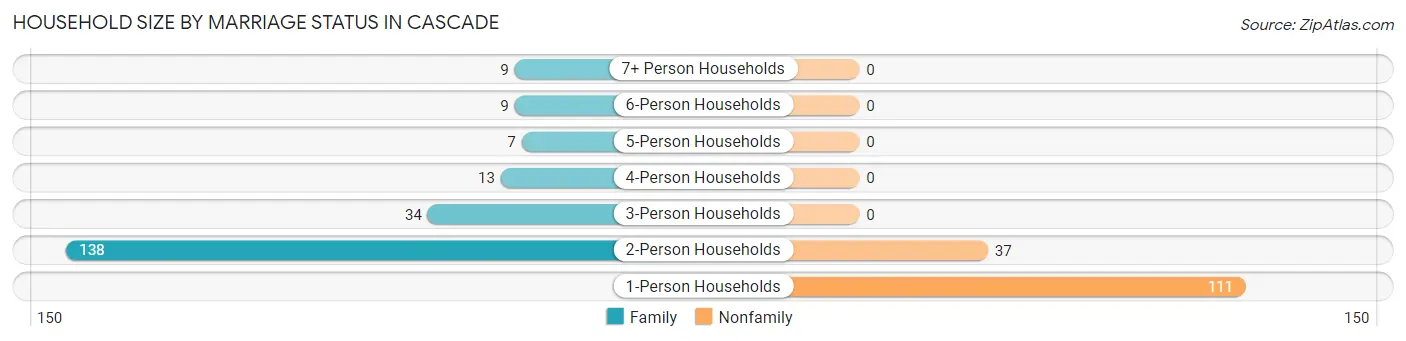
| Household Size | Family Households | Nonfamily Households |
| 1-Person Households | - | 111 (31.0%) |
| 2-Person Households | 138 (38.6%) | 37 (10.3%) |
| 3-Person Households | 34 (9.5%) | 0 (0.0%) |
| 4-Person Households | 13 (3.6%) | 0 (0.0%) |
| 5-Person Households | 7 (2.0%) | 0 (0.0%) |
| 6-Person Households | 9 (2.5%) | 0 (0.0%) |
| 7+ Person Households | 9 (2.5%) | 0 (0.0%) |
| Total | 210 (58.7%) | 148 (41.3%) |
Female Fertility in Cascade
Fertility by Age in Cascade
Average fertility rate in Cascade is 19.0 births per 1,000 women. Women in the age bracket of 20 to 34 years have the highest fertility rate with 238.0 births per 1,000 women. Women in the age bracket of 20 to 34 years acount for 100.0% of all women with births.
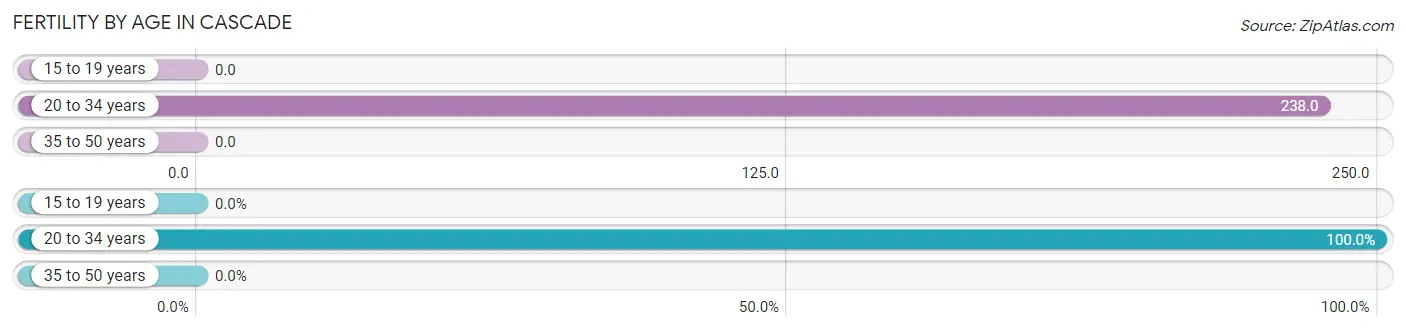
| Age Bracket | Women with Births | Births / 1,000 Women |
| 15 to 19 years | 0 (0.0%) | 0.0 |
| 20 to 34 years | 5 (100.0%) | 238.0 |
| 35 to 50 years | 0 (0.0%) | 0.0 |
| Total | 5 (100.0%) | 19.0 |
Fertility by Age by Marriage Status in Cascade
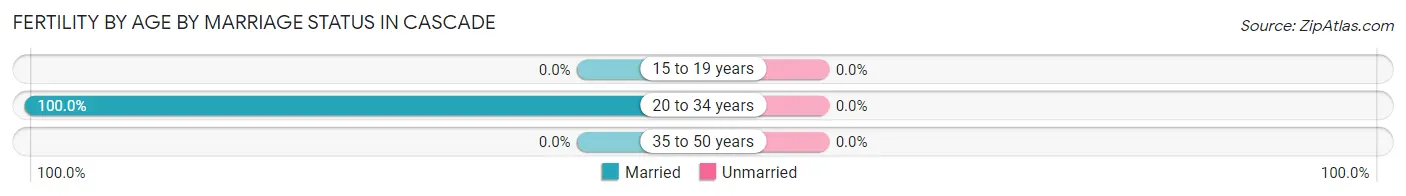
| Age Bracket | Married | Unmarried |
| 15 to 19 years | 0 (0.0%) | 0 (0.0%) |
| 20 to 34 years | 5 (100.0%) | 0 (0.0%) |
| 35 to 50 years | 0 (0.0%) | 0 (0.0%) |
| Total | 5 (100.0%) | 0 (0.0%) |
Fertility by Education in Cascade
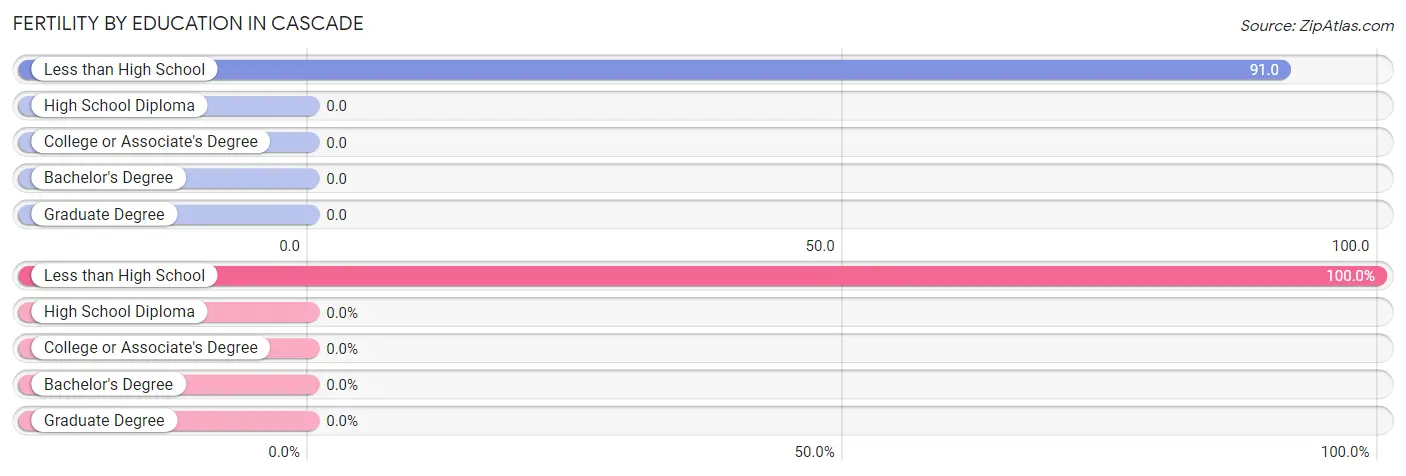
| Educational Attainment | Women with Births | Births / 1,000 Women |
| Less than High School | 5 (100.0%) | 91.0 |
| High School Diploma | 0 (0.0%) | 0.0 |
| College or Associate's Degree | 0 (0.0%) | 0.0 |
| Bachelor's Degree | 0 (0.0%) | 0.0 |
| Graduate Degree | 0 (0.0%) | 0.0 |
| Total | 5 (100.0%) | 19.0 |
Fertility by Education by Marriage Status in Cascade
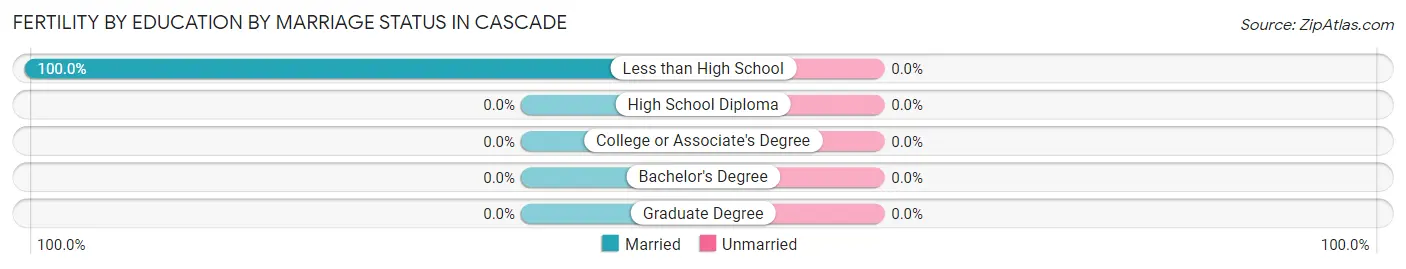
| Educational Attainment | Married | Unmarried |
| Less than High School | 5 (100.0%) | 0 (0.0%) |
| High School Diploma | 0 (0.0%) | 0 (0.0%) |
| College or Associate's Degree | 0 (0.0%) | 0 (0.0%) |
| Bachelor's Degree | 0 (0.0%) | 0 (0.0%) |
| Graduate Degree | 0 (0.0%) | 0 (0.0%) |
| Total | 5 (100.0%) | 0 (0.0%) |
Employment Characteristics in Cascade
Employment by Class of Employer in Cascade
Among the 221 employed individuals in Cascade, private company employees (148 | 67.0%), self-employed (not incorporated) (35 | 15.8%), and local government employees (26 | 11.8%) make up the most common classes of employment.
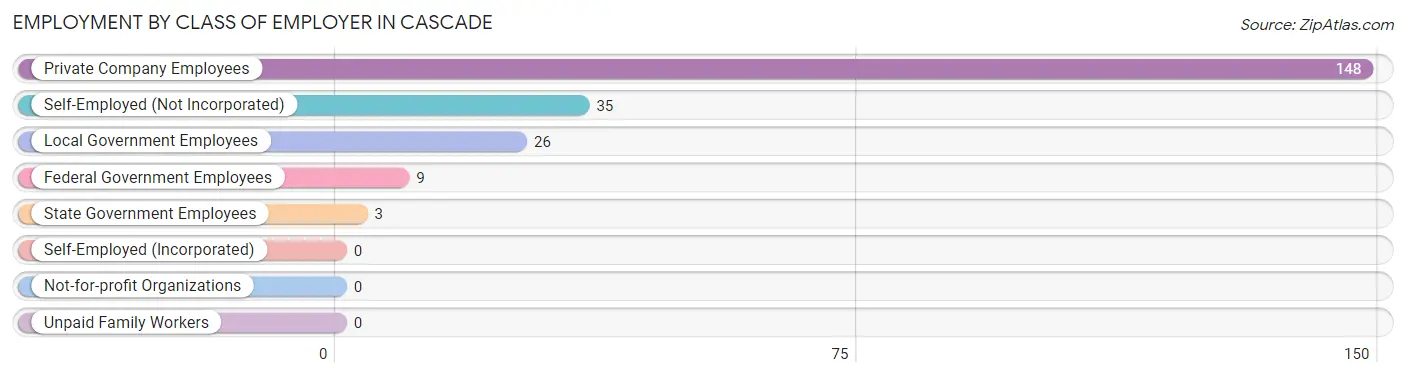
| Employer Class | # Employees | % Employees |
| Private Company Employees | 148 | 67.0% |
| Self-Employed (Incorporated) | 0 | 0.0% |
| Self-Employed (Not Incorporated) | 35 | 15.8% |
| Not-for-profit Organizations | 0 | 0.0% |
| Local Government Employees | 26 | 11.8% |
| State Government Employees | 3 | 1.4% |
| Federal Government Employees | 9 | 4.1% |
| Unpaid Family Workers | 0 | 0.0% |
| Total | 221 | 100.0% |
Employment Status by Age in Cascade
According to the labor force statistics for Cascade, out of the total population over 16 years of age (1,015), 23.1% or 234 individuals are in the labor force, with 4.7% or 11 of them unemployed. The age group with the highest labor force participation rate is 20 to 24 years, with 87.5% or 14 individuals in the labor force. Within the labor force, the 25 to 29 years age range has the highest percentage of unemployed individuals, with 100.0% or 8 of them being unemployed.
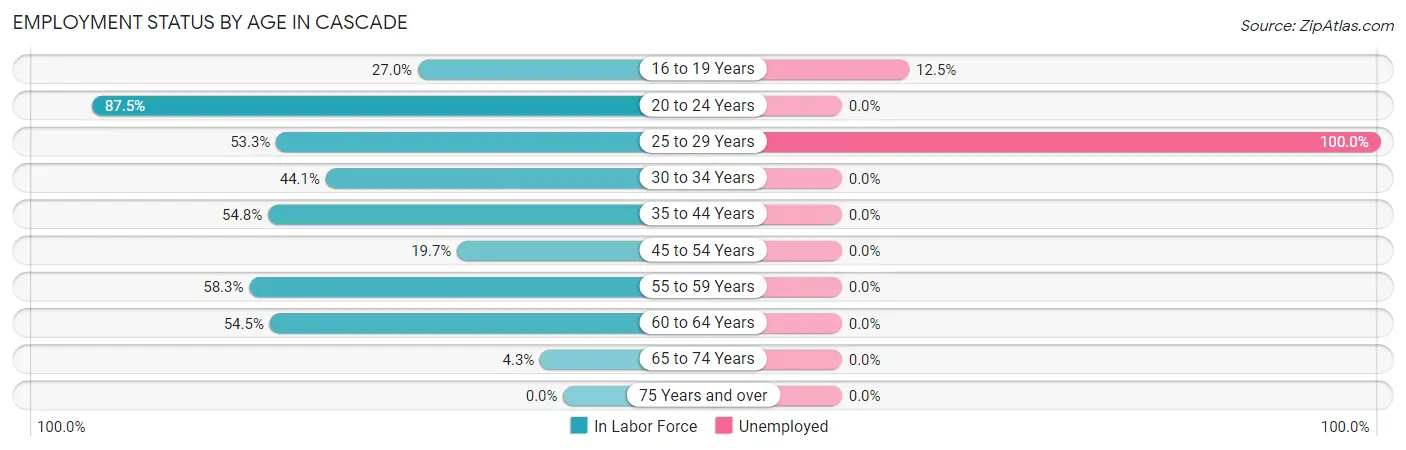
| Age Bracket | In Labor Force | Unemployed |
| 16 to 19 Years | 24 (27.0%) | 3 (12.5%) |
| 20 to 24 Years | 14 (87.5%) | 0 (0.0%) |
| 25 to 29 Years | 8 (53.3%) | 8 (100.0%) |
| 30 to 34 Years | 15 (44.1%) | 0 (0.0%) |
| 35 to 44 Years | 40 (54.8%) | 0 (0.0%) |
| 45 to 54 Years | 45 (19.7%) | 0 (0.0%) |
| 55 to 59 Years | 35 (58.3%) | 0 (0.0%) |
| 60 to 64 Years | 42 (54.5%) | 0 (0.0%) |
| 65 to 74 Years | 11 (4.3%) | 0 (0.0%) |
| 75 Years and over | 0 (0.0%) | 0 (0.0%) |
| Total | 234 (23.1%) | 11 (4.7%) |
Employment Status by Educational Attainment in Cascade
According to labor force statistics for Cascade, 38.0% of individuals (185) out of the total population between 25 and 64 years of age (487) are in the labor force, with 4.3% or 8 of them being unemployed. The group with the highest labor force participation rate are those with the educational attainment of college / associate degree, with 66.9% or 79 individuals in the labor force. Within the labor force, individuals with bachelor's degree or higher education have the highest percentage of unemployment, with 21.1% or 8 of them being unemployed.
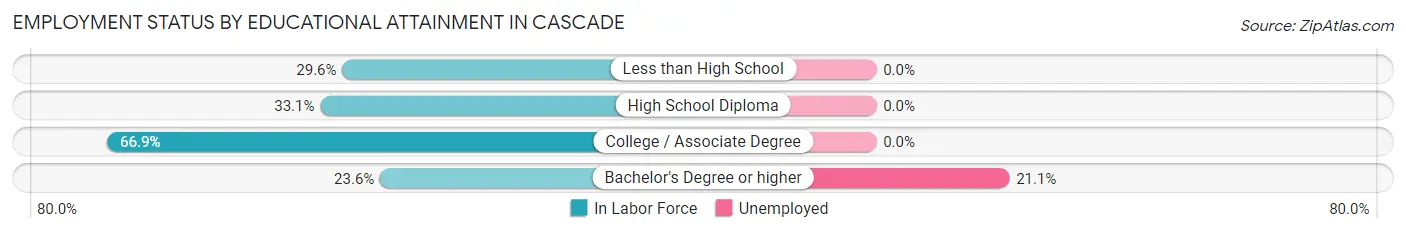
| Educational Attainment | In Labor Force | Unemployed |
| Less than High School | 8 (29.6%) | 0 (0.0%) |
| High School Diploma | 60 (33.1%) | 0 (0.0%) |
| College / Associate Degree | 79 (66.9%) | 0 (0.0%) |
| Bachelor's Degree or higher | 38 (23.6%) | 34 (21.1%) |
| Total | 185 (38.0%) | 21 (4.3%) |
Employment Occupations by Sex in Cascade
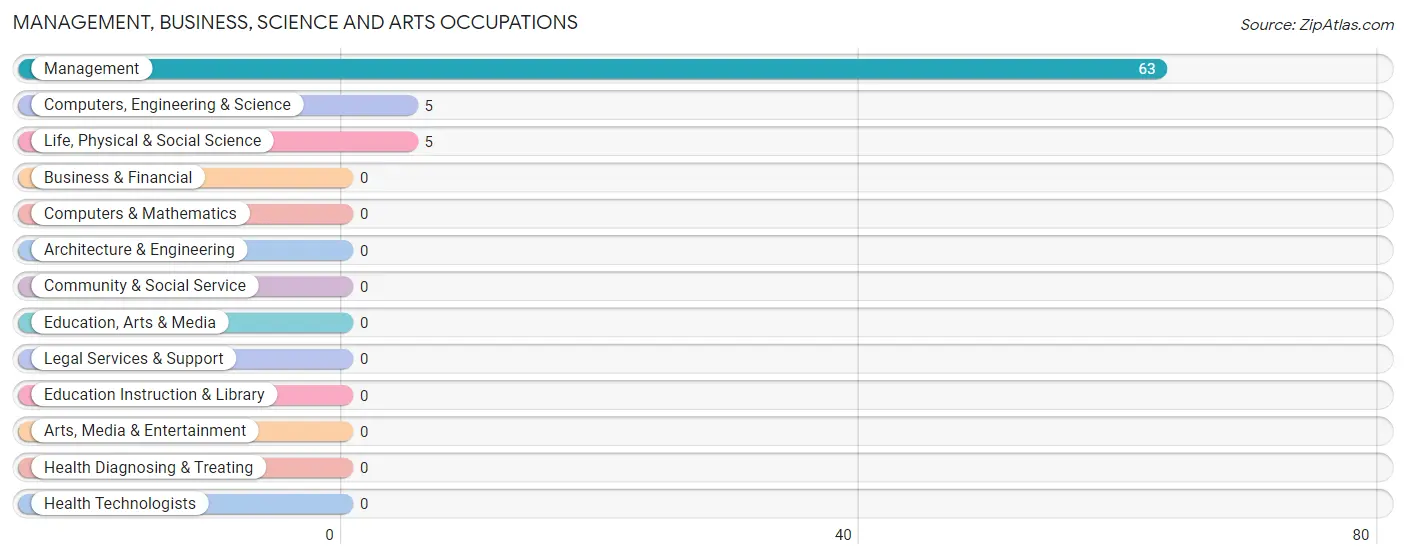
Management, Business, Science and Arts Occupations
The most common Management, Business, Science and Arts occupations in Cascade are Management (63 | 28.2%), Computers, Engineering & Science (5 | 2.2%), and Life, Physical & Social Science (5 | 2.2%).
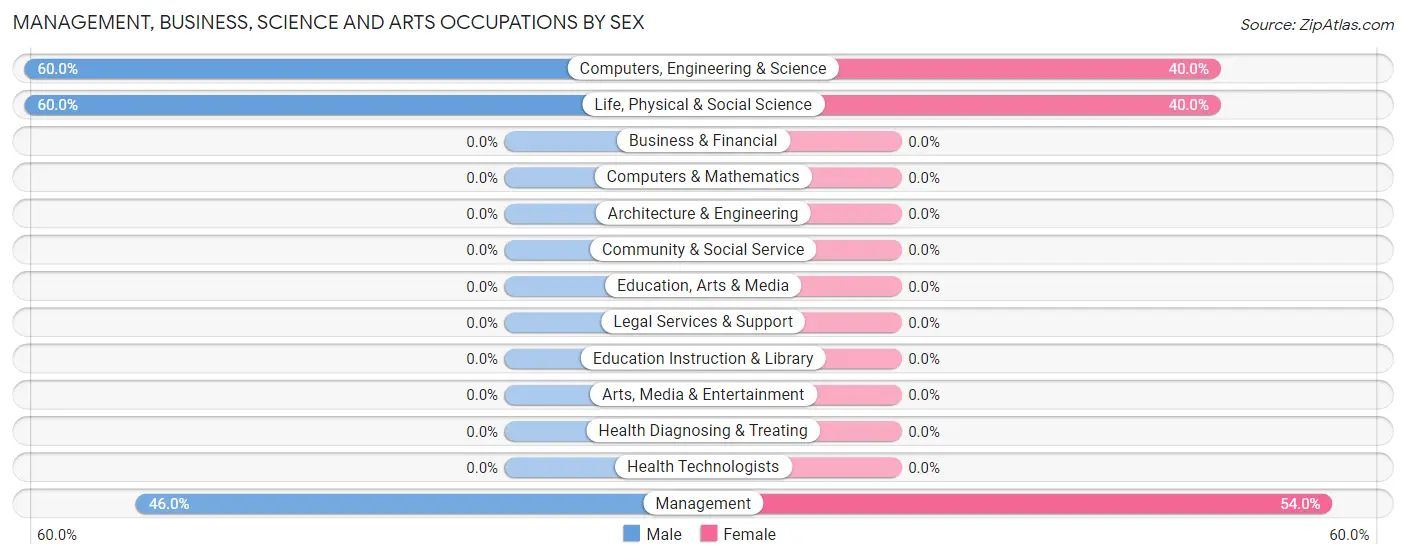
Management, Business, Science and Arts Occupations by Sex
Within the Management, Business, Science and Arts occupations in Cascade, the most male-oriented occupations are Computers, Engineering & Science (60.0%), Life, Physical & Social Science (60.0%), and Management (46.0%), while the most female-oriented occupations are Management (54.0%), Computers, Engineering & Science (40.0%), and Life, Physical & Social Science (40.0%).
| Occupation | Male | Female |
| Management | 29 (46.0%) | 34 (54.0%) |
| Business & Financial | 0 (0.0%) | 0 (0.0%) |
| Computers, Engineering & Science | 3 (60.0%) | 2 (40.0%) |
| Computers & Mathematics | 0 (0.0%) | 0 (0.0%) |
| Architecture & Engineering | 0 (0.0%) | 0 (0.0%) |
| Life, Physical & Social Science | 3 (60.0%) | 2 (40.0%) |
| Community & Social Service | 0 (0.0%) | 0 (0.0%) |
| Education, Arts & Media | 0 (0.0%) | 0 (0.0%) |
| Legal Services & Support | 0 (0.0%) | 0 (0.0%) |
| Education Instruction & Library | 0 (0.0%) | 0 (0.0%) |
| Arts, Media & Entertainment | 0 (0.0%) | 0 (0.0%) |
| Health Diagnosing & Treating | 0 (0.0%) | 0 (0.0%) |
| Health Technologists | 0 (0.0%) | 0 (0.0%) |
| Total (Category) | 32 (47.1%) | 36 (52.9%) |
| Total (Overall) | 125 (56.0%) | 98 (44.0%) |
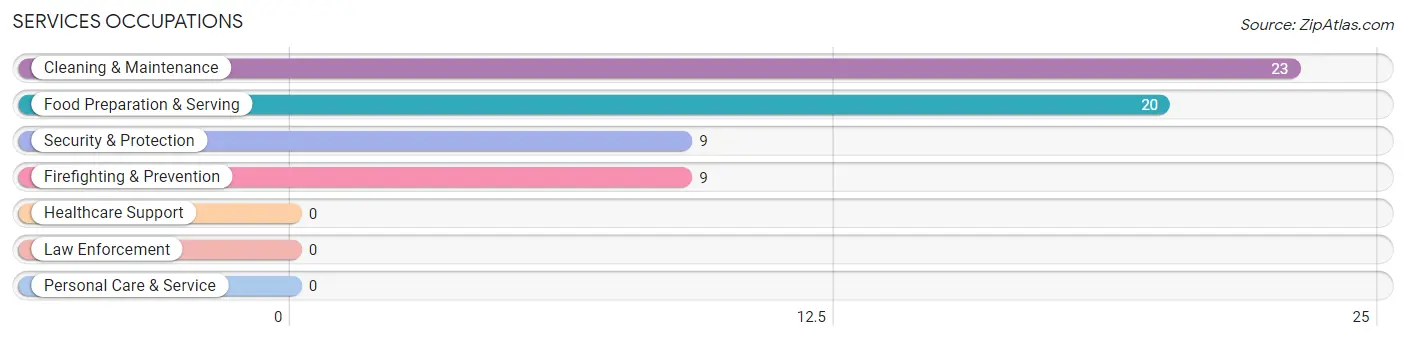
Services Occupations
The most common Services occupations in Cascade are Cleaning & Maintenance (23 | 10.3%), Food Preparation & Serving (20 | 9.0%), Security & Protection (9 | 4.0%), and Firefighting & Prevention (9 | 4.0%).
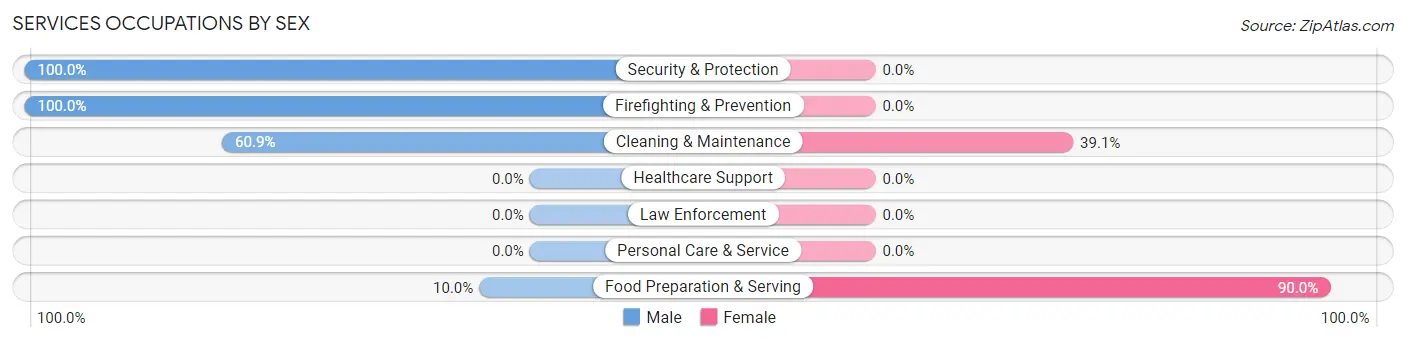
Services Occupations by Sex
Within the Services occupations in Cascade, the most male-oriented occupations are Security & Protection (100.0%), Firefighting & Prevention (100.0%), and Cleaning & Maintenance (60.9%), while the most female-oriented occupations are Food Preparation & Serving (90.0%), and Cleaning & Maintenance (39.1%).
| Occupation | Male | Female |
| Healthcare Support | 0 (0.0%) | 0 (0.0%) |
| Security & Protection | 9 (100.0%) | 0 (0.0%) |
| Firefighting & Prevention | 9 (100.0%) | 0 (0.0%) |
| Law Enforcement | 0 (0.0%) | 0 (0.0%) |
| Food Preparation & Serving | 2 (10.0%) | 18 (90.0%) |
| Cleaning & Maintenance | 14 (60.9%) | 9 (39.1%) |
| Personal Care & Service | 0 (0.0%) | 0 (0.0%) |
| Total (Category) | 25 (48.1%) | 27 (51.9%) |
| Total (Overall) | 125 (56.0%) | 98 (44.0%) |
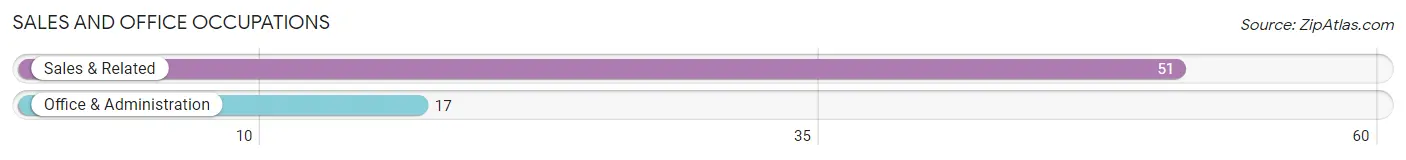
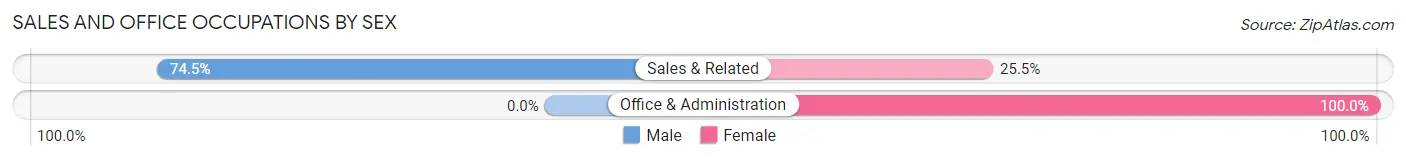
Sales and Office Occupations
The most common Sales and Office occupations in Cascade are Sales & Related (51 | 22.9%), and Office & Administration (17 | 7.6%).
Sales and Office Occupations by Sex
| Occupation | Male | Female |
| Sales & Related | 38 (74.5%) | 13 (25.5%) |
| Office & Administration | 0 (0.0%) | 17 (100.0%) |
| Total (Category) | 38 (55.9%) | 30 (44.1%) |
| Total (Overall) | 125 (56.0%) | 98 (44.0%) |
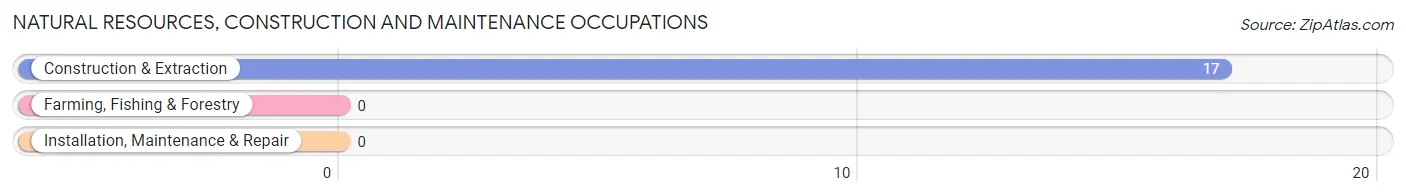
Natural Resources, Construction and Maintenance Occupations
The most common Natural Resources, Construction and Maintenance occupations in Cascade are , and Construction & Extraction (17 | 7.6%).
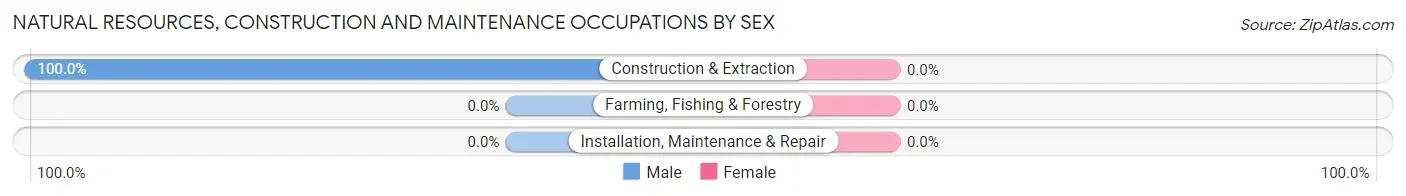
Natural Resources, Construction and Maintenance Occupations by Sex
| Occupation | Male | Female |
| Farming, Fishing & Forestry | 0 (0.0%) | 0 (0.0%) |
| Construction & Extraction | 17 (100.0%) | 0 (0.0%) |
| Installation, Maintenance & Repair | 0 (0.0%) | 0 (0.0%) |
| Total (Category) | 17 (100.0%) | 0 (0.0%) |
| Total (Overall) | 125 (56.0%) | 98 (44.0%) |
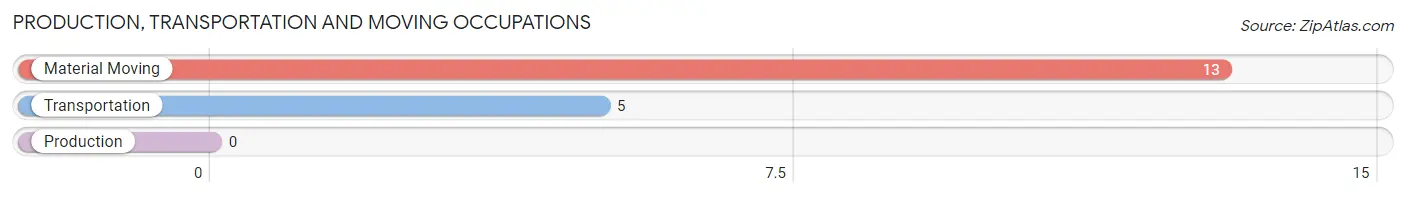
Production, Transportation and Moving Occupations
The most common Production, Transportation and Moving occupations in Cascade are Material Moving (13 | 5.8%), and Transportation (5 | 2.2%).
Production, Transportation and Moving Occupations by Sex
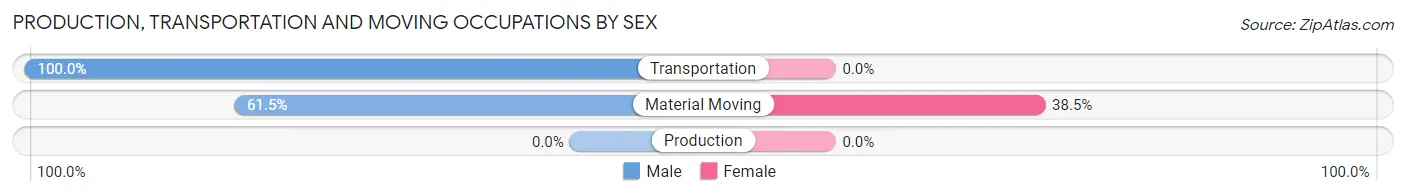
| Occupation | Male | Female |
| Production | 0 (0.0%) | 0 (0.0%) |
| Transportation | 5 (100.0%) | 0 (0.0%) |
| Material Moving | 8 (61.5%) | 5 (38.5%) |
| Total (Category) | 13 (72.2%) | 5 (27.8%) |
| Total (Overall) | 125 (56.0%) | 98 (44.0%) |
Employment Industries by Sex in Cascade
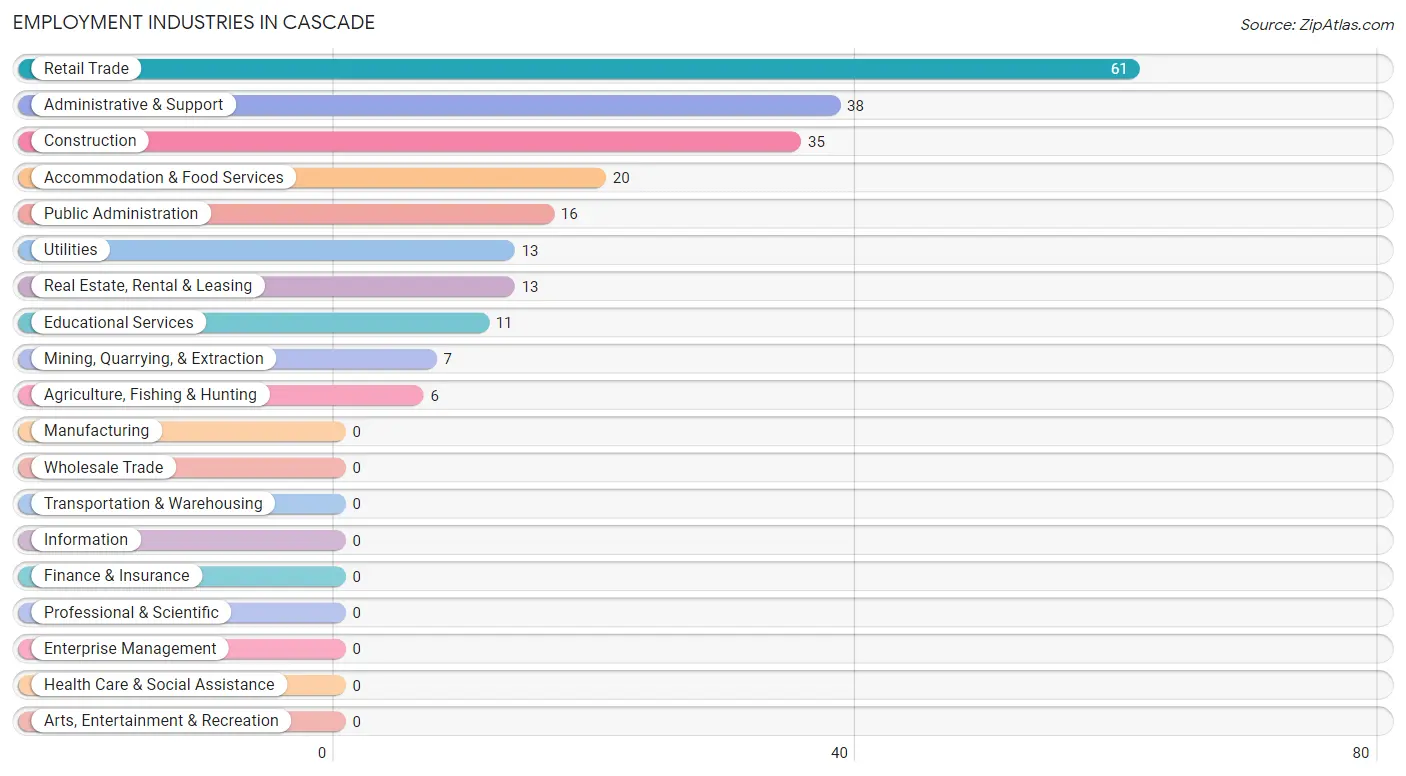
Employment Industries in Cascade
The major employment industries in Cascade include Retail Trade (61 | 27.4%), Administrative & Support (38 | 17.0%), Construction (35 | 15.7%), Accommodation & Food Services (20 | 9.0%), and Public Administration (16 | 7.2%).
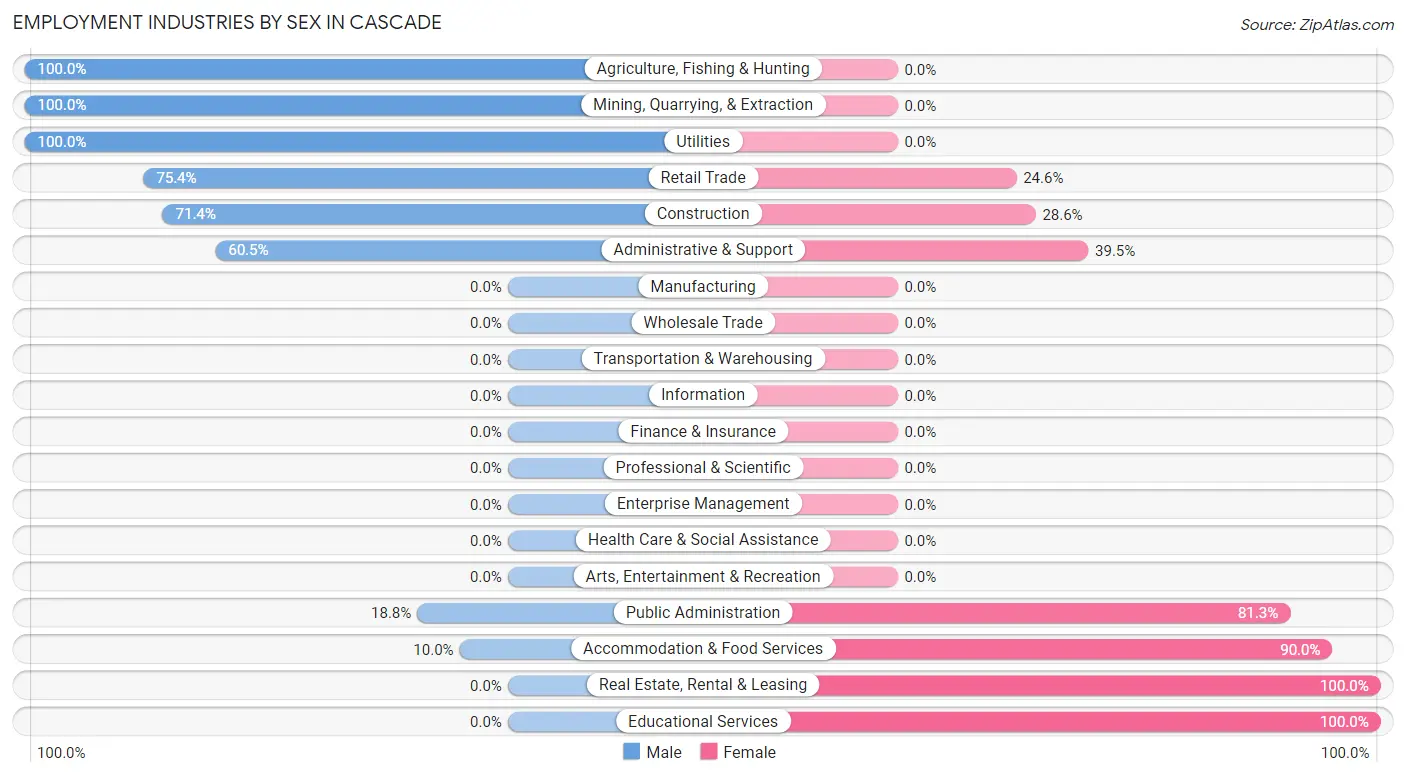
Employment Industries by Sex in Cascade
The Cascade industries that see more men than women are Agriculture, Fishing & Hunting (100.0%), Mining, Quarrying, & Extraction (100.0%), and Utilities (100.0%), whereas the industries that tend to have a higher number of women are Real Estate, Rental & Leasing (100.0%), Educational Services (100.0%), and Accommodation & Food Services (90.0%).
| Industry | Male | Female |
| Agriculture, Fishing & Hunting | 6 (100.0%) | 0 (0.0%) |
| Mining, Quarrying, & Extraction | 7 (100.0%) | 0 (0.0%) |
| Construction | 25 (71.4%) | 10 (28.6%) |
| Manufacturing | 0 (0.0%) | 0 (0.0%) |
| Wholesale Trade | 0 (0.0%) | 0 (0.0%) |
| Retail Trade | 46 (75.4%) | 15 (24.6%) |
| Transportation & Warehousing | 0 (0.0%) | 0 (0.0%) |
| Utilities | 13 (100.0%) | 0 (0.0%) |
| Information | 0 (0.0%) | 0 (0.0%) |
| Finance & Insurance | 0 (0.0%) | 0 (0.0%) |
| Real Estate, Rental & Leasing | 0 (0.0%) | 13 (100.0%) |
| Professional & Scientific | 0 (0.0%) | 0 (0.0%) |
| Enterprise Management | 0 (0.0%) | 0 (0.0%) |
| Administrative & Support | 23 (60.5%) | 15 (39.5%) |
| Educational Services | 0 (0.0%) | 11 (100.0%) |
| Health Care & Social Assistance | 0 (0.0%) | 0 (0.0%) |
| Arts, Entertainment & Recreation | 0 (0.0%) | 0 (0.0%) |
| Accommodation & Food Services | 2 (10.0%) | 18 (90.0%) |
| Public Administration | 3 (18.8%) | 13 (81.2%) |
| Total | 125 (56.0%) | 98 (44.0%) |
Education in Cascade
School Enrollment in Cascade
The most common levels of schooling among the 180 students in Cascade are elementary school (63 | 35.0%), high school (51 | 28.3%), and college / undergraduate (35 | 19.4%).
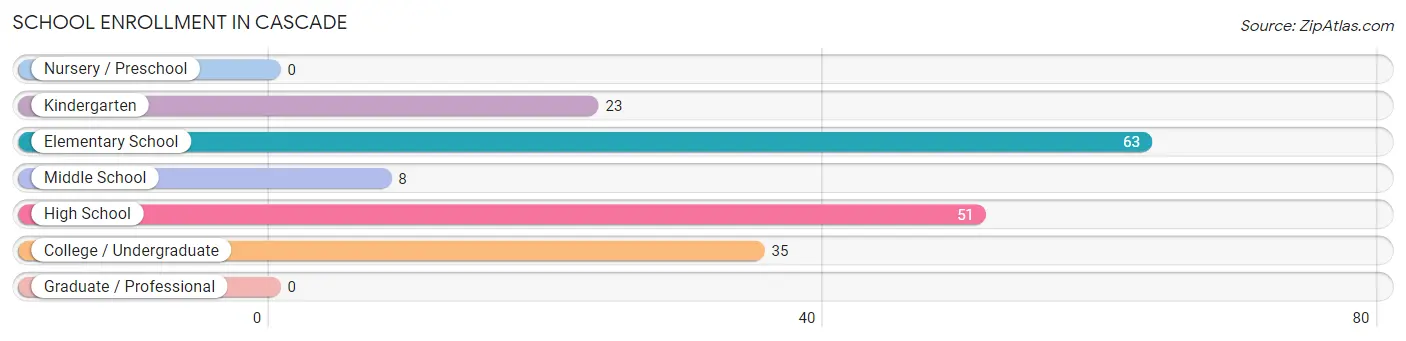
| School Level | # Students | % Students |
| Nursery / Preschool | 0 | 0.0% |
| Kindergarten | 23 | 12.8% |
| Elementary School | 63 | 35.0% |
| Middle School | 8 | 4.4% |
| High School | 51 | 28.3% |
| College / Undergraduate | 35 | 19.4% |
| Graduate / Professional | 0 | 0.0% |
| Total | 180 | 100.0% |
School Enrollment by Age by Funding Source in Cascade
Out of a total of 180 students who are enrolled in schools in Cascade, 80 (44.4%) attend a private institution, while the remaining 100 (55.6%) are enrolled in public schools. The age group of 3 to 4 year olds has the highest likelihood of being enrolled in private schools, with 12 (100.0% in the age bracket) enrolled. Conversely, the age group of 18 to 19 year olds has the lowest likelihood of being enrolled in a private school, with 32 (100.0% in the age bracket) attending a public institution.
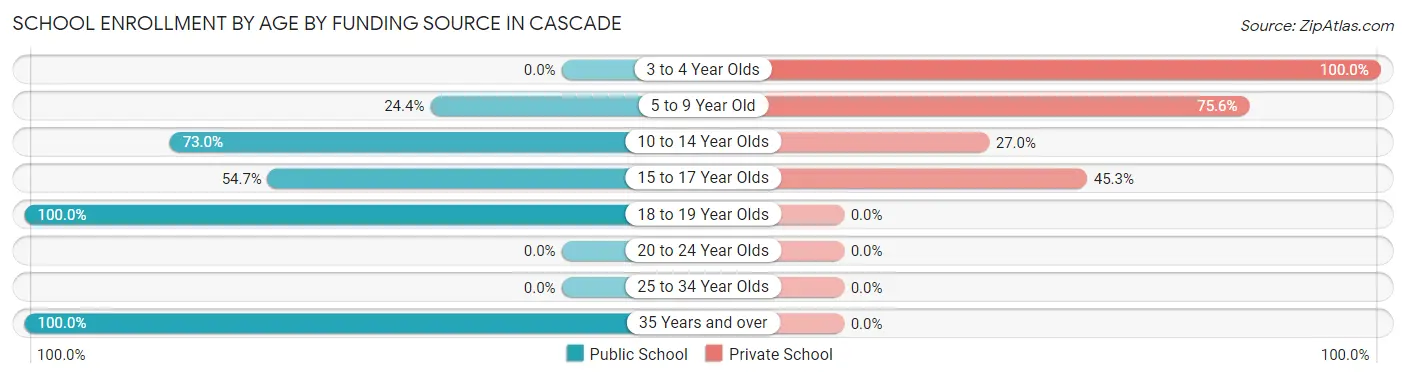
| Age Bracket | Public School | Private School |
| 3 to 4 Year Olds | 0 (0.0%) | 12 (100.0%) |
| 5 to 9 Year Old | 11 (24.4%) | 34 (75.6%) |
| 10 to 14 Year Olds | 27 (73.0%) | 10 (27.0%) |
| 15 to 17 Year Olds | 29 (54.7%) | 24 (45.3%) |
| 18 to 19 Year Olds | 32 (100.0%) | 0 (0.0%) |
| 20 to 24 Year Olds | 0 (0.0%) | 0 (0.0%) |
| 25 to 34 Year Olds | 0 (0.0%) | 0 (0.0%) |
| 35 Years and over | 1 (100.0%) | 0 (0.0%) |
| Total | 100 (55.6%) | 80 (44.4%) |
Educational Attainment by Field of Study in Cascade
Education (108 | 34.0%), arts & humanities (58 | 18.2%), business (32 | 10.1%), liberal arts & history (32 | 10.1%), and communications (25 | 7.9%) are the most common fields of study among 318 individuals in Cascade who have obtained a bachelor's degree or higher.
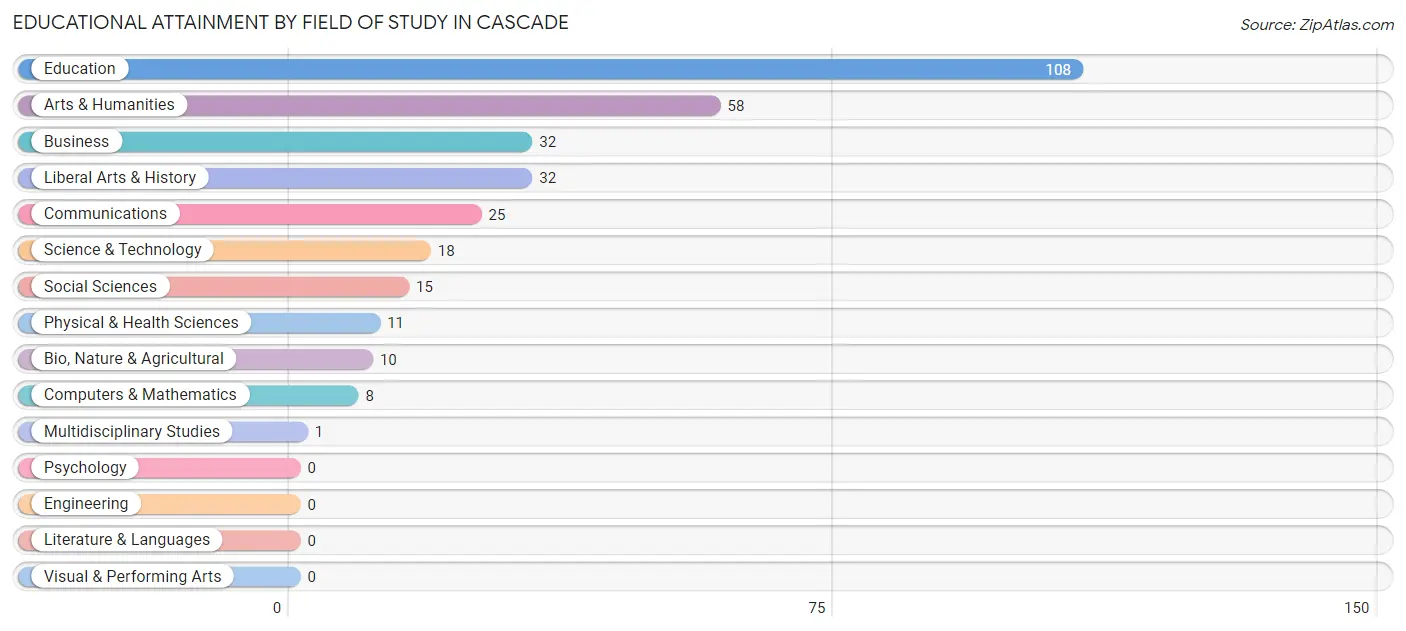
| Field of Study | # Graduates | % Graduates |
| Computers & Mathematics | 8 | 2.5% |
| Bio, Nature & Agricultural | 10 | 3.1% |
| Physical & Health Sciences | 11 | 3.5% |
| Psychology | 0 | 0.0% |
| Social Sciences | 15 | 4.7% |
| Engineering | 0 | 0.0% |
| Multidisciplinary Studies | 1 | 0.3% |
| Science & Technology | 18 | 5.7% |
| Business | 32 | 10.1% |
| Education | 108 | 34.0% |
| Literature & Languages | 0 | 0.0% |
| Liberal Arts & History | 32 | 10.1% |
| Visual & Performing Arts | 0 | 0.0% |
| Communications | 25 | 7.9% |
| Arts & Humanities | 58 | 18.2% |
| Total | 318 | 100.0% |
Transportation & Commute in Cascade
Vehicle Availability by Sex in Cascade
The most prevalent vehicle ownership categories in Cascade are males with 2 vehicles (75, accounting for 61.0%) and females with 2 vehicles (63, making up 78.9%).
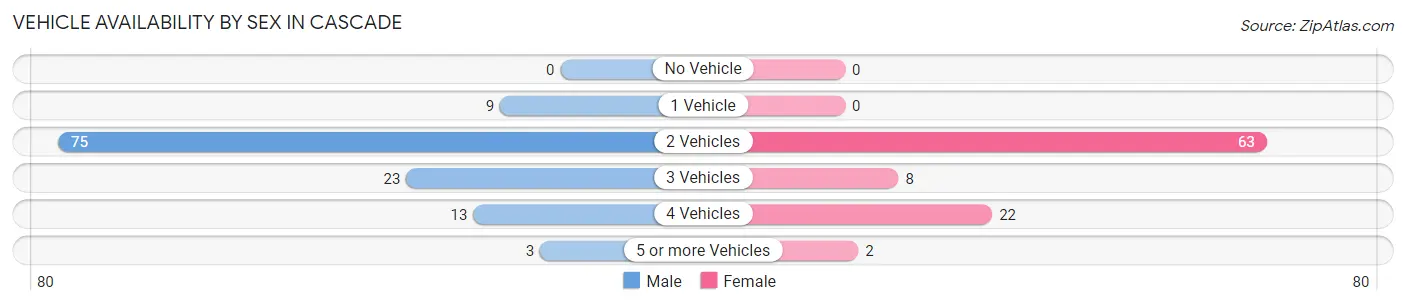
| Vehicles Available | Male | Female |
| No Vehicle | 0 (0.0%) | 0 (0.0%) |
| 1 Vehicle | 9 (7.3%) | 0 (0.0%) |
| 2 Vehicles | 75 (61.0%) | 63 (66.3%) |
| 3 Vehicles | 23 (18.7%) | 8 (8.4%) |
| 4 Vehicles | 13 (10.6%) | 22 (23.2%) |
| 5 or more Vehicles | 3 (2.4%) | 2 (2.1%) |
| Total | 123 (100.0%) | 95 (100.0%) |
Commute Time in Cascade
The most frequently occuring commute durations in Cascade are 5 to 9 minutes (50 commuters, 23.8%), less than 5 minutes (36 commuters, 17.1%), and 20 to 24 minutes (33 commuters, 15.7%).
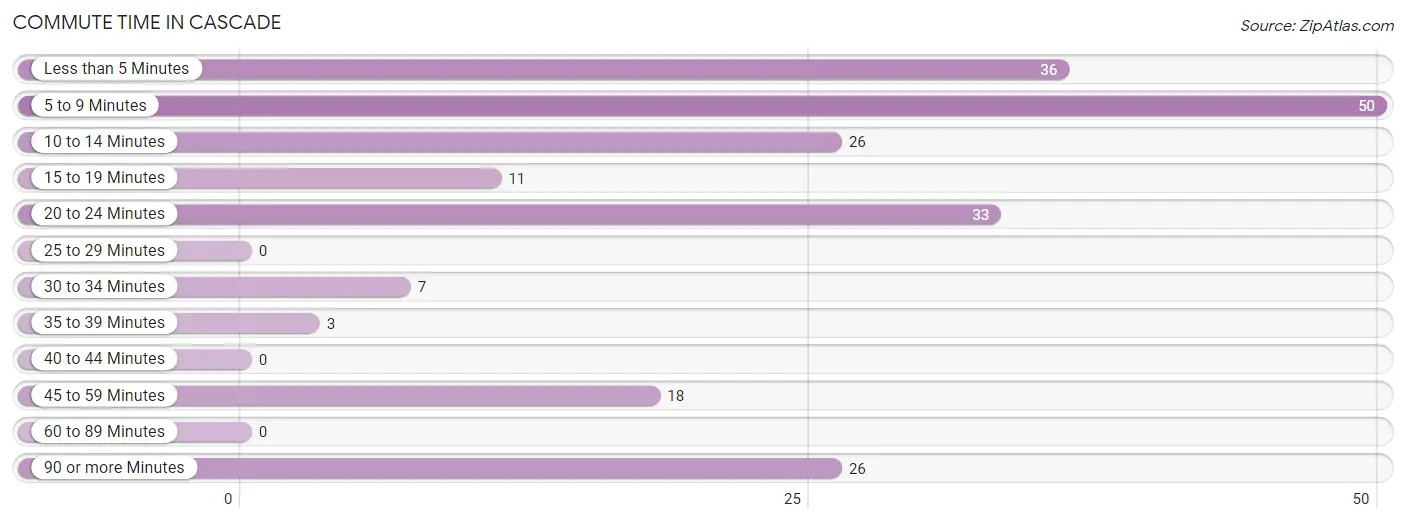
| Commute Time | # Commuters | % Commuters |
| Less than 5 Minutes | 36 | 17.1% |
| 5 to 9 Minutes | 50 | 23.8% |
| 10 to 14 Minutes | 26 | 12.4% |
| 15 to 19 Minutes | 11 | 5.2% |
| 20 to 24 Minutes | 33 | 15.7% |
| 25 to 29 Minutes | 0 | 0.0% |
| 30 to 34 Minutes | 7 | 3.3% |
| 35 to 39 Minutes | 3 | 1.4% |
| 40 to 44 Minutes | 0 | 0.0% |
| 45 to 59 Minutes | 18 | 8.6% |
| 60 to 89 Minutes | 0 | 0.0% |
| 90 or more Minutes | 26 | 12.4% |
Commute Time by Sex in Cascade
The most common commute times in Cascade are 5 to 9 minutes (30 commuters, 24.4%) for males and less than 5 minutes (24 commuters, 27.6%) for females.
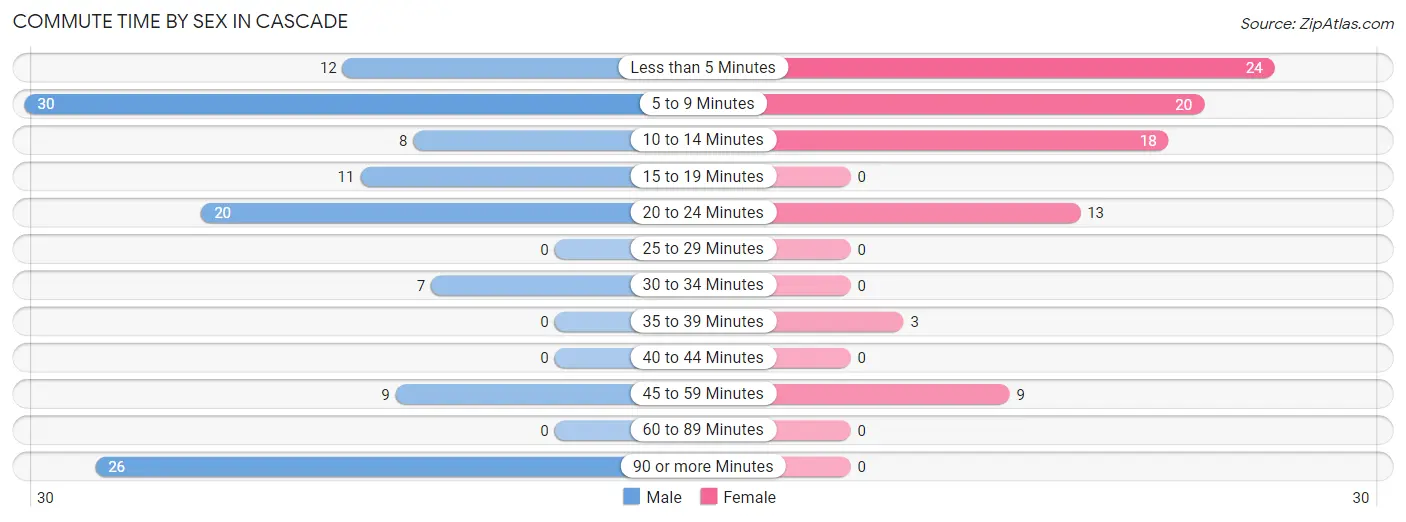
| Commute Time | Male | Female |
| Less than 5 Minutes | 12 (9.8%) | 24 (27.6%) |
| 5 to 9 Minutes | 30 (24.4%) | 20 (23.0%) |
| 10 to 14 Minutes | 8 (6.5%) | 18 (20.7%) |
| 15 to 19 Minutes | 11 (8.9%) | 0 (0.0%) |
| 20 to 24 Minutes | 20 (16.3%) | 13 (14.9%) |
| 25 to 29 Minutes | 0 (0.0%) | 0 (0.0%) |
| 30 to 34 Minutes | 7 (5.7%) | 0 (0.0%) |
| 35 to 39 Minutes | 0 (0.0%) | 3 (3.5%) |
| 40 to 44 Minutes | 0 (0.0%) | 0 (0.0%) |
| 45 to 59 Minutes | 9 (7.3%) | 9 (10.3%) |
| 60 to 89 Minutes | 0 (0.0%) | 0 (0.0%) |
| 90 or more Minutes | 26 (21.1%) | 0 (0.0%) |
Time of Departure to Work by Sex in Cascade
The most frequent times of departure to work in Cascade are 7:00 AM to 7:29 AM (35, 28.5%) for males and 8:30 AM to 8:59 AM (30, 34.5%) for females.
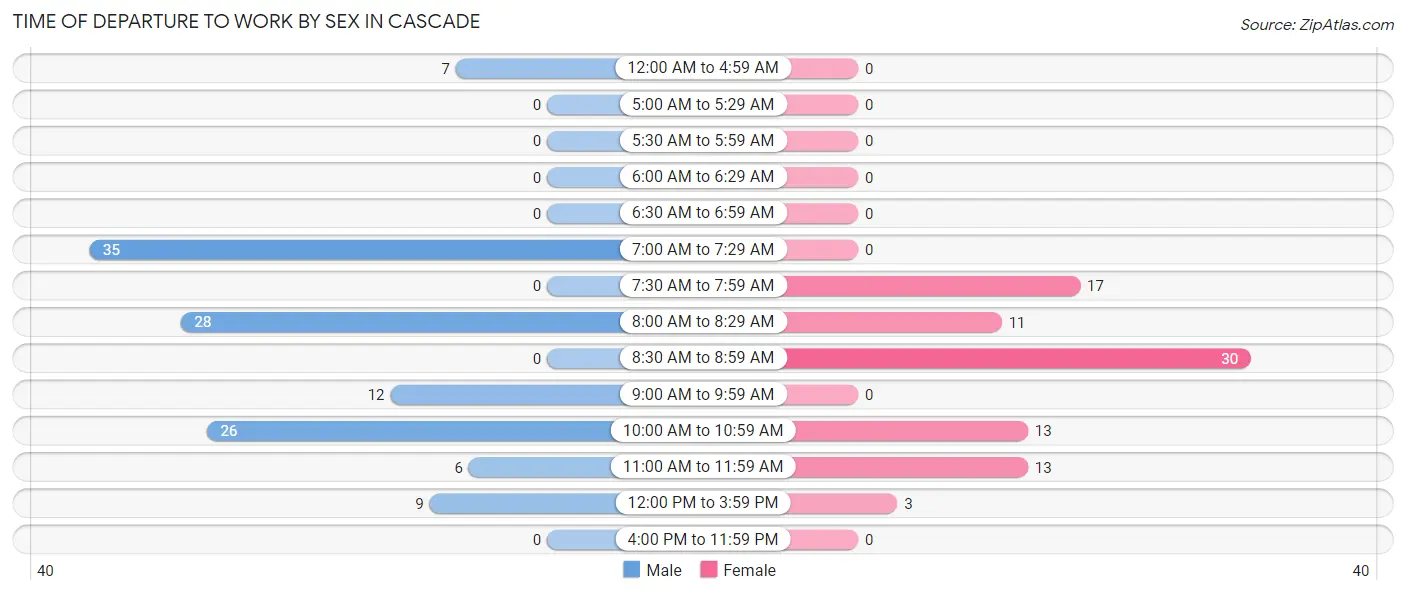
| Time of Departure | Male | Female |
| 12:00 AM to 4:59 AM | 7 (5.7%) | 0 (0.0%) |
| 5:00 AM to 5:29 AM | 0 (0.0%) | 0 (0.0%) |
| 5:30 AM to 5:59 AM | 0 (0.0%) | 0 (0.0%) |
| 6:00 AM to 6:29 AM | 0 (0.0%) | 0 (0.0%) |
| 6:30 AM to 6:59 AM | 0 (0.0%) | 0 (0.0%) |
| 7:00 AM to 7:29 AM | 35 (28.5%) | 0 (0.0%) |
| 7:30 AM to 7:59 AM | 0 (0.0%) | 17 (19.5%) |
| 8:00 AM to 8:29 AM | 28 (22.8%) | 11 (12.6%) |
| 8:30 AM to 8:59 AM | 0 (0.0%) | 30 (34.5%) |
| 9:00 AM to 9:59 AM | 12 (9.8%) | 0 (0.0%) |
| 10:00 AM to 10:59 AM | 26 (21.1%) | 13 (14.9%) |
| 11:00 AM to 11:59 AM | 6 (4.9%) | 13 (14.9%) |
| 12:00 PM to 3:59 PM | 9 (7.3%) | 3 (3.5%) |
| 4:00 PM to 11:59 PM | 0 (0.0%) | 0 (0.0%) |
| Total | 123 (100.0%) | 87 (100.0%) |
Housing Occupancy in Cascade
Occupancy by Ownership in Cascade
Of the total 358 dwellings in Cascade, owner-occupied units account for 312 (87.2%), while renter-occupied units make up 46 (12.9%).
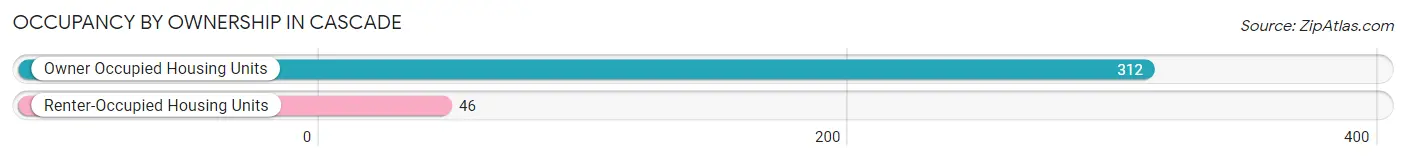
| Occupancy | # Housing Units | % Housing Units |
| Owner Occupied Housing Units | 312 | 87.2% |
| Renter-Occupied Housing Units | 46 | 12.9% |
| Total Occupied Housing Units | 358 | 100.0% |
Occupancy by Household Size in Cascade
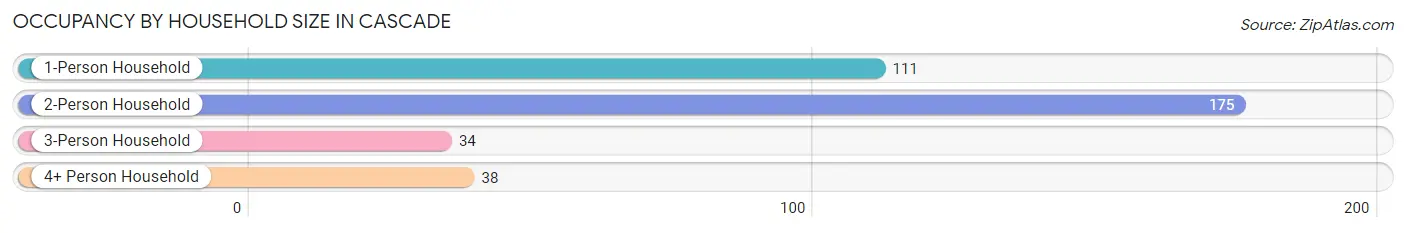
| Household Size | # Housing Units | % Housing Units |
| 1-Person Household | 111 | 31.0% |
| 2-Person Household | 175 | 48.9% |
| 3-Person Household | 34 | 9.5% |
| 4+ Person Household | 38 | 10.6% |
| Total Housing Units | 358 | 100.0% |
Occupancy by Ownership by Household Size in Cascade
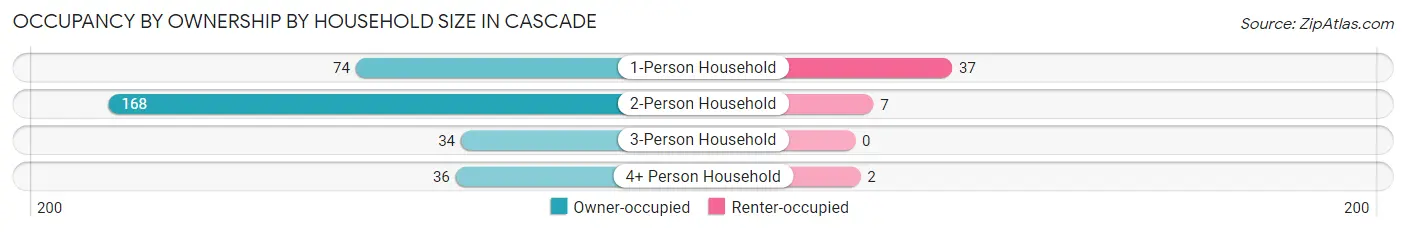
| Household Size | Owner-occupied | Renter-occupied |
| 1-Person Household | 74 (66.7%) | 37 (33.3%) |
| 2-Person Household | 168 (96.0%) | 7 (4.0%) |
| 3-Person Household | 34 (100.0%) | 0 (0.0%) |
| 4+ Person Household | 36 (94.7%) | 2 (5.3%) |
| Total Housing Units | 312 (87.2%) | 46 (12.9%) |
Occupancy by Educational Attainment in Cascade
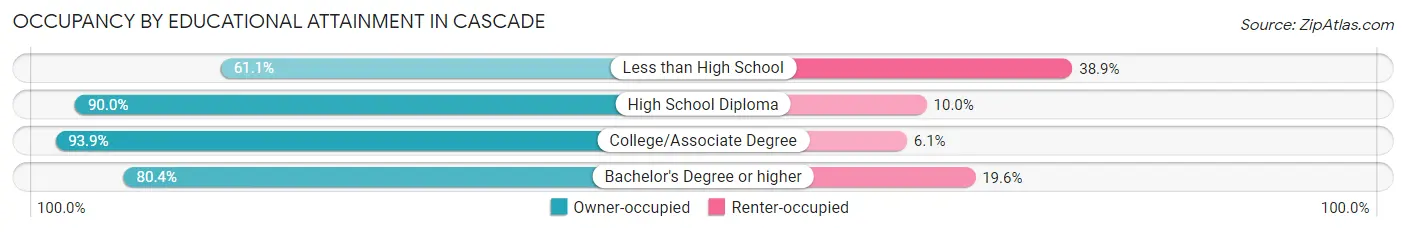
| Household Size | Owner-occupied | Renter-occupied |
| Less than High School | 11 (61.1%) | 7 (38.9%) |
| High School Diploma | 72 (90.0%) | 8 (10.0%) |
| College/Associate Degree | 139 (93.9%) | 9 (6.1%) |
| Bachelor's Degree or higher | 90 (80.4%) | 22 (19.6%) |
Occupancy by Age of Householder in Cascade
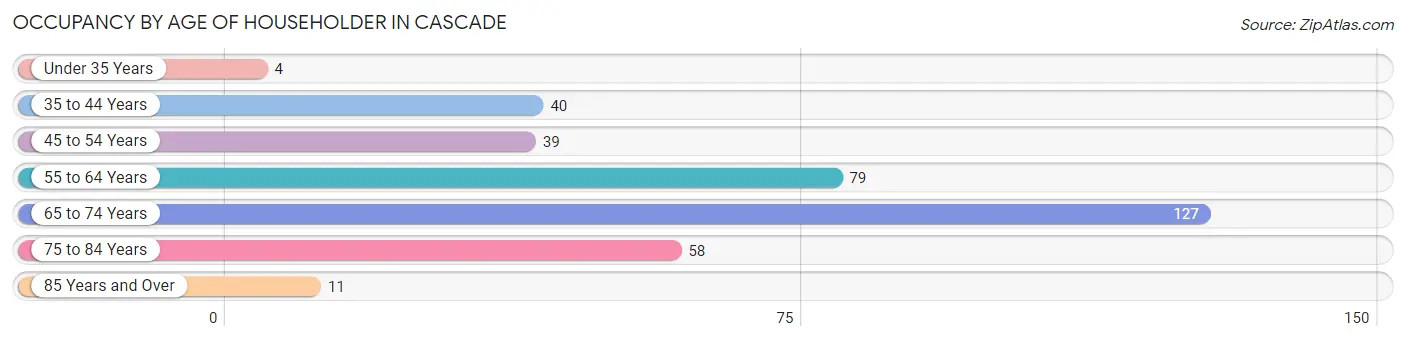
| Age Bracket | # Households | % Households |
| Under 35 Years | 4 | 1.1% |
| 35 to 44 Years | 40 | 11.2% |
| 45 to 54 Years | 39 | 10.9% |
| 55 to 64 Years | 79 | 22.1% |
| 65 to 74 Years | 127 | 35.5% |
| 75 to 84 Years | 58 | 16.2% |
| 85 Years and Over | 11 | 3.1% |
| Total | 358 | 100.0% |
Housing Finances in Cascade
Median Income by Occupancy in Cascade
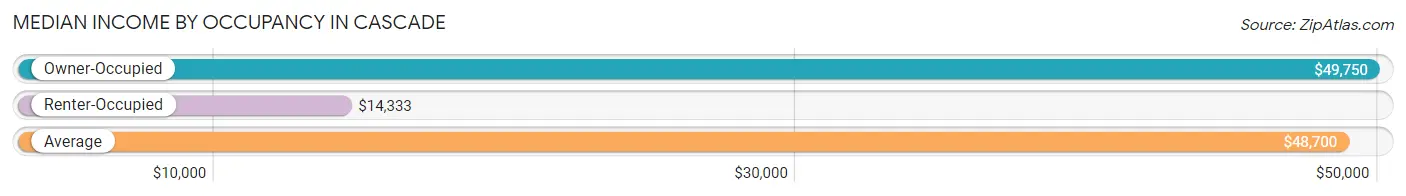
| Occupancy Type | # Households | Median Income |
| Owner-Occupied | 312 (87.2%) | $49,750 |
| Renter-Occupied | 46 (12.9%) | $14,333 |
| Average | 358 (100.0%) | $48,700 |
Occupancy by Householder Income Bracket in Cascade
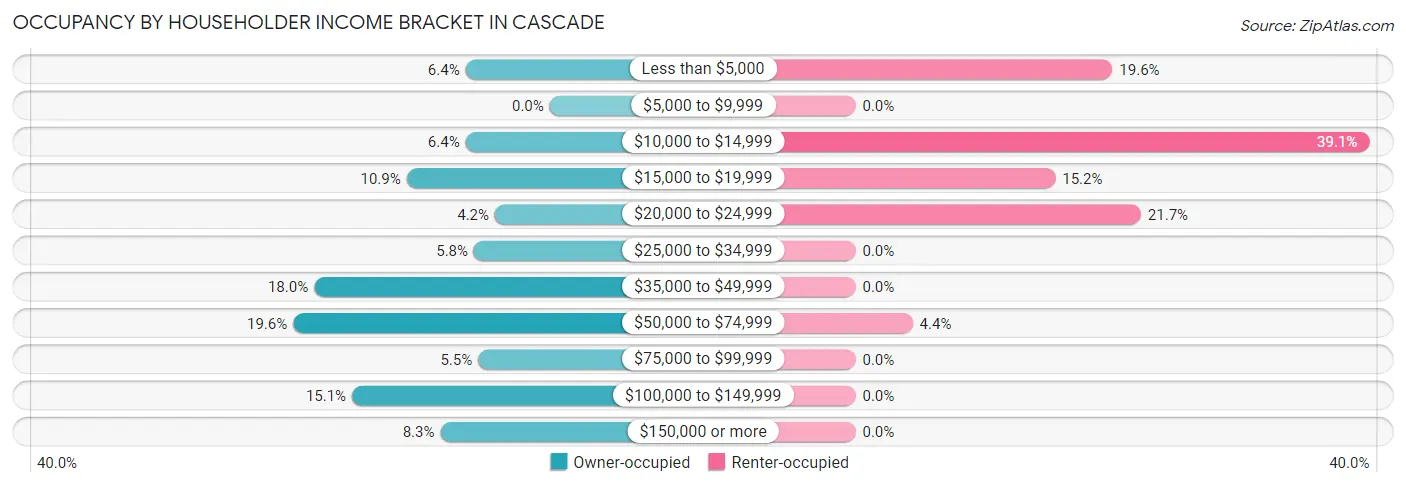
| Income Bracket | Owner-occupied | Renter-occupied |
| Less than $5,000 | 20 (6.4%) | 9 (19.6%) |
| $5,000 to $9,999 | 0 (0.0%) | 0 (0.0%) |
| $10,000 to $14,999 | 20 (6.4%) | 18 (39.1%) |
| $15,000 to $19,999 | 34 (10.9%) | 7 (15.2%) |
| $20,000 to $24,999 | 13 (4.2%) | 10 (21.7%) |
| $25,000 to $34,999 | 18 (5.8%) | 0 (0.0%) |
| $35,000 to $49,999 | 56 (17.9%) | 0 (0.0%) |
| $50,000 to $74,999 | 61 (19.6%) | 2 (4.3%) |
| $75,000 to $99,999 | 17 (5.4%) | 0 (0.0%) |
| $100,000 to $149,999 | 47 (15.1%) | 0 (0.0%) |
| $150,000 or more | 26 (8.3%) | 0 (0.0%) |
| Total | 312 (100.0%) | 46 (100.0%) |
Monthly Housing Cost Tiers in Cascade
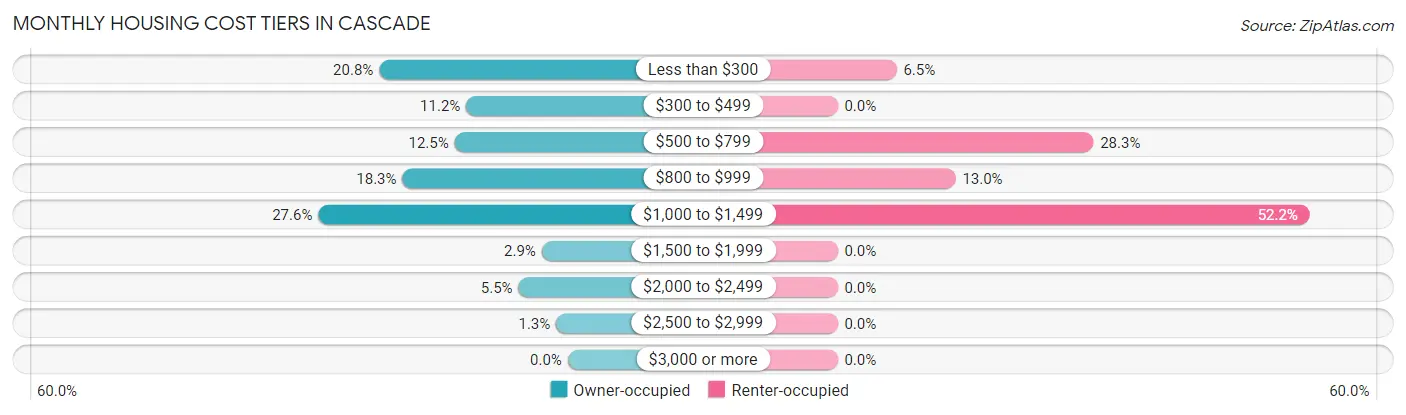
| Monthly Cost | Owner-occupied | Renter-occupied |
| Less than $300 | 65 (20.8%) | 3 (6.5%) |
| $300 to $499 | 35 (11.2%) | 0 (0.0%) |
| $500 to $799 | 39 (12.5%) | 13 (28.3%) |
| $800 to $999 | 57 (18.3%) | 6 (13.0%) |
| $1,000 to $1,499 | 86 (27.6%) | 24 (52.2%) |
| $1,500 to $1,999 | 9 (2.9%) | 0 (0.0%) |
| $2,000 to $2,499 | 17 (5.4%) | 0 (0.0%) |
| $2,500 to $2,999 | 4 (1.3%) | 0 (0.0%) |
| $3,000 or more | 0 (0.0%) | 0 (0.0%) |
| Total | 312 (100.0%) | 46 (100.0%) |
Physical Housing Characteristics in Cascade
Housing Structures in Cascade
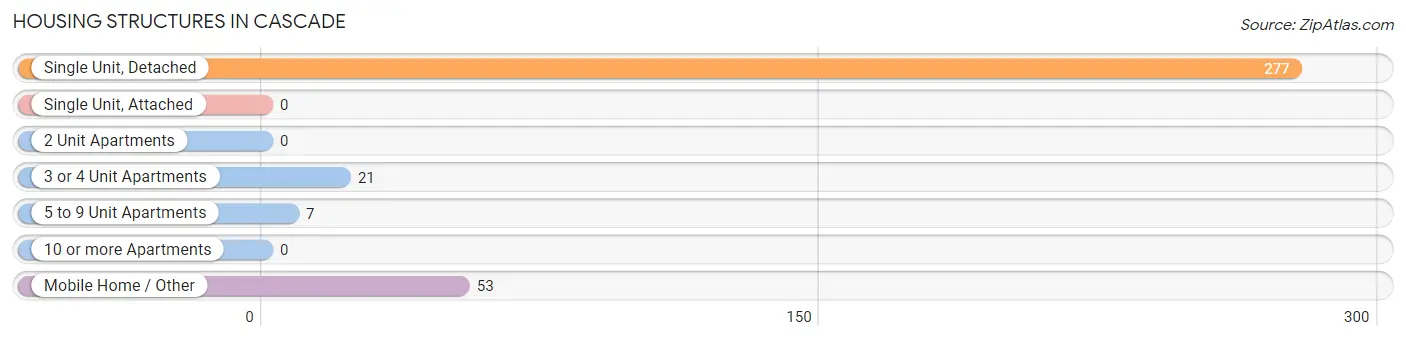
| Structure Type | # Housing Units | % Housing Units |
| Single Unit, Detached | 277 | 77.4% |
| Single Unit, Attached | 0 | 0.0% |
| 2 Unit Apartments | 0 | 0.0% |
| 3 or 4 Unit Apartments | 21 | 5.9% |
| 5 to 9 Unit Apartments | 7 | 2.0% |
| 10 or more Apartments | 0 | 0.0% |
| Mobile Home / Other | 53 | 14.8% |
| Total | 358 | 100.0% |
Housing Structures by Occupancy in Cascade
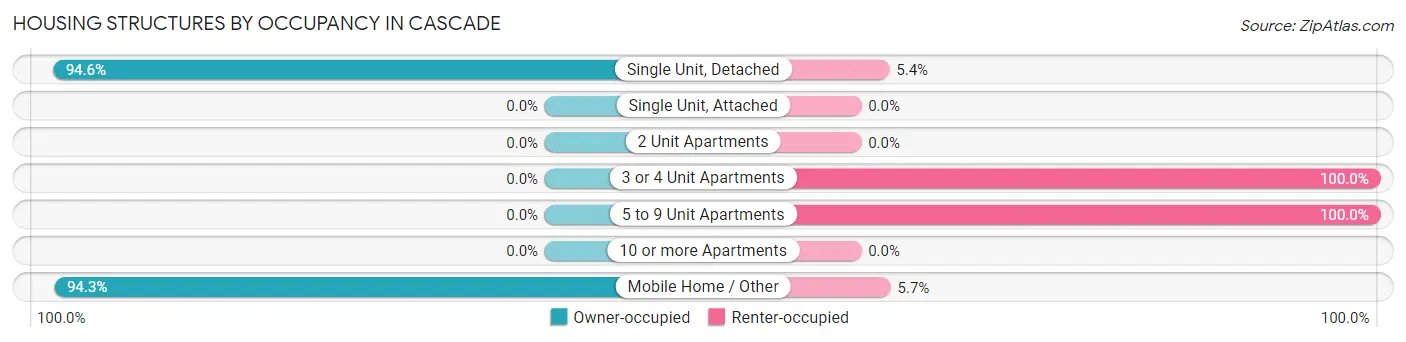
| Structure Type | Owner-occupied | Renter-occupied |
| Single Unit, Detached | 262 (94.6%) | 15 (5.4%) |
| Single Unit, Attached | 0 (0.0%) | 0 (0.0%) |
| 2 Unit Apartments | 0 (0.0%) | 0 (0.0%) |
| 3 or 4 Unit Apartments | 0 (0.0%) | 21 (100.0%) |
| 5 to 9 Unit Apartments | 0 (0.0%) | 7 (100.0%) |
| 10 or more Apartments | 0 (0.0%) | 0 (0.0%) |
| Mobile Home / Other | 50 (94.3%) | 3 (5.7%) |
| Total | 312 (87.2%) | 46 (12.9%) |
Housing Structures by Number of Rooms in Cascade
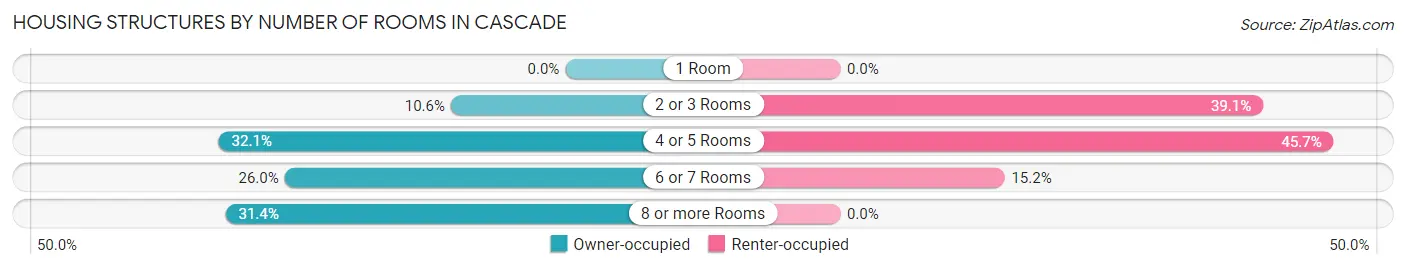
| Number of Rooms | Owner-occupied | Renter-occupied |
| 1 Room | 0 (0.0%) | 0 (0.0%) |
| 2 or 3 Rooms | 33 (10.6%) | 18 (39.1%) |
| 4 or 5 Rooms | 100 (32.1%) | 21 (45.7%) |
| 6 or 7 Rooms | 81 (26.0%) | 7 (15.2%) |
| 8 or more Rooms | 98 (31.4%) | 0 (0.0%) |
| Total | 312 (100.0%) | 46 (100.0%) |
Housing Structure by Heating Type in Cascade
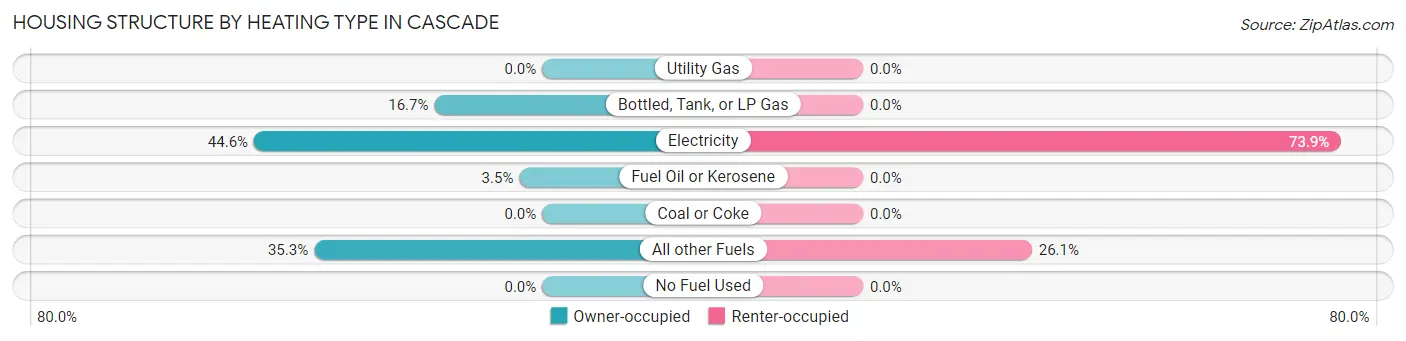
| Heating Type | Owner-occupied | Renter-occupied |
| Utility Gas | 0 (0.0%) | 0 (0.0%) |
| Bottled, Tank, or LP Gas | 52 (16.7%) | 0 (0.0%) |
| Electricity | 139 (44.6%) | 34 (73.9%) |
| Fuel Oil or Kerosene | 11 (3.5%) | 0 (0.0%) |
| Coal or Coke | 0 (0.0%) | 0 (0.0%) |
| All other Fuels | 110 (35.3%) | 12 (26.1%) |
| No Fuel Used | 0 (0.0%) | 0 (0.0%) |
| Total | 312 (100.0%) | 46 (100.0%) |
Household Vehicle Usage in Cascade
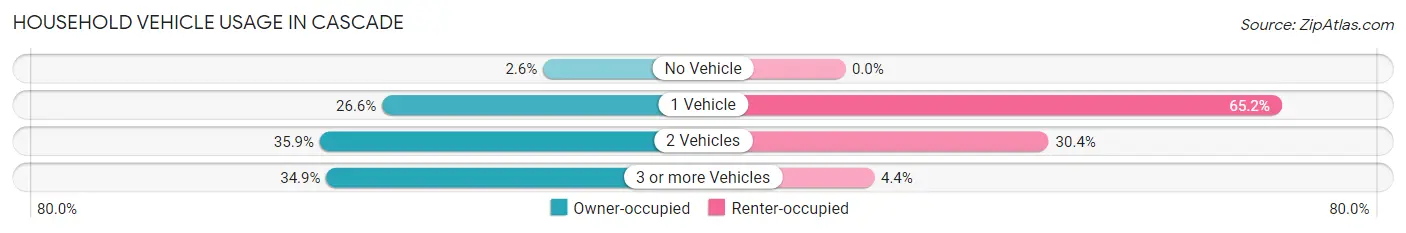
| Vehicles per Household | Owner-occupied | Renter-occupied |
| No Vehicle | 8 (2.6%) | 0 (0.0%) |
| 1 Vehicle | 83 (26.6%) | 30 (65.2%) |
| 2 Vehicles | 112 (35.9%) | 14 (30.4%) |
| 3 or more Vehicles | 109 (34.9%) | 2 (4.3%) |
| Total | 312 (100.0%) | 46 (100.0%) |
Real Estate & Mortgages in Cascade
Real Estate and Mortgage Overview in Cascade
| Characteristic | Without Mortgage | With Mortgage |
| Housing Units | 145 | 167 |
| Median Property Value | $251,000 | $352,400 |
| Median Household Income | - | - |
| Monthly Housing Costs | $372 | $0 |
| Real Estate Taxes | $931 | $0 |
Property Value by Mortgage Status in Cascade
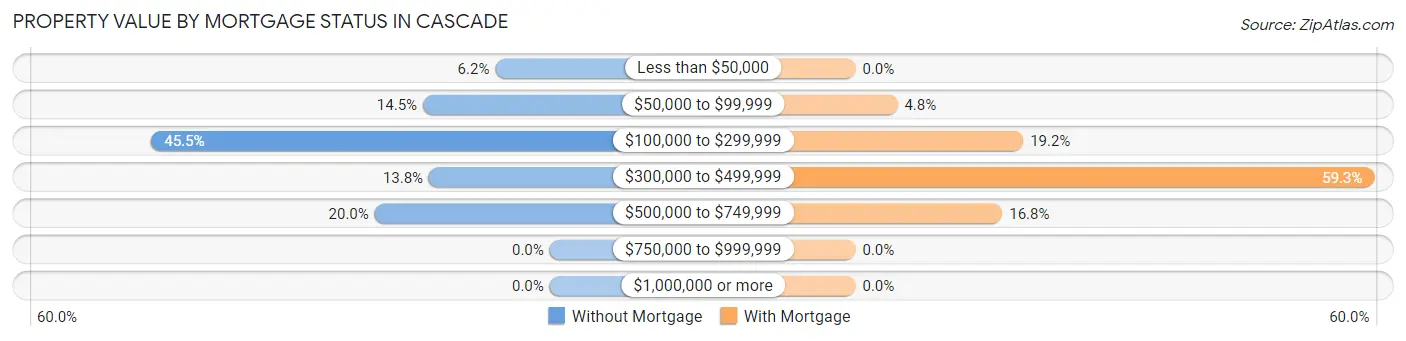
| Property Value | Without Mortgage | With Mortgage |
| Less than $50,000 | 9 (6.2%) | 0 (0.0%) |
| $50,000 to $99,999 | 21 (14.5%) | 8 (4.8%) |
| $100,000 to $299,999 | 66 (45.5%) | 32 (19.2%) |
| $300,000 to $499,999 | 20 (13.8%) | 99 (59.3%) |
| $500,000 to $749,999 | 29 (20.0%) | 28 (16.8%) |
| $750,000 to $999,999 | 0 (0.0%) | 0 (0.0%) |
| $1,000,000 or more | 0 (0.0%) | 0 (0.0%) |
| Total | 145 (100.0%) | 167 (100.0%) |
Household Income by Mortgage Status in Cascade
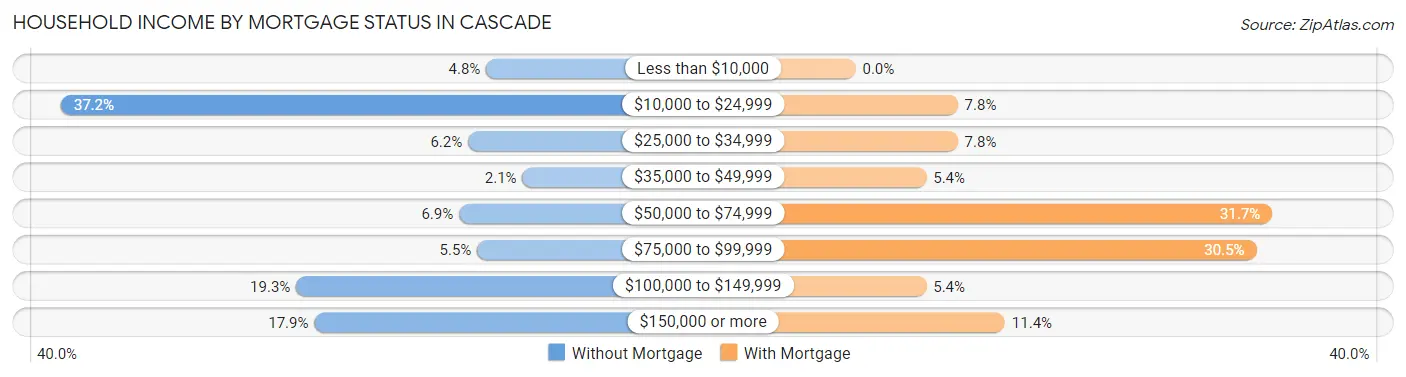
| Household Income | Without Mortgage | With Mortgage |
| Less than $10,000 | 7 (4.8%) | 0 (0.0%) |
| $10,000 to $24,999 | 54 (37.2%) | 13 (7.8%) |
| $25,000 to $34,999 | 9 (6.2%) | 13 (7.8%) |
| $35,000 to $49,999 | 3 (2.1%) | 9 (5.4%) |
| $50,000 to $74,999 | 10 (6.9%) | 53 (31.7%) |
| $75,000 to $99,999 | 8 (5.5%) | 51 (30.5%) |
| $100,000 to $149,999 | 28 (19.3%) | 9 (5.4%) |
| $150,000 or more | 26 (17.9%) | 19 (11.4%) |
| Total | 145 (100.0%) | 167 (100.0%) |
Property Value to Household Income Ratio in Cascade
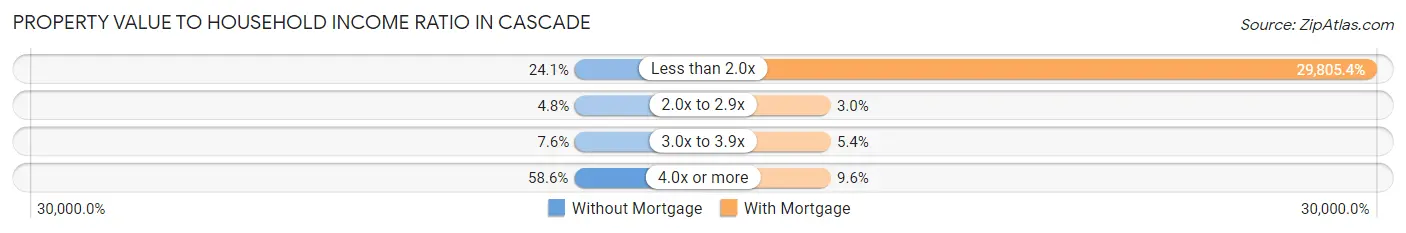
| Value-to-Income Ratio | Without Mortgage | With Mortgage |
| Less than 2.0x | 35 (24.1%) | 49,775 (29,805.4%) |
| 2.0x to 2.9x | 7 (4.8%) | 5 (3.0%) |
| 3.0x to 3.9x | 11 (7.6%) | 9 (5.4%) |
| 4.0x or more | 85 (58.6%) | 16 (9.6%) |
| Total | 145 (100.0%) | 167 (100.0%) |
Real Estate Taxes by Mortgage Status in Cascade
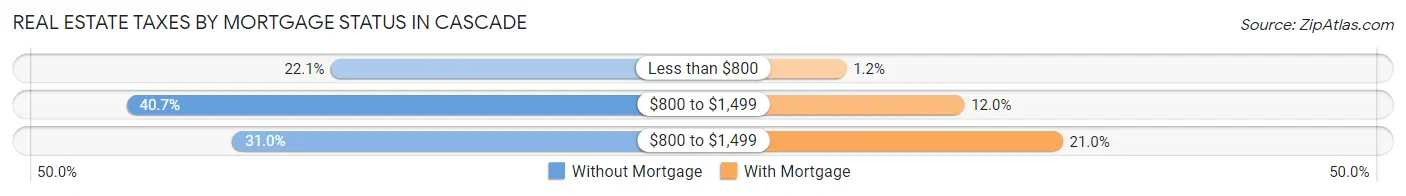
| Property Taxes | Without Mortgage | With Mortgage |
| Less than $800 | 32 (22.1%) | 2 (1.2%) |
| $800 to $1,499 | 59 (40.7%) | 20 (12.0%) |
| $800 to $1,499 | 45 (31.0%) | 35 (21.0%) |
| Total | 145 (100.0%) | 167 (100.0%) |
Health & Disability in Cascade
Health Insurance Coverage by Age in Cascade
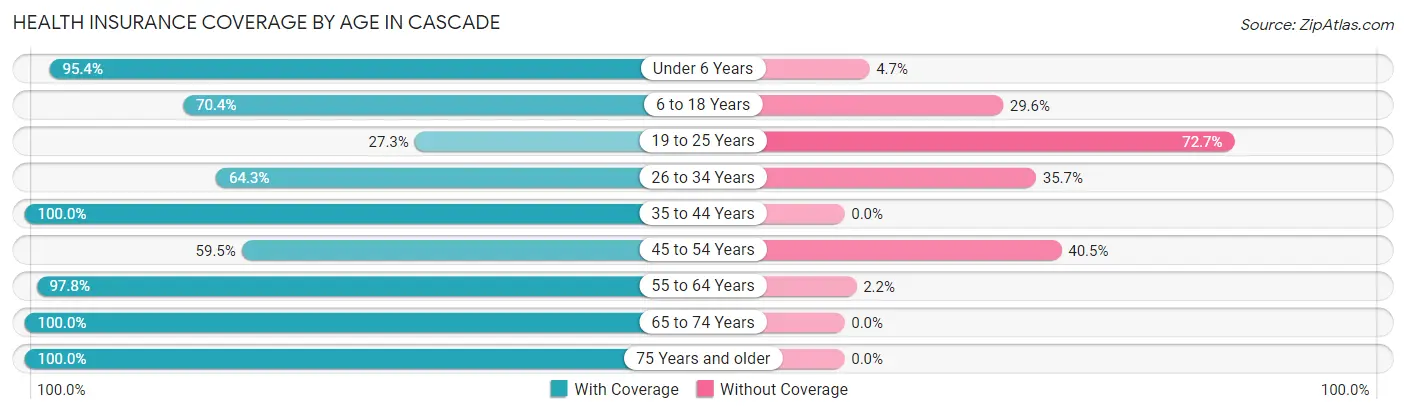
| Age Bracket | With Coverage | Without Coverage |
| Under 6 Years | 82 (95.4%) | 4 (4.6%) |
| 6 to 18 Years | 112 (70.4%) | 47 (29.6%) |
| 19 to 25 Years | 6 (27.3%) | 16 (72.7%) |
| 26 to 34 Years | 18 (64.3%) | 10 (35.7%) |
| 35 to 44 Years | 61 (100.0%) | 0 (0.0%) |
| 45 to 54 Years | 128 (59.5%) | 87 (40.5%) |
| 55 to 64 Years | 132 (97.8%) | 3 (2.2%) |
| 65 to 74 Years | 254 (100.0%) | 0 (0.0%) |
| 75 Years and older | 165 (100.0%) | 0 (0.0%) |
| Total | 958 (85.2%) | 167 (14.8%) |
Health Insurance Coverage by Citizenship Status in Cascade
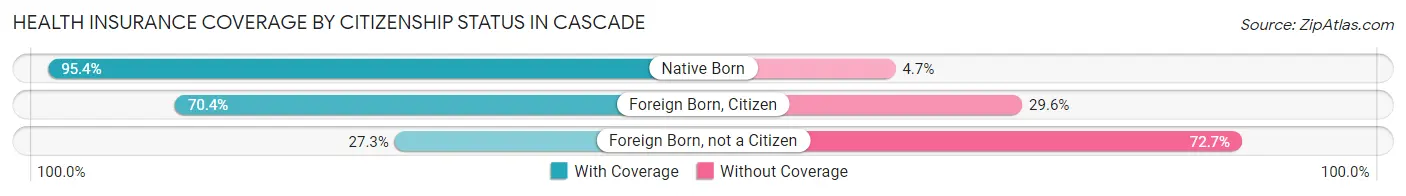
| Citizenship Status | With Coverage | Without Coverage |
| Native Born | 82 (95.4%) | 4 (4.6%) |
| Foreign Born, Citizen | 112 (70.4%) | 47 (29.6%) |
| Foreign Born, not a Citizen | 6 (27.3%) | 16 (72.7%) |
Health Insurance Coverage by Household Income in Cascade
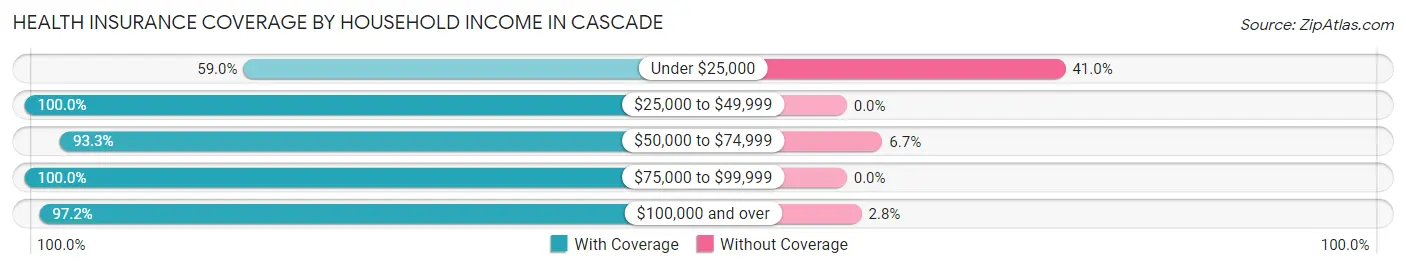
| Household Income | With Coverage | Without Coverage |
| Under $25,000 | 206 (59.0%) | 143 (41.0%) |
| $25,000 to $49,999 | 149 (100.0%) | 0 (0.0%) |
| $50,000 to $74,999 | 224 (93.3%) | 16 (6.7%) |
| $75,000 to $99,999 | 87 (100.0%) | 0 (0.0%) |
| $100,000 and over | 280 (97.2%) | 8 (2.8%) |
Public vs Private Health Insurance Coverage by Age in Cascade
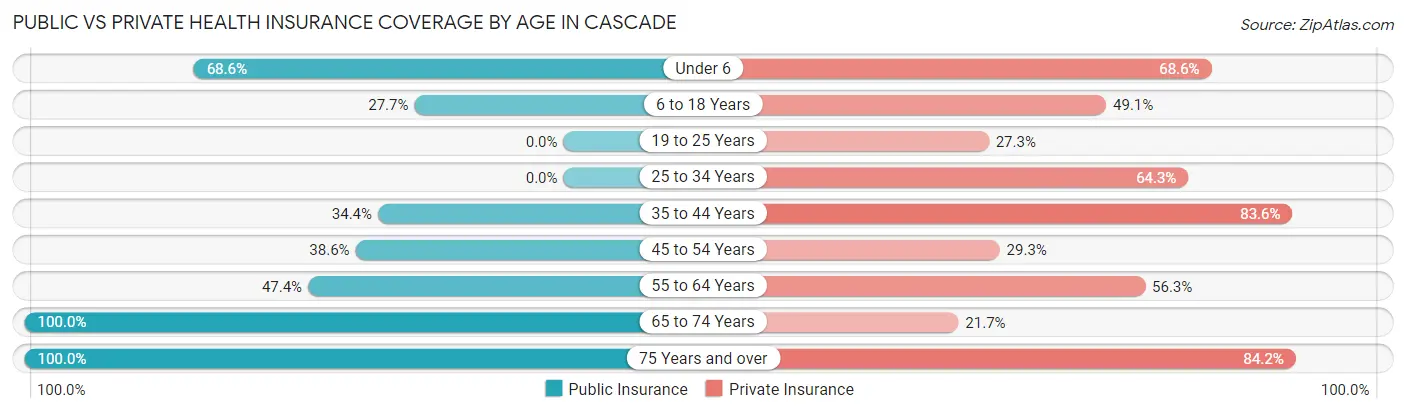
| Age Bracket | Public Insurance | Private Insurance |
| Under 6 | 59 (68.6%) | 59 (68.6%) |
| 6 to 18 Years | 44 (27.7%) | 78 (49.1%) |
| 19 to 25 Years | 0 (0.0%) | 6 (27.3%) |
| 25 to 34 Years | 0 (0.0%) | 18 (64.3%) |
| 35 to 44 Years | 21 (34.4%) | 51 (83.6%) |
| 45 to 54 Years | 83 (38.6%) | 63 (29.3%) |
| 55 to 64 Years | 64 (47.4%) | 76 (56.3%) |
| 65 to 74 Years | 254 (100.0%) | 55 (21.6%) |
| 75 Years and over | 165 (100.0%) | 139 (84.2%) |
| Total | 690 (61.3%) | 545 (48.4%) |
Disability Status by Sex by Age in Cascade
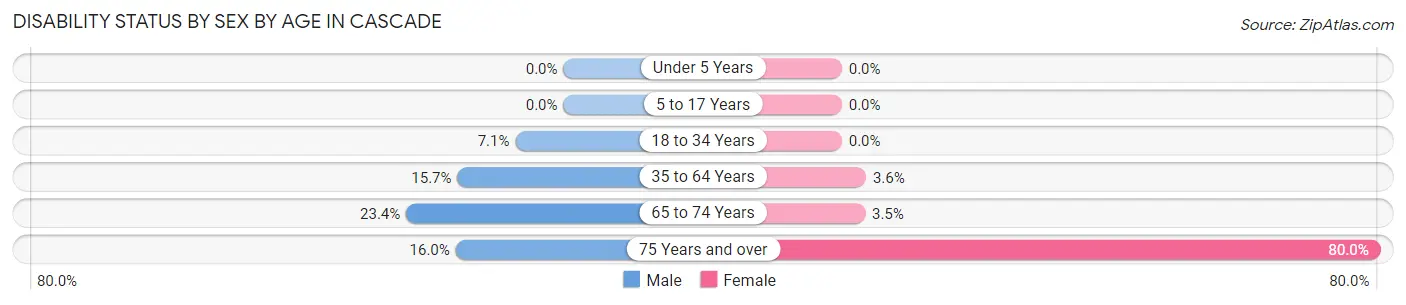
| Age Bracket | Male | Female |
| Under 5 Years | 0 (0.0%) | 0 (0.0%) |
| 5 to 17 Years | 0 (0.0%) | 0 (0.0%) |
| 18 to 34 Years | 2 (7.1%) | 0 (0.0%) |
| 35 to 64 Years | 34 (15.7%) | 7 (3.6%) |
| 65 to 74 Years | 39 (23.4%) | 3 (3.5%) |
| 75 Years and over | 4 (16.0%) | 112 (80.0%) |
Disability Class by Sex by Age in Cascade
Disability Class: Hearing Difficulty
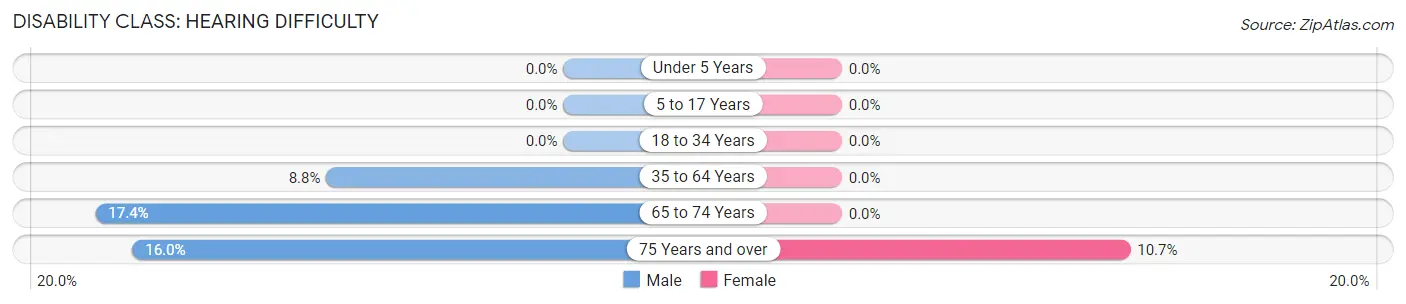
| Age Bracket | Male | Female |
| Under 5 Years | 0 (0.0%) | 0 (0.0%) |
| 5 to 17 Years | 0 (0.0%) | 0 (0.0%) |
| 18 to 34 Years | 0 (0.0%) | 0 (0.0%) |
| 35 to 64 Years | 19 (8.8%) | 0 (0.0%) |
| 65 to 74 Years | 29 (17.4%) | 0 (0.0%) |
| 75 Years and over | 4 (16.0%) | 15 (10.7%) |
Disability Class: Vision Difficulty
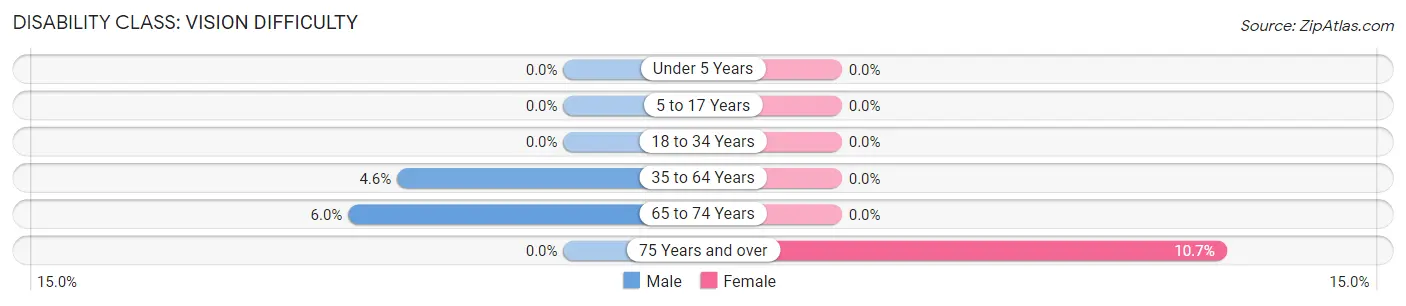
| Age Bracket | Male | Female |
| Under 5 Years | 0 (0.0%) | 0 (0.0%) |
| 5 to 17 Years | 0 (0.0%) | 0 (0.0%) |
| 18 to 34 Years | 0 (0.0%) | 0 (0.0%) |
| 35 to 64 Years | 10 (4.6%) | 0 (0.0%) |
| 65 to 74 Years | 10 (6.0%) | 0 (0.0%) |
| 75 Years and over | 0 (0.0%) | 15 (10.7%) |
Disability Class: Cognitive Difficulty
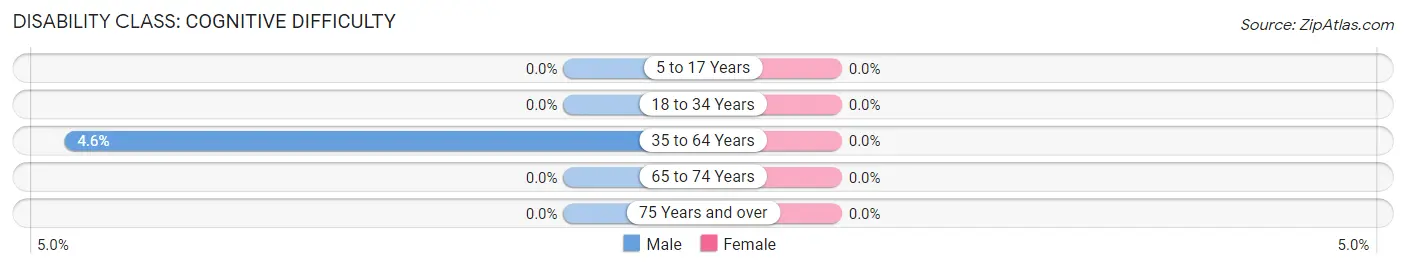
| Age Bracket | Male | Female |
| 5 to 17 Years | 0 (0.0%) | 0 (0.0%) |
| 18 to 34 Years | 0 (0.0%) | 0 (0.0%) |
| 35 to 64 Years | 10 (4.6%) | 0 (0.0%) |
| 65 to 74 Years | 0 (0.0%) | 0 (0.0%) |
| 75 Years and over | 0 (0.0%) | 0 (0.0%) |
Disability Class: Ambulatory Difficulty
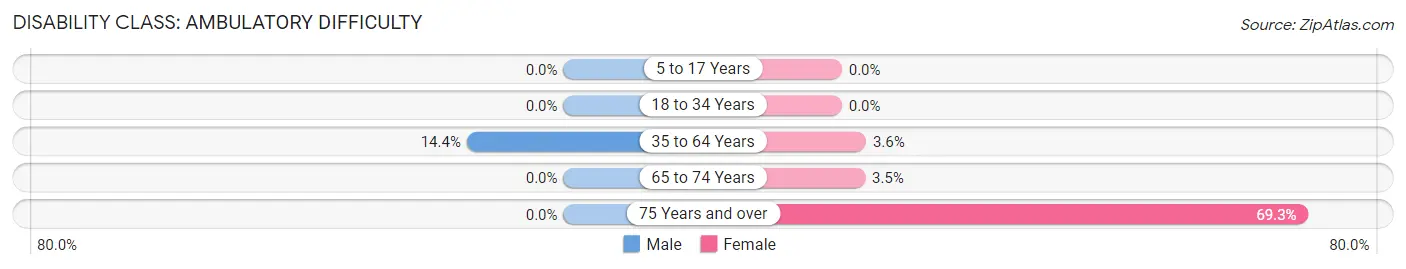
| Age Bracket | Male | Female |
| 5 to 17 Years | 0 (0.0%) | 0 (0.0%) |
| 18 to 34 Years | 0 (0.0%) | 0 (0.0%) |
| 35 to 64 Years | 31 (14.3%) | 7 (3.6%) |
| 65 to 74 Years | 0 (0.0%) | 3 (3.5%) |
| 75 Years and over | 0 (0.0%) | 97 (69.3%) |
Disability Class: Self-Care Difficulty
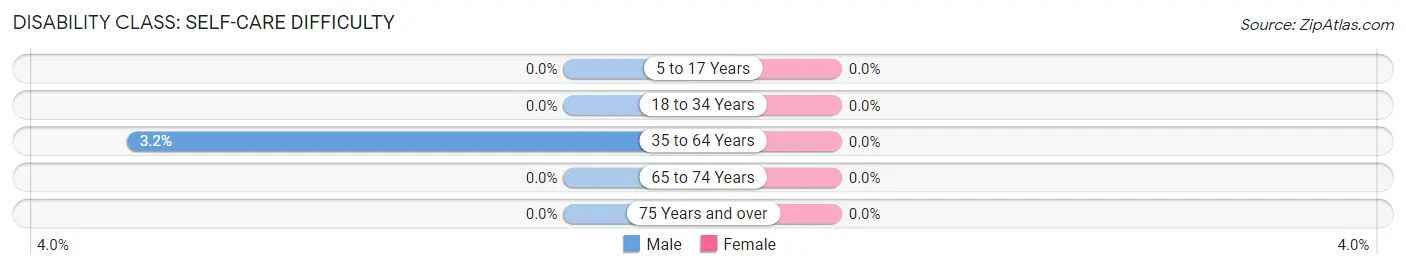
| Age Bracket | Male | Female |
| 5 to 17 Years | 0 (0.0%) | 0 (0.0%) |
| 18 to 34 Years | 0 (0.0%) | 0 (0.0%) |
| 35 to 64 Years | 7 (3.2%) | 0 (0.0%) |
| 65 to 74 Years | 0 (0.0%) | 0 (0.0%) |
| 75 Years and over | 0 (0.0%) | 0 (0.0%) |
Technology Access in Cascade
Computing Device Access in Cascade
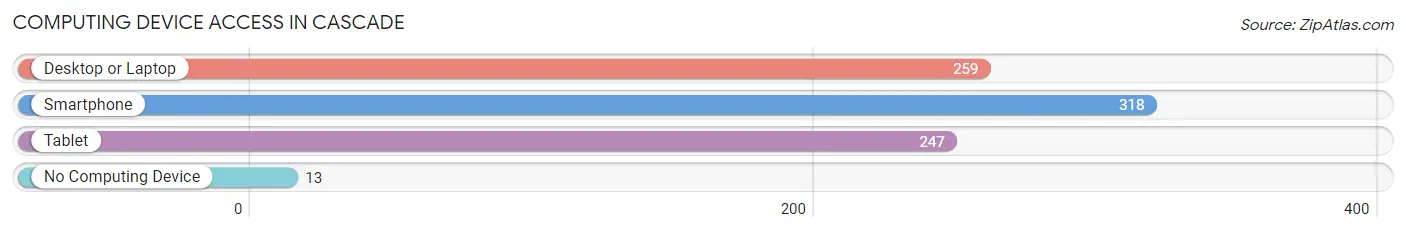
| Device Type | # Households | % Households |
| Desktop or Laptop | 259 | 72.4% |
| Smartphone | 318 | 88.8% |
| Tablet | 247 | 69.0% |
| No Computing Device | 13 | 3.6% |
| Total | 358 | 100.0% |
Internet Access in Cascade
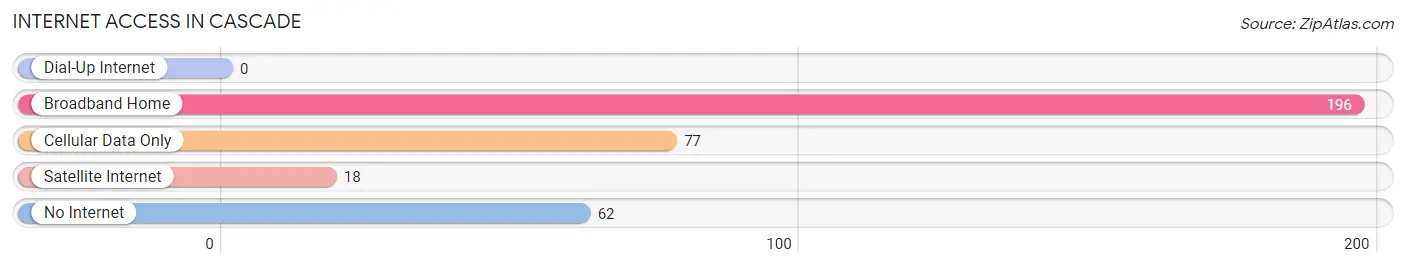
| Internet Type | # Households | % Households |
| Dial-Up Internet | 0 | 0.0% |
| Broadband Home | 196 | 54.7% |
| Cellular Data Only | 77 | 21.5% |
| Satellite Internet | 18 | 5.0% |
| No Internet | 62 | 17.3% |
| Total | 358 | 100.0% |
Cascade Summary
History
The history of the area in question dates back to the early 19th century when the first settlers arrived in the area. The area was originally inhabited by the indigenous people of the Cascade region, who were mainly of the Chinook and Salish tribes. The first settlers were mainly fur traders and trappers, who were attracted to the area due to its abundance of natural resources. The area was also attractive to settlers due to its proximity to the Columbia River, which provided a convenient transportation route for goods and people.
The area was officially established as the Cascade County in 1854, and the first county seat was located in the town of Cascade. The county was named after the Cascade Mountains, which are located in the area. The county was initially populated by settlers from the eastern United States, but over time, the population became more diverse as immigrants from other countries began to settle in the area.
The economy of the area was initially based on the fur trade, but as the population grew, so did the economy. Logging and mining became important industries in the area, and the area also became known for its agricultural production. The area was also home to several sawmills, which provided lumber for the growing population.
The area was also home to several Native American tribes, who had lived in the area for centuries. The tribes were largely self-sufficient, relying on hunting, fishing, and gathering for their sustenance. The tribes also had a strong cultural and spiritual connection to the land, which was reflected in their art and ceremonies.
Geography
The Cascade region is located in the northwestern United States, in the states of Washington and Oregon. The region is bordered by the Columbia River to the north, the Cascade Mountains to the east, and the Pacific Ocean to the west. The region is characterized by its rugged terrain, with steep mountains, deep valleys, and numerous rivers and streams. The climate of the region is generally mild, with warm summers and cool winters.
The Cascade region is home to several national parks and forests, including Mount Rainier National Park, North Cascades National Park, and Olympic National Park. The region is also home to several major rivers, including the Columbia, Snake, and Willamette Rivers. The region is also home to several major cities, including Seattle, Portland, and Spokane.
Economy
The economy of the Cascade region is largely based on the industries of logging, mining, and agriculture. The region is home to several major lumber companies, which harvest timber from the region’s forests. The region is also home to several major mining companies, which extract minerals from the region’s mountains. The region is also home to several major agricultural companies, which produce a variety of crops, including wheat, corn, and potatoes.
The region is also home to several major manufacturing companies, which produce a variety of products, including electronics, automobiles, and aircraft. The region is also home to several major technology companies, which produce a variety of software and hardware products. The region is also home to several major transportation companies, which provide transportation services to the region’s residents.
Demographics
The population of the Cascade region is estimated to be around 4.5 million people. The population is largely composed of people of European descent, with smaller numbers of African Americans, Asians, and Native Americans. The region is also home to a large number of immigrants, with the largest groups being from Mexico, the Philippines, and India.
The region is also home to several major universities, including the University of Washington, Washington State University, and Oregon State University. The region is also home to several major hospitals, including the Seattle Children’s Hospital and the Oregon Health & Science University. The region is also home to several major sports teams, including the Seattle Seahawks, Portland Trail Blazers, and Seattle Sounders.
Common Questions
What is Per Capita Income in Cascade?
Per Capita income in Cascade is $21,003.
What is the Median Family Income in Cascade?
Median Family Income in Cascade is $60,962.
What is the Median Household income in Cascade?
Median Household Income in Cascade is $48,700.
What is Income or Wage Gap in Cascade?
Income or Wage Gap in Cascade is 57.7%.
Women in Cascade earn 42.3 cents for every dollar earned by a man.
What is Inequality or Gini Index in Cascade?
Inequality or Gini Index in Cascade is 0.50.
What is the Total Population of Cascade?
Total Population of Cascade is 1,197.
What is the Total Male Population of Cascade?
Total Male Population of Cascade is 588.
What is the Total Female Population of Cascade?
Total Female Population of Cascade is 609.
What is the Ratio of Males per 100 Females in Cascade?
There are 96.55 Males per 100 Females in Cascade.
What is the Ratio of Females per 100 Males in Cascade?
There are 103.57 Females per 100 Males in Cascade.
What is the Median Population Age in Cascade?
Median Population Age in Cascade is 53.4 Years.
What is the Average Family Size in Cascade
Average Family Size in Cascade is 4.0 People.
What is the Average Household Size in Cascade
Average Household Size in Cascade is 3.1 People.
How Large is the Labor Force in Cascade?
There are 234 People in the Labor Forcein in Cascade.
What is the Percentage of People in the Labor Force in Cascade?
23.1% of People are in the Labor Force in Cascade.
What is the Unemployment Rate in Cascade?
Unemployment Rate in Cascade is 4.7%.