Bonners Ferry, ID Map & Demographics
Bonners Ferry Map
Bonners Ferry Overview
$21,376
PER CAPITA INCOME
$53,056
AVG FAMILY INCOME
$46,667
AVG HOUSEHOLD INCOME
12.4%
WAGE / INCOME GAP [ % ]
87.6¢/ $1
WAGE / INCOME GAP [ $ ]
0.37
INEQUALITY / GINI INDEX
2,558
TOTAL POPULATION
1,365
MALE POPULATION
1,193
FEMALE POPULATION
114.42
MALES / 100 FEMALES
87.40
FEMALES / 100 MALES
40.5
MEDIAN AGE
3.2
AVG FAMILY SIZE
2.7
AVG HOUSEHOLD SIZE
1,181
LABOR FORCE [ PEOPLE ]
59.3%
PERCENT IN LABOR FORCE
0.9%
UNEMPLOYMENT RATE
Bonners Ferry Zip Codes
Bonners Ferry Area Codes
Income in Bonners Ferry
Income Overview in Bonners Ferry
Per Capita Income in Bonners Ferry is $21,376, while median incomes of families and households are $53,056 and $46,667 respectively.
| Characteristic | Number | Measure |
| Per Capita Income | 2,558 | $21,376 |
| Median Family Income | 498 | $53,056 |
| Mean Family Income | 498 | $59,364 |
| Median Household Income | 908 | $46,667 |
| Mean Household Income | 908 | $55,034 |
| Income Deficit | 498 | $0 |
| Wage / Income Gap (%) | 2,558 | 12.36% |
| Wage / Income Gap ($) | 2,558 | 87.64¢ per $1 |
| Gini / Inequality Index | 2,558 | 0.37 |
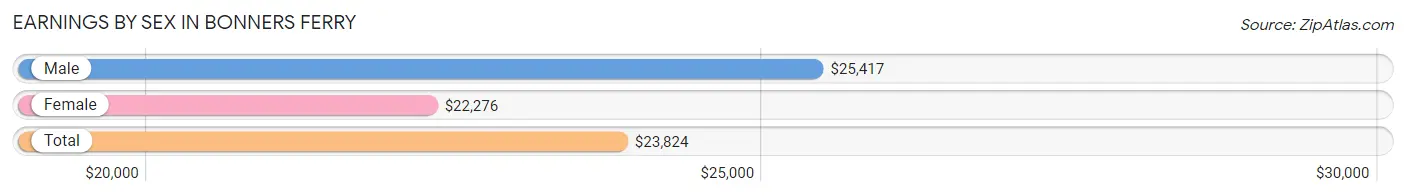
Earnings by Sex in Bonners Ferry
Average Earnings in Bonners Ferry are $23,824, $25,417 for men and $22,276 for women, a difference of 12.4%.
| Sex | Number | Average Earnings |
| Male | 756 (59.5%) | $25,417 |
| Female | 514 (40.5%) | $22,276 |
| Total | 1,270 (100.0%) | $23,824 |
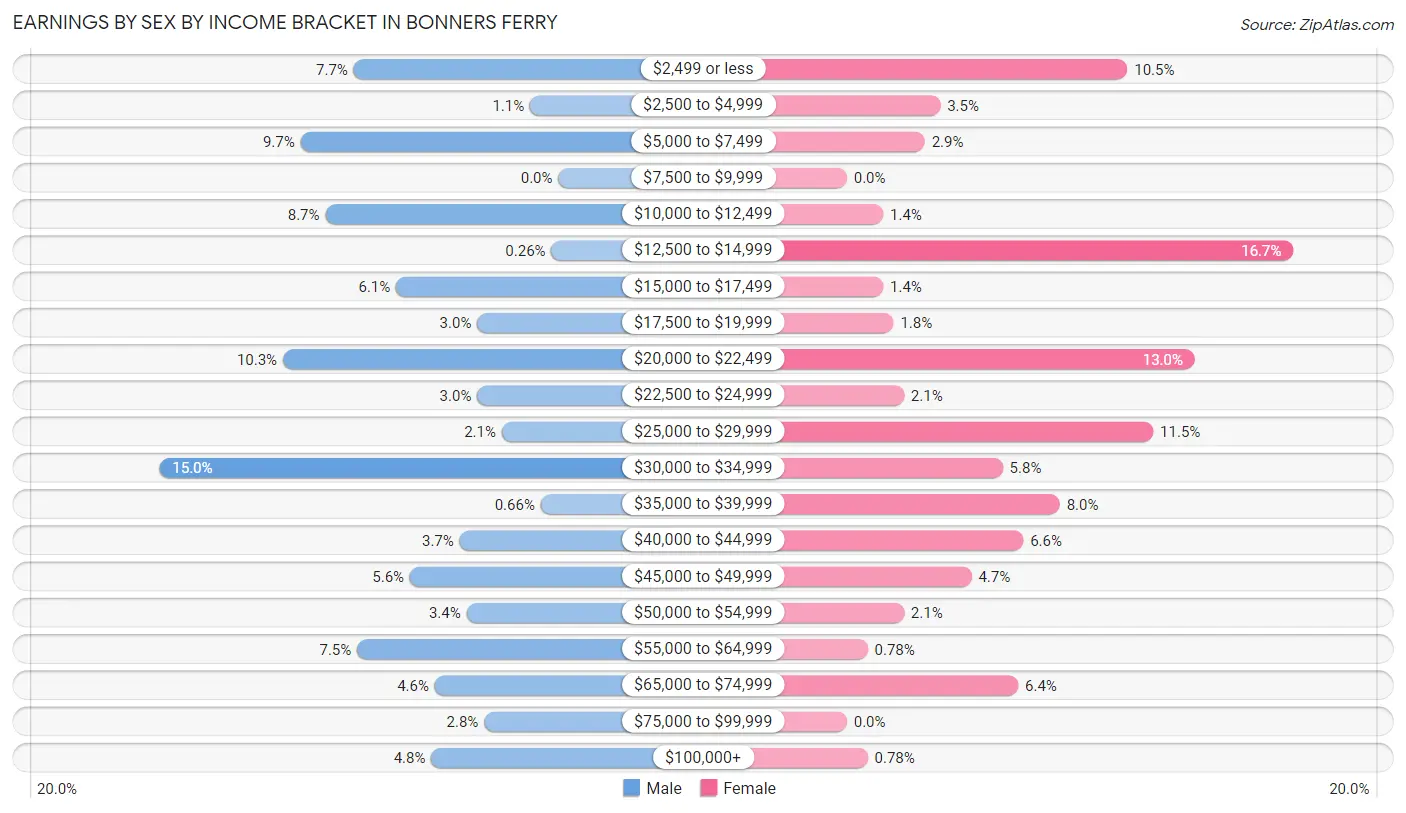
Earnings by Sex by Income Bracket in Bonners Ferry
The most common earnings brackets in Bonners Ferry are $30,000 to $34,999 for men (113 | 14.9%) and $12,500 to $14,999 for women (86 | 16.7%).
| Income | Male | Female |
| $2,499 or less | 58 (7.7%) | 54 (10.5%) |
| $2,500 to $4,999 | 8 (1.1%) | 18 (3.5%) |
| $5,000 to $7,499 | 73 (9.7%) | 15 (2.9%) |
| $7,500 to $9,999 | 0 (0.0%) | 0 (0.0%) |
| $10,000 to $12,499 | 66 (8.7%) | 7 (1.4%) |
| $12,500 to $14,999 | 2 (0.3%) | 86 (16.7%) |
| $15,000 to $17,499 | 46 (6.1%) | 7 (1.4%) |
| $17,500 to $19,999 | 23 (3.0%) | 9 (1.8%) |
| $20,000 to $22,499 | 78 (10.3%) | 67 (13.0%) |
| $22,500 to $24,999 | 23 (3.0%) | 11 (2.1%) |
| $25,000 to $29,999 | 16 (2.1%) | 59 (11.5%) |
| $30,000 to $34,999 | 113 (14.9%) | 30 (5.8%) |
| $35,000 to $39,999 | 5 (0.7%) | 41 (8.0%) |
| $40,000 to $44,999 | 28 (3.7%) | 34 (6.6%) |
| $45,000 to $49,999 | 42 (5.6%) | 24 (4.7%) |
| $50,000 to $54,999 | 26 (3.4%) | 11 (2.1%) |
| $55,000 to $64,999 | 57 (7.5%) | 4 (0.8%) |
| $65,000 to $74,999 | 35 (4.6%) | 33 (6.4%) |
| $75,000 to $99,999 | 21 (2.8%) | 0 (0.0%) |
| $100,000+ | 36 (4.8%) | 4 (0.8%) |
| Total | 756 (100.0%) | 514 (100.0%) |
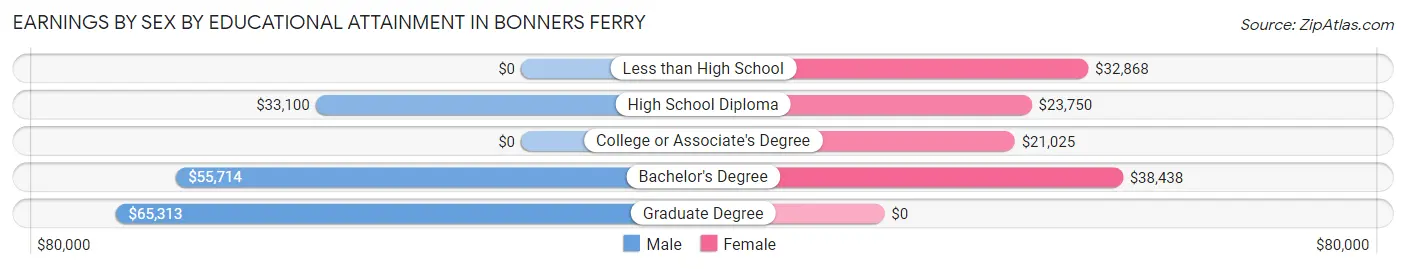
Earnings by Sex by Educational Attainment in Bonners Ferry
Average earnings in Bonners Ferry are $29,125 for men and $24,886 for women, a difference of 14.5%. Men with an educational attainment of graduate degree enjoy the highest average annual earnings of $65,313, while those with high school diploma education earn the least with $33,100. Women with an educational attainment of bachelor's degree earn the most with the average annual earnings of $38,438, while those with college or associate's degree education have the smallest earnings of $21,025.
| Educational Attainment | Male Income | Female Income |
| Less than High School | - | - |
| High School Diploma | $33,100 | $23,750 |
| College or Associate's Degree | - | - |
| Bachelor's Degree | $55,714 | $38,438 |
| Graduate Degree | $65,313 | $0 |
| Total | $29,125 | $24,886 |
Family Income in Bonners Ferry
Family Income Brackets in Bonners Ferry
According to the Bonners Ferry family income data, there are 150 families falling into the $50,000 to $74,999 income range, which is the most common income bracket and makes up 30.1% of all families.
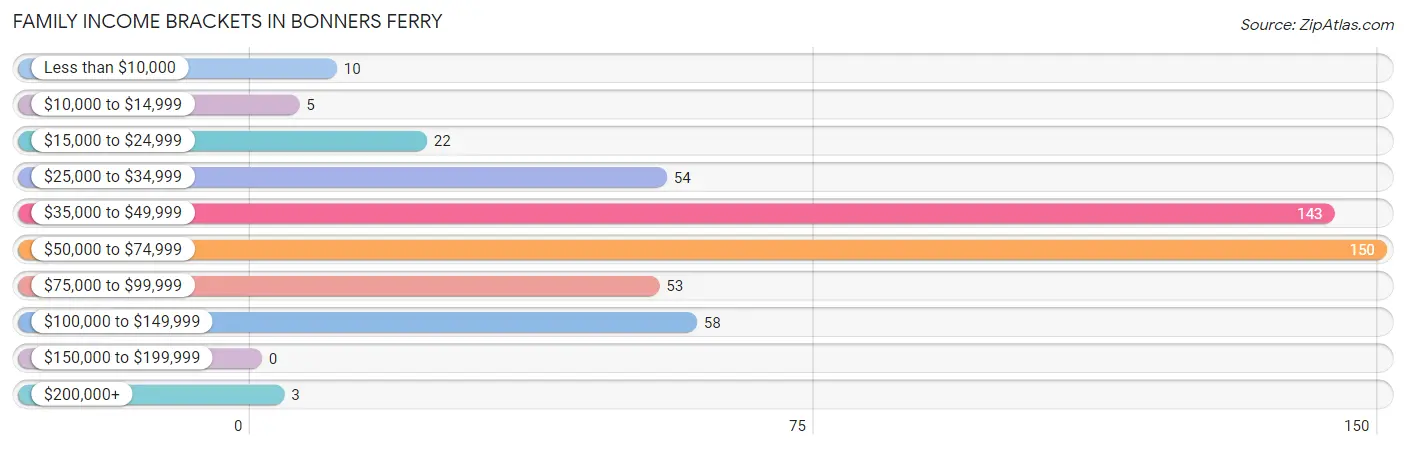
| Income Bracket | # Families | % Families |
| Less than $10,000 | 10 | 2.0% |
| $10,000 to $14,999 | 5 | 1.0% |
| $15,000 to $24,999 | 22 | 4.4% |
| $25,000 to $34,999 | 54 | 10.8% |
| $35,000 to $49,999 | 143 | 28.7% |
| $50,000 to $74,999 | 150 | 30.1% |
| $75,000 to $99,999 | 53 | 10.6% |
| $100,000 to $149,999 | 58 | 11.6% |
| $150,000 to $199,999 | 0 | 0.0% |
| $200,000+ | 3 | 0.6% |
Family Income by Famaliy Size in Bonners Ferry
5-person families (33 | 6.6%) account for the highest median family income in Bonners Ferry with $96,827 per family, while 2-person families (240 | 48.2%) have the highest median income of $19,678 per family member.
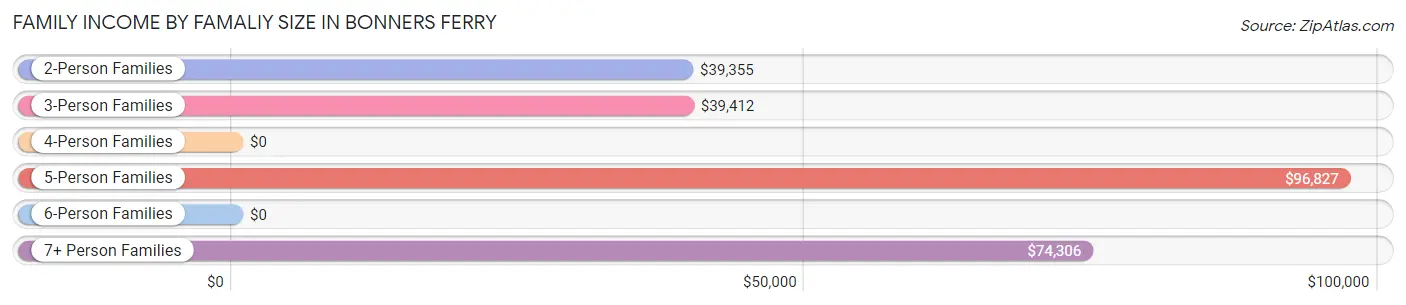
| Income Bracket | # Families | Median Income |
| 2-Person Families | 240 (48.2%) | $39,355 |
| 3-Person Families | 86 (17.3%) | $39,412 |
| 4-Person Families | 101 (20.3%) | $0 |
| 5-Person Families | 33 (6.6%) | $96,827 |
| 6-Person Families | 7 (1.4%) | $0 |
| 7+ Person Families | 31 (6.2%) | $74,306 |
| Total | 498 (100.0%) | $53,056 |
Family Income by Number of Earners in Bonners Ferry
The median family income in Bonners Ferry is $53,056, with families comprising 3+ earners (46) having the highest median family income of $74,318, while families with 1 earner (187) have the lowest median family income of $35,594, accounting for 9.2% and 37.6% of families, respectively.
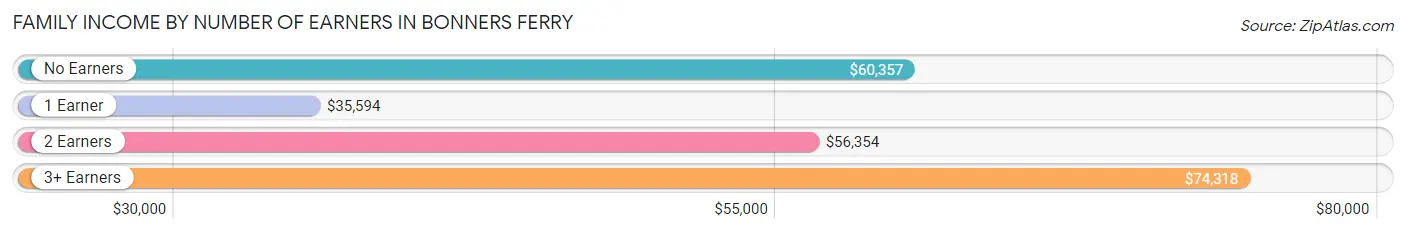
| Number of Earners | # Families | Median Income |
| No Earners | 44 (8.8%) | $60,357 |
| 1 Earner | 187 (37.6%) | $35,594 |
| 2 Earners | 221 (44.4%) | $56,354 |
| 3+ Earners | 46 (9.2%) | $74,318 |
| Total | 498 (100.0%) | $53,056 |
Household Income in Bonners Ferry
Household Income Brackets in Bonners Ferry
With 194 households falling in the category, the $50,000 to $74,999 income range is the most frequent in Bonners Ferry, accounting for 21.4% of all households.
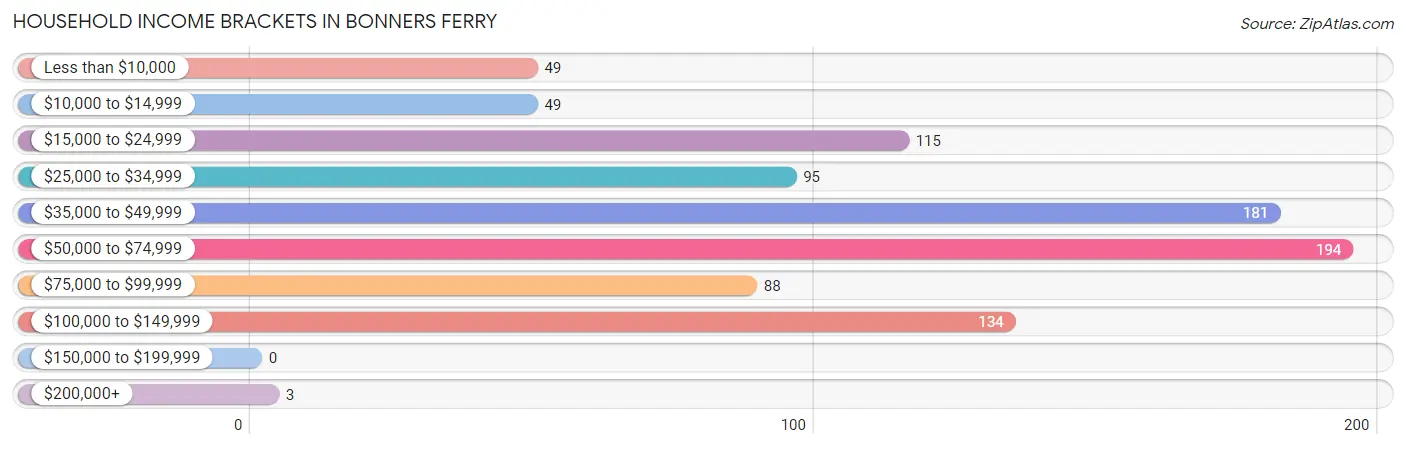
| Income Bracket | # Households | % Households |
| Less than $10,000 | 49 | 5.4% |
| $10,000 to $14,999 | 49 | 5.4% |
| $15,000 to $24,999 | 115 | 12.7% |
| $25,000 to $34,999 | 95 | 10.5% |
| $35,000 to $49,999 | 181 | 19.9% |
| $50,000 to $74,999 | 194 | 21.4% |
| $75,000 to $99,999 | 88 | 9.7% |
| $100,000 to $149,999 | 134 | 14.8% |
| $150,000 to $199,999 | 0 | 0.0% |
| $200,000+ | 3 | 0.3% |
Household Income by Householder Age in Bonners Ferry
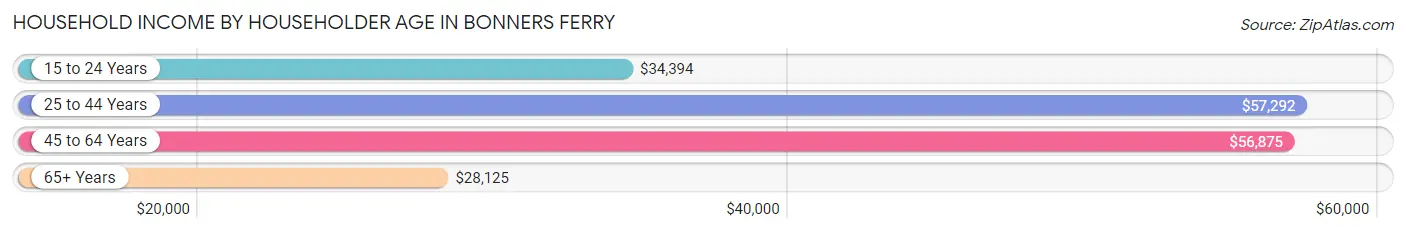
The median household income in Bonners Ferry is $46,667, with the highest median household income of $57,292 found in the 25 to 44 years age bracket for the primary householder. A total of 272 households (30.0%) fall into this category. Meanwhile, the 65+ years age bracket for the primary householder has the lowest median household income of $28,125, with 283 households (31.2%) in this group.
| Income Bracket | # Households | Median Income |
| 15 to 24 Years | 50 (5.5%) | $34,394 |
| 25 to 44 Years | 272 (30.0%) | $57,292 |
| 45 to 64 Years | 303 (33.4%) | $56,875 |
| 65+ Years | 283 (31.2%) | $28,125 |
| Total | 908 (100.0%) | $46,667 |
Poverty in Bonners Ferry
Income Below Poverty by Sex and Age in Bonners Ferry
With 14.4% poverty level for males and 25.2% for females among the residents of Bonners Ferry, 16 and 17 year old males and 45 to 54 year old females are the most vulnerable to poverty, with 13 males (68.4%) and 148 females (71.5%) in their respective age groups living below the poverty level.
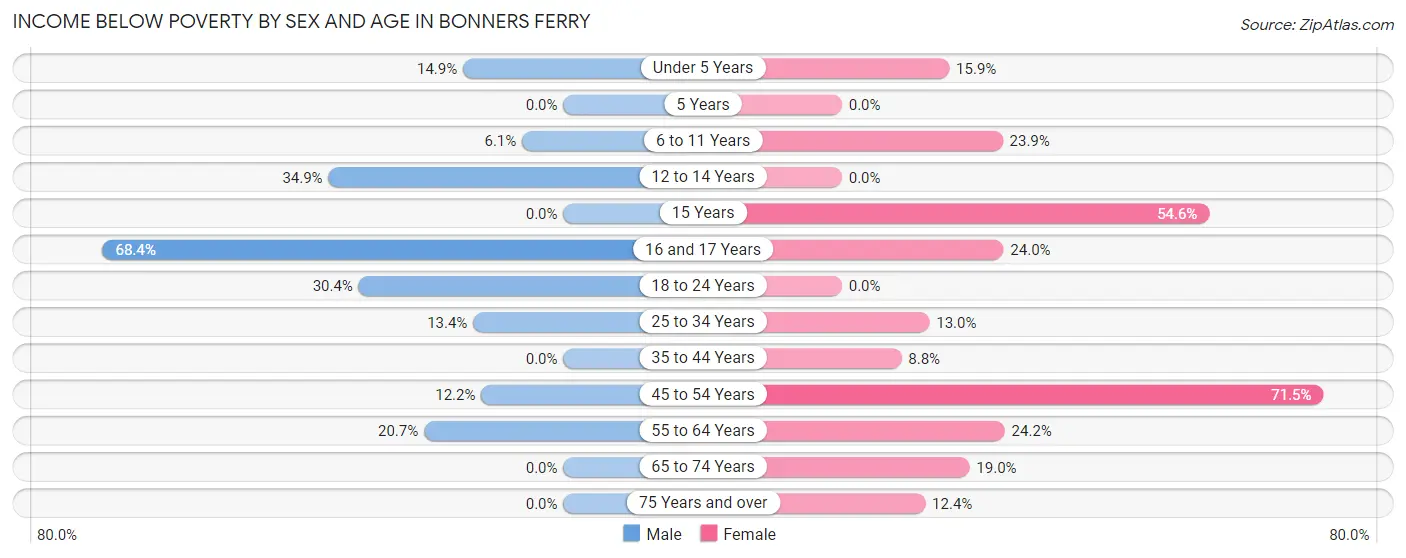
| Age Bracket | Male | Female |
| Under 5 Years | 28 (14.9%) | 11 (15.9%) |
| 5 Years | 0 (0.0%) | 0 (0.0%) |
| 6 to 11 Years | 6 (6.1%) | 16 (23.9%) |
| 12 to 14 Years | 15 (34.9%) | 0 (0.0%) |
| 15 Years | 0 (0.0%) | 12 (54.5%) |
| 16 and 17 Years | 13 (68.4%) | 6 (24.0%) |
| 18 to 24 Years | 55 (30.4%) | 0 (0.0%) |
| 25 to 34 Years | 17 (13.4%) | 20 (13.0%) |
| 35 to 44 Years | 0 (0.0%) | 16 (8.8%) |
| 45 to 54 Years | 38 (12.2%) | 148 (71.5%) |
| 55 to 64 Years | 12 (20.7%) | 22 (24.2%) |
| 65 to 74 Years | 0 (0.0%) | 29 (19.0%) |
| 75 Years and over | 0 (0.0%) | 13 (12.4%) |
| Total | 184 (14.4%) | 293 (25.2%) |
Income Above Poverty by Sex and Age in Bonners Ferry
According to the poverty statistics in Bonners Ferry, males aged 5 years and females aged 5 years are the age groups that are most secure financially, with 100.0% of males and 100.0% of females in these age groups living above the poverty line.
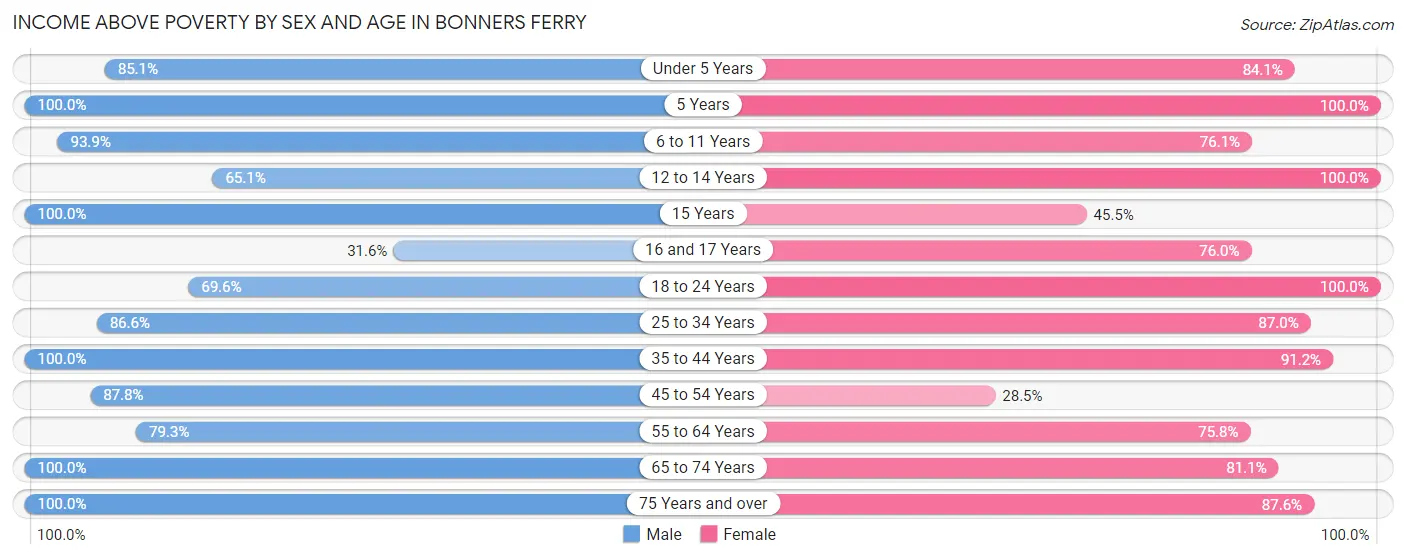
| Age Bracket | Male | Female |
| Under 5 Years | 160 (85.1%) | 58 (84.1%) |
| 5 Years | 2 (100.0%) | 27 (100.0%) |
| 6 to 11 Years | 92 (93.9%) | 51 (76.1%) |
| 12 to 14 Years | 28 (65.1%) | 32 (100.0%) |
| 15 Years | 19 (100.0%) | 10 (45.5%) |
| 16 and 17 Years | 6 (31.6%) | 19 (76.0%) |
| 18 to 24 Years | 126 (69.6%) | 29 (100.0%) |
| 25 to 34 Years | 110 (86.6%) | 134 (87.0%) |
| 35 to 44 Years | 104 (100.0%) | 165 (91.2%) |
| 45 to 54 Years | 274 (87.8%) | 59 (28.5%) |
| 55 to 64 Years | 46 (79.3%) | 69 (75.8%) |
| 65 to 74 Years | 107 (100.0%) | 124 (81.0%) |
| 75 Years and over | 17 (100.0%) | 92 (87.6%) |
| Total | 1,091 (85.6%) | 869 (74.8%) |
Income Below Poverty Among Married-Couple Families in Bonners Ferry
The poverty statistics for married-couple families in Bonners Ferry show that 9.3% or 36 of the total 387 families live below the poverty line. Families with 5 or more children have the highest poverty rate of 29.0%, comprising of 9 families. On the other hand, families with 3 or 4 children have the lowest poverty rate of 0.0%, which includes 0 families.
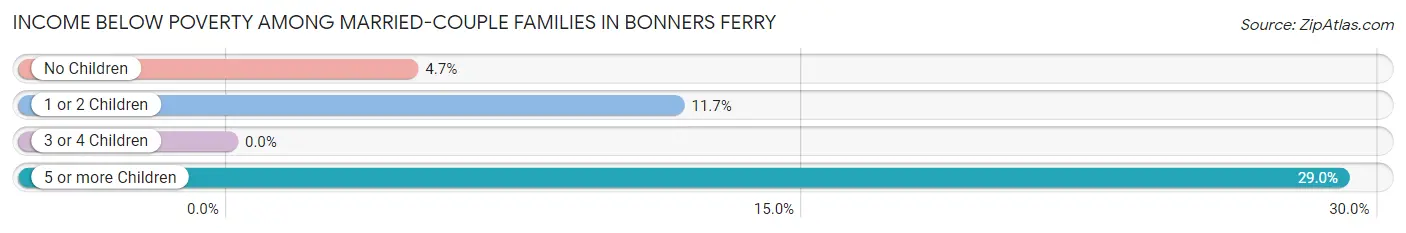
| Children | Above Poverty | Below Poverty |
| No Children | 162 (95.3%) | 8 (4.7%) |
| 1 or 2 Children | 144 (88.3%) | 19 (11.7%) |
| 3 or 4 Children | 23 (100.0%) | 0 (0.0%) |
| 5 or more Children | 22 (71.0%) | 9 (29.0%) |
| Total | 351 (90.7%) | 36 (9.3%) |
Income Below Poverty Among Single-Parent Households in Bonners Ferry
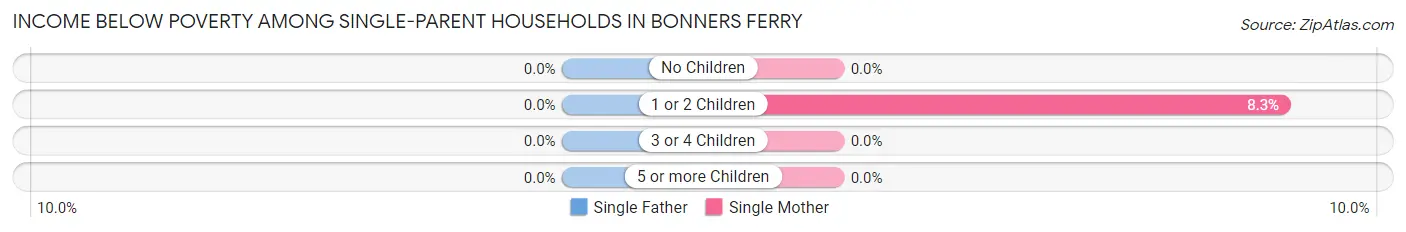
| Children | Single Father | Single Mother |
| No Children | 0 (0.0%) | 0 (0.0%) |
| 1 or 2 Children | 0 (0.0%) | 5 (8.3%) |
| 3 or 4 Children | 0 (0.0%) | 0 (0.0%) |
| 5 or more Children | 0 (0.0%) | 0 (0.0%) |
| Total | 0 (0.0%) | 5 (7.3%) |
Income Below Poverty Among Married-Couple vs Single-Parent Households in Bonners Ferry
The poverty data for Bonners Ferry shows that 36 of the married-couple family households (9.3%) and 5 of the single-parent households (4.5%) are living below the poverty level. Within the married-couple family households, those with 5 or more children have the highest poverty rate, with 9 households (29.0%) falling below the poverty line. Among the single-parent households, those with 1 or 2 children have the highest poverty rate, with 5 household (7.9%) living below poverty.
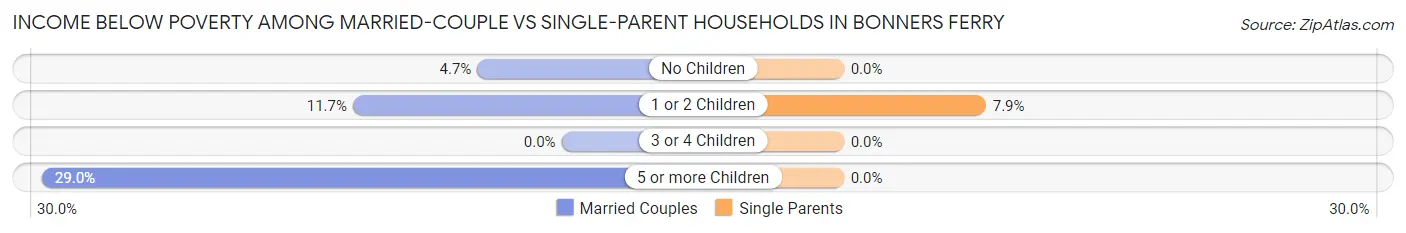
| Children | Married-Couple Families | Single-Parent Households |
| No Children | 8 (4.7%) | 0 (0.0%) |
| 1 or 2 Children | 19 (11.7%) | 5 (7.9%) |
| 3 or 4 Children | 0 (0.0%) | 0 (0.0%) |
| 5 or more Children | 9 (29.0%) | 0 (0.0%) |
| Total | 36 (9.3%) | 5 (4.5%) |
Race in Bonners Ferry
The most populous races in Bonners Ferry are White / Caucasian (2,278 | 89.0%), Hispanic or Latino (161 | 6.3%), and Two or more Races (98 | 3.8%).
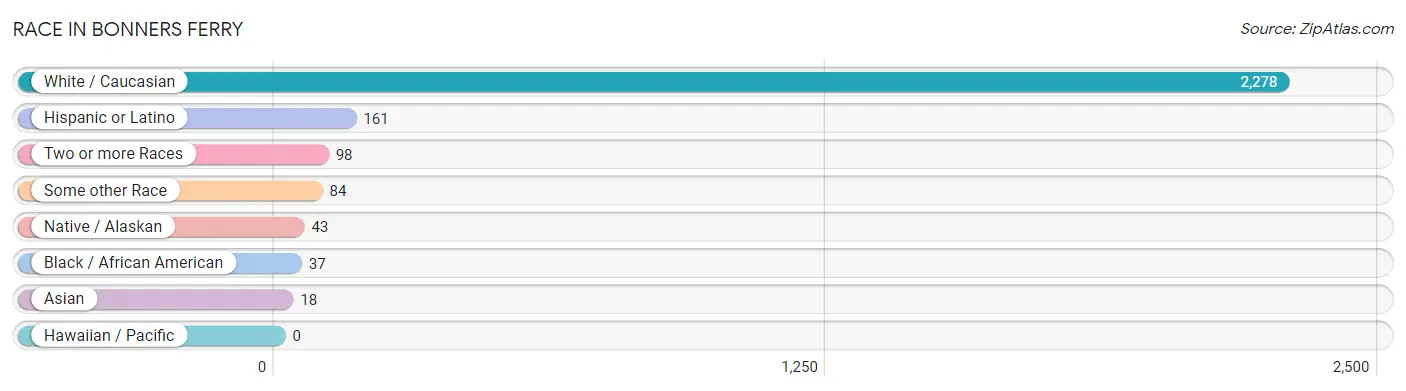
| Race | # Population | % Population |
| Asian | 18 | 0.7% |
| Black / African American | 37 | 1.5% |
| Hawaiian / Pacific | 0 | 0.0% |
| Hispanic or Latino | 161 | 6.3% |
| Native / Alaskan | 43 | 1.7% |
| White / Caucasian | 2,278 | 89.0% |
| Two or more Races | 98 | 3.8% |
| Some other Race | 84 | 3.3% |
| Total | 2,558 | 100.0% |
Ancestry in Bonners Ferry
The most populous ancestries reported in Bonners Ferry are German (252 | 9.9%), English (248 | 9.7%), American (242 | 9.5%), Irish (167 | 6.5%), and Danish (110 | 4.3%), together accounting for 39.8% of all Bonners Ferry residents.
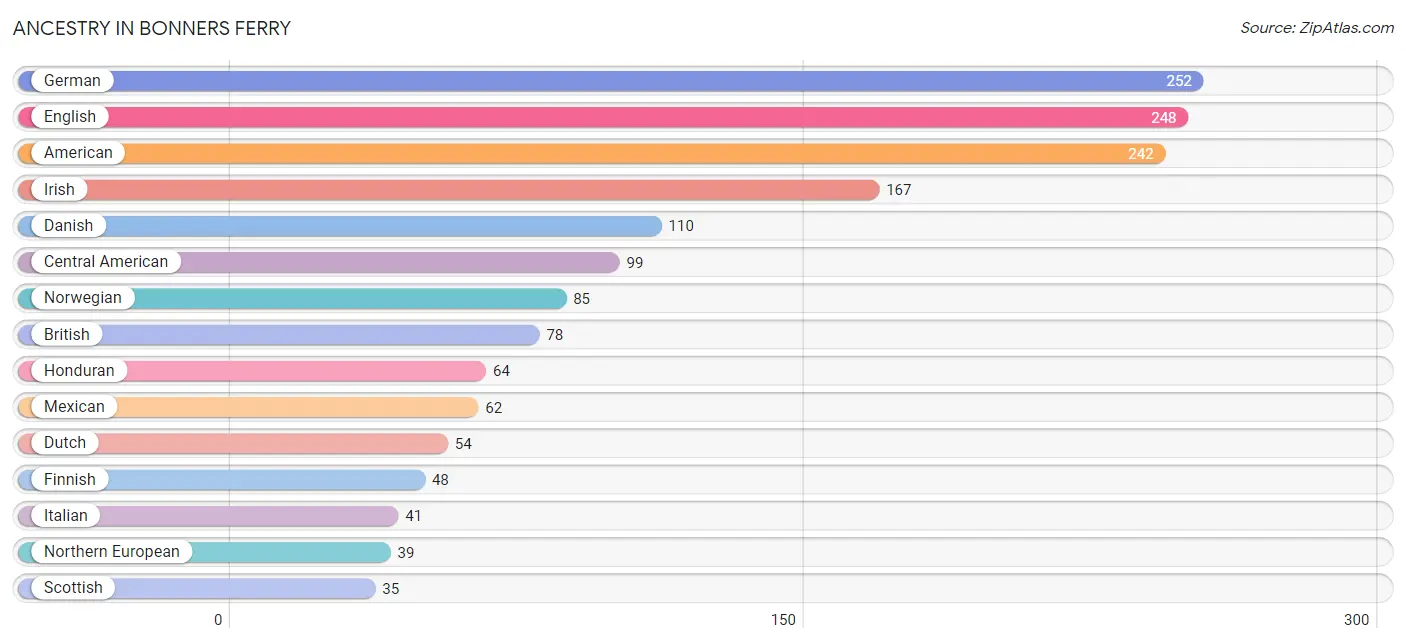
| Ancestry | # Population | % Population |
| American | 242 | 9.5% |
| Arab | 5 | 0.2% |
| Bhutanese | 8 | 0.3% |
| Brazilian | 3 | 0.1% |
| British | 78 | 3.0% |
| Canadian | 20 | 0.8% |
| Central American | 99 | 3.9% |
| Chippewa | 1 | 0.0% |
| Czech | 3 | 0.1% |
| Danish | 110 | 4.3% |
| Dutch | 54 | 2.1% |
| English | 248 | 9.7% |
| European | 31 | 1.2% |
| Finnish | 48 | 1.9% |
| French | 13 | 0.5% |
| French Canadian | 3 | 0.1% |
| German | 252 | 9.9% |
| Honduran | 64 | 2.5% |
| Indian (Asian) | 4 | 0.2% |
| Irish | 167 | 6.5% |
| Italian | 41 | 1.6% |
| Korean | 15 | 0.6% |
| Lebanese | 5 | 0.2% |
| Mexican | 62 | 2.4% |
| Northern European | 39 | 1.5% |
| Norwegian | 85 | 3.3% |
| Ottawa | 31 | 1.2% |
| Panamanian | 22 | 0.9% |
| Polish | 33 | 1.3% |
| Salvadoran | 13 | 0.5% |
| Scandinavian | 10 | 0.4% |
| Scotch-Irish | 2 | 0.1% |
| Scottish | 35 | 1.4% |
| Swedish | 18 | 0.7% |
| Swiss | 8 | 0.3% |
| Ukrainian | 4 | 0.2% |
| Ute | 3 | 0.1% |
| Welsh | 4 | 0.2% | View All 38 Rows |
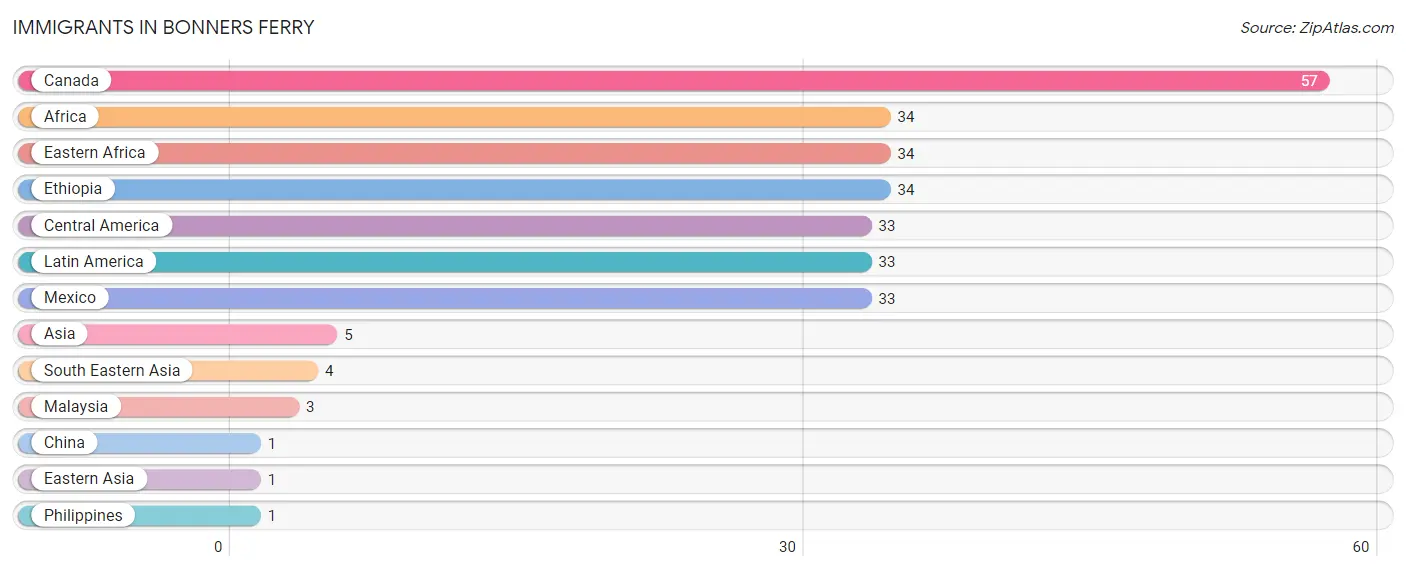
Immigrants in Bonners Ferry
The most numerous immigrant groups reported in Bonners Ferry came from Canada (57 | 2.2%), Africa (34 | 1.3%), Eastern Africa (34 | 1.3%), Ethiopia (34 | 1.3%), and Central America (33 | 1.3%), together accounting for 7.5% of all Bonners Ferry residents.
| Immigration Origin | # Population | % Population |
| Africa | 34 | 1.3% |
| Asia | 5 | 0.2% |
| Canada | 57 | 2.2% |
| Central America | 33 | 1.3% |
| China | 1 | 0.0% |
| Eastern Africa | 34 | 1.3% |
| Eastern Asia | 1 | 0.0% |
| Ethiopia | 34 | 1.3% |
| Latin America | 33 | 1.3% |
| Malaysia | 3 | 0.1% |
| Mexico | 33 | 1.3% |
| Philippines | 1 | 0.0% |
| South Eastern Asia | 4 | 0.2% | View All 13 Rows |
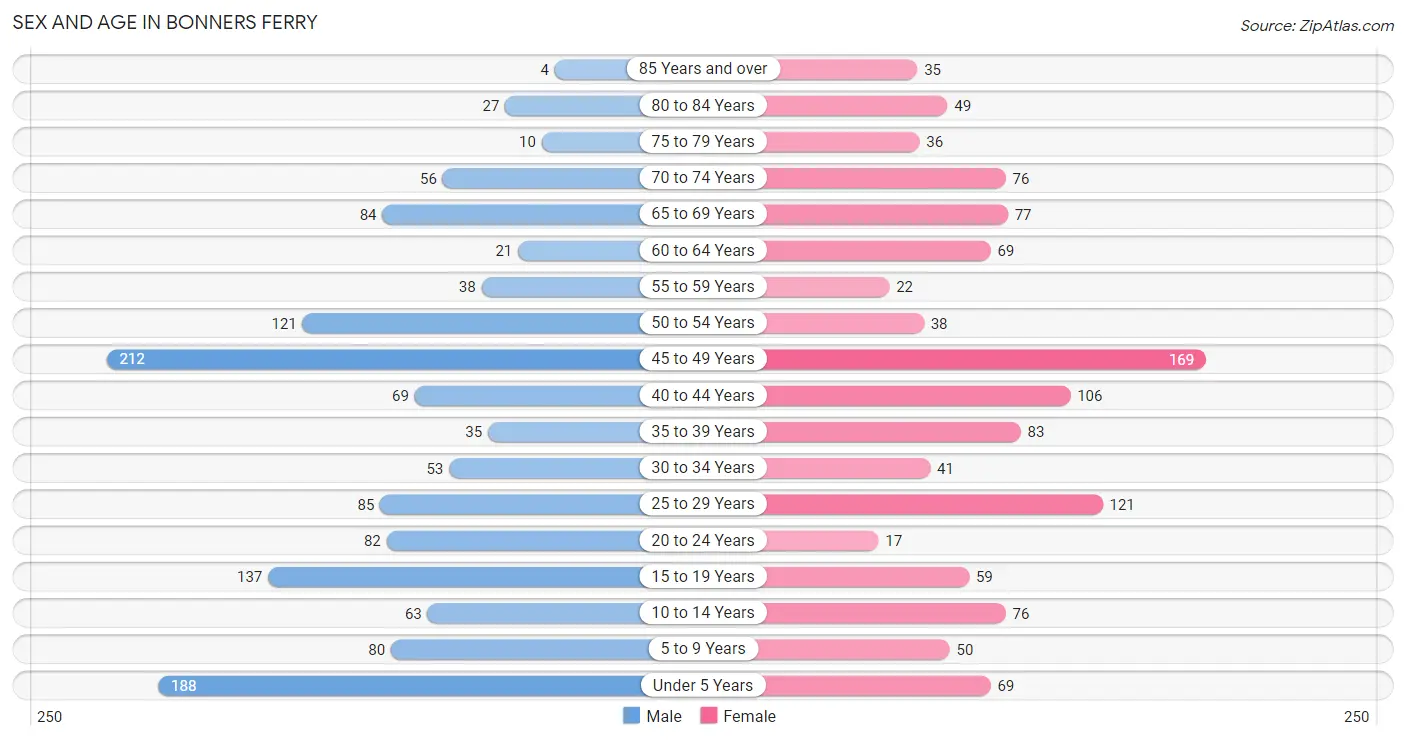
Sex and Age in Bonners Ferry
Sex and Age in Bonners Ferry
The most populous age groups in Bonners Ferry are 45 to 49 Years (212 | 15.5%) for men and 45 to 49 Years (169 | 14.2%) for women.
| Age Bracket | Male | Female |
| Under 5 Years | 188 (13.8%) | 69 (5.8%) |
| 5 to 9 Years | 80 (5.9%) | 50 (4.2%) |
| 10 to 14 Years | 63 (4.6%) | 76 (6.4%) |
| 15 to 19 Years | 137 (10.0%) | 59 (5.0%) |
| 20 to 24 Years | 82 (6.0%) | 17 (1.4%) |
| 25 to 29 Years | 85 (6.2%) | 121 (10.1%) |
| 30 to 34 Years | 53 (3.9%) | 41 (3.4%) |
| 35 to 39 Years | 35 (2.6%) | 83 (7.0%) |
| 40 to 44 Years | 69 (5.1%) | 106 (8.9%) |
| 45 to 49 Years | 212 (15.5%) | 169 (14.2%) |
| 50 to 54 Years | 121 (8.9%) | 38 (3.2%) |
| 55 to 59 Years | 38 (2.8%) | 22 (1.8%) |
| 60 to 64 Years | 21 (1.5%) | 69 (5.8%) |
| 65 to 69 Years | 84 (6.1%) | 77 (6.5%) |
| 70 to 74 Years | 56 (4.1%) | 76 (6.4%) |
| 75 to 79 Years | 10 (0.7%) | 36 (3.0%) |
| 80 to 84 Years | 27 (2.0%) | 49 (4.1%) |
| 85 Years and over | 4 (0.3%) | 35 (2.9%) |
| Total | 1,365 (100.0%) | 1,193 (100.0%) |
Families and Households in Bonners Ferry
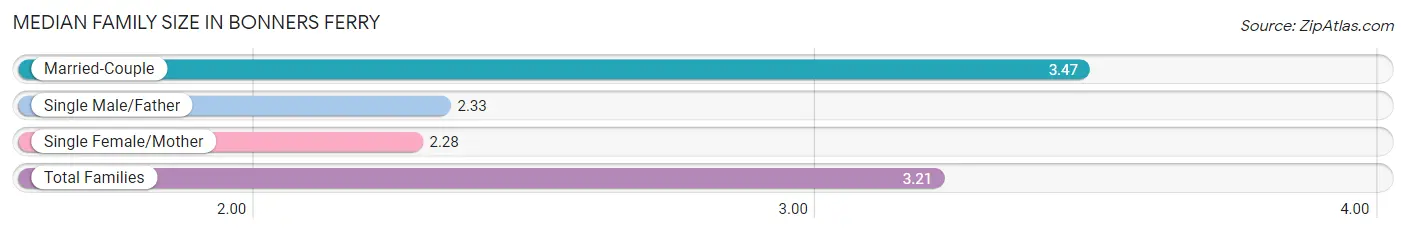
Median Family Size in Bonners Ferry
The median family size in Bonners Ferry is 3.21 persons per family, with married-couple families (387 | 77.7%) accounting for the largest median family size of 3.47 persons per family. On the other hand, single female/mother families (68 | 13.7%) represent the smallest median family size with 2.28 persons per family.
| Family Type | # Families | Family Size |
| Married-Couple | 387 (77.7%) | 3.47 |
| Single Male/Father | 43 (8.6%) | 2.33 |
| Single Female/Mother | 68 (13.7%) | 2.28 |
| Total Families | 498 (100.0%) | 3.21 |
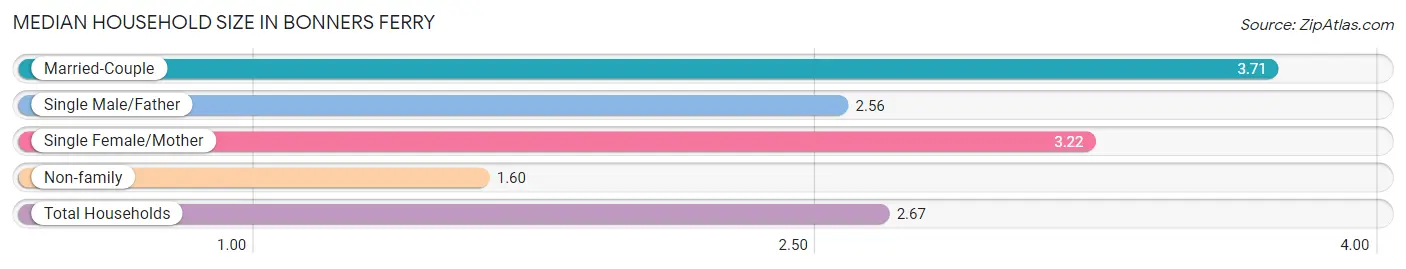
Median Household Size in Bonners Ferry
The median household size in Bonners Ferry is 2.67 persons per household, with married-couple households (387 | 42.6%) accounting for the largest median household size of 3.71 persons per household. non-family households (410 | 45.2%) represent the smallest median household size with 1.60 persons per household.
| Household Type | # Households | Household Size |
| Married-Couple | 387 (42.6%) | 3.71 |
| Single Male/Father | 43 (4.7%) | 2.56 |
| Single Female/Mother | 68 (7.5%) | 3.22 |
| Non-family | 410 (45.2%) | 1.60 |
| Total Households | 908 (100.0%) | 2.67 |
Household Size by Marriage Status in Bonners Ferry
Out of a total of 908 households in Bonners Ferry, 498 (54.8%) are family households, while 410 (45.2%) are nonfamily households. The most numerous type of family households are 2-person households, comprising 197, and the most common type of nonfamily households are 1-person households, comprising 334.
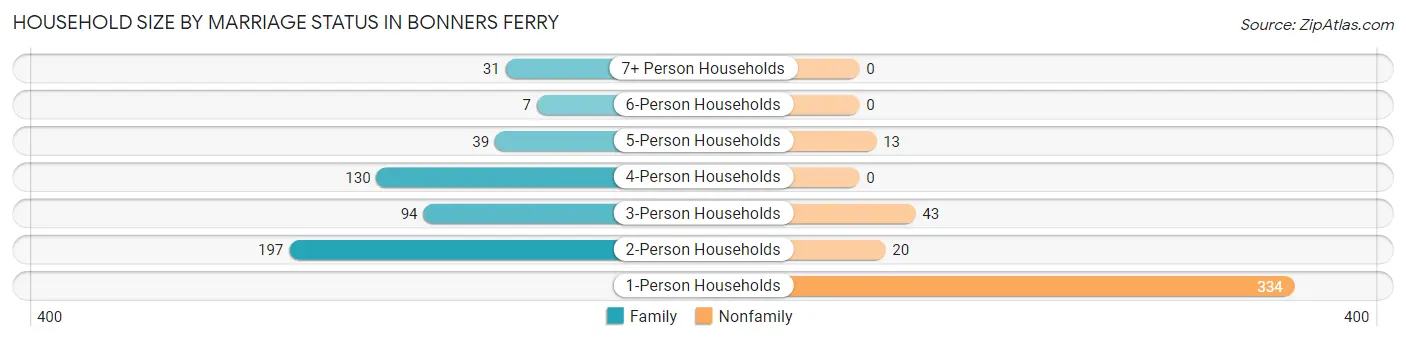
| Household Size | Family Households | Nonfamily Households |
| 1-Person Households | - | 334 (36.8%) |
| 2-Person Households | 197 (21.7%) | 20 (2.2%) |
| 3-Person Households | 94 (10.3%) | 43 (4.7%) |
| 4-Person Households | 130 (14.3%) | 0 (0.0%) |
| 5-Person Households | 39 (4.3%) | 13 (1.4%) |
| 6-Person Households | 7 (0.8%) | 0 (0.0%) |
| 7+ Person Households | 31 (3.4%) | 0 (0.0%) |
| Total | 498 (54.8%) | 410 (45.2%) |
Female Fertility in Bonners Ferry
Fertility by Age in Bonners Ferry
Average fertility rate in Bonners Ferry is 31.0 births per 1,000 women. Women in the age bracket of 20 to 34 years have the highest fertility rate with 78.0 births per 1,000 women. Women in the age bracket of 20 to 34 years acount for 73.7% of all women with births.
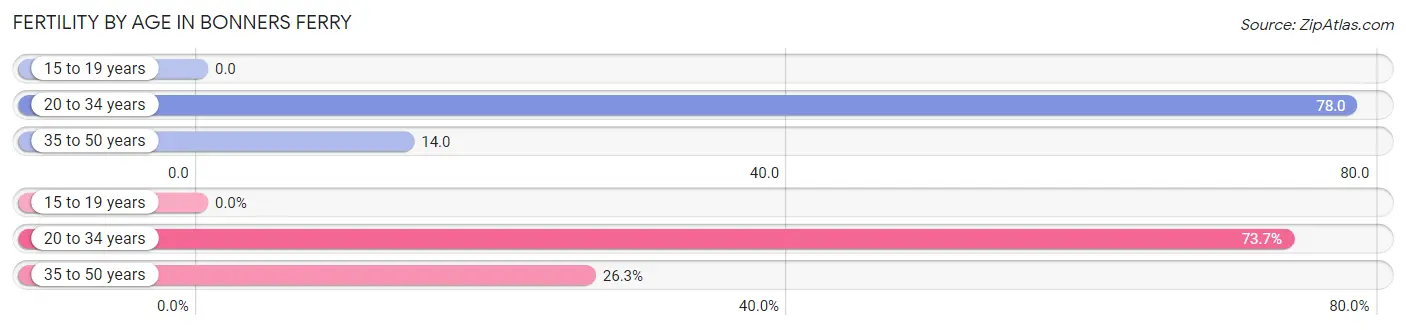
| Age Bracket | Women with Births | Births / 1,000 Women |
| 15 to 19 years | 0 (0.0%) | 0.0 |
| 20 to 34 years | 14 (73.7%) | 78.0 |
| 35 to 50 years | 5 (26.3%) | 14.0 |
| Total | 19 (100.0%) | 31.0 |
Fertility by Age by Marriage Status in Bonners Ferry
73.7% of women with births (19) in Bonners Ferry are married. The highest percentage of unmarried women with births falls into 35 to 50 years age bracket with 100.0% of them unmarried at the time of birth, while the lowest percentage of unmarried women with births belong to 20 to 34 years age bracket with 0.0% of them unmarried.
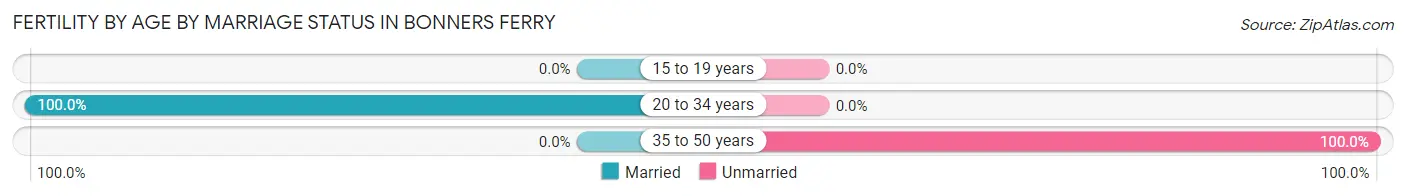
| Age Bracket | Married | Unmarried |
| 15 to 19 years | 0 (0.0%) | 0 (0.0%) |
| 20 to 34 years | 14 (100.0%) | 0 (0.0%) |
| 35 to 50 years | 0 (0.0%) | 5 (100.0%) |
| Total | 14 (73.7%) | 5 (26.3%) |
Fertility by Education in Bonners Ferry
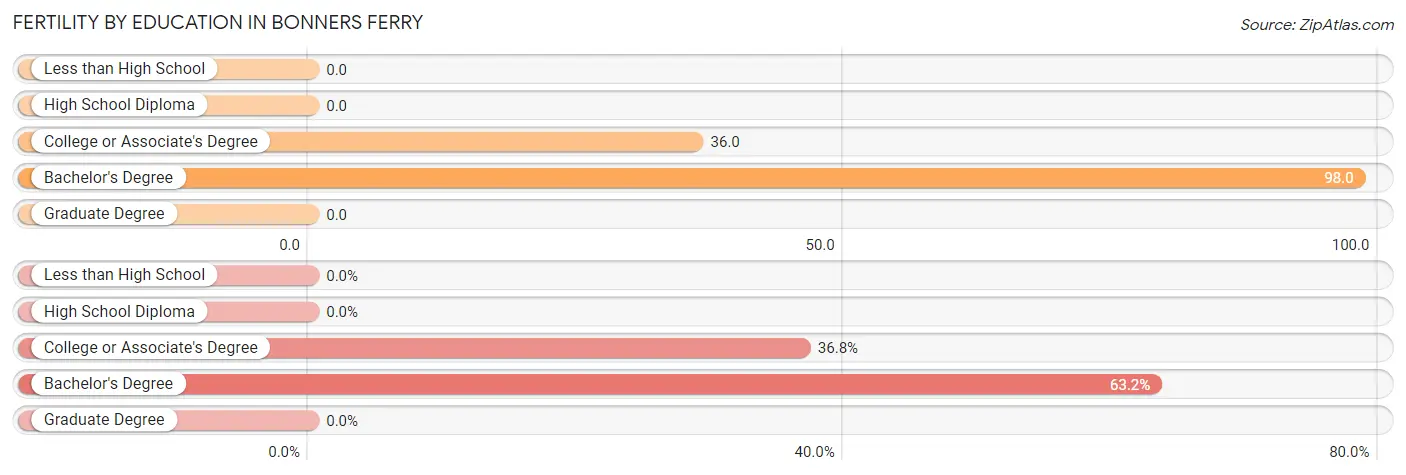
| Educational Attainment | Women with Births | Births / 1,000 Women |
| Less than High School | 0 (0.0%) | 0.0 |
| High School Diploma | 0 (0.0%) | 0.0 |
| College or Associate's Degree | 7 (36.8%) | 36.0 |
| Bachelor's Degree | 12 (63.2%) | 98.0 |
| Graduate Degree | 0 (0.0%) | 0.0 |
| Total | 19 (100.0%) | 31.0 |
Fertility by Education by Marriage Status in Bonners Ferry
26.3% of women with births in Bonners Ferry are unmarried. Women with the educational attainment of bachelor's degree are most likely to be married with 100.0% of them married at childbirth, while women with the educational attainment of college or associate's degree are least likely to be married with 71.4% of them unmarried at childbirth.
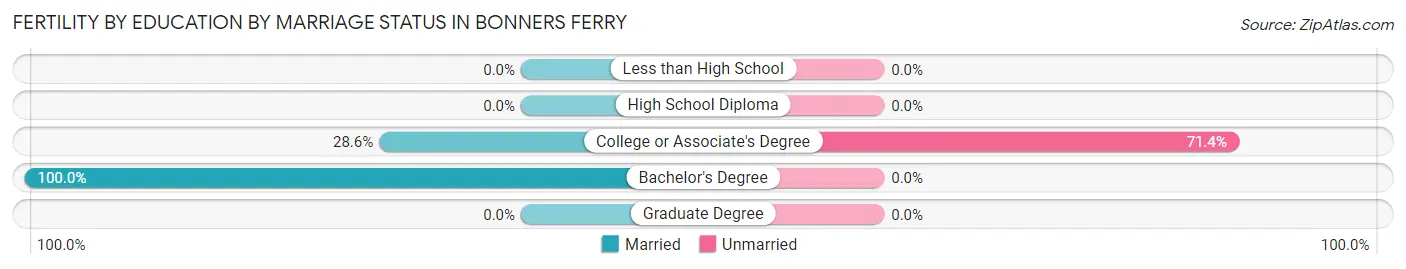
| Educational Attainment | Married | Unmarried |
| Less than High School | 0 (0.0%) | 0 (0.0%) |
| High School Diploma | 0 (0.0%) | 0 (0.0%) |
| College or Associate's Degree | 2 (28.6%) | 5 (71.4%) |
| Bachelor's Degree | 12 (100.0%) | 0 (0.0%) |
| Graduate Degree | 0 (0.0%) | 0 (0.0%) |
| Total | 14 (73.7%) | 5 (26.3%) |
Employment Characteristics in Bonners Ferry
Employment by Class of Employer in Bonners Ferry
Among the 1,170 employed individuals in Bonners Ferry, private company employees (859 | 73.4%), self-employed (not incorporated) (129 | 11.0%), and self-employed (incorporated) (63 | 5.4%) make up the most common classes of employment.
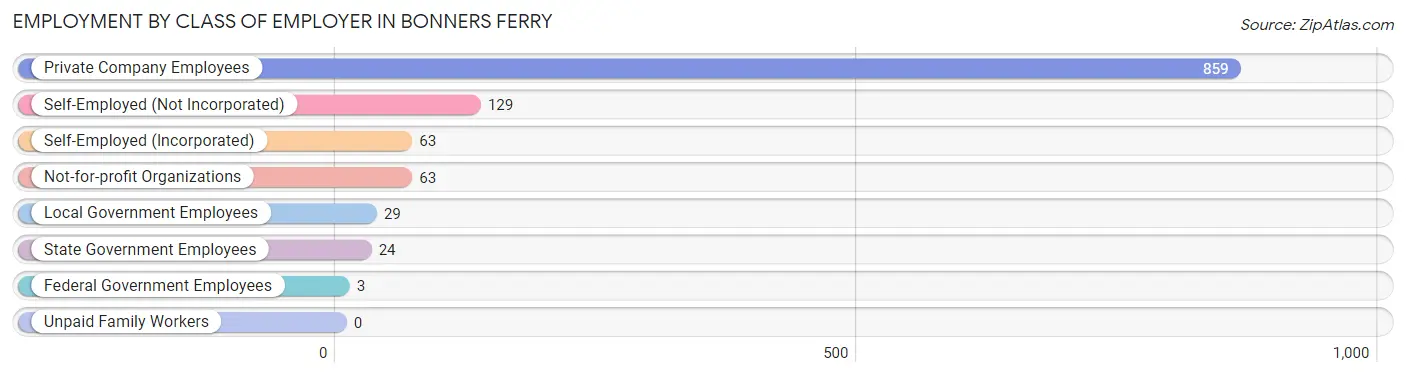
| Employer Class | # Employees | % Employees |
| Private Company Employees | 859 | 73.4% |
| Self-Employed (Incorporated) | 63 | 5.4% |
| Self-Employed (Not Incorporated) | 129 | 11.0% |
| Not-for-profit Organizations | 63 | 5.4% |
| Local Government Employees | 29 | 2.5% |
| State Government Employees | 24 | 2.1% |
| Federal Government Employees | 3 | 0.3% |
| Unpaid Family Workers | 0 | 0.0% |
| Total | 1,170 | 100.0% |
Employment Status by Age in Bonners Ferry
According to the labor force statistics for Bonners Ferry, out of the total population over 16 years of age (1,991), 59.3% or 1,181 individuals are in the labor force, with 0.9% or 11 of them unemployed. The age group with the highest labor force participation rate is 20 to 24 years, with 100.0% or 99 individuals in the labor force. Within the labor force, the 16 to 19 years age range has the highest percentage of unemployed individuals, with 4.9% or 6 of them being unemployed.
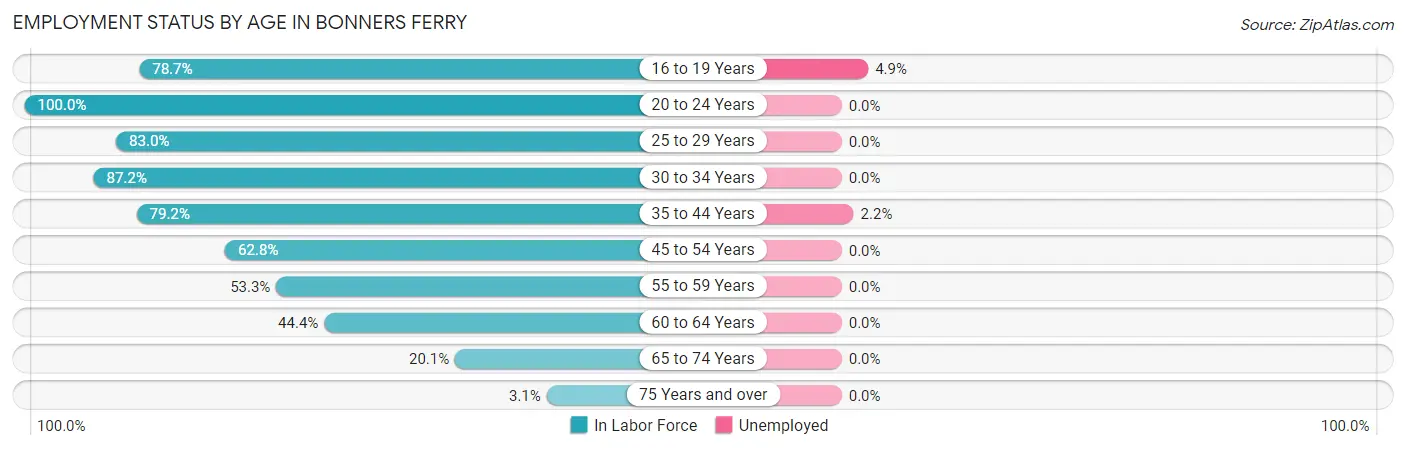
| Age Bracket | In Labor Force | Unemployed |
| 16 to 19 Years | 122 (78.7%) | 6 (4.9%) |
| 20 to 24 Years | 99 (100.0%) | 0 (0.0%) |
| 25 to 29 Years | 171 (83.0%) | 0 (0.0%) |
| 30 to 34 Years | 82 (87.2%) | 0 (0.0%) |
| 35 to 44 Years | 232 (79.2%) | 5 (2.2%) |
| 45 to 54 Years | 339 (62.8%) | 0 (0.0%) |
| 55 to 59 Years | 32 (53.3%) | 0 (0.0%) |
| 60 to 64 Years | 40 (44.4%) | 0 (0.0%) |
| 65 to 74 Years | 59 (20.1%) | 0 (0.0%) |
| 75 Years and over | 5 (3.1%) | 0 (0.0%) |
| Total | 1,181 (59.3%) | 11 (0.9%) |
Employment Status by Educational Attainment in Bonners Ferry
According to labor force statistics for Bonners Ferry, 69.8% of individuals (896) out of the total population between 25 and 64 years of age (1,283) are in the labor force, with 0.6% or 5 of them being unemployed. The group with the highest labor force participation rate are those with the educational attainment of bachelor's degree or higher, with 88.3% or 211 individuals in the labor force. Within the labor force, individuals with college / associate degree education have the highest percentage of unemployment, with 1.7% or 5 of them being unemployed.
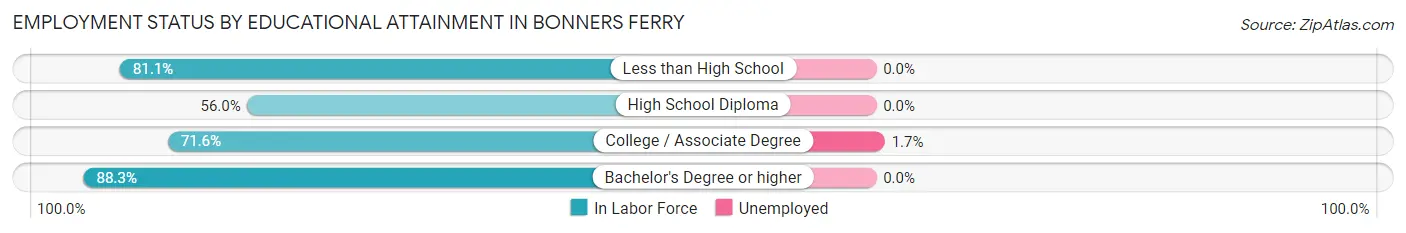
| Educational Attainment | In Labor Force | Unemployed |
| Less than High School | 116 (81.1%) | 0 (0.0%) |
| High School Diploma | 272 (56.0%) | 0 (0.0%) |
| College / Associate Degree | 297 (71.6%) | 7 (1.7%) |
| Bachelor's Degree or higher | 211 (88.3%) | 0 (0.0%) |
| Total | 896 (69.8%) | 8 (0.6%) |
Employment Occupations by Sex in Bonners Ferry
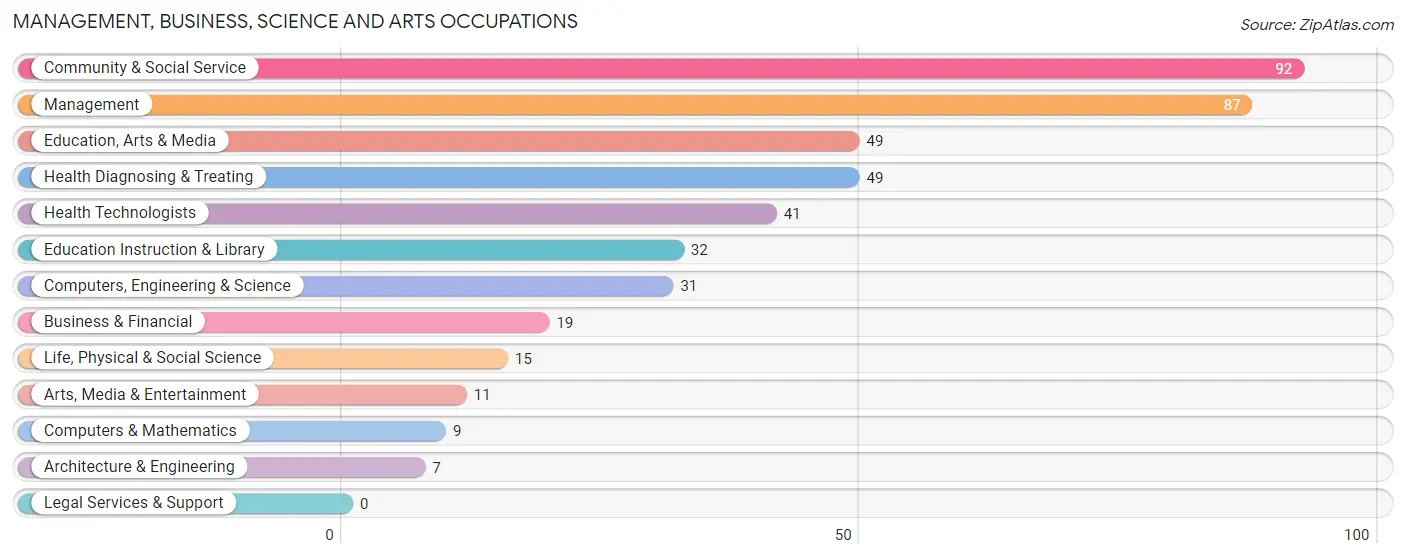
Management, Business, Science and Arts Occupations
The most common Management, Business, Science and Arts occupations in Bonners Ferry are Community & Social Service (92 | 7.9%), Management (87 | 7.4%), Education, Arts & Media (49 | 4.2%), Health Diagnosing & Treating (49 | 4.2%), and Health Technologists (41 | 3.5%).
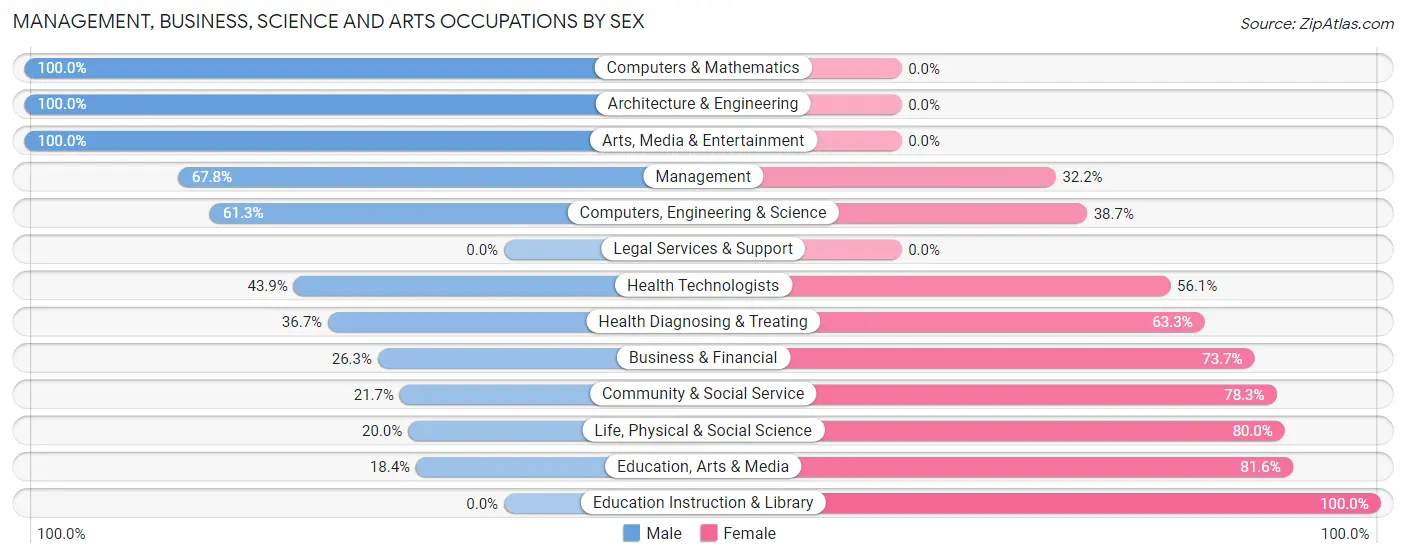
Management, Business, Science and Arts Occupations by Sex
Within the Management, Business, Science and Arts occupations in Bonners Ferry, the most male-oriented occupations are Computers & Mathematics (100.0%), Architecture & Engineering (100.0%), and Arts, Media & Entertainment (100.0%), while the most female-oriented occupations are Education Instruction & Library (100.0%), Education, Arts & Media (81.6%), and Life, Physical & Social Science (80.0%).
| Occupation | Male | Female |
| Management | 59 (67.8%) | 28 (32.2%) |
| Business & Financial | 5 (26.3%) | 14 (73.7%) |
| Computers, Engineering & Science | 19 (61.3%) | 12 (38.7%) |
| Computers & Mathematics | 9 (100.0%) | 0 (0.0%) |
| Architecture & Engineering | 7 (100.0%) | 0 (0.0%) |
| Life, Physical & Social Science | 3 (20.0%) | 12 (80.0%) |
| Community & Social Service | 20 (21.7%) | 72 (78.3%) |
| Education, Arts & Media | 9 (18.4%) | 40 (81.6%) |
| Legal Services & Support | 0 (0.0%) | 0 (0.0%) |
| Education Instruction & Library | 0 (0.0%) | 32 (100.0%) |
| Arts, Media & Entertainment | 11 (100.0%) | 0 (0.0%) |
| Health Diagnosing & Treating | 18 (36.7%) | 31 (63.3%) |
| Health Technologists | 18 (43.9%) | 23 (56.1%) |
| Total (Category) | 121 (43.5%) | 157 (56.5%) |
| Total (Overall) | 712 (60.9%) | 458 (39.2%) |
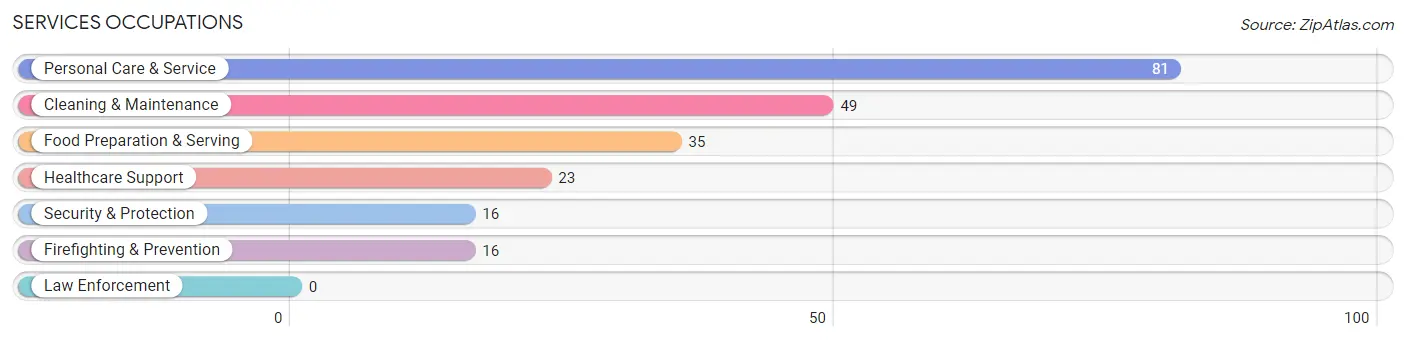
Services Occupations
The most common Services occupations in Bonners Ferry are Personal Care & Service (81 | 6.9%), Cleaning & Maintenance (49 | 4.2%), Food Preparation & Serving (35 | 3.0%), Healthcare Support (23 | 2.0%), and Security & Protection (16 | 1.4%).
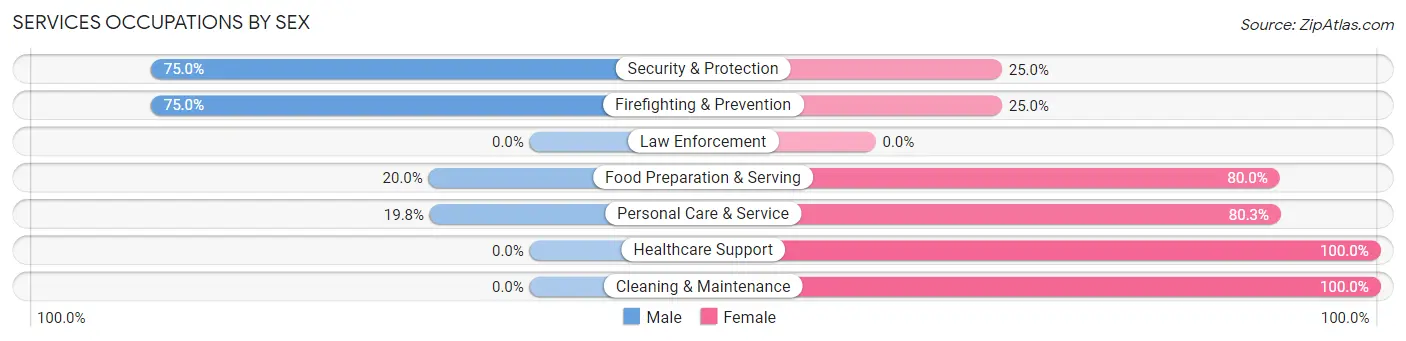
Services Occupations by Sex
Within the Services occupations in Bonners Ferry, the most male-oriented occupations are Security & Protection (75.0%), Firefighting & Prevention (75.0%), and Food Preparation & Serving (20.0%), while the most female-oriented occupations are Healthcare Support (100.0%), Cleaning & Maintenance (100.0%), and Personal Care & Service (80.2%).
| Occupation | Male | Female |
| Healthcare Support | 0 (0.0%) | 23 (100.0%) |
| Security & Protection | 12 (75.0%) | 4 (25.0%) |
| Firefighting & Prevention | 12 (75.0%) | 4 (25.0%) |
| Law Enforcement | 0 (0.0%) | 0 (0.0%) |
| Food Preparation & Serving | 7 (20.0%) | 28 (80.0%) |
| Cleaning & Maintenance | 0 (0.0%) | 49 (100.0%) |
| Personal Care & Service | 16 (19.8%) | 65 (80.2%) |
| Total (Category) | 35 (17.2%) | 169 (82.8%) |
| Total (Overall) | 712 (60.9%) | 458 (39.2%) |
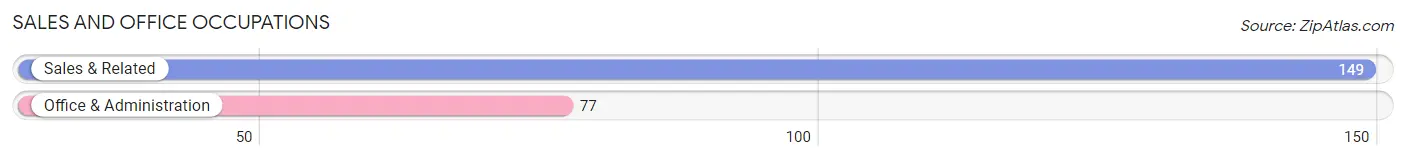
Sales and Office Occupations
The most common Sales and Office occupations in Bonners Ferry are Sales & Related (149 | 12.7%), and Office & Administration (77 | 6.6%).
Sales and Office Occupations by Sex
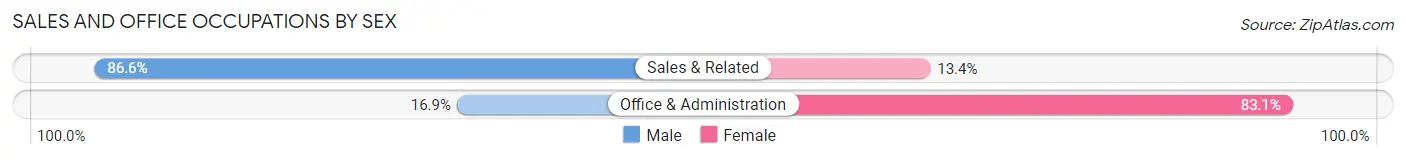
| Occupation | Male | Female |
| Sales & Related | 129 (86.6%) | 20 (13.4%) |
| Office & Administration | 13 (16.9%) | 64 (83.1%) |
| Total (Category) | 142 (62.8%) | 84 (37.2%) |
| Total (Overall) | 712 (60.9%) | 458 (39.2%) |
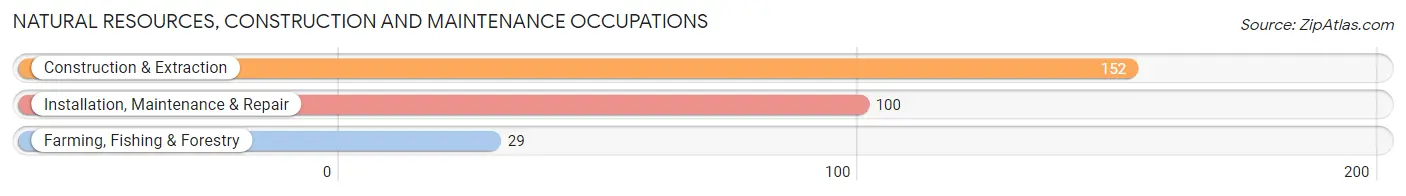
Natural Resources, Construction and Maintenance Occupations
The most common Natural Resources, Construction and Maintenance occupations in Bonners Ferry are Construction & Extraction (152 | 13.0%), Installation, Maintenance & Repair (100 | 8.6%), and Farming, Fishing & Forestry (29 | 2.5%).
Natural Resources, Construction and Maintenance Occupations by Sex
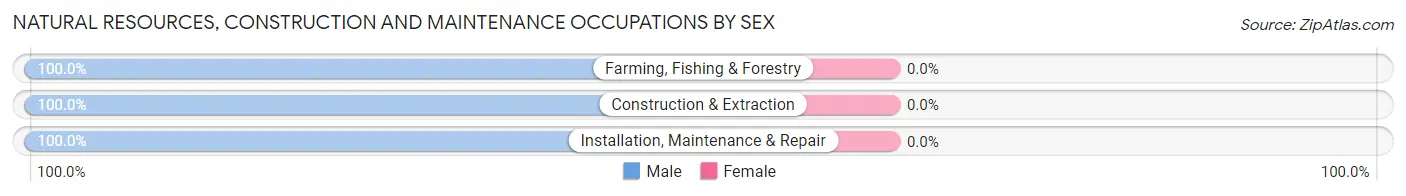
| Occupation | Male | Female |
| Farming, Fishing & Forestry | 29 (100.0%) | 0 (0.0%) |
| Construction & Extraction | 152 (100.0%) | 0 (0.0%) |
| Installation, Maintenance & Repair | 100 (100.0%) | 0 (0.0%) |
| Total (Category) | 281 (100.0%) | 0 (0.0%) |
| Total (Overall) | 712 (60.9%) | 458 (39.2%) |
Production, Transportation and Moving Occupations
The most common Production, Transportation and Moving occupations in Bonners Ferry are Production (98 | 8.4%), Material Moving (49 | 4.2%), and Transportation (34 | 2.9%).
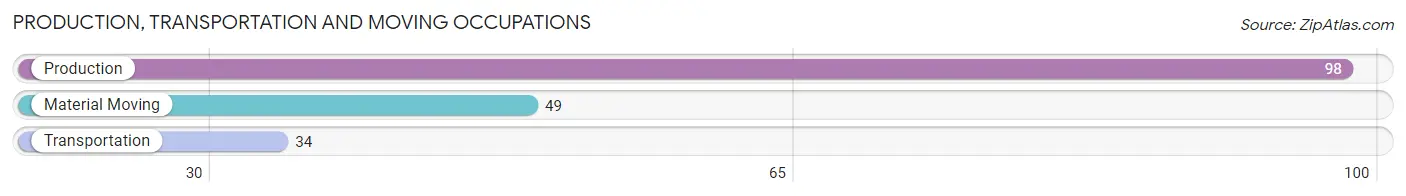
Production, Transportation and Moving Occupations by Sex
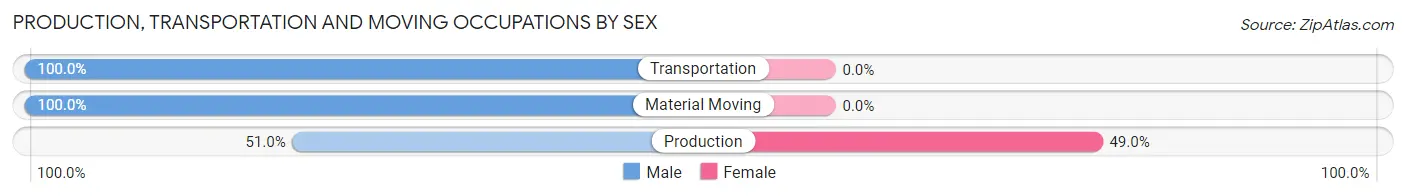
| Occupation | Male | Female |
| Production | 50 (51.0%) | 48 (49.0%) |
| Transportation | 34 (100.0%) | 0 (0.0%) |
| Material Moving | 49 (100.0%) | 0 (0.0%) |
| Total (Category) | 133 (73.5%) | 48 (26.5%) |
| Total (Overall) | 712 (60.9%) | 458 (39.2%) |
Employment Industries by Sex in Bonners Ferry
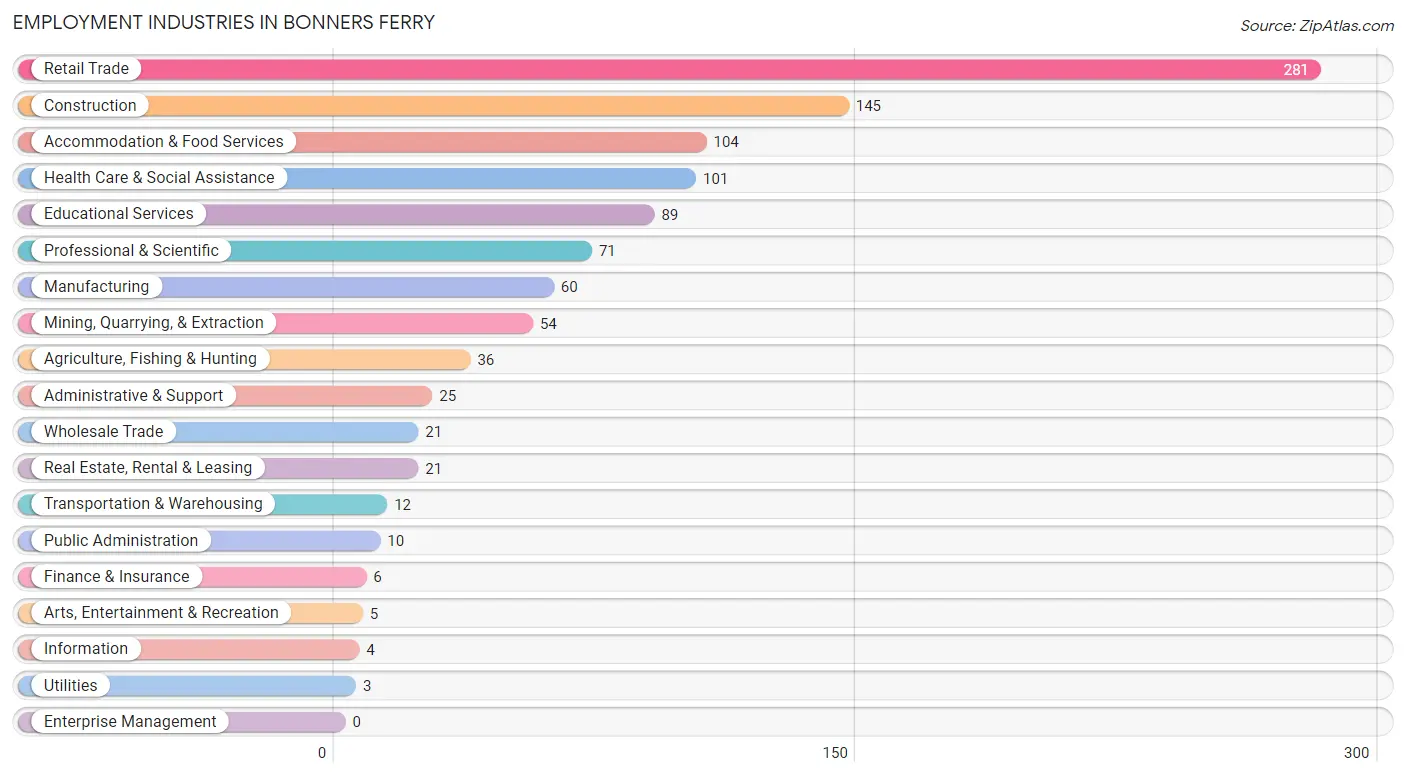
Employment Industries in Bonners Ferry
The major employment industries in Bonners Ferry include Retail Trade (281 | 24.0%), Construction (145 | 12.4%), Accommodation & Food Services (104 | 8.9%), Health Care & Social Assistance (101 | 8.6%), and Educational Services (89 | 7.6%).
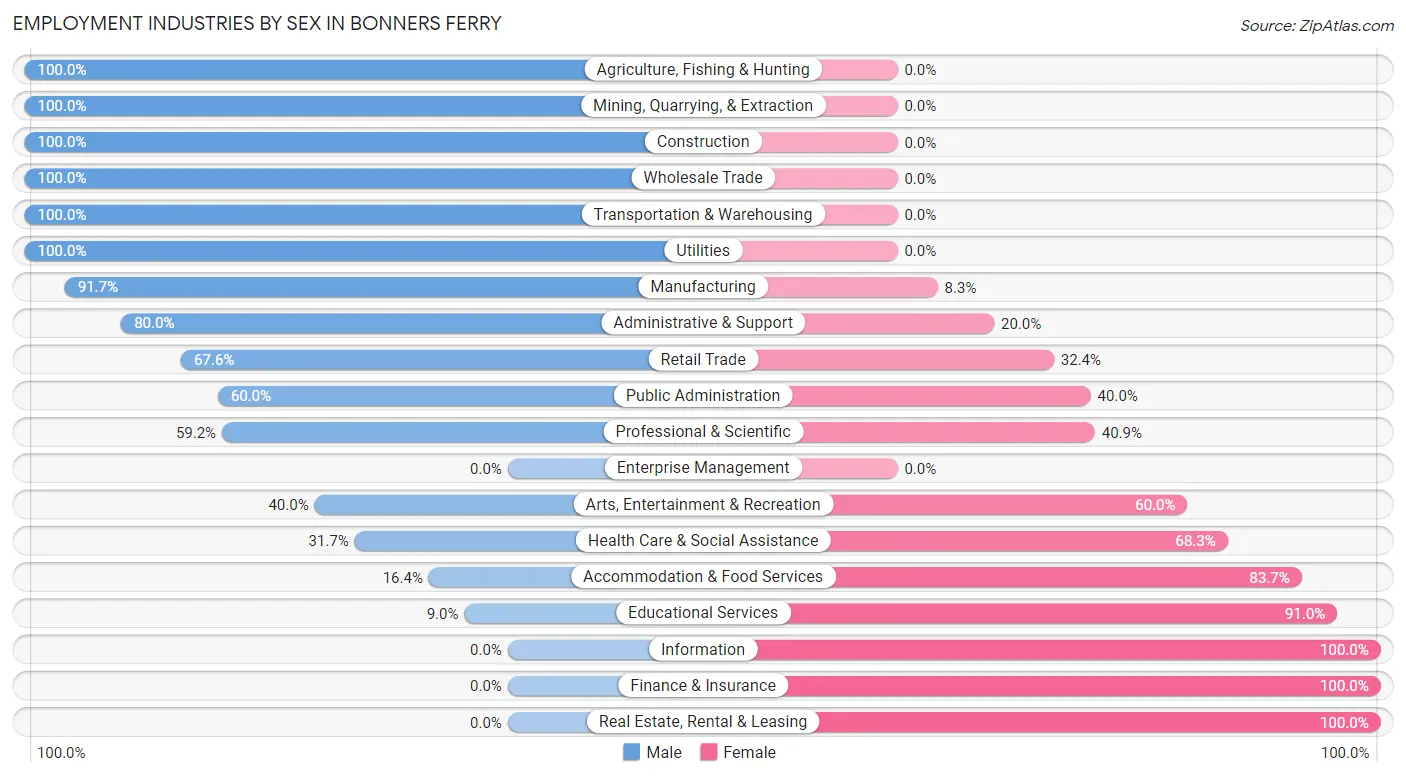
Employment Industries by Sex in Bonners Ferry
The Bonners Ferry industries that see more men than women are Agriculture, Fishing & Hunting (100.0%), Mining, Quarrying, & Extraction (100.0%), and Construction (100.0%), whereas the industries that tend to have a higher number of women are Information (100.0%), Finance & Insurance (100.0%), and Real Estate, Rental & Leasing (100.0%).
| Industry | Male | Female |
| Agriculture, Fishing & Hunting | 36 (100.0%) | 0 (0.0%) |
| Mining, Quarrying, & Extraction | 54 (100.0%) | 0 (0.0%) |
| Construction | 145 (100.0%) | 0 (0.0%) |
| Manufacturing | 55 (91.7%) | 5 (8.3%) |
| Wholesale Trade | 21 (100.0%) | 0 (0.0%) |
| Retail Trade | 190 (67.6%) | 91 (32.4%) |
| Transportation & Warehousing | 12 (100.0%) | 0 (0.0%) |
| Utilities | 3 (100.0%) | 0 (0.0%) |
| Information | 0 (0.0%) | 4 (100.0%) |
| Finance & Insurance | 0 (0.0%) | 6 (100.0%) |
| Real Estate, Rental & Leasing | 0 (0.0%) | 21 (100.0%) |
| Professional & Scientific | 42 (59.2%) | 29 (40.8%) |
| Enterprise Management | 0 (0.0%) | 0 (0.0%) |
| Administrative & Support | 20 (80.0%) | 5 (20.0%) |
| Educational Services | 8 (9.0%) | 81 (91.0%) |
| Health Care & Social Assistance | 32 (31.7%) | 69 (68.3%) |
| Arts, Entertainment & Recreation | 2 (40.0%) | 3 (60.0%) |
| Accommodation & Food Services | 17 (16.4%) | 87 (83.7%) |
| Public Administration | 6 (60.0%) | 4 (40.0%) |
| Total | 712 (60.9%) | 458 (39.2%) |
Education in Bonners Ferry
School Enrollment in Bonners Ferry
The most common levels of schooling among the 429 students in Bonners Ferry are high school (134 | 31.2%), middle school (128 | 29.8%), and elementary school (123 | 28.7%).
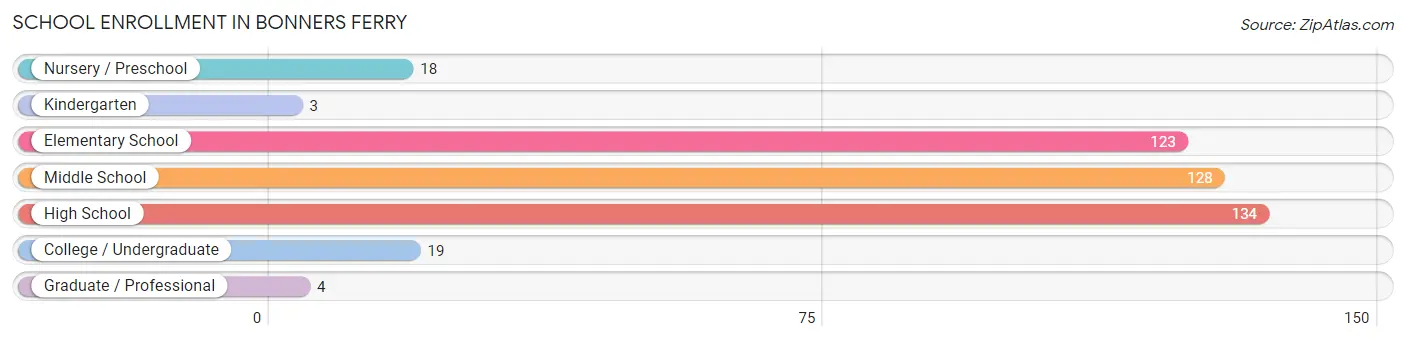
| School Level | # Students | % Students |
| Nursery / Preschool | 18 | 4.2% |
| Kindergarten | 3 | 0.7% |
| Elementary School | 123 | 28.7% |
| Middle School | 128 | 29.8% |
| High School | 134 | 31.2% |
| College / Undergraduate | 19 | 4.4% |
| Graduate / Professional | 4 | 0.9% |
| Total | 429 | 100.0% |
School Enrollment by Age by Funding Source in Bonners Ferry
Out of a total of 429 students who are enrolled in schools in Bonners Ferry, 42 (9.8%) attend a private institution, while the remaining 387 (90.2%) are enrolled in public schools. The age group of 35 years and over has the highest likelihood of being enrolled in private schools, with 9 (56.2% in the age bracket) enrolled. Conversely, the age group of 5 to 9 year old has the lowest likelihood of being enrolled in a private school, with 120 (95.2% in the age bracket) attending a public institution.
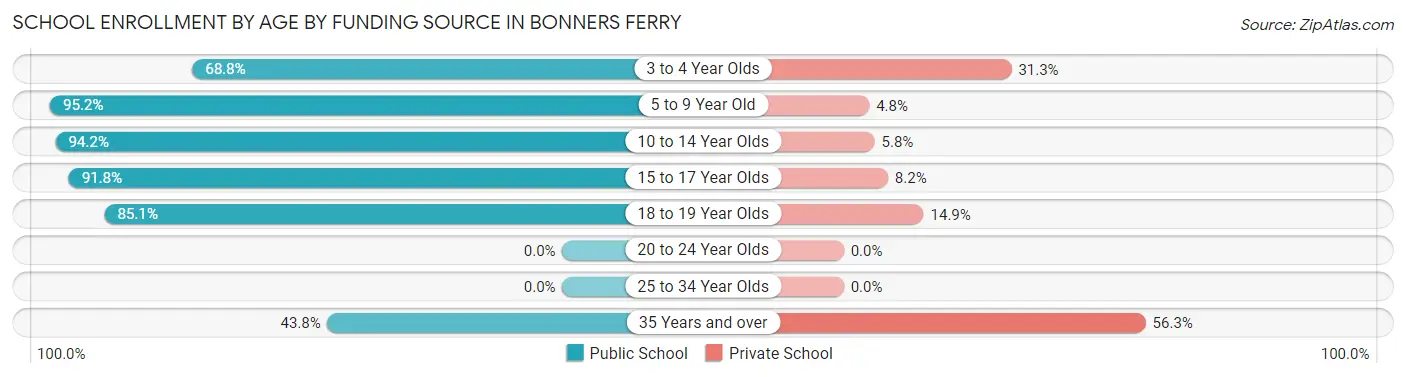
| Age Bracket | Public School | Private School |
| 3 to 4 Year Olds | 11 (68.8%) | 5 (31.2%) |
| 5 to 9 Year Old | 120 (95.2%) | 6 (4.8%) |
| 10 to 14 Year Olds | 131 (94.2%) | 8 (5.8%) |
| 15 to 17 Year Olds | 78 (91.8%) | 7 (8.2%) |
| 18 to 19 Year Olds | 40 (85.1%) | 7 (14.9%) |
| 20 to 24 Year Olds | 0 (0.0%) | 0 (0.0%) |
| 25 to 34 Year Olds | 0 (0.0%) | 0 (0.0%) |
| 35 Years and over | 7 (43.8%) | 9 (56.2%) |
| Total | 387 (90.2%) | 42 (9.8%) |
Educational Attainment by Field of Study in Bonners Ferry
Education (65 | 19.9%), arts & humanities (61 | 18.7%), literature & languages (38 | 11.7%), business (34 | 10.4%), and bio, nature & agricultural (27 | 8.3%) are the most common fields of study among 326 individuals in Bonners Ferry who have obtained a bachelor's degree or higher.
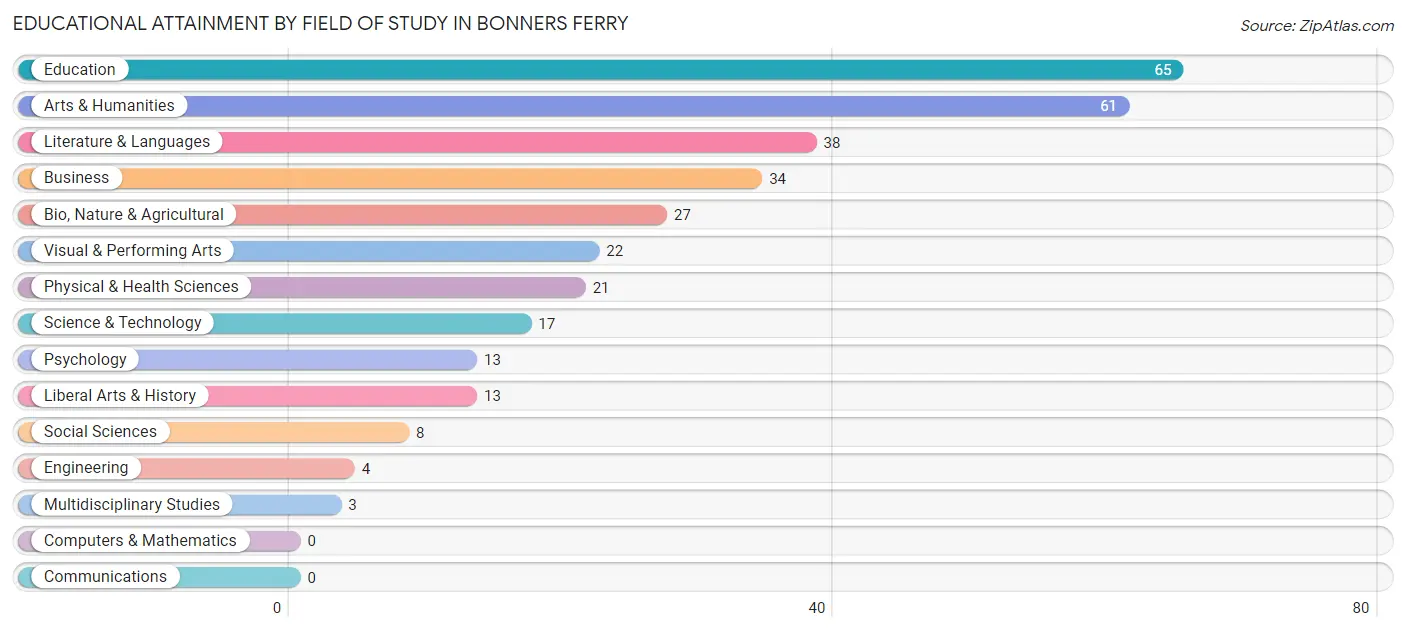
| Field of Study | # Graduates | % Graduates |
| Computers & Mathematics | 0 | 0.0% |
| Bio, Nature & Agricultural | 27 | 8.3% |
| Physical & Health Sciences | 21 | 6.4% |
| Psychology | 13 | 4.0% |
| Social Sciences | 8 | 2.5% |
| Engineering | 4 | 1.2% |
| Multidisciplinary Studies | 3 | 0.9% |
| Science & Technology | 17 | 5.2% |
| Business | 34 | 10.4% |
| Education | 65 | 19.9% |
| Literature & Languages | 38 | 11.7% |
| Liberal Arts & History | 13 | 4.0% |
| Visual & Performing Arts | 22 | 6.8% |
| Communications | 0 | 0.0% |
| Arts & Humanities | 61 | 18.7% |
| Total | 326 | 100.0% |
Transportation & Commute in Bonners Ferry
Vehicle Availability by Sex in Bonners Ferry
The most prevalent vehicle ownership categories in Bonners Ferry are males with 1 vehicle (205, accounting for 28.9%) and females with 1 vehicle (95, making up 45.9%).
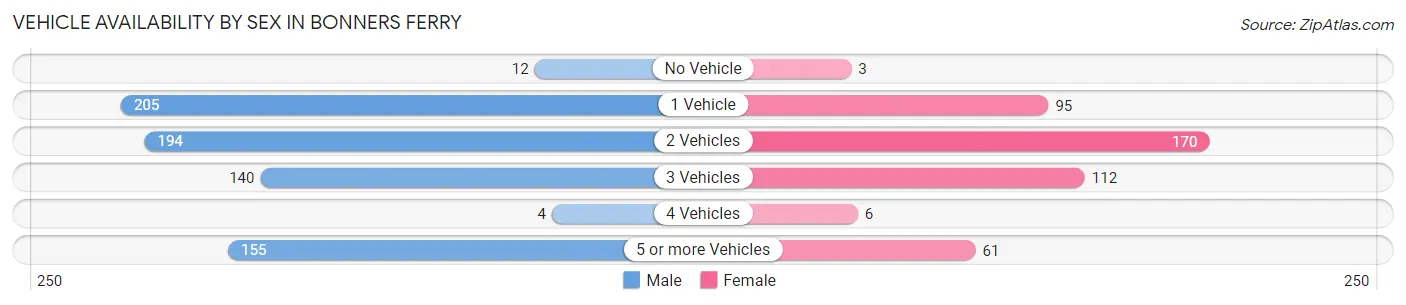
| Vehicles Available | Male | Female |
| No Vehicle | 12 (1.7%) | 3 (0.7%) |
| 1 Vehicle | 205 (28.9%) | 95 (21.2%) |
| 2 Vehicles | 194 (27.3%) | 170 (38.0%) |
| 3 Vehicles | 140 (19.7%) | 112 (25.1%) |
| 4 Vehicles | 4 (0.6%) | 6 (1.3%) |
| 5 or more Vehicles | 155 (21.8%) | 61 (13.7%) |
| Total | 710 (100.0%) | 447 (100.0%) |
Commute Time in Bonners Ferry
The most frequently occuring commute durations in Bonners Ferry are 5 to 9 minutes (269 commuters, 24.8%), 10 to 14 minutes (190 commuters, 17.5%), and 15 to 19 minutes (158 commuters, 14.6%).
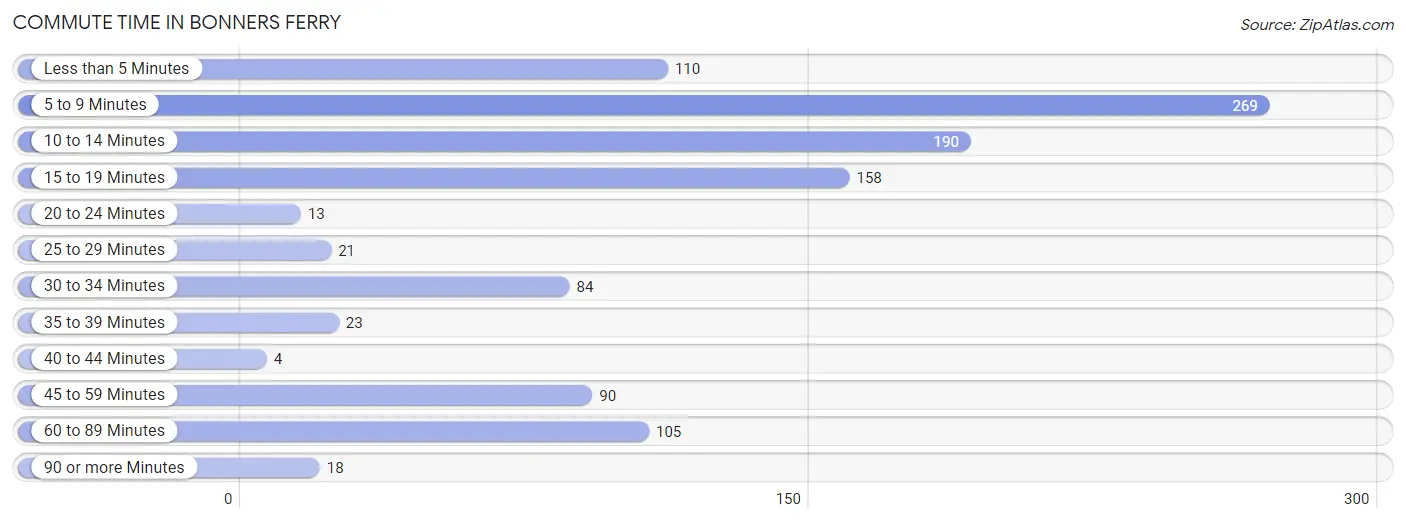
| Commute Time | # Commuters | % Commuters |
| Less than 5 Minutes | 110 | 10.1% |
| 5 to 9 Minutes | 269 | 24.8% |
| 10 to 14 Minutes | 190 | 17.5% |
| 15 to 19 Minutes | 158 | 14.6% |
| 20 to 24 Minutes | 13 | 1.2% |
| 25 to 29 Minutes | 21 | 1.9% |
| 30 to 34 Minutes | 84 | 7.7% |
| 35 to 39 Minutes | 23 | 2.1% |
| 40 to 44 Minutes | 4 | 0.4% |
| 45 to 59 Minutes | 90 | 8.3% |
| 60 to 89 Minutes | 105 | 9.7% |
| 90 or more Minutes | 18 | 1.7% |
Commute Time by Sex in Bonners Ferry
The most common commute times in Bonners Ferry are 15 to 19 minutes (143 commuters, 20.8%) for males and 5 to 9 minutes (159 commuters, 39.9%) for females.
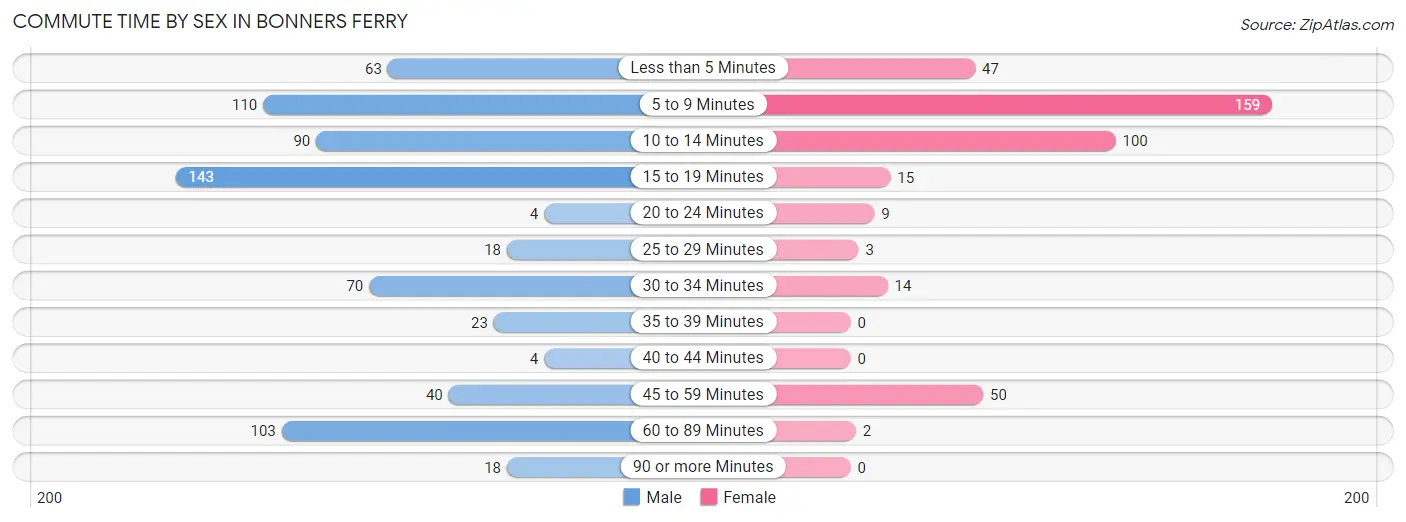
| Commute Time | Male | Female |
| Less than 5 Minutes | 63 (9.2%) | 47 (11.8%) |
| 5 to 9 Minutes | 110 (16.0%) | 159 (39.9%) |
| 10 to 14 Minutes | 90 (13.1%) | 100 (25.1%) |
| 15 to 19 Minutes | 143 (20.8%) | 15 (3.8%) |
| 20 to 24 Minutes | 4 (0.6%) | 9 (2.3%) |
| 25 to 29 Minutes | 18 (2.6%) | 3 (0.7%) |
| 30 to 34 Minutes | 70 (10.2%) | 14 (3.5%) |
| 35 to 39 Minutes | 23 (3.4%) | 0 (0.0%) |
| 40 to 44 Minutes | 4 (0.6%) | 0 (0.0%) |
| 45 to 59 Minutes | 40 (5.8%) | 50 (12.5%) |
| 60 to 89 Minutes | 103 (15.0%) | 2 (0.5%) |
| 90 or more Minutes | 18 (2.6%) | 0 (0.0%) |
Time of Departure to Work by Sex in Bonners Ferry
The most frequent times of departure to work in Bonners Ferry are 7:00 AM to 7:29 AM (121, 17.6%) for males and 9:00 AM to 9:59 AM (128, 32.1%) for females.
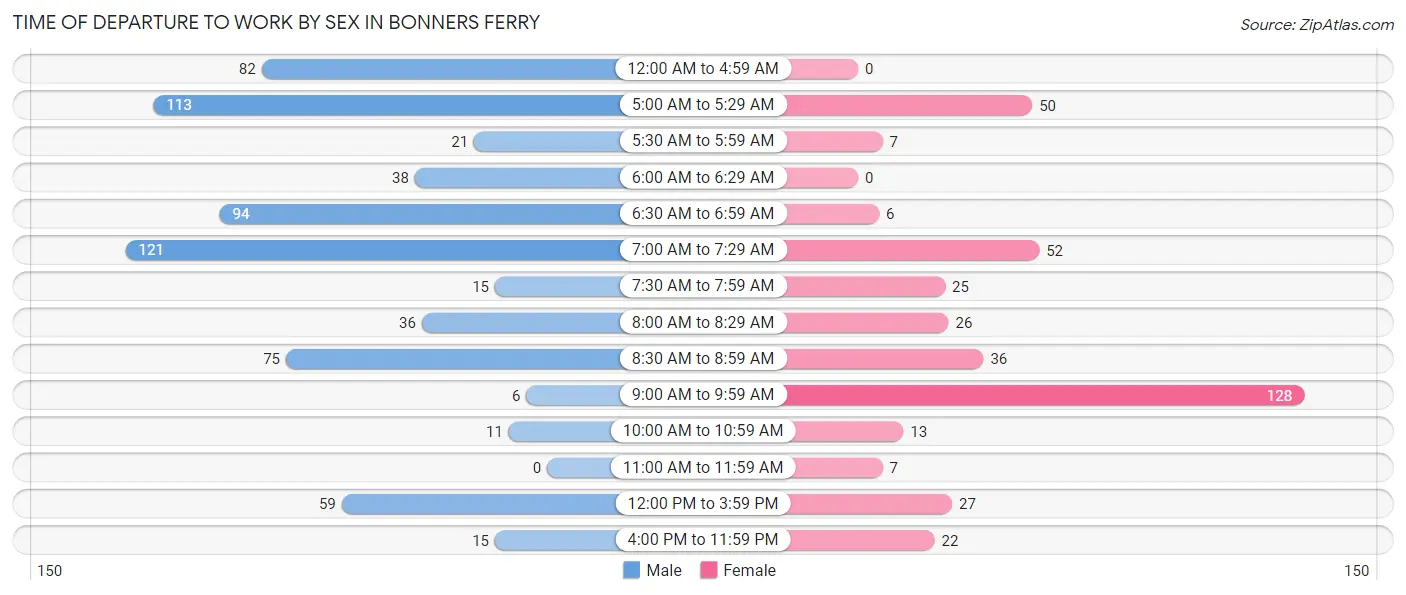
| Time of Departure | Male | Female |
| 12:00 AM to 4:59 AM | 82 (11.9%) | 0 (0.0%) |
| 5:00 AM to 5:29 AM | 113 (16.5%) | 50 (12.5%) |
| 5:30 AM to 5:59 AM | 21 (3.1%) | 7 (1.8%) |
| 6:00 AM to 6:29 AM | 38 (5.5%) | 0 (0.0%) |
| 6:30 AM to 6:59 AM | 94 (13.7%) | 6 (1.5%) |
| 7:00 AM to 7:29 AM | 121 (17.6%) | 52 (13.0%) |
| 7:30 AM to 7:59 AM | 15 (2.2%) | 25 (6.3%) |
| 8:00 AM to 8:29 AM | 36 (5.2%) | 26 (6.5%) |
| 8:30 AM to 8:59 AM | 75 (10.9%) | 36 (9.0%) |
| 9:00 AM to 9:59 AM | 6 (0.9%) | 128 (32.1%) |
| 10:00 AM to 10:59 AM | 11 (1.6%) | 13 (3.3%) |
| 11:00 AM to 11:59 AM | 0 (0.0%) | 7 (1.8%) |
| 12:00 PM to 3:59 PM | 59 (8.6%) | 27 (6.8%) |
| 4:00 PM to 11:59 PM | 15 (2.2%) | 22 (5.5%) |
| Total | 686 (100.0%) | 399 (100.0%) |
Housing Occupancy in Bonners Ferry
Occupancy by Ownership in Bonners Ferry
Of the total 908 dwellings in Bonners Ferry, owner-occupied units account for 494 (54.4%), while renter-occupied units make up 414 (45.6%).
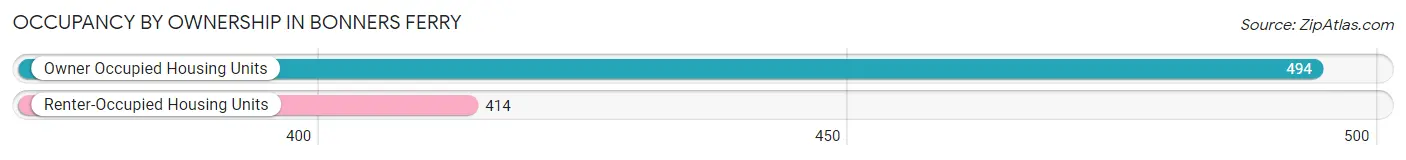
| Occupancy | # Housing Units | % Housing Units |
| Owner Occupied Housing Units | 494 | 54.4% |
| Renter-Occupied Housing Units | 414 | 45.6% |
| Total Occupied Housing Units | 908 | 100.0% |
Occupancy by Household Size in Bonners Ferry
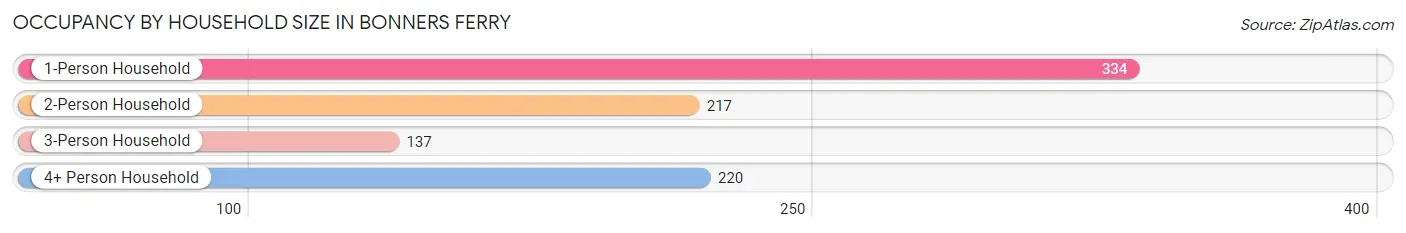
| Household Size | # Housing Units | % Housing Units |
| 1-Person Household | 334 | 36.8% |
| 2-Person Household | 217 | 23.9% |
| 3-Person Household | 137 | 15.1% |
| 4+ Person Household | 220 | 24.2% |
| Total Housing Units | 908 | 100.0% |
Occupancy by Ownership by Household Size in Bonners Ferry
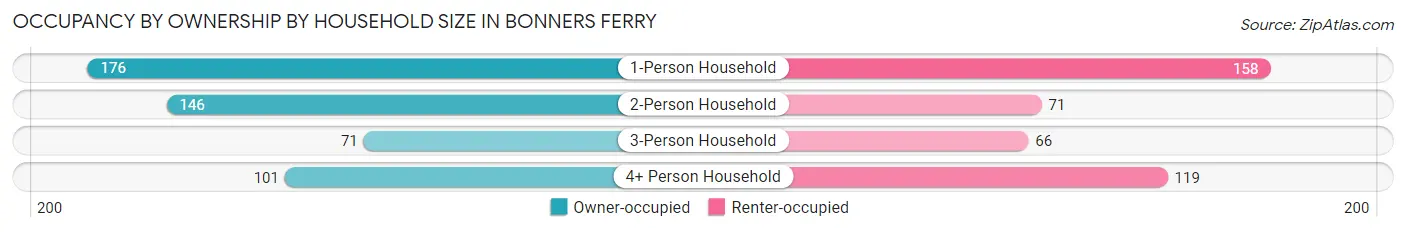
| Household Size | Owner-occupied | Renter-occupied |
| 1-Person Household | 176 (52.7%) | 158 (47.3%) |
| 2-Person Household | 146 (67.3%) | 71 (32.7%) |
| 3-Person Household | 71 (51.8%) | 66 (48.2%) |
| 4+ Person Household | 101 (45.9%) | 119 (54.1%) |
| Total Housing Units | 494 (54.4%) | 414 (45.6%) |
Occupancy by Educational Attainment in Bonners Ferry
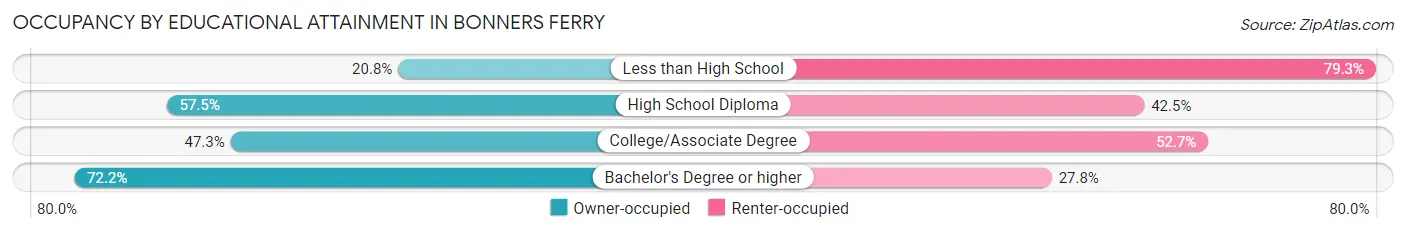
| Household Size | Owner-occupied | Renter-occupied |
| Less than High School | 11 (20.7%) | 42 (79.2%) |
| High School Diploma | 196 (57.5%) | 145 (42.5%) |
| College/Associate Degree | 160 (47.3%) | 178 (52.7%) |
| Bachelor's Degree or higher | 127 (72.2%) | 49 (27.8%) |
Occupancy by Age of Householder in Bonners Ferry
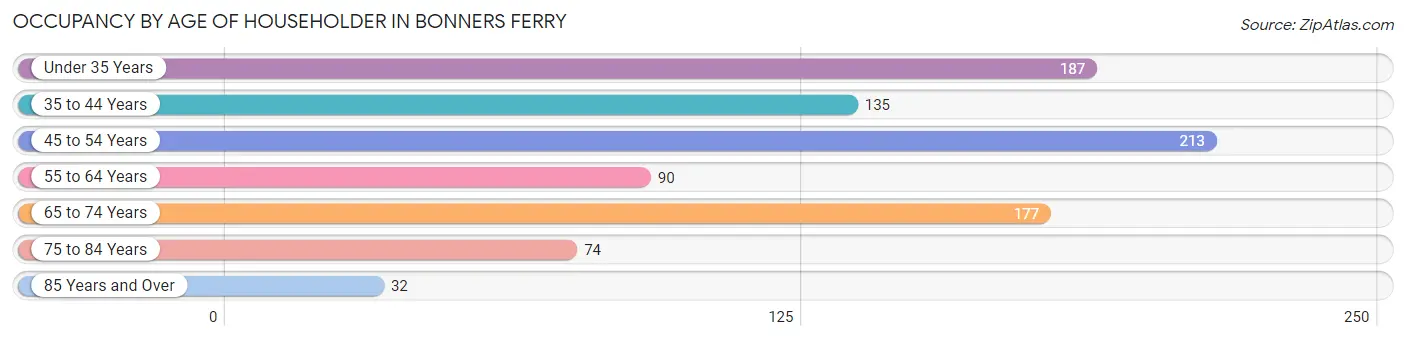
| Age Bracket | # Households | % Households |
| Under 35 Years | 187 | 20.6% |
| 35 to 44 Years | 135 | 14.9% |
| 45 to 54 Years | 213 | 23.5% |
| 55 to 64 Years | 90 | 9.9% |
| 65 to 74 Years | 177 | 19.5% |
| 75 to 84 Years | 74 | 8.2% |
| 85 Years and Over | 32 | 3.5% |
| Total | 908 | 100.0% |
Housing Finances in Bonners Ferry
Median Income by Occupancy in Bonners Ferry
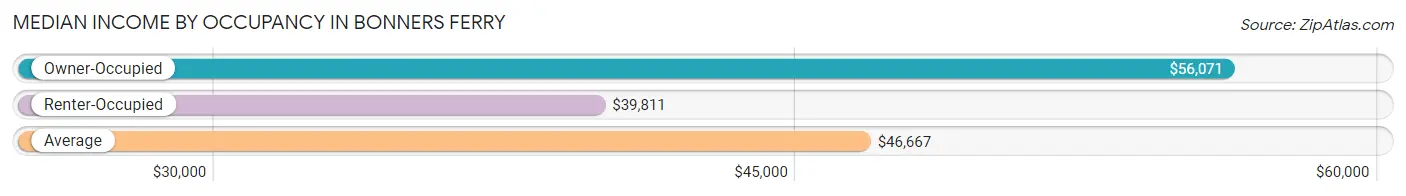
| Occupancy Type | # Households | Median Income |
| Owner-Occupied | 494 (54.4%) | $56,071 |
| Renter-Occupied | 414 (45.6%) | $39,811 |
| Average | 908 (100.0%) | $46,667 |
Occupancy by Householder Income Bracket in Bonners Ferry
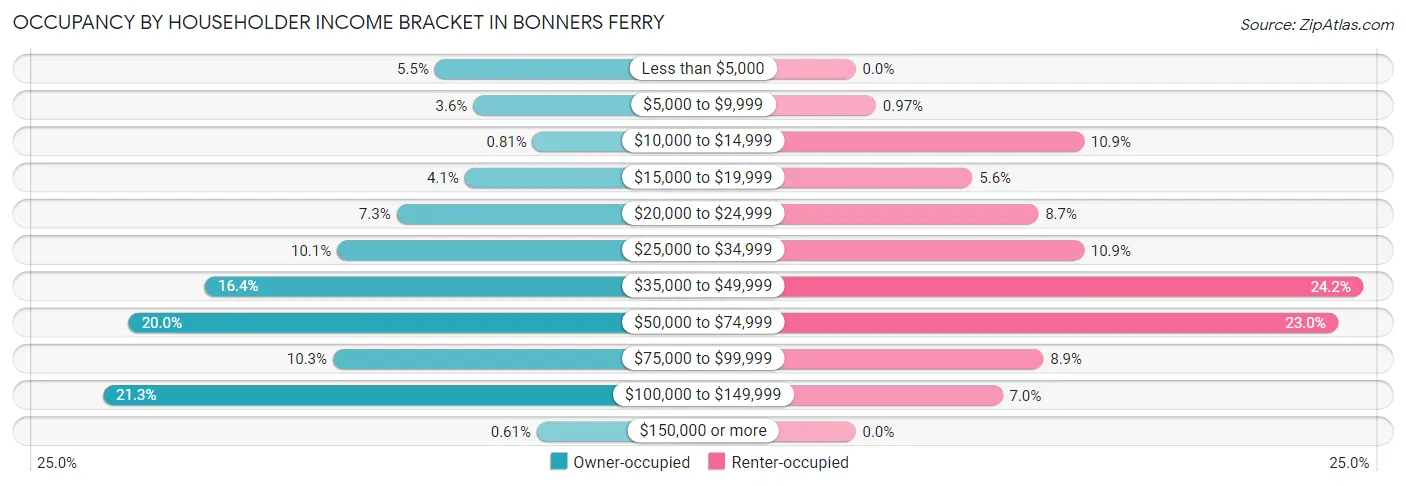
| Income Bracket | Owner-occupied | Renter-occupied |
| Less than $5,000 | 27 (5.5%) | 0 (0.0%) |
| $5,000 to $9,999 | 18 (3.6%) | 4 (1.0%) |
| $10,000 to $14,999 | 4 (0.8%) | 45 (10.9%) |
| $15,000 to $19,999 | 20 (4.1%) | 23 (5.6%) |
| $20,000 to $24,999 | 36 (7.3%) | 36 (8.7%) |
| $25,000 to $34,999 | 50 (10.1%) | 45 (10.9%) |
| $35,000 to $49,999 | 81 (16.4%) | 100 (24.1%) |
| $50,000 to $74,999 | 99 (20.0%) | 95 (23.0%) |
| $75,000 to $99,999 | 51 (10.3%) | 37 (8.9%) |
| $100,000 to $149,999 | 105 (21.3%) | 29 (7.0%) |
| $150,000 or more | 3 (0.6%) | 0 (0.0%) |
| Total | 494 (100.0%) | 414 (100.0%) |
Monthly Housing Cost Tiers in Bonners Ferry
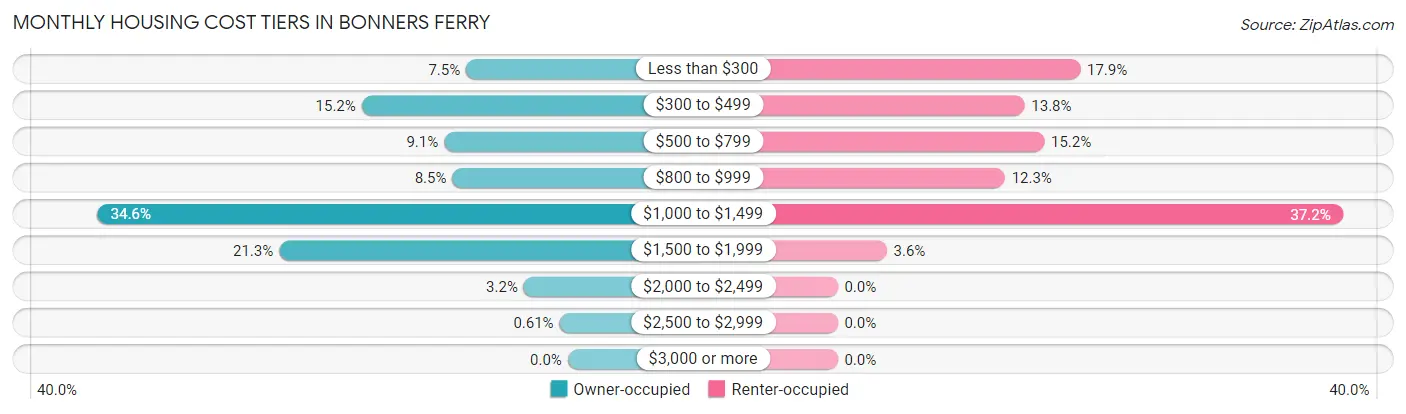
| Monthly Cost | Owner-occupied | Renter-occupied |
| Less than $300 | 37 (7.5%) | 74 (17.9%) |
| $300 to $499 | 75 (15.2%) | 57 (13.8%) |
| $500 to $799 | 45 (9.1%) | 63 (15.2%) |
| $800 to $999 | 42 (8.5%) | 51 (12.3%) |
| $1,000 to $1,499 | 171 (34.6%) | 154 (37.2%) |
| $1,500 to $1,999 | 105 (21.3%) | 15 (3.6%) |
| $2,000 to $2,499 | 16 (3.2%) | 0 (0.0%) |
| $2,500 to $2,999 | 3 (0.6%) | 0 (0.0%) |
| $3,000 or more | 0 (0.0%) | 0 (0.0%) |
| Total | 494 (100.0%) | 414 (100.0%) |
Physical Housing Characteristics in Bonners Ferry
Housing Structures in Bonners Ferry
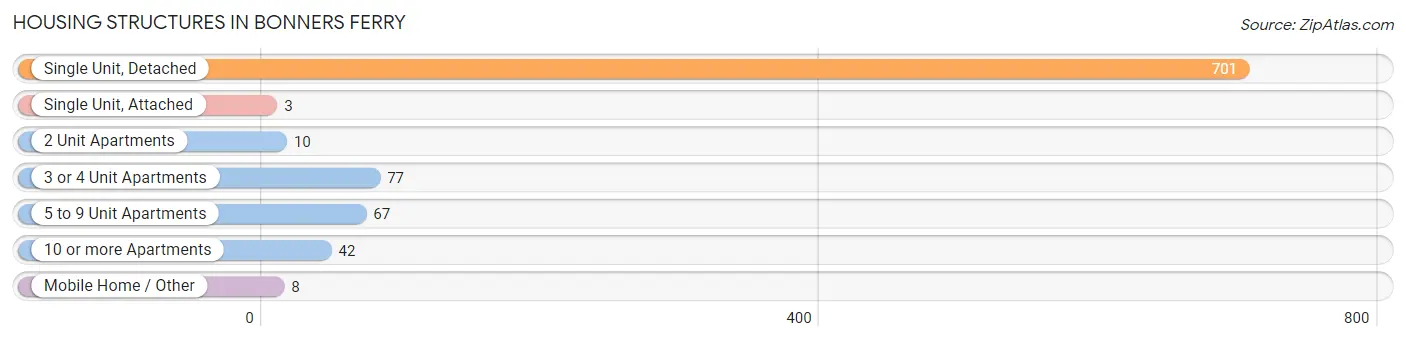
| Structure Type | # Housing Units | % Housing Units |
| Single Unit, Detached | 701 | 77.2% |
| Single Unit, Attached | 3 | 0.3% |
| 2 Unit Apartments | 10 | 1.1% |
| 3 or 4 Unit Apartments | 77 | 8.5% |
| 5 to 9 Unit Apartments | 67 | 7.4% |
| 10 or more Apartments | 42 | 4.6% |
| Mobile Home / Other | 8 | 0.9% |
| Total | 908 | 100.0% |
Housing Structures by Occupancy in Bonners Ferry
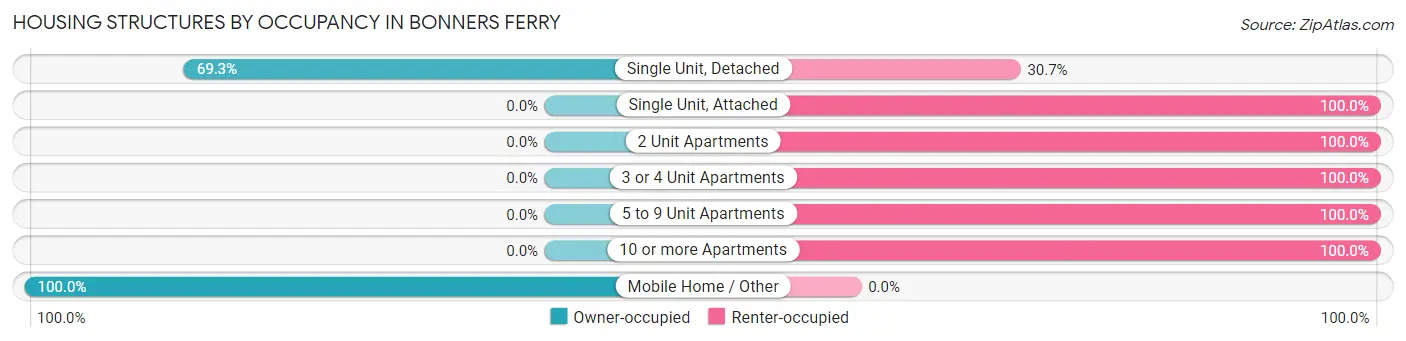
| Structure Type | Owner-occupied | Renter-occupied |
| Single Unit, Detached | 486 (69.3%) | 215 (30.7%) |
| Single Unit, Attached | 0 (0.0%) | 3 (100.0%) |
| 2 Unit Apartments | 0 (0.0%) | 10 (100.0%) |
| 3 or 4 Unit Apartments | 0 (0.0%) | 77 (100.0%) |
| 5 to 9 Unit Apartments | 0 (0.0%) | 67 (100.0%) |
| 10 or more Apartments | 0 (0.0%) | 42 (100.0%) |
| Mobile Home / Other | 8 (100.0%) | 0 (0.0%) |
| Total | 494 (54.4%) | 414 (45.6%) |
Housing Structures by Number of Rooms in Bonners Ferry
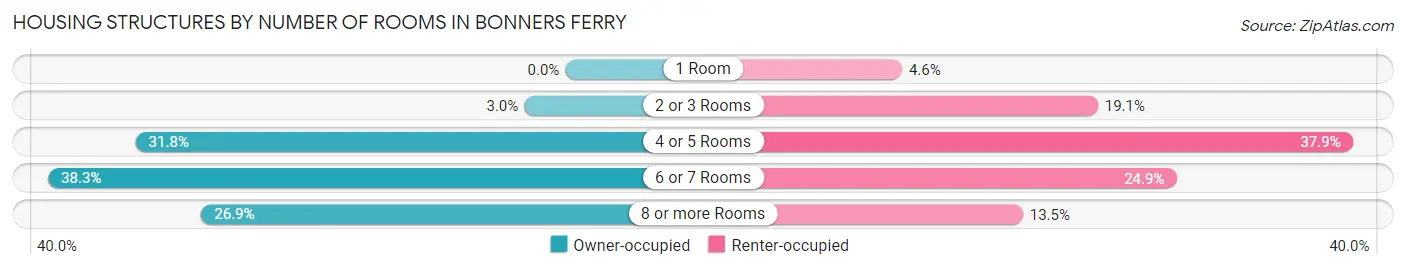
| Number of Rooms | Owner-occupied | Renter-occupied |
| 1 Room | 0 (0.0%) | 19 (4.6%) |
| 2 or 3 Rooms | 15 (3.0%) | 79 (19.1%) |
| 4 or 5 Rooms | 157 (31.8%) | 157 (37.9%) |
| 6 or 7 Rooms | 189 (38.3%) | 103 (24.9%) |
| 8 or more Rooms | 133 (26.9%) | 56 (13.5%) |
| Total | 494 (100.0%) | 414 (100.0%) |
Housing Structure by Heating Type in Bonners Ferry
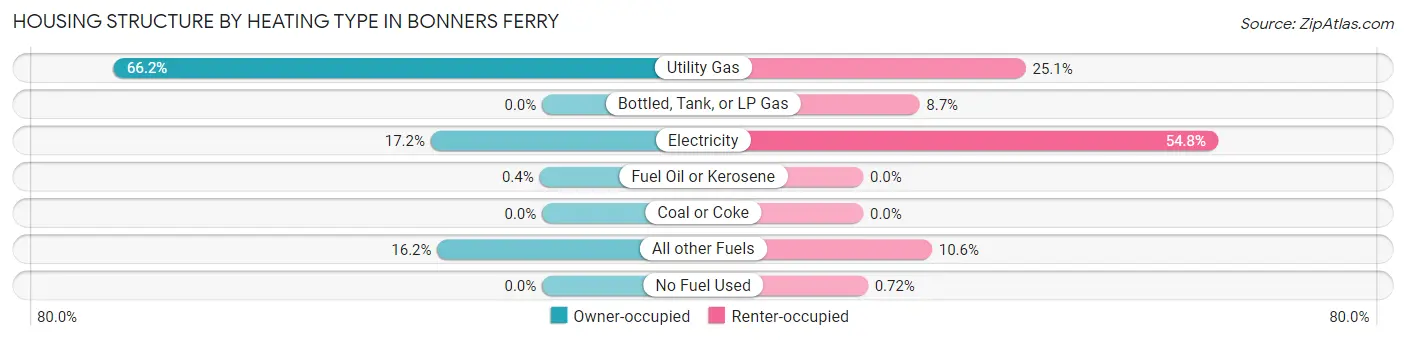
| Heating Type | Owner-occupied | Renter-occupied |
| Utility Gas | 327 (66.2%) | 104 (25.1%) |
| Bottled, Tank, or LP Gas | 0 (0.0%) | 36 (8.7%) |
| Electricity | 85 (17.2%) | 227 (54.8%) |
| Fuel Oil or Kerosene | 2 (0.4%) | 0 (0.0%) |
| Coal or Coke | 0 (0.0%) | 0 (0.0%) |
| All other Fuels | 80 (16.2%) | 44 (10.6%) |
| No Fuel Used | 0 (0.0%) | 3 (0.7%) |
| Total | 494 (100.0%) | 414 (100.0%) |
Household Vehicle Usage in Bonners Ferry
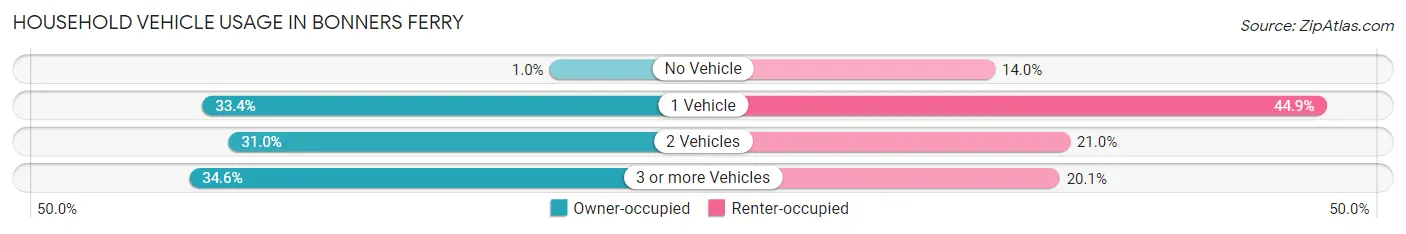
| Vehicles per Household | Owner-occupied | Renter-occupied |
| No Vehicle | 5 (1.0%) | 58 (14.0%) |
| 1 Vehicle | 165 (33.4%) | 186 (44.9%) |
| 2 Vehicles | 153 (31.0%) | 87 (21.0%) |
| 3 or more Vehicles | 171 (34.6%) | 83 (20.1%) |
| Total | 494 (100.0%) | 414 (100.0%) |
Real Estate & Mortgages in Bonners Ferry
Real Estate and Mortgage Overview in Bonners Ferry
| Characteristic | Without Mortgage | With Mortgage |
| Housing Units | 154 | 340 |
| Median Property Value | $194,900 | $209,400 |
| Median Household Income | $44,722 | $3 |
| Monthly Housing Costs | $442 | $0 |
| Real Estate Taxes | $1,130 | $0 |
Property Value by Mortgage Status in Bonners Ferry
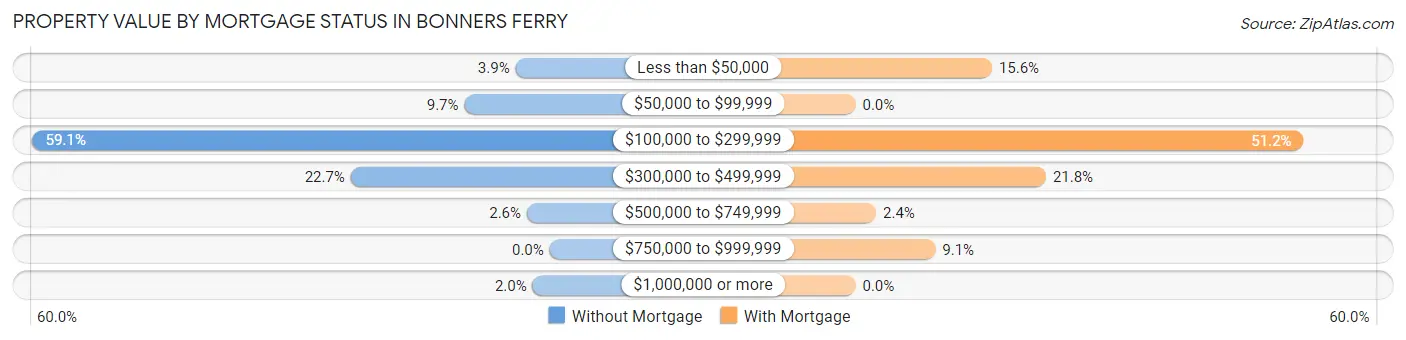
| Property Value | Without Mortgage | With Mortgage |
| Less than $50,000 | 6 (3.9%) | 53 (15.6%) |
| $50,000 to $99,999 | 15 (9.7%) | 0 (0.0%) |
| $100,000 to $299,999 | 91 (59.1%) | 174 (51.2%) |
| $300,000 to $499,999 | 35 (22.7%) | 74 (21.8%) |
| $500,000 to $749,999 | 4 (2.6%) | 8 (2.4%) |
| $750,000 to $999,999 | 0 (0.0%) | 31 (9.1%) |
| $1,000,000 or more | 3 (1.9%) | 0 (0.0%) |
| Total | 154 (100.0%) | 340 (100.0%) |
Household Income by Mortgage Status in Bonners Ferry
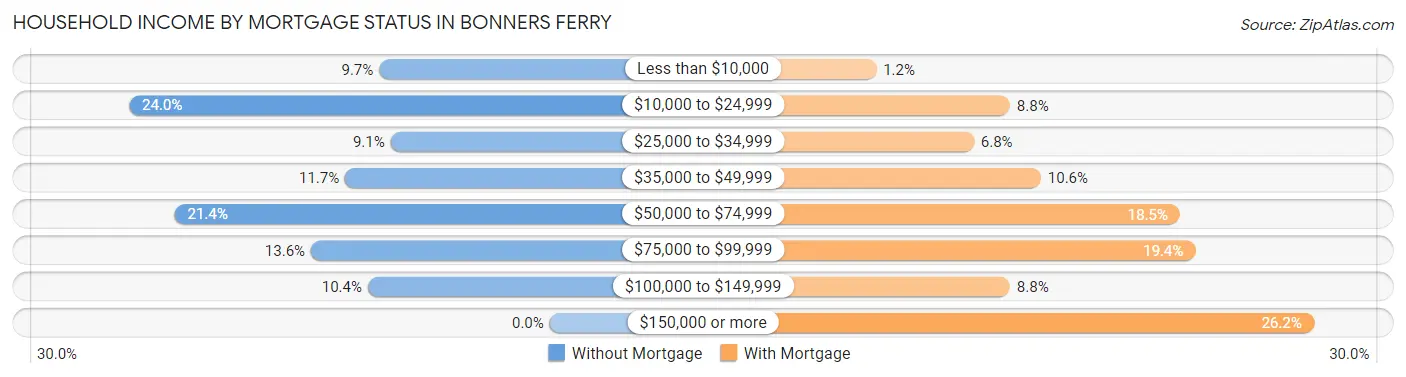
| Household Income | Without Mortgage | With Mortgage |
| Less than $10,000 | 15 (9.7%) | 4 (1.2%) |
| $10,000 to $24,999 | 37 (24.0%) | 30 (8.8%) |
| $25,000 to $34,999 | 14 (9.1%) | 23 (6.8%) |
| $35,000 to $49,999 | 18 (11.7%) | 36 (10.6%) |
| $50,000 to $74,999 | 33 (21.4%) | 63 (18.5%) |
| $75,000 to $99,999 | 21 (13.6%) | 66 (19.4%) |
| $100,000 to $149,999 | 16 (10.4%) | 30 (8.8%) |
| $150,000 or more | 0 (0.0%) | 89 (26.2%) |
| Total | 154 (100.0%) | 340 (100.0%) |
Property Value to Household Income Ratio in Bonners Ferry
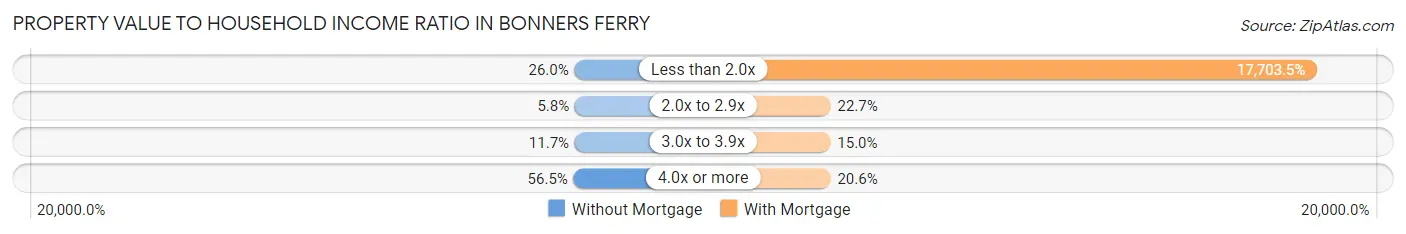
| Value-to-Income Ratio | Without Mortgage | With Mortgage |
| Less than 2.0x | 40 (26.0%) | 60,192 (17,703.5%) |
| 2.0x to 2.9x | 9 (5.8%) | 77 (22.7%) |
| 3.0x to 3.9x | 18 (11.7%) | 51 (15.0%) |
| 4.0x or more | 87 (56.5%) | 70 (20.6%) |
| Total | 154 (100.0%) | 340 (100.0%) |
Real Estate Taxes by Mortgage Status in Bonners Ferry
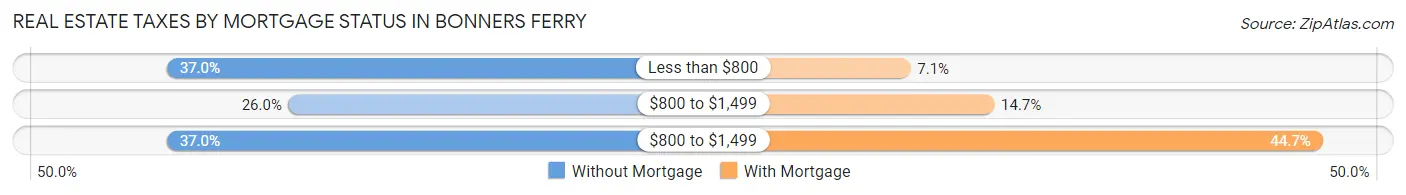
| Property Taxes | Without Mortgage | With Mortgage |
| Less than $800 | 57 (37.0%) | 24 (7.1%) |
| $800 to $1,499 | 40 (26.0%) | 50 (14.7%) |
| $800 to $1,499 | 57 (37.0%) | 152 (44.7%) |
| Total | 154 (100.0%) | 340 (100.0%) |
Health & Disability in Bonners Ferry
Health Insurance Coverage by Age in Bonners Ferry
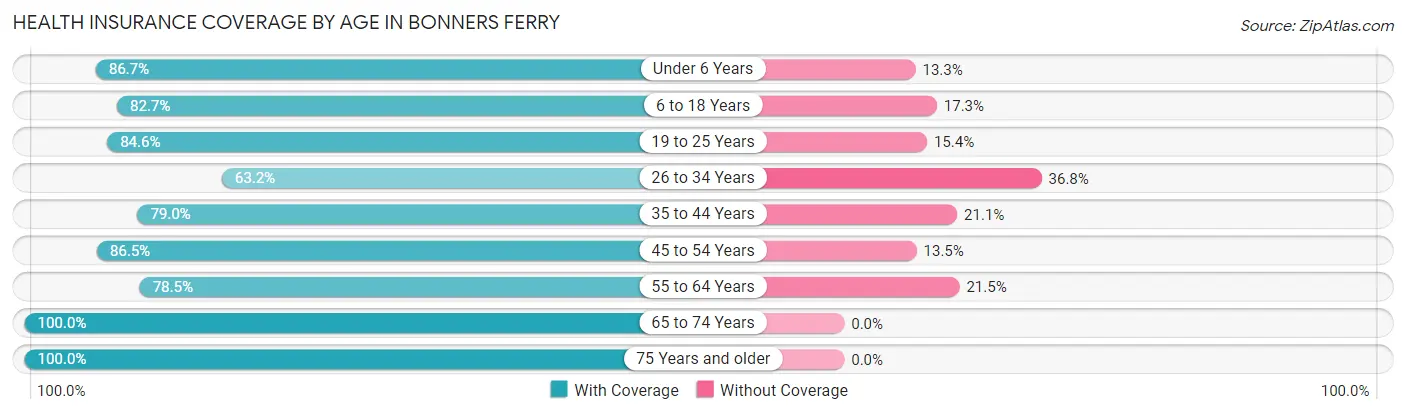
| Age Bracket | With Coverage | Without Coverage |
| Under 6 Years | 248 (86.7%) | 38 (13.3%) |
| 6 to 18 Years | 302 (82.7%) | 63 (17.3%) |
| 19 to 25 Years | 170 (84.6%) | 31 (15.4%) |
| 26 to 34 Years | 158 (63.2%) | 92 (36.8%) |
| 35 to 44 Years | 225 (78.9%) | 60 (21.0%) |
| 45 to 54 Years | 449 (86.5%) | 70 (13.5%) |
| 55 to 64 Years | 117 (78.5%) | 32 (21.5%) |
| 65 to 74 Years | 260 (100.0%) | 0 (0.0%) |
| 75 Years and older | 122 (100.0%) | 0 (0.0%) |
| Total | 2,051 (84.2%) | 386 (15.8%) |
Health Insurance Coverage by Citizenship Status in Bonners Ferry
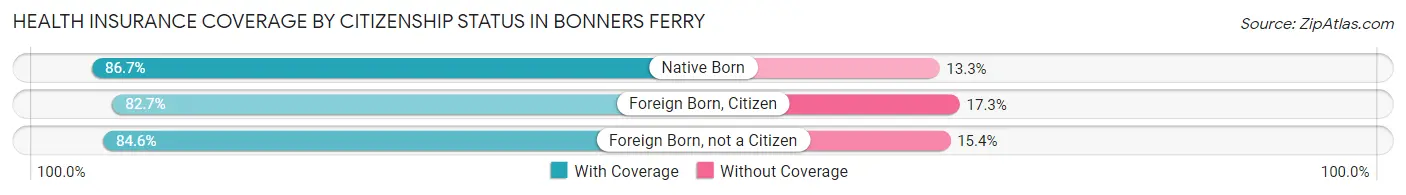
| Citizenship Status | With Coverage | Without Coverage |
| Native Born | 248 (86.7%) | 38 (13.3%) |
| Foreign Born, Citizen | 302 (82.7%) | 63 (17.3%) |
| Foreign Born, not a Citizen | 170 (84.6%) | 31 (15.4%) |
Health Insurance Coverage by Household Income in Bonners Ferry
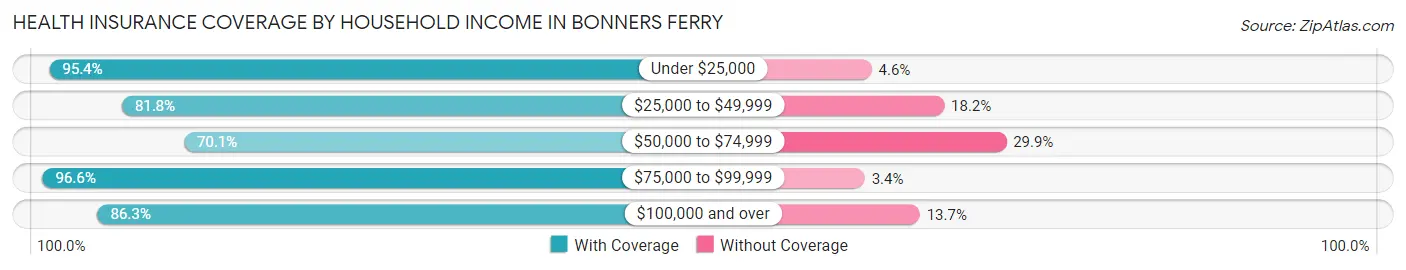
| Household Income | With Coverage | Without Coverage |
| Under $25,000 | 267 (95.4%) | 13 (4.6%) |
| $25,000 to $49,999 | 435 (81.8%) | 97 (18.2%) |
| $50,000 to $74,999 | 397 (70.1%) | 169 (29.9%) |
| $75,000 to $99,999 | 374 (96.6%) | 13 (3.4%) |
| $100,000 and over | 569 (86.3%) | 90 (13.7%) |
Public vs Private Health Insurance Coverage by Age in Bonners Ferry
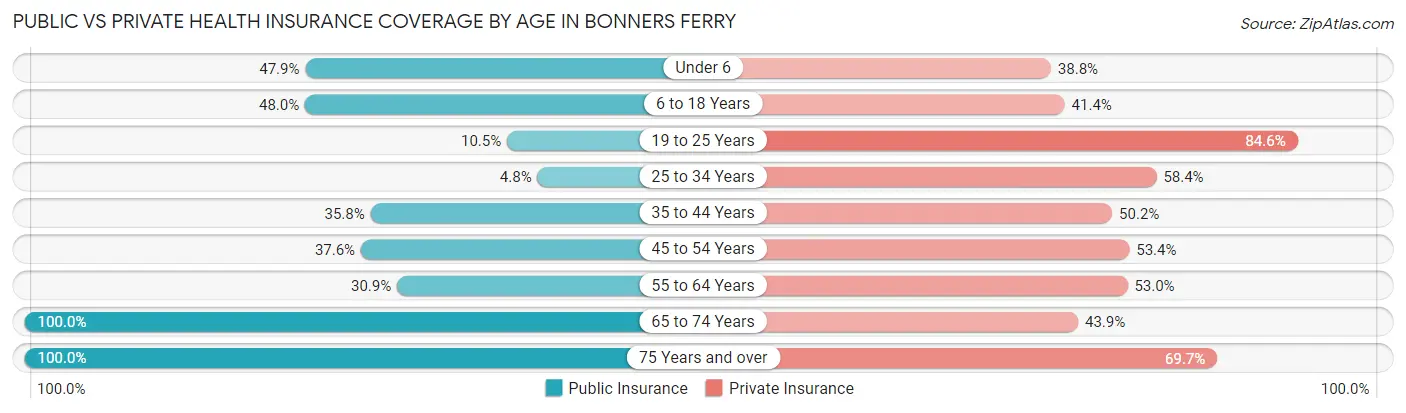
| Age Bracket | Public Insurance | Private Insurance |
| Under 6 | 137 (47.9%) | 111 (38.8%) |
| 6 to 18 Years | 175 (47.9%) | 151 (41.4%) |
| 19 to 25 Years | 21 (10.4%) | 170 (84.6%) |
| 25 to 34 Years | 12 (4.8%) | 146 (58.4%) |
| 35 to 44 Years | 102 (35.8%) | 143 (50.2%) |
| 45 to 54 Years | 195 (37.6%) | 277 (53.4%) |
| 55 to 64 Years | 46 (30.9%) | 79 (53.0%) |
| 65 to 74 Years | 260 (100.0%) | 114 (43.9%) |
| 75 Years and over | 122 (100.0%) | 85 (69.7%) |
| Total | 1,070 (43.9%) | 1,276 (52.4%) |
Disability Status by Sex by Age in Bonners Ferry
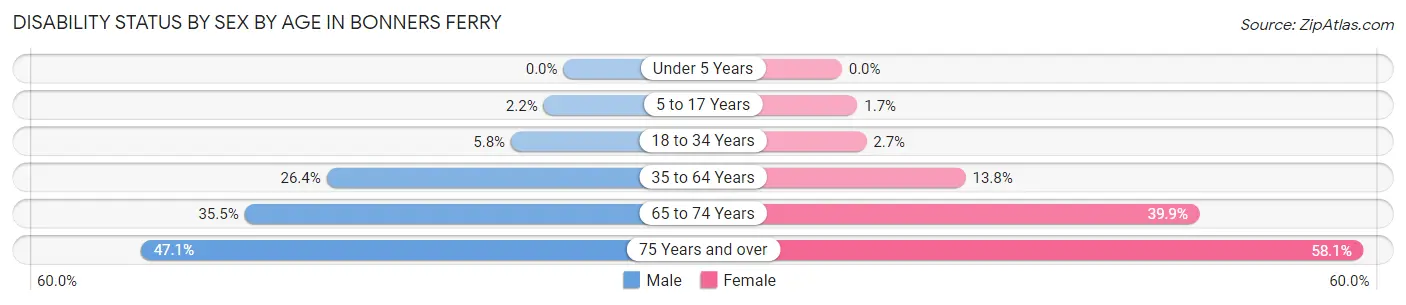
| Age Bracket | Male | Female |
| Under 5 Years | 0 (0.0%) | 0 (0.0%) |
| 5 to 17 Years | 4 (2.2%) | 3 (1.7%) |
| 18 to 34 Years | 18 (5.8%) | 5 (2.7%) |
| 35 to 64 Years | 125 (26.4%) | 66 (13.8%) |
| 65 to 74 Years | 38 (35.5%) | 61 (39.9%) |
| 75 Years and over | 8 (47.1%) | 61 (58.1%) |
Disability Class by Sex by Age in Bonners Ferry
Disability Class: Hearing Difficulty
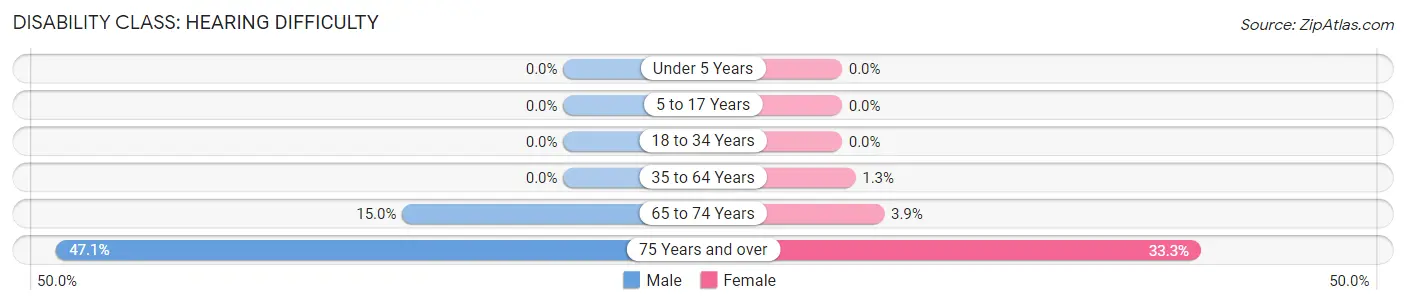
| Age Bracket | Male | Female |
| Under 5 Years | 0 (0.0%) | 0 (0.0%) |
| 5 to 17 Years | 0 (0.0%) | 0 (0.0%) |
| 18 to 34 Years | 0 (0.0%) | 0 (0.0%) |
| 35 to 64 Years | 0 (0.0%) | 6 (1.3%) |
| 65 to 74 Years | 16 (14.9%) | 6 (3.9%) |
| 75 Years and over | 8 (47.1%) | 35 (33.3%) |
Disability Class: Vision Difficulty
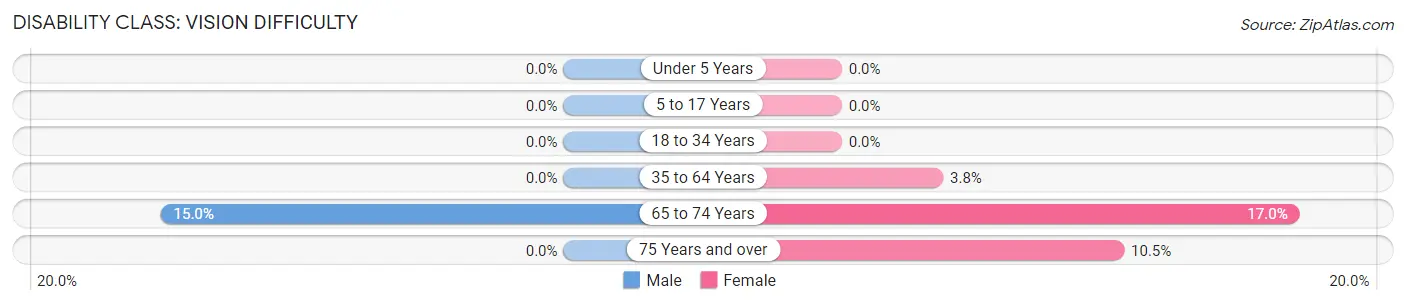
| Age Bracket | Male | Female |
| Under 5 Years | 0 (0.0%) | 0 (0.0%) |
| 5 to 17 Years | 0 (0.0%) | 0 (0.0%) |
| 18 to 34 Years | 0 (0.0%) | 0 (0.0%) |
| 35 to 64 Years | 0 (0.0%) | 18 (3.8%) |
| 65 to 74 Years | 16 (14.9%) | 26 (17.0%) |
| 75 Years and over | 0 (0.0%) | 11 (10.5%) |
Disability Class: Cognitive Difficulty
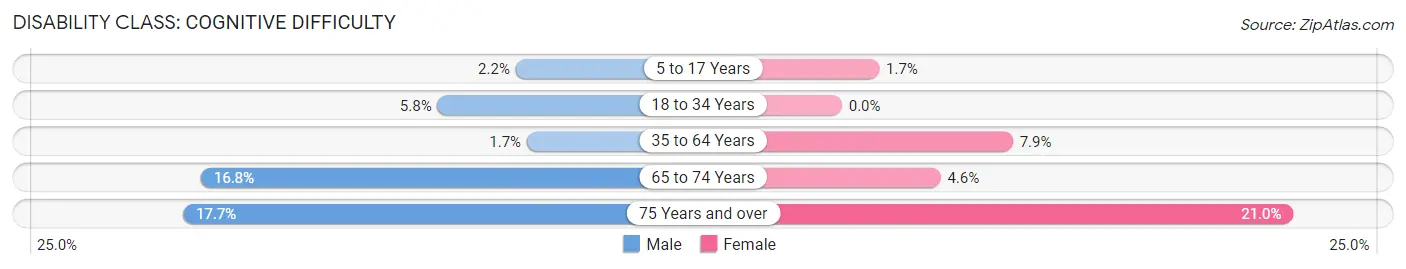
| Age Bracket | Male | Female |
| 5 to 17 Years | 4 (2.2%) | 3 (1.7%) |
| 18 to 34 Years | 18 (5.8%) | 0 (0.0%) |
| 35 to 64 Years | 8 (1.7%) | 38 (7.9%) |
| 65 to 74 Years | 18 (16.8%) | 7 (4.6%) |
| 75 Years and over | 3 (17.6%) | 22 (20.9%) |
Disability Class: Ambulatory Difficulty
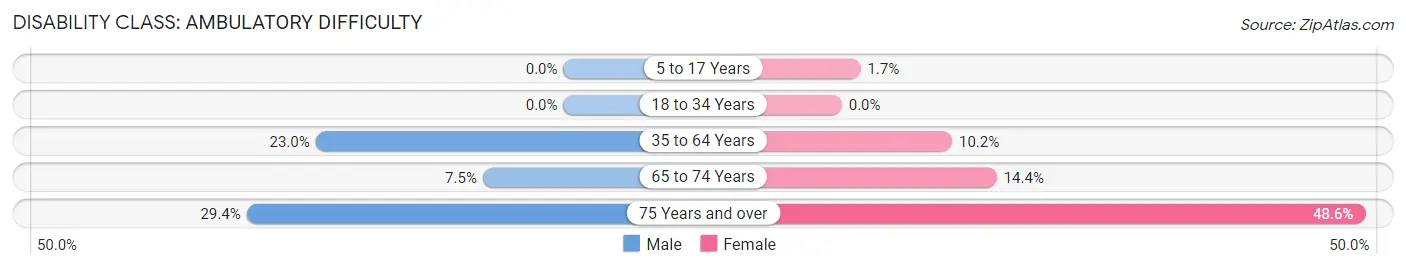
| Age Bracket | Male | Female |
| 5 to 17 Years | 0 (0.0%) | 3 (1.7%) |
| 18 to 34 Years | 0 (0.0%) | 0 (0.0%) |
| 35 to 64 Years | 109 (23.0%) | 49 (10.2%) |
| 65 to 74 Years | 8 (7.5%) | 22 (14.4%) |
| 75 Years and over | 5 (29.4%) | 51 (48.6%) |
Disability Class: Self-Care Difficulty
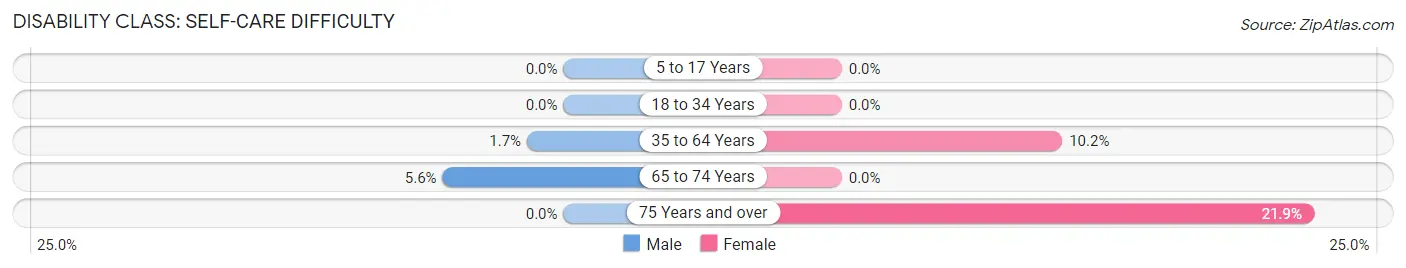
| Age Bracket | Male | Female |
| 5 to 17 Years | 0 (0.0%) | 0 (0.0%) |
| 18 to 34 Years | 0 (0.0%) | 0 (0.0%) |
| 35 to 64 Years | 8 (1.7%) | 49 (10.2%) |
| 65 to 74 Years | 6 (5.6%) | 0 (0.0%) |
| 75 Years and over | 0 (0.0%) | 23 (21.9%) |
Technology Access in Bonners Ferry
Computing Device Access in Bonners Ferry
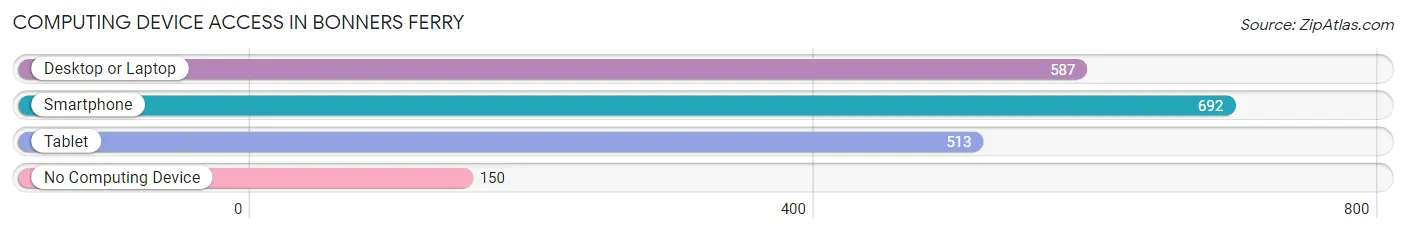
| Device Type | # Households | % Households |
| Desktop or Laptop | 587 | 64.6% |
| Smartphone | 692 | 76.2% |
| Tablet | 513 | 56.5% |
| No Computing Device | 150 | 16.5% |
| Total | 908 | 100.0% |
Internet Access in Bonners Ferry
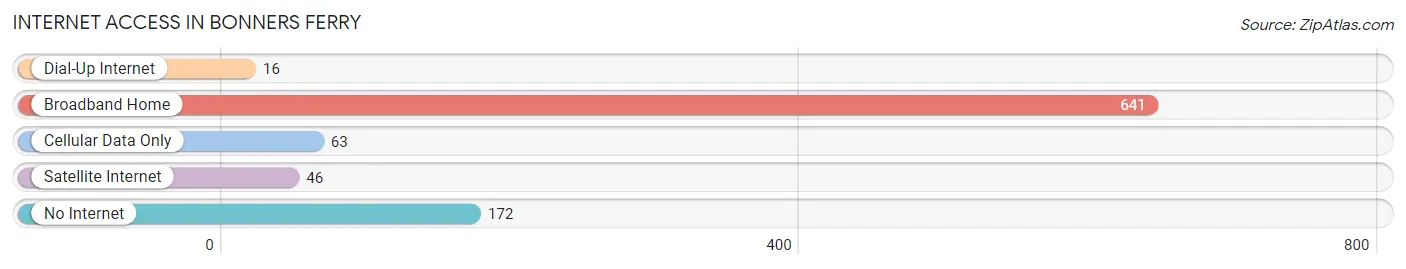
| Internet Type | # Households | % Households |
| Dial-Up Internet | 16 | 1.8% |
| Broadband Home | 641 | 70.6% |
| Cellular Data Only | 63 | 6.9% |
| Satellite Internet | 46 | 5.1% |
| No Internet | 172 | 18.9% |
| Total | 908 | 100.0% |
Bonners Ferry Summary
Bonners Ferry is a small city located in the northernmost part of the state of Idaho, in Boundary County. It is situated on the Kootenai River, near the Canadian border, and is the county seat of Boundary County. The city has a population of 2,543, according to the 2010 census, and is the largest city in the county.
History
The area around Bonners Ferry has been inhabited by Native Americans for thousands of years. The Kootenai Tribe, a Salish-speaking people, were the first to settle in the area. The Kootenai were known for their fishing and hunting skills, and the area was a popular hunting ground for the tribe.
In the late 1800s, the area was settled by European settlers, who established a trading post and ferry service on the Kootenai River. The ferry service was operated by Edwin Bonner, who gave the city its name. The city was officially incorporated in 1907.
Geography
Bonners Ferry is located in the northernmost part of Idaho, in Boundary County. It is situated on the Kootenai River, near the Canadian border. The city is surrounded by the Selkirk Mountains to the east, and the Purcell Mountains to the west. The city is located at an elevation of 1,845 feet (562 m).
The climate in Bonners Ferry is classified as a humid continental climate, with cold winters and warm summers. The average annual temperature is 44.3°F (6.8°C), and the average annual precipitation is 17.3 inches (44 cm).
Economy
The economy of Bonners Ferry is largely based on agriculture and tourism. The city is home to several farms, which produce a variety of crops, including potatoes, wheat, and hay. The city is also home to several tourist attractions, including the Kootenai River, the Selkirk Mountains, and the Purcell Mountains.
The city is also home to several manufacturing companies, including a wood products company, a metal fabrication company, and a plastics company. The city is also home to several retail stores, restaurants, and other businesses.
Demographics
According to the 2010 census, the population of Bonners Ferry was 2,543. The racial makeup of the city was 94.3% White, 0.7% Native American, 0.3% Asian, 0.2% African American, 0.1% Pacific Islander, and 4.4% from other races. The median household income was $35,938, and the median family income was $41,944.
The city is served by the Boundary County School District, which includes two elementary schools, one middle school, and one high school. The city is also home to North Idaho College, a two-year community college.
Conclusion
Bonners Ferry is a small city located in the northernmost part of Idaho, in Boundary County. It is situated on the Kootenai River, near the Canadian border, and is the county seat of Boundary County. The city has a population of 2,543, according to the 2010 census, and is the largest city in the county. The economy of Bonners Ferry is largely based on agriculture and tourism, and the city is home to several farms, tourist attractions, manufacturing companies, and retail stores. The racial makeup of the city is 94.3% White, 0.7% Native American, 0.3% Asian, 0.2% African American, 0.1% Pacific Islander, and 4.4% from other races. The median household income was $35,938, and the median family income was $41,944. Bonners Ferry is served by the Boundary County School District, and is home to North Idaho College.
Common Questions
What is Per Capita Income in Bonners Ferry?
Per Capita income in Bonners Ferry is $21,376.
What is the Median Family Income in Bonners Ferry?
Median Family Income in Bonners Ferry is $53,056.
What is the Median Household income in Bonners Ferry?
Median Household Income in Bonners Ferry is $46,667.
What is Income or Wage Gap in Bonners Ferry?
Income or Wage Gap in Bonners Ferry is 12.4%.
Women in Bonners Ferry earn 87.6 cents for every dollar earned by a man.
What is Inequality or Gini Index in Bonners Ferry?
Inequality or Gini Index in Bonners Ferry is 0.37.
What is the Total Population of Bonners Ferry?
Total Population of Bonners Ferry is 2,558.
What is the Total Male Population of Bonners Ferry?
Total Male Population of Bonners Ferry is 1,365.
What is the Total Female Population of Bonners Ferry?
Total Female Population of Bonners Ferry is 1,193.
What is the Ratio of Males per 100 Females in Bonners Ferry?
There are 114.42 Males per 100 Females in Bonners Ferry.
What is the Ratio of Females per 100 Males in Bonners Ferry?
There are 87.40 Females per 100 Males in Bonners Ferry.
What is the Median Population Age in Bonners Ferry?
Median Population Age in Bonners Ferry is 40.5 Years.
What is the Average Family Size in Bonners Ferry
Average Family Size in Bonners Ferry is 3.2 People.
What is the Average Household Size in Bonners Ferry
Average Household Size in Bonners Ferry is 2.7 People.
How Large is the Labor Force in Bonners Ferry?
There are 1,181 People in the Labor Forcein in Bonners Ferry.
What is the Percentage of People in the Labor Force in Bonners Ferry?
59.3% of People are in the Labor Force in Bonners Ferry.
What is the Unemployment Rate in Bonners Ferry?
Unemployment Rate in Bonners Ferry is 0.9%.