Bancroft, ID Map & Demographics
Bancroft Map
Bancroft Overview
$29,418
PER CAPITA INCOME
$85,000
AVG FAMILY INCOME
$76,250
AVG HOUSEHOLD INCOME
0.27
INEQUALITY / GINI INDEX
347
TOTAL POPULATION
187
MALE POPULATION
160
FEMALE POPULATION
116.88
MALES / 100 FEMALES
85.56
FEMALES / 100 MALES
30.8
MEDIAN AGE
3.4
AVG FAMILY SIZE
2.9
AVG HOUSEHOLD SIZE
175
LABOR FORCE [ PEOPLE ]
57.4%
PERCENT IN LABOR FORCE
Bancroft Zip Codes
Bancroft Area Codes
Income in Bancroft
Income Overview in Bancroft
Per Capita Income in Bancroft is $29,418, while median incomes of families and households are $85,000 and $76,250 respectively.
| Characteristic | Number | Measure |
| Per Capita Income | 347 | $29,418 |
| Median Family Income | 90 | $85,000 |
| Mean Family Income | 90 | $87,143 |
| Median Household Income | 121 | $76,250 |
| Mean Household Income | 121 | $82,131 |
| Income Deficit | 90 | $0 |
| Wage / Income Gap (%) | 347 | 0.00% |
| Wage / Income Gap ($) | 347 | 100.00¢ per $1 |
| Gini / Inequality Index | 347 | 0.27 |
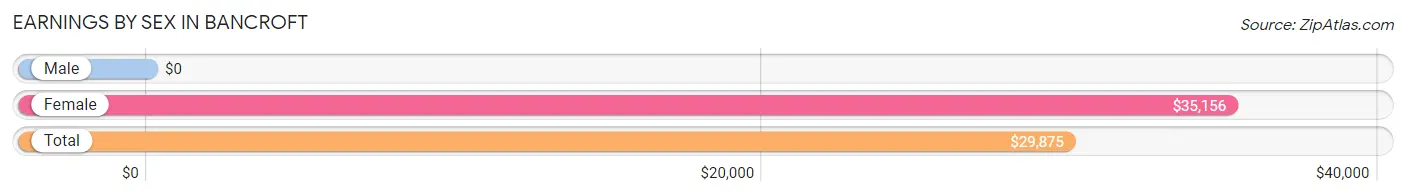
Earnings by Sex in Bancroft
| Sex | Number | Average Earnings |
| Male | 122 (65.9%) | $0 |
| Female | 63 (34.1%) | $35,156 |
| Total | 185 (100.0%) | $29,875 |
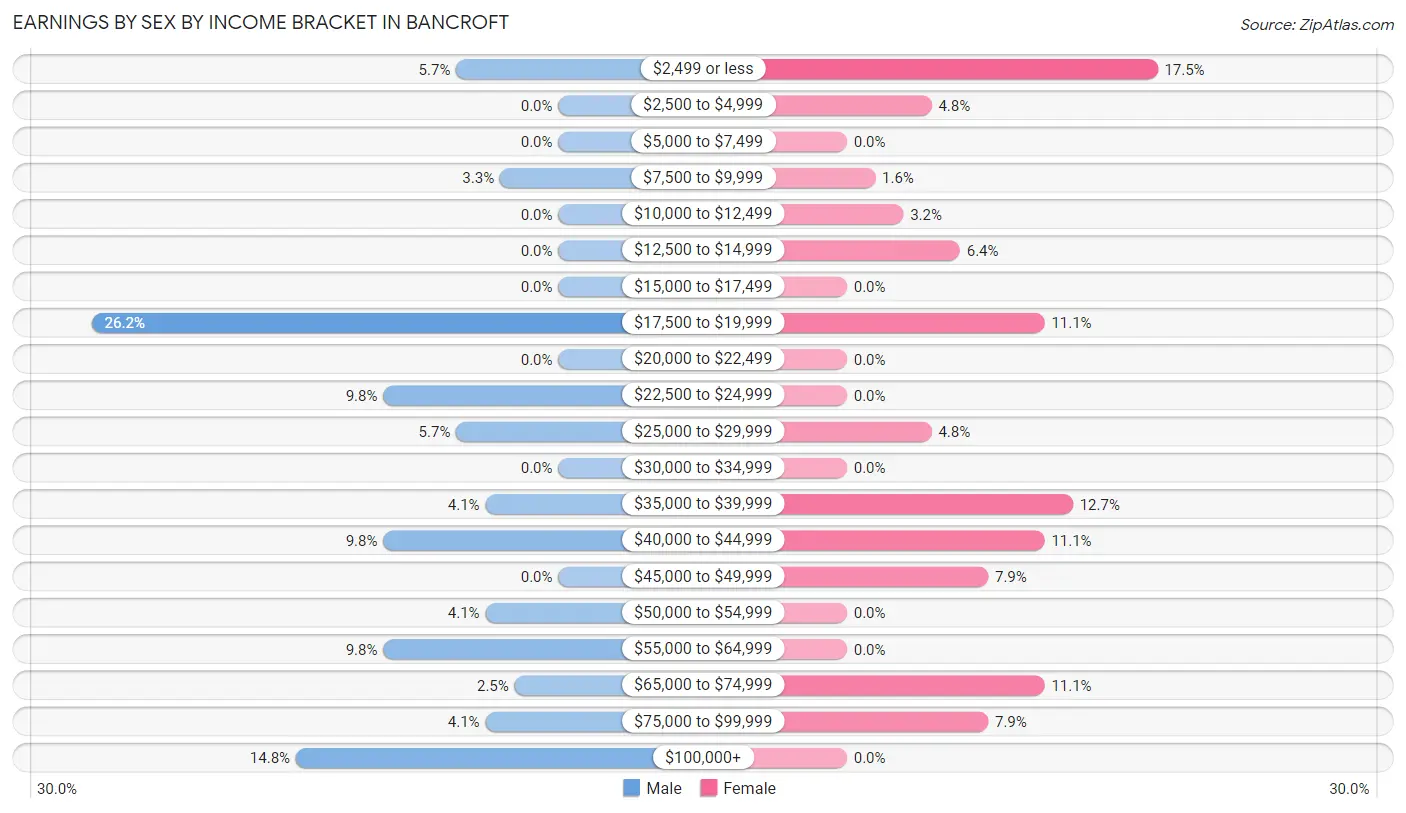
Earnings by Sex by Income Bracket in Bancroft
The most common earnings brackets in Bancroft are $17,500 to $19,999 for men (32 | 26.2%) and $2,499 or less for women (11 | 17.5%).
| Income | Male | Female |
| $2,499 or less | 7 (5.7%) | 11 (17.5%) |
| $2,500 to $4,999 | 0 (0.0%) | 3 (4.8%) |
| $5,000 to $7,499 | 0 (0.0%) | 0 (0.0%) |
| $7,500 to $9,999 | 4 (3.3%) | 1 (1.6%) |
| $10,000 to $12,499 | 0 (0.0%) | 2 (3.2%) |
| $12,500 to $14,999 | 0 (0.0%) | 4 (6.4%) |
| $15,000 to $17,499 | 0 (0.0%) | 0 (0.0%) |
| $17,500 to $19,999 | 32 (26.2%) | 7 (11.1%) |
| $20,000 to $22,499 | 0 (0.0%) | 0 (0.0%) |
| $22,500 to $24,999 | 12 (9.8%) | 0 (0.0%) |
| $25,000 to $29,999 | 7 (5.7%) | 3 (4.8%) |
| $30,000 to $34,999 | 0 (0.0%) | 0 (0.0%) |
| $35,000 to $39,999 | 5 (4.1%) | 8 (12.7%) |
| $40,000 to $44,999 | 12 (9.8%) | 7 (11.1%) |
| $45,000 to $49,999 | 0 (0.0%) | 5 (7.9%) |
| $50,000 to $54,999 | 5 (4.1%) | 0 (0.0%) |
| $55,000 to $64,999 | 12 (9.8%) | 0 (0.0%) |
| $65,000 to $74,999 | 3 (2.5%) | 7 (11.1%) |
| $75,000 to $99,999 | 5 (4.1%) | 5 (7.9%) |
| $100,000+ | 18 (14.7%) | 0 (0.0%) |
| Total | 122 (100.0%) | 63 (100.0%) |
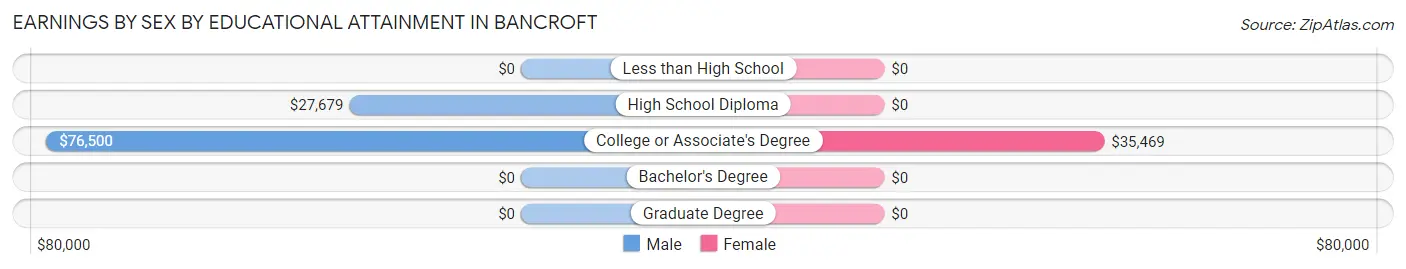
Earnings by Sex by Educational Attainment in Bancroft
Average earnings in Bancroft are $50,750 for men and $36,875 for women, a difference of 27.3%. Men with an educational attainment of college or associate's degree enjoy the highest average annual earnings of $76,500, while those with high school diploma education earn the least with $27,679. Women with an educational attainment of college or associate's degree earn the most with the average annual earnings of $35,469, while those with college or associate's degree education have the smallest earnings of $35,469.
| Educational Attainment | Male Income | Female Income |
| Less than High School | - | - |
| High School Diploma | $27,679 | $0 |
| College or Associate's Degree | $76,500 | $35,469 |
| Bachelor's Degree | - | - |
| Graduate Degree | - | - |
| Total | $50,750 | $36,875 |
Family Income in Bancroft
Family Income Brackets in Bancroft
According to the Bancroft family income data, there are 27 families falling into the $100,000 to $149,999 income range, which is the most common income bracket and makes up 30.0% of all families.
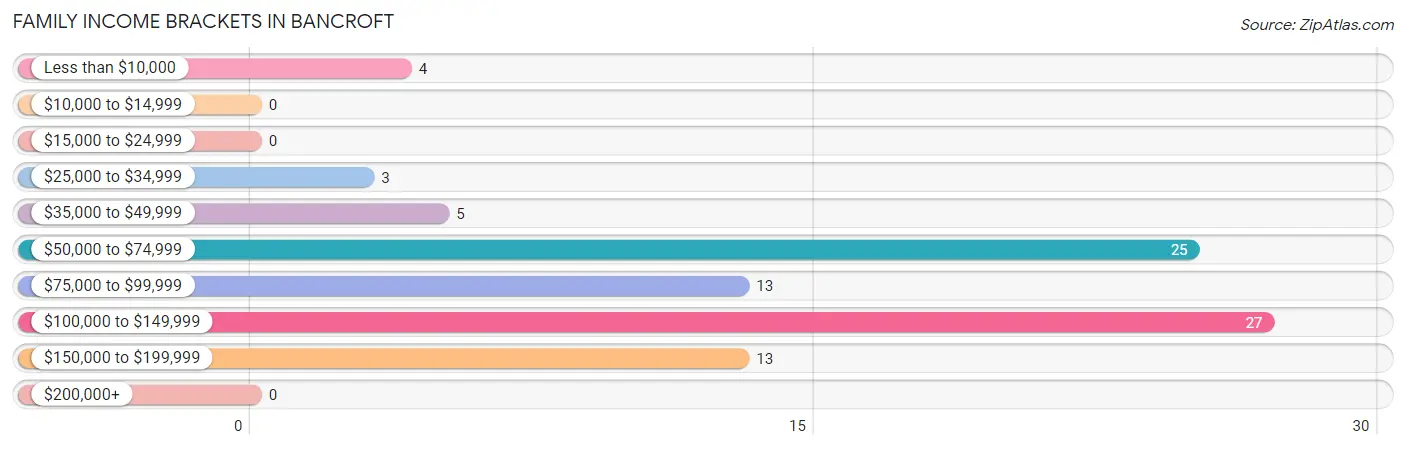
| Income Bracket | # Families | % Families |
| Less than $10,000 | 4 | 4.4% |
| $10,000 to $14,999 | 0 | 0.0% |
| $15,000 to $24,999 | 0 | 0.0% |
| $25,000 to $34,999 | 3 | 3.3% |
| $35,000 to $49,999 | 5 | 5.6% |
| $50,000 to $74,999 | 25 | 27.8% |
| $75,000 to $99,999 | 13 | 14.4% |
| $100,000 to $149,999 | 27 | 30.0% |
| $150,000 to $199,999 | 13 | 14.4% |
| $200,000+ | 0 | 0.0% |
Family Income by Famaliy Size in Bancroft
4-person families (24 | 26.7%) account for the highest median family income in Bancroft with $102,857 per family, while 2-person families (49 | 54.4%) have the highest median income of $34,688 per family member.
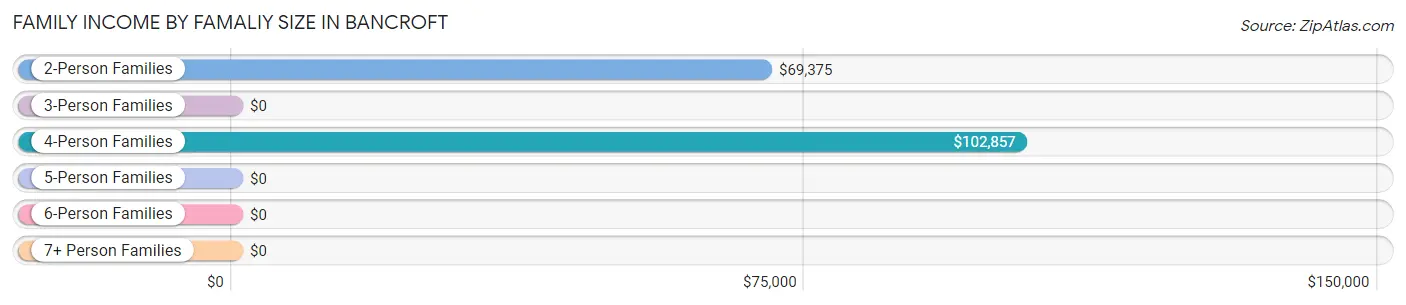
| Income Bracket | # Families | Median Income |
| 2-Person Families | 49 (54.4%) | $69,375 |
| 3-Person Families | 17 (18.9%) | $0 |
| 4-Person Families | 24 (26.7%) | $102,857 |
| 5-Person Families | 0 (0.0%) | $0 |
| 6-Person Families | 0 (0.0%) | $0 |
| 7+ Person Families | 0 (0.0%) | $0 |
| Total | 90 (100.0%) | $85,000 |
Family Income by Number of Earners in Bancroft
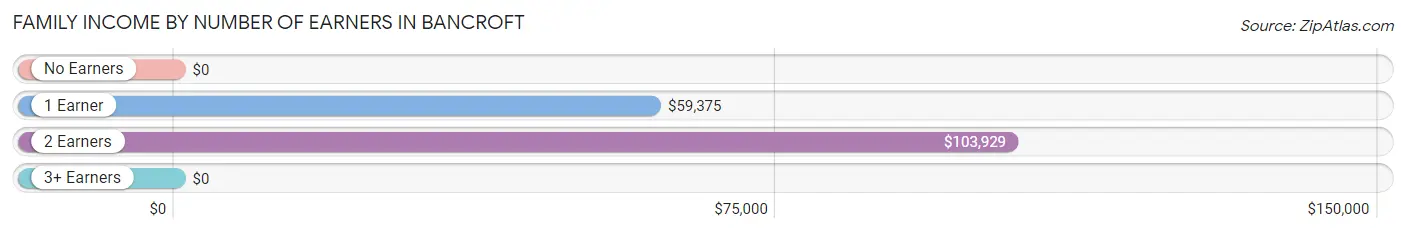
| Number of Earners | # Families | Median Income |
| No Earners | 7 (7.8%) | $0 |
| 1 Earner | 27 (30.0%) | $59,375 |
| 2 Earners | 54 (60.0%) | $103,929 |
| 3+ Earners | 2 (2.2%) | $0 |
| Total | 90 (100.0%) | $85,000 |
Household Income in Bancroft
Household Income Brackets in Bancroft
With 37 households falling in the category, the $100,000 to $149,999 income range is the most frequent in Bancroft, accounting for 30.6% of all households.
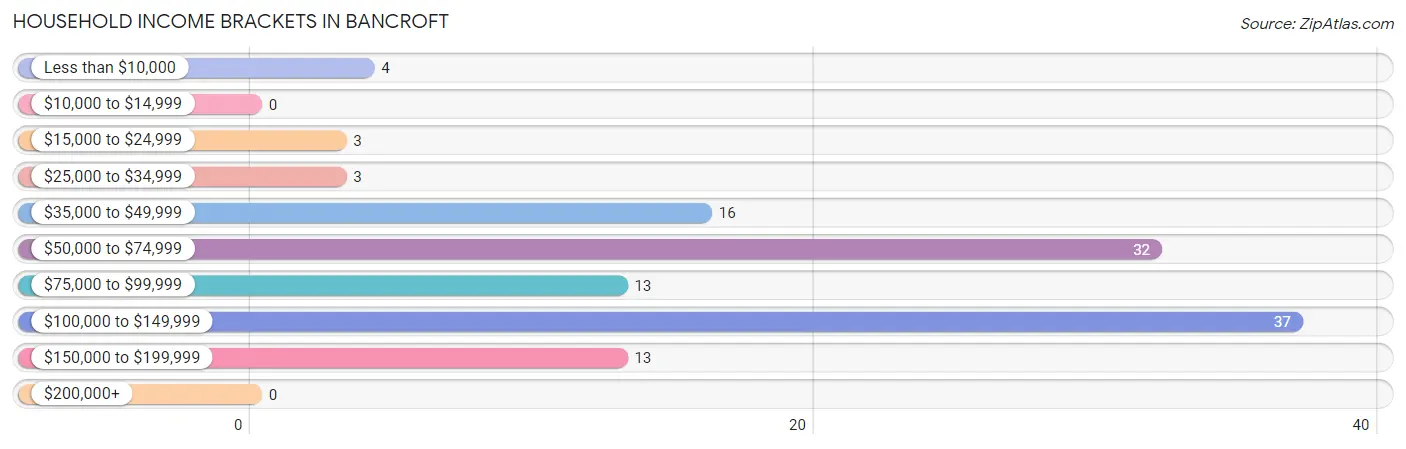
| Income Bracket | # Households | % Households |
| Less than $10,000 | 4 | 3.3% |
| $10,000 to $14,999 | 0 | 0.0% |
| $15,000 to $24,999 | 3 | 2.5% |
| $25,000 to $34,999 | 3 | 2.5% |
| $35,000 to $49,999 | 16 | 13.2% |
| $50,000 to $74,999 | 32 | 26.4% |
| $75,000 to $99,999 | 13 | 10.7% |
| $100,000 to $149,999 | 37 | 30.6% |
| $150,000 to $199,999 | 13 | 10.7% |
| $200,000+ | 0 | 0.0% |
Household Income by Householder Age in Bancroft
The median household income in Bancroft is $76,250, with the highest median household income of $104,018 found in the 45 to 64 years age bracket for the primary householder. A total of 57 households (47.1%) fall into this category.
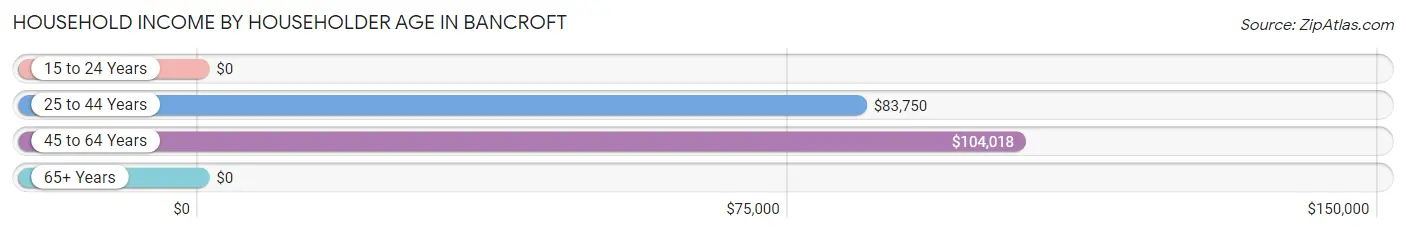
| Income Bracket | # Households | Median Income |
| 15 to 24 Years | 0 (0.0%) | $0 |
| 25 to 44 Years | 25 (20.7%) | $83,750 |
| 45 to 64 Years | 57 (47.1%) | $104,018 |
| 65+ Years | 39 (32.2%) | $0 |
| Total | 121 (100.0%) | $76,250 |
Poverty in Bancroft
Income Below Poverty by Sex and Age in Bancroft
With 5.9% poverty level for males and 2.5% for females among the residents of Bancroft, 75 year old and over males and 75 year old and over females are the most vulnerable to poverty, with 4 males (28.6%) and 4 females (23.5%) in their respective age groups living below the poverty level.
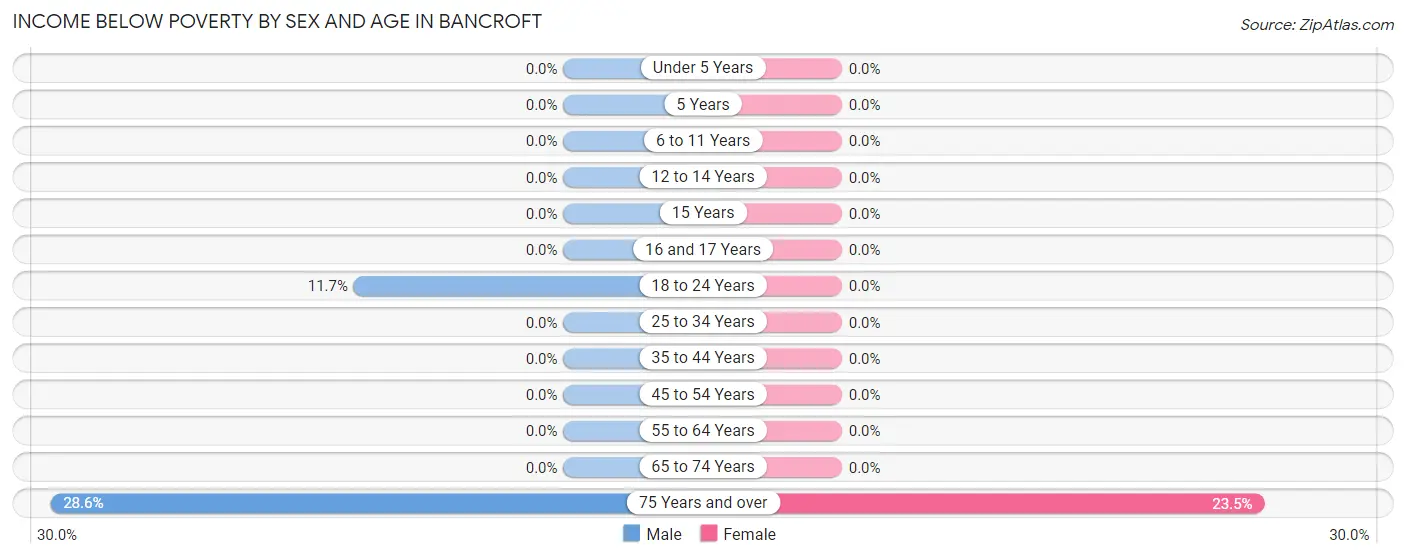
| Age Bracket | Male | Female |
| Under 5 Years | 0 (0.0%) | 0 (0.0%) |
| 5 Years | 0 (0.0%) | 0 (0.0%) |
| 6 to 11 Years | 0 (0.0%) | 0 (0.0%) |
| 12 to 14 Years | 0 (0.0%) | 0 (0.0%) |
| 15 Years | 0 (0.0%) | 0 (0.0%) |
| 16 and 17 Years | 0 (0.0%) | 0 (0.0%) |
| 18 to 24 Years | 7 (11.7%) | 0 (0.0%) |
| 25 to 34 Years | 0 (0.0%) | 0 (0.0%) |
| 35 to 44 Years | 0 (0.0%) | 0 (0.0%) |
| 45 to 54 Years | 0 (0.0%) | 0 (0.0%) |
| 55 to 64 Years | 0 (0.0%) | 0 (0.0%) |
| 65 to 74 Years | 0 (0.0%) | 0 (0.0%) |
| 75 Years and over | 4 (28.6%) | 4 (23.5%) |
| Total | 11 (5.9%) | 4 (2.5%) |
Income Above Poverty by Sex and Age in Bancroft
According to the poverty statistics in Bancroft, males aged under 5 years and females aged 6 to 11 years are the age groups that are most secure financially, with 100.0% of males and 100.0% of females in these age groups living above the poverty line.
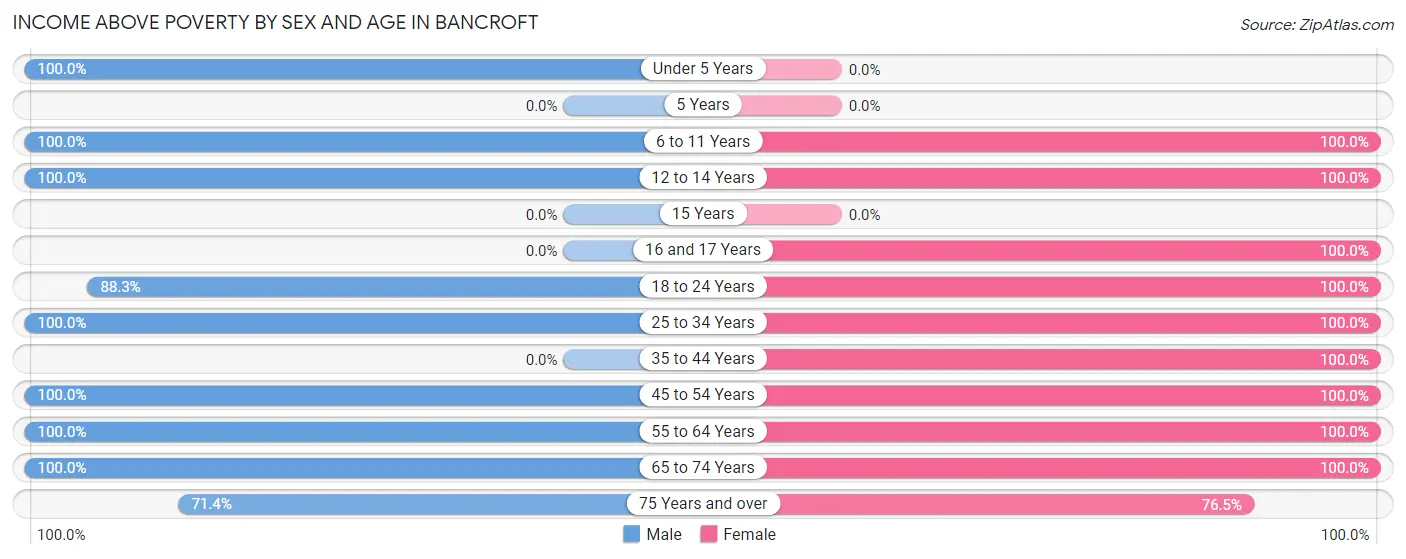
| Age Bracket | Male | Female |
| Under 5 Years | 22 (100.0%) | 0 (0.0%) |
| 5 Years | 0 (0.0%) | 0 (0.0%) |
| 6 to 11 Years | 5 (100.0%) | 11 (100.0%) |
| 12 to 14 Years | 2 (100.0%) | 2 (100.0%) |
| 15 Years | 0 (0.0%) | 0 (0.0%) |
| 16 and 17 Years | 0 (0.0%) | 8 (100.0%) |
| 18 to 24 Years | 53 (88.3%) | 38 (100.0%) |
| 25 to 34 Years | 26 (100.0%) | 14 (100.0%) |
| 35 to 44 Years | 0 (0.0%) | 11 (100.0%) |
| 45 to 54 Years | 28 (100.0%) | 38 (100.0%) |
| 55 to 64 Years | 16 (100.0%) | 9 (100.0%) |
| 65 to 74 Years | 14 (100.0%) | 12 (100.0%) |
| 75 Years and over | 10 (71.4%) | 13 (76.5%) |
| Total | 176 (94.1%) | 156 (97.5%) |
Income Below Poverty Among Married-Couple Families in Bancroft
The poverty statistics for married-couple families in Bancroft show that 5.3% or 4 of the total 76 families live below the poverty line. Families with no children have the highest poverty rate of 7.0%, comprising of 4 families. On the other hand, families with 1 or 2 children have the lowest poverty rate of 0.0%, which includes 0 families.
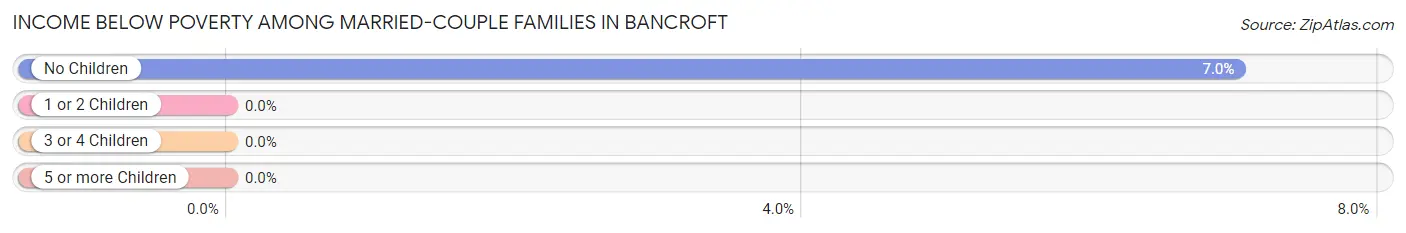
| Children | Above Poverty | Below Poverty |
| No Children | 53 (93.0%) | 4 (7.0%) |
| 1 or 2 Children | 19 (100.0%) | 0 (0.0%) |
| 3 or 4 Children | 0 (0.0%) | 0 (0.0%) |
| 5 or more Children | 0 (0.0%) | 0 (0.0%) |
| Total | 72 (94.7%) | 4 (5.3%) |
Income Below Poverty Among Single-Parent Households in Bancroft
| Children | Single Father | Single Mother |
| No Children | 0 (0.0%) | 0 (0.0%) |
| 1 or 2 Children | 0 (0.0%) | 0 (0.0%) |
| 3 or 4 Children | 0 (0.0%) | 0 (0.0%) |
| 5 or more Children | 0 (0.0%) | 0 (0.0%) |
| Total | 0 (0.0%) | 0 (0.0%) |
Income Below Poverty Among Married-Couple vs Single-Parent Households in Bancroft
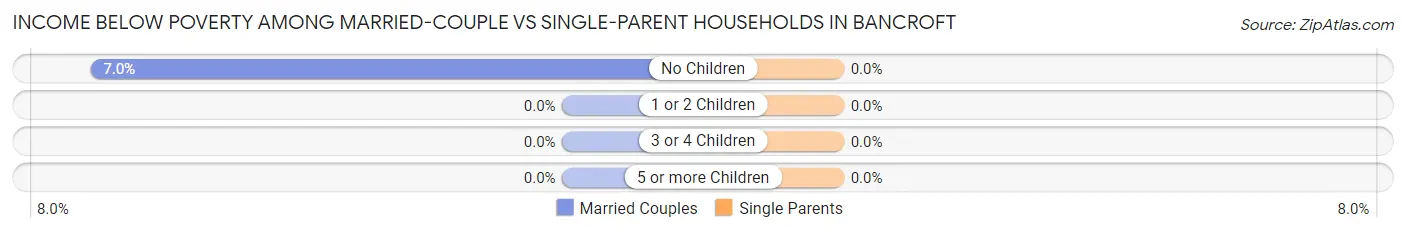
| Children | Married-Couple Families | Single-Parent Households |
| No Children | 4 (7.0%) | 0 (0.0%) |
| 1 or 2 Children | 0 (0.0%) | 0 (0.0%) |
| 3 or 4 Children | 0 (0.0%) | 0 (0.0%) |
| 5 or more Children | 0 (0.0%) | 0 (0.0%) |
| Total | 4 (5.3%) | 0 (0.0%) |
Race in Bancroft
The most populous races in Bancroft are White / Caucasian (334 | 96.3%), Hispanic or Latino (29 | 8.4%), and Two or more Races (13 | 3.7%).
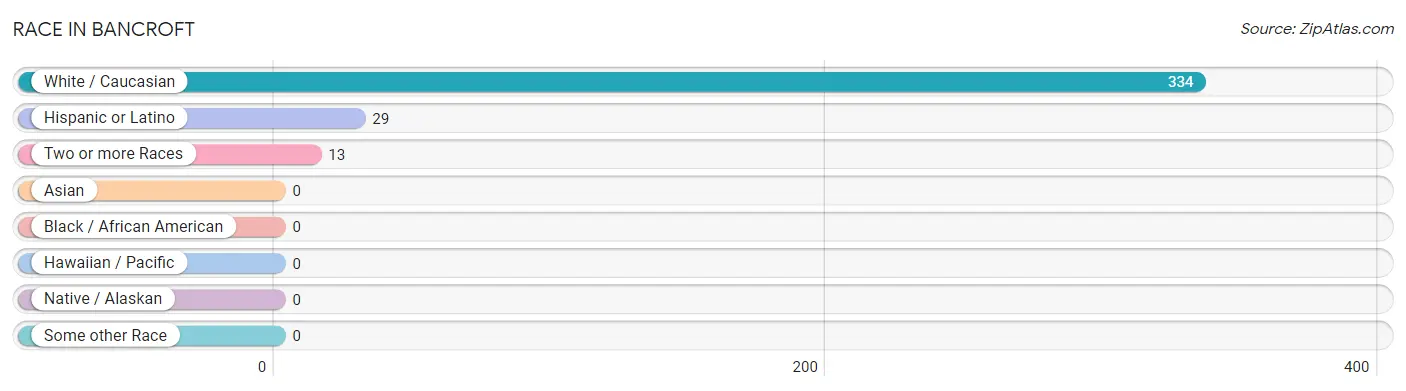
| Race | # Population | % Population |
| Asian | 0 | 0.0% |
| Black / African American | 0 | 0.0% |
| Hawaiian / Pacific | 0 | 0.0% |
| Hispanic or Latino | 29 | 8.4% |
| Native / Alaskan | 0 | 0.0% |
| White / Caucasian | 334 | 96.3% |
| Two or more Races | 13 | 3.7% |
| Some other Race | 0 | 0.0% |
| Total | 347 | 100.0% |
Ancestry in Bancroft
The most populous ancestries reported in Bancroft are English (133 | 38.3%), Irish (83 | 23.9%), German (73 | 21.0%), Mexican (29 | 8.4%), and Danish (25 | 7.2%), together accounting for 98.8% of all Bancroft residents.
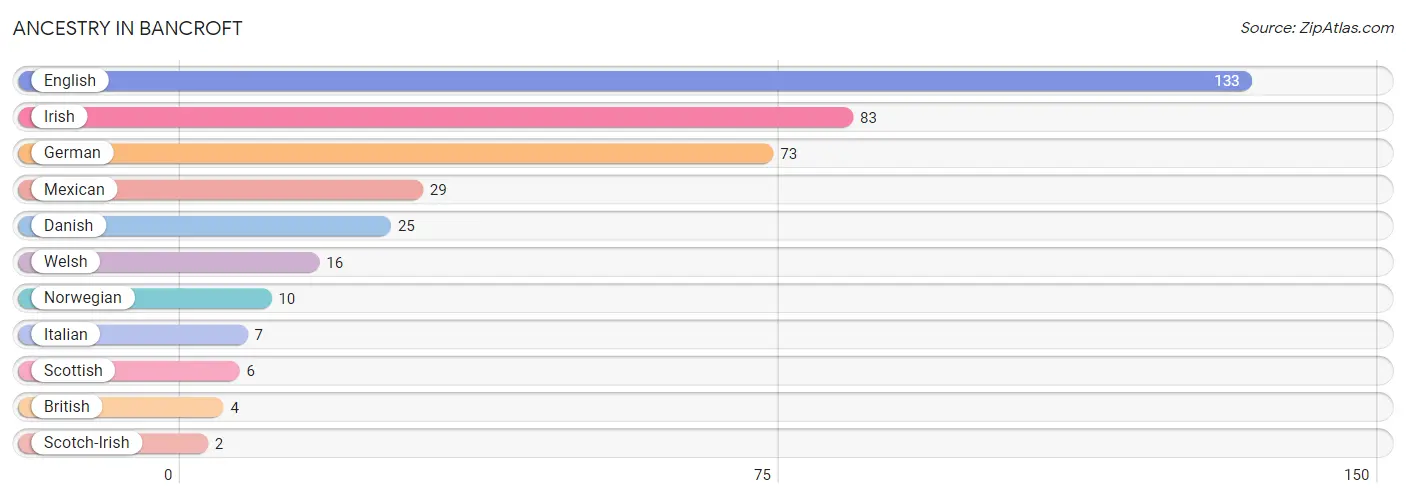
| Ancestry | # Population | % Population |
| British | 4 | 1.1% |
| Danish | 25 | 7.2% |
| English | 133 | 38.3% |
| German | 73 | 21.0% |
| Irish | 83 | 23.9% |
| Italian | 7 | 2.0% |
| Mexican | 29 | 8.4% |
| Norwegian | 10 | 2.9% |
| Scotch-Irish | 2 | 0.6% |
| Scottish | 6 | 1.7% |
| Welsh | 16 | 4.6% | View All 11 Rows |
Immigrants in Bancroft

| Immigration Origin | # Population | % Population | View All 0 Rows |
Sex and Age in Bancroft
Sex and Age in Bancroft
The most populous age groups in Bancroft are 20 to 24 Years (32 | 17.1%) for men and 20 to 24 Years (38 | 23.7%) for women.
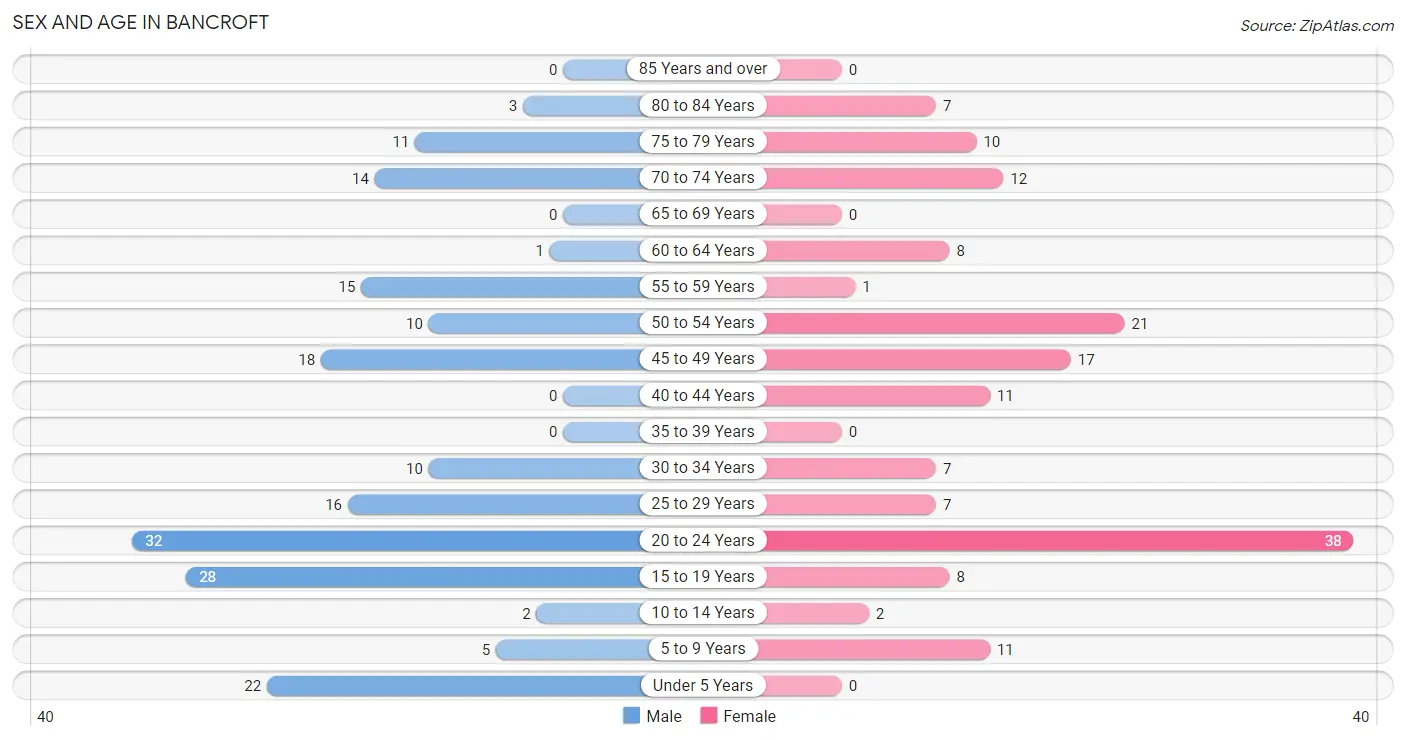
| Age Bracket | Male | Female |
| Under 5 Years | 22 (11.8%) | 0 (0.0%) |
| 5 to 9 Years | 5 (2.7%) | 11 (6.9%) |
| 10 to 14 Years | 2 (1.1%) | 2 (1.3%) |
| 15 to 19 Years | 28 (15.0%) | 8 (5.0%) |
| 20 to 24 Years | 32 (17.1%) | 38 (23.7%) |
| 25 to 29 Years | 16 (8.6%) | 7 (4.4%) |
| 30 to 34 Years | 10 (5.3%) | 7 (4.4%) |
| 35 to 39 Years | 0 (0.0%) | 0 (0.0%) |
| 40 to 44 Years | 0 (0.0%) | 11 (6.9%) |
| 45 to 49 Years | 18 (9.6%) | 17 (10.6%) |
| 50 to 54 Years | 10 (5.3%) | 21 (13.1%) |
| 55 to 59 Years | 15 (8.0%) | 1 (0.6%) |
| 60 to 64 Years | 1 (0.5%) | 8 (5.0%) |
| 65 to 69 Years | 0 (0.0%) | 0 (0.0%) |
| 70 to 74 Years | 14 (7.5%) | 12 (7.5%) |
| 75 to 79 Years | 11 (5.9%) | 10 (6.2%) |
| 80 to 84 Years | 3 (1.6%) | 7 (4.4%) |
| 85 Years and over | 0 (0.0%) | 0 (0.0%) |
| Total | 187 (100.0%) | 160 (100.0%) |
Families and Households in Bancroft
Median Family Size in Bancroft
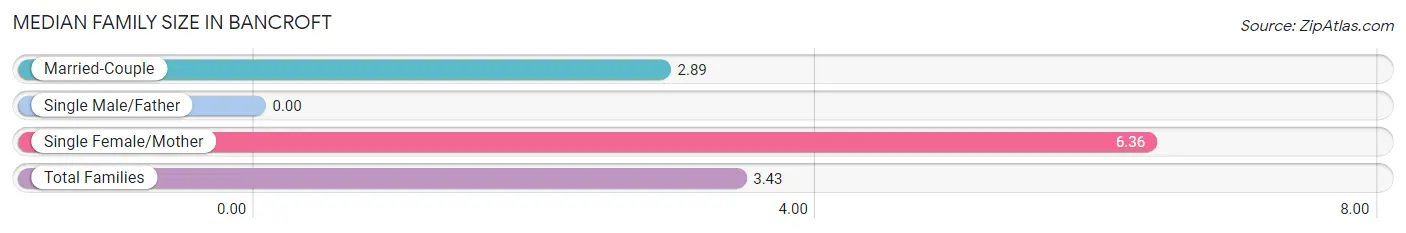
| Family Type | # Families | Family Size |
| Married-Couple | 76 (84.4%) | 2.89 |
| Single Male/Father | 0 (0.0%) | - |
| Single Female/Mother | 14 (15.6%) | 6.36 |
| Total Families | 90 (100.0%) | 3.43 |
Median Household Size in Bancroft
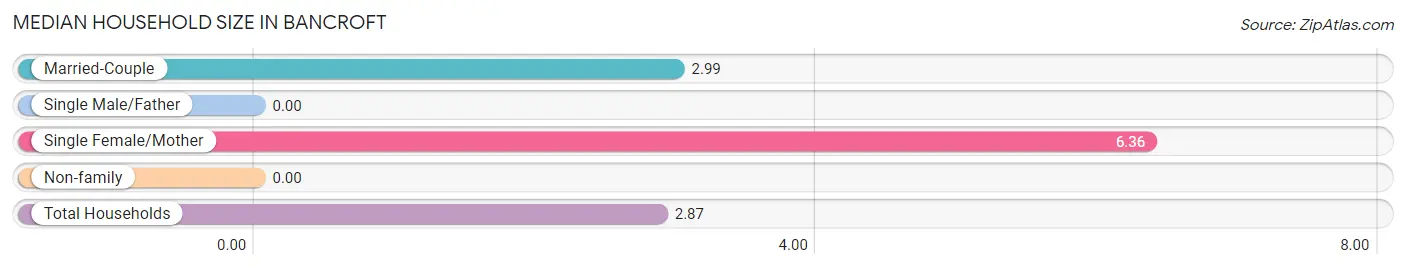
| Household Type | # Households | Household Size |
| Married-Couple | 76 (62.8%) | 2.99 |
| Single Male/Father | 0 (0.0%) | - |
| Single Female/Mother | 14 (11.6%) | 6.36 |
| Non-family | 31 (25.6%) | - |
| Total Households | 121 (100.0%) | 2.87 |
Household Size by Marriage Status in Bancroft
Out of a total of 121 households in Bancroft, 90 (74.4%) are family households, while 31 (25.6%) are nonfamily households. The most numerous type of family households are 2-person households, comprising 49, and the most common type of nonfamily households are 1-person households, comprising 31.
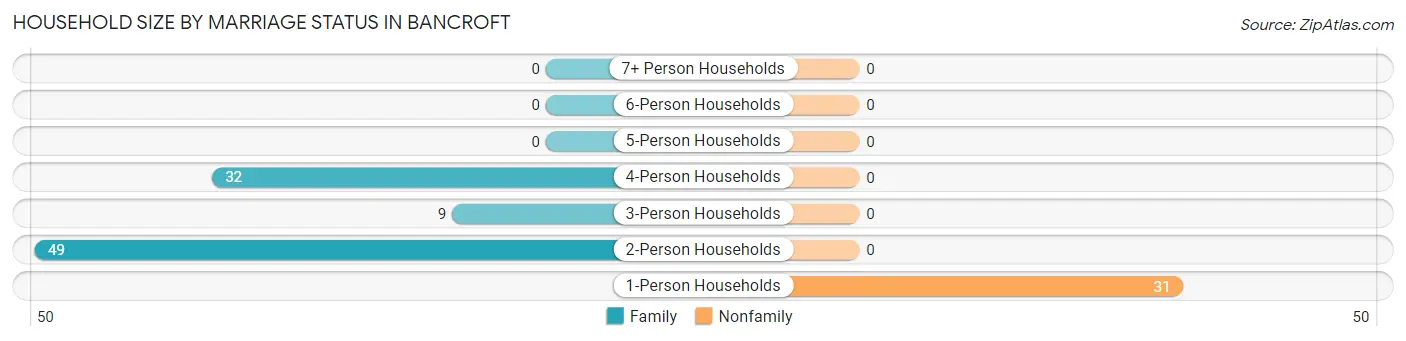
| Household Size | Family Households | Nonfamily Households |
| 1-Person Households | - | 31 (25.6%) |
| 2-Person Households | 49 (40.5%) | 0 (0.0%) |
| 3-Person Households | 9 (7.4%) | 0 (0.0%) |
| 4-Person Households | 32 (26.5%) | 0 (0.0%) |
| 5-Person Households | 0 (0.0%) | 0 (0.0%) |
| 6-Person Households | 0 (0.0%) | 0 (0.0%) |
| 7+ Person Households | 0 (0.0%) | 0 (0.0%) |
| Total | 90 (74.4%) | 31 (25.6%) |
Female Fertility in Bancroft
Fertility by Age in Bancroft
Average fertility rate in Bancroft is 69.0 births per 1,000 women. Women in the age bracket of 20 to 34 years have the highest fertility rate with 135.0 births per 1,000 women. Women in the age bracket of 20 to 34 years acount for 100.0% of all women with births.
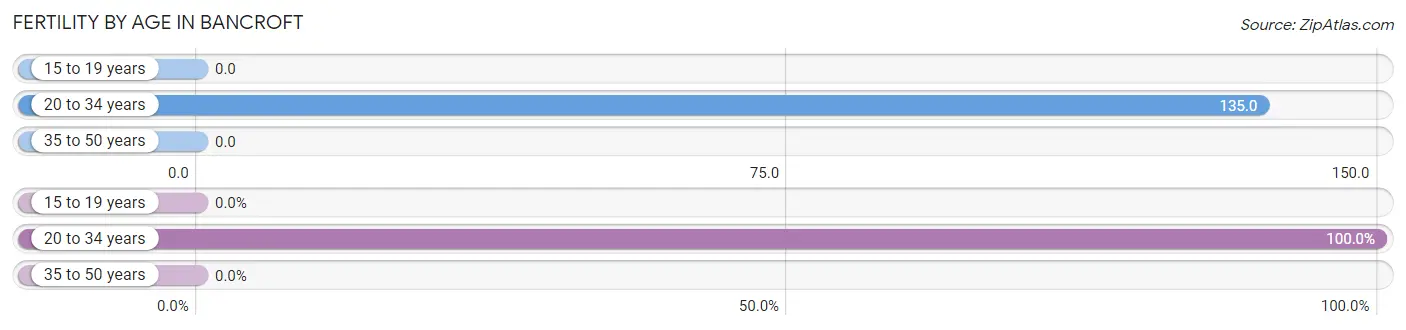
| Age Bracket | Women with Births | Births / 1,000 Women |
| 15 to 19 years | 0 (0.0%) | 0.0 |
| 20 to 34 years | 7 (100.0%) | 135.0 |
| 35 to 50 years | 0 (0.0%) | 0.0 |
| Total | 7 (100.0%) | 69.0 |
Fertility by Age by Marriage Status in Bancroft
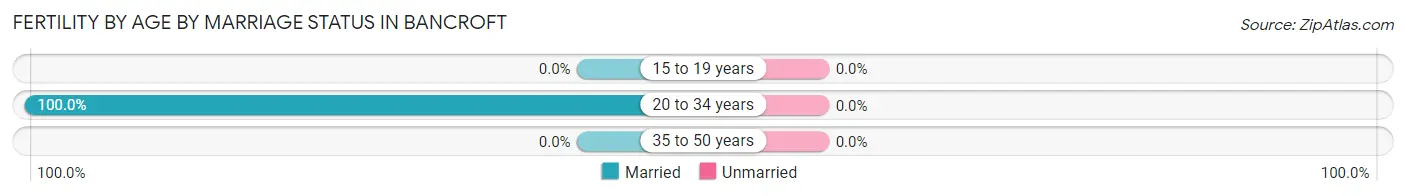
| Age Bracket | Married | Unmarried |
| 15 to 19 years | 0 (0.0%) | 0 (0.0%) |
| 20 to 34 years | 7 (100.0%) | 0 (0.0%) |
| 35 to 50 years | 0 (0.0%) | 0 (0.0%) |
| Total | 7 (100.0%) | 0 (0.0%) |
Fertility by Education in Bancroft
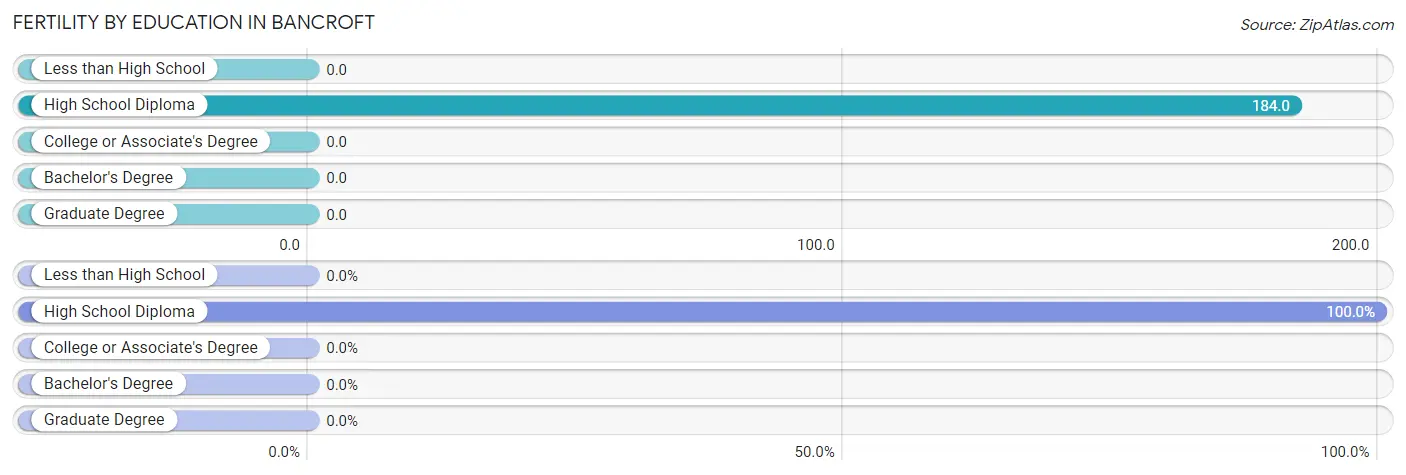
| Educational Attainment | Women with Births | Births / 1,000 Women |
| Less than High School | 0 (0.0%) | 0.0 |
| High School Diploma | 7 (100.0%) | 184.0 |
| College or Associate's Degree | 0 (0.0%) | 0.0 |
| Bachelor's Degree | 0 (0.0%) | 0.0 |
| Graduate Degree | 0 (0.0%) | 0.0 |
| Total | 7 (100.0%) | 69.0 |
Fertility by Education by Marriage Status in Bancroft
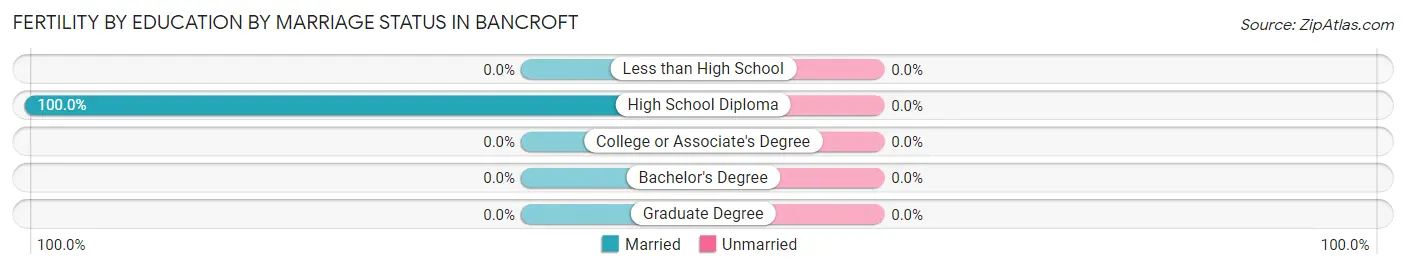
| Educational Attainment | Married | Unmarried |
| Less than High School | 0 (0.0%) | 0 (0.0%) |
| High School Diploma | 7 (100.0%) | 0 (0.0%) |
| College or Associate's Degree | 0 (0.0%) | 0 (0.0%) |
| Bachelor's Degree | 0 (0.0%) | 0 (0.0%) |
| Graduate Degree | 0 (0.0%) | 0 (0.0%) |
| Total | 7 (100.0%) | 0 (0.0%) |
Employment Characteristics in Bancroft
Employment by Class of Employer in Bancroft
Among the 172 employed individuals in Bancroft, private company employees (143 | 83.1%), local government employees (9 | 5.2%), and self-employed (not incorporated) (8 | 4.6%) make up the most common classes of employment.
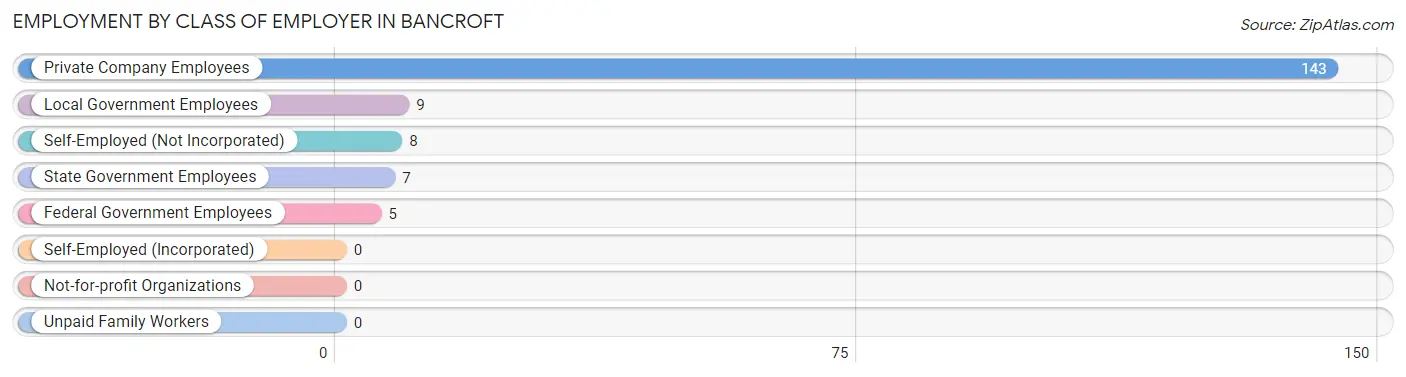
| Employer Class | # Employees | % Employees |
| Private Company Employees | 143 | 83.1% |
| Self-Employed (Incorporated) | 0 | 0.0% |
| Self-Employed (Not Incorporated) | 8 | 4.6% |
| Not-for-profit Organizations | 0 | 0.0% |
| Local Government Employees | 9 | 5.2% |
| State Government Employees | 7 | 4.1% |
| Federal Government Employees | 5 | 2.9% |
| Unpaid Family Workers | 0 | 0.0% |
| Total | 172 | 100.0% |
Employment Status by Age in Bancroft
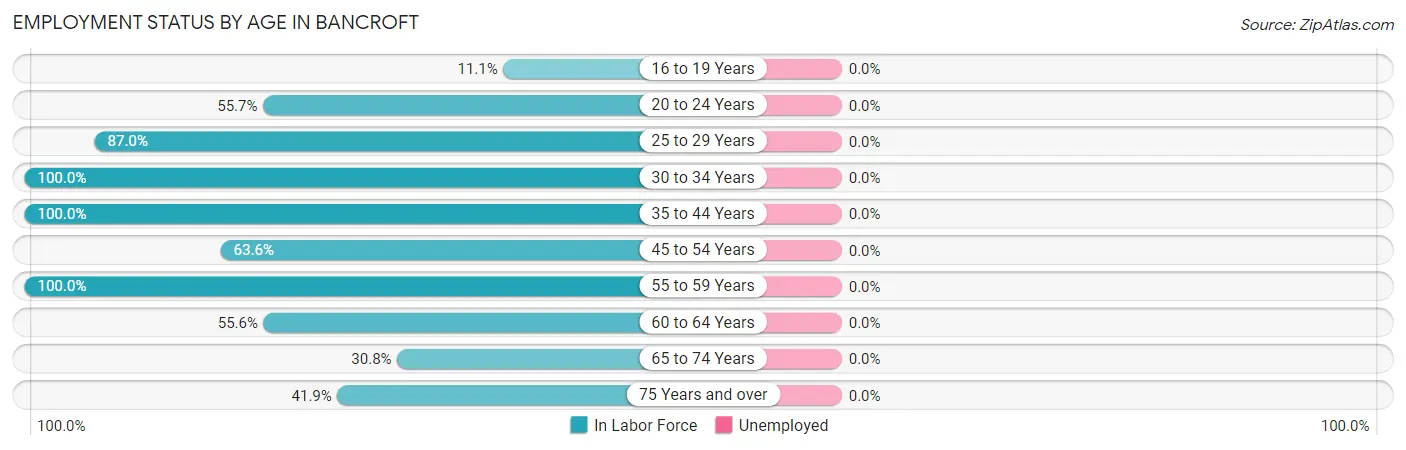
| Age Bracket | In Labor Force | Unemployed |
| 16 to 19 Years | 4 (11.1%) | 0 (0.0%) |
| 20 to 24 Years | 39 (55.7%) | 0 (0.0%) |
| 25 to 29 Years | 20 (87.0%) | 0 (0.0%) |
| 30 to 34 Years | 17 (100.0%) | 0 (0.0%) |
| 35 to 44 Years | 11 (100.0%) | 0 (0.0%) |
| 45 to 54 Years | 42 (63.6%) | 0 (0.0%) |
| 55 to 59 Years | 16 (100.0%) | 0 (0.0%) |
| 60 to 64 Years | 5 (55.6%) | 0 (0.0%) |
| 65 to 74 Years | 8 (30.8%) | 0 (0.0%) |
| 75 Years and over | 13 (41.9%) | 0 (0.0%) |
| Total | 175 (57.4%) | 0 (0.0%) |
Employment Status by Educational Attainment in Bancroft
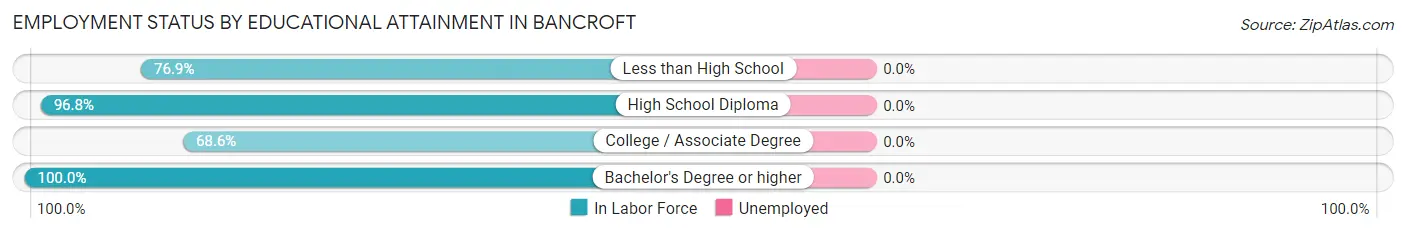
| Educational Attainment | In Labor Force | Unemployed |
| Less than High School | 10 (76.9%) | 0 (0.0%) |
| High School Diploma | 30 (96.8%) | 0 (0.0%) |
| College / Associate Degree | 59 (68.6%) | 0 (0.0%) |
| Bachelor's Degree or higher | 12 (100.0%) | 0 (0.0%) |
| Total | 111 (78.2%) | 0 (0.0%) |
Employment Occupations by Sex in Bancroft
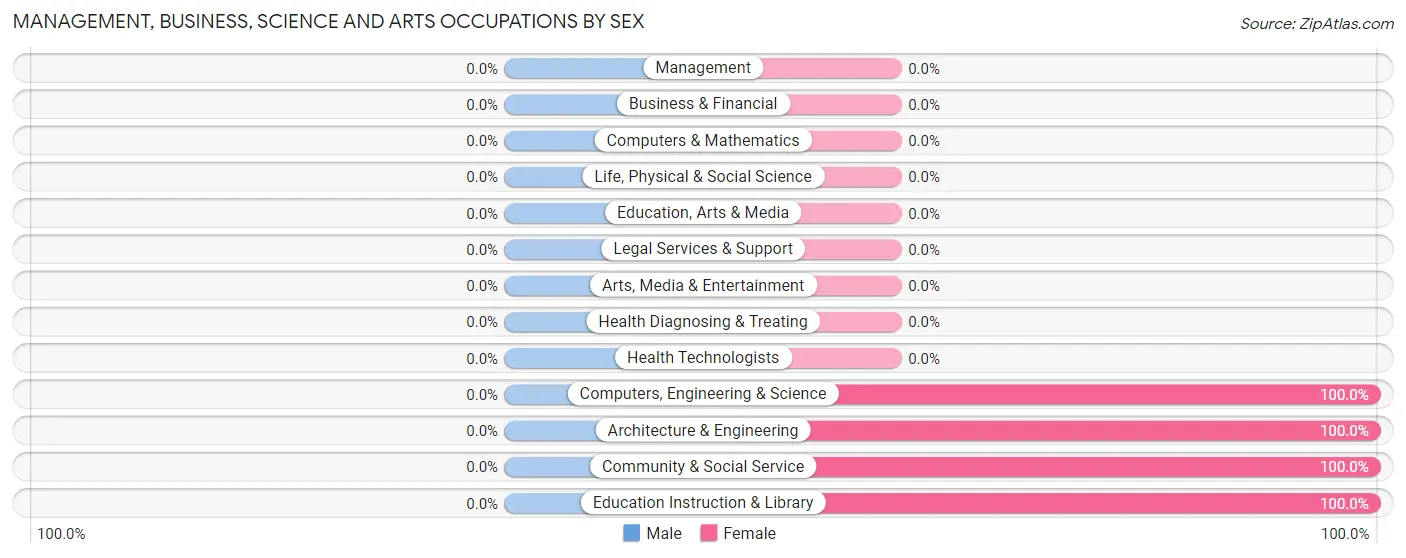
Management, Business, Science and Arts Occupations
The most common Management, Business, Science and Arts occupations in Bancroft are Community & Social Service (7 | 4.0%), Education Instruction & Library (7 | 4.0%), Computers, Engineering & Science (5 | 2.9%), and Architecture & Engineering (5 | 2.9%).
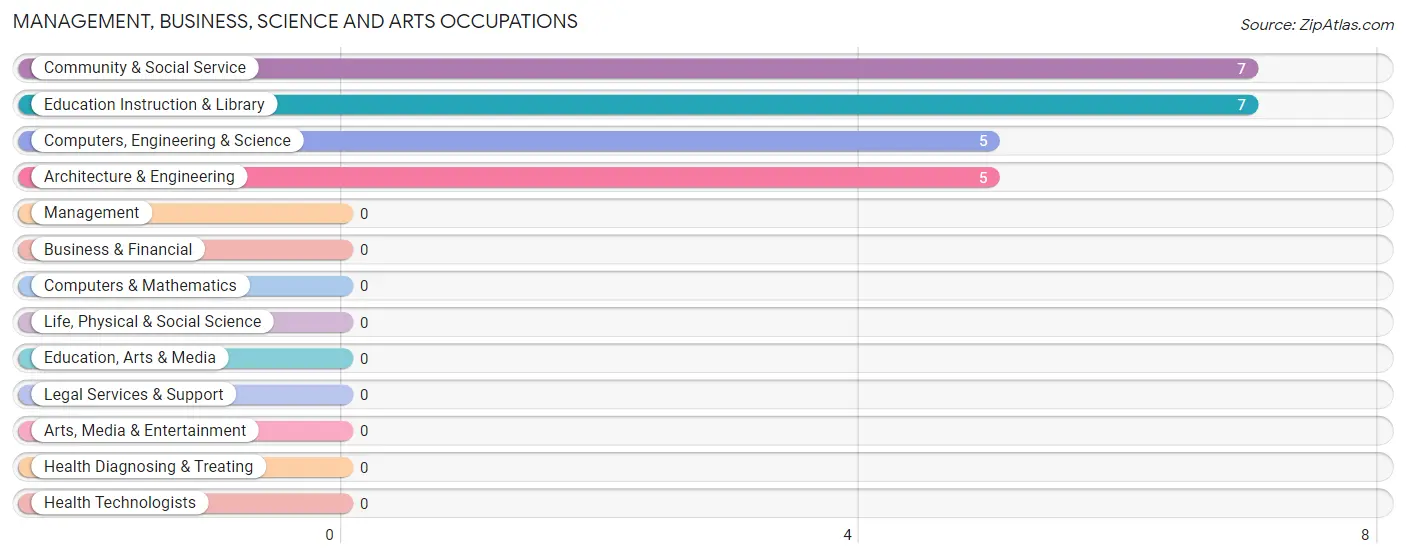
Management, Business, Science and Arts Occupations by Sex
| Occupation | Male | Female |
| Management | 0 (0.0%) | 0 (0.0%) |
| Business & Financial | 0 (0.0%) | 0 (0.0%) |
| Computers, Engineering & Science | 0 (0.0%) | 5 (100.0%) |
| Computers & Mathematics | 0 (0.0%) | 0 (0.0%) |
| Architecture & Engineering | 0 (0.0%) | 5 (100.0%) |
| Life, Physical & Social Science | 0 (0.0%) | 0 (0.0%) |
| Community & Social Service | 0 (0.0%) | 7 (100.0%) |
| Education, Arts & Media | 0 (0.0%) | 0 (0.0%) |
| Legal Services & Support | 0 (0.0%) | 0 (0.0%) |
| Education Instruction & Library | 0 (0.0%) | 7 (100.0%) |
| Arts, Media & Entertainment | 0 (0.0%) | 0 (0.0%) |
| Health Diagnosing & Treating | 0 (0.0%) | 0 (0.0%) |
| Health Technologists | 0 (0.0%) | 0 (0.0%) |
| Total (Category) | 0 (0.0%) | 12 (100.0%) |
| Total (Overall) | 115 (65.7%) | 60 (34.3%) |
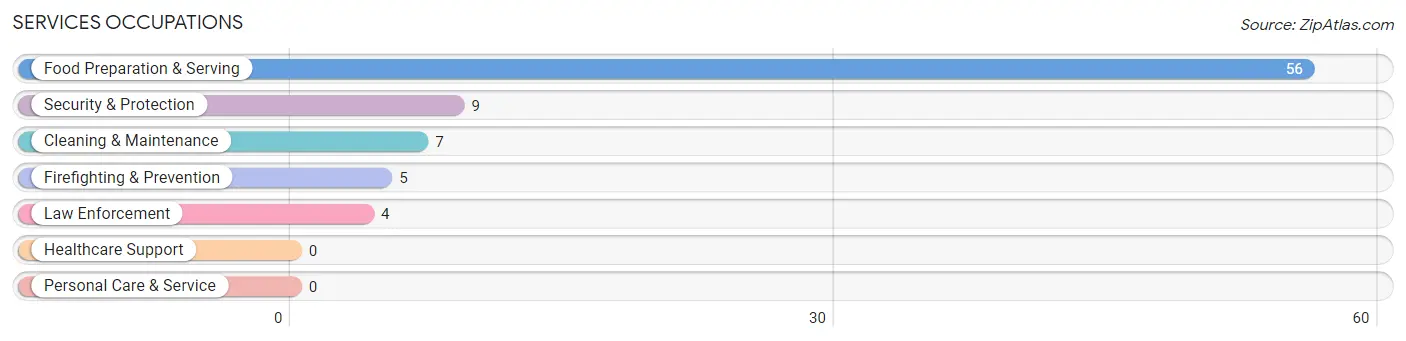
Services Occupations
The most common Services occupations in Bancroft are Food Preparation & Serving (56 | 32.0%), Security & Protection (9 | 5.1%), Cleaning & Maintenance (7 | 4.0%), Firefighting & Prevention (5 | 2.9%), and Law Enforcement (4 | 2.3%).
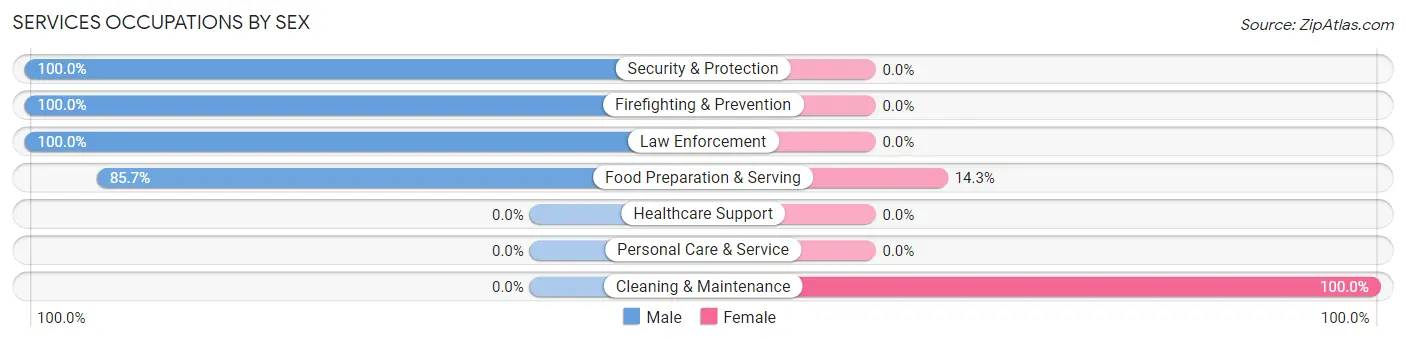
Services Occupations by Sex
Within the Services occupations in Bancroft, the most male-oriented occupations are Security & Protection (100.0%), Firefighting & Prevention (100.0%), and Law Enforcement (100.0%), while the most female-oriented occupations are Cleaning & Maintenance (100.0%), and Food Preparation & Serving (14.3%).
| Occupation | Male | Female |
| Healthcare Support | 0 (0.0%) | 0 (0.0%) |
| Security & Protection | 9 (100.0%) | 0 (0.0%) |
| Firefighting & Prevention | 5 (100.0%) | 0 (0.0%) |
| Law Enforcement | 4 (100.0%) | 0 (0.0%) |
| Food Preparation & Serving | 48 (85.7%) | 8 (14.3%) |
| Cleaning & Maintenance | 0 (0.0%) | 7 (100.0%) |
| Personal Care & Service | 0 (0.0%) | 0 (0.0%) |
| Total (Category) | 57 (79.2%) | 15 (20.8%) |
| Total (Overall) | 115 (65.7%) | 60 (34.3%) |
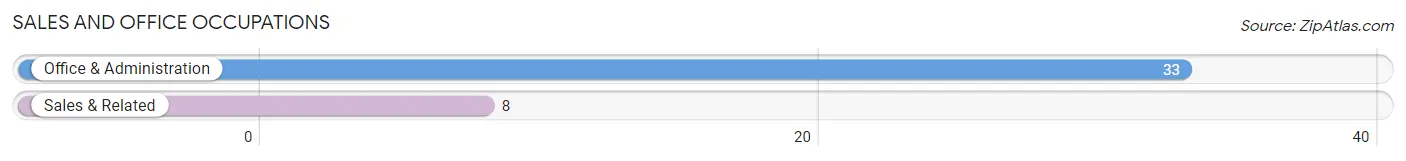
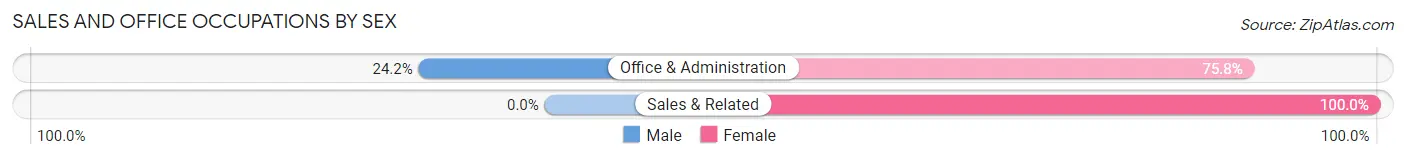
Sales and Office Occupations
The most common Sales and Office occupations in Bancroft are Office & Administration (33 | 18.9%), and Sales & Related (8 | 4.6%).
Sales and Office Occupations by Sex
| Occupation | Male | Female |
| Sales & Related | 0 (0.0%) | 8 (100.0%) |
| Office & Administration | 8 (24.2%) | 25 (75.8%) |
| Total (Category) | 8 (19.5%) | 33 (80.5%) |
| Total (Overall) | 115 (65.7%) | 60 (34.3%) |
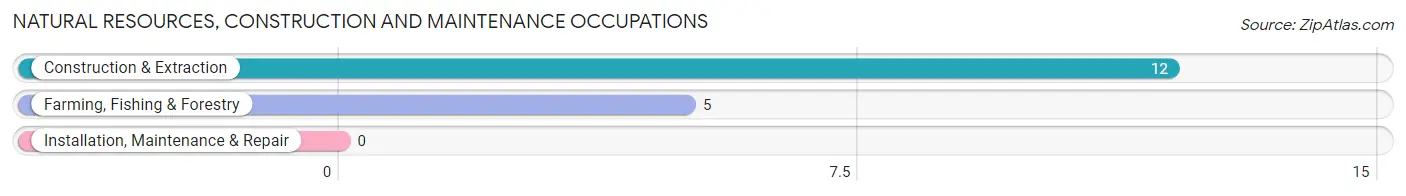
Natural Resources, Construction and Maintenance Occupations
The most common Natural Resources, Construction and Maintenance occupations in Bancroft are Construction & Extraction (12 | 6.9%), and Farming, Fishing & Forestry (5 | 2.9%).
Natural Resources, Construction and Maintenance Occupations by Sex
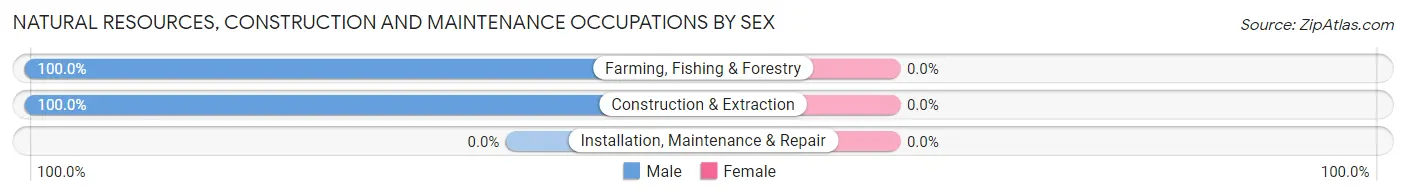
| Occupation | Male | Female |
| Farming, Fishing & Forestry | 5 (100.0%) | 0 (0.0%) |
| Construction & Extraction | 12 (100.0%) | 0 (0.0%) |
| Installation, Maintenance & Repair | 0 (0.0%) | 0 (0.0%) |
| Total (Category) | 17 (100.0%) | 0 (0.0%) |
| Total (Overall) | 115 (65.7%) | 60 (34.3%) |
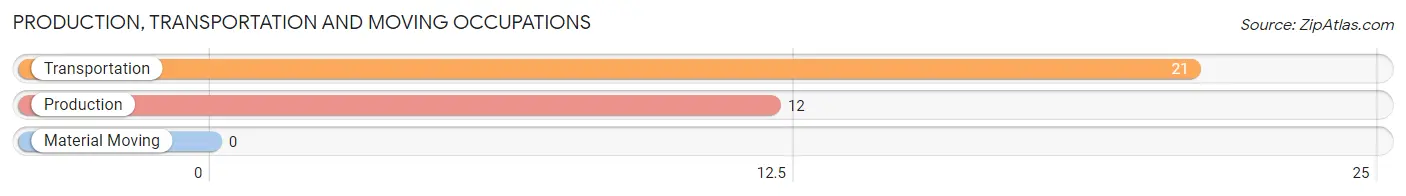
Production, Transportation and Moving Occupations
The most common Production, Transportation and Moving occupations in Bancroft are Transportation (21 | 12.0%), and Production (12 | 6.9%).
Production, Transportation and Moving Occupations by Sex
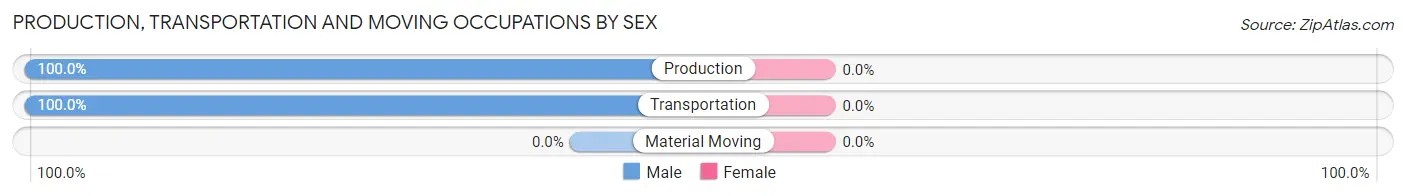
| Occupation | Male | Female |
| Production | 12 (100.0%) | 0 (0.0%) |
| Transportation | 21 (100.0%) | 0 (0.0%) |
| Material Moving | 0 (0.0%) | 0 (0.0%) |
| Total (Category) | 33 (100.0%) | 0 (0.0%) |
| Total (Overall) | 115 (65.7%) | 60 (34.3%) |
Employment Industries by Sex in Bancroft
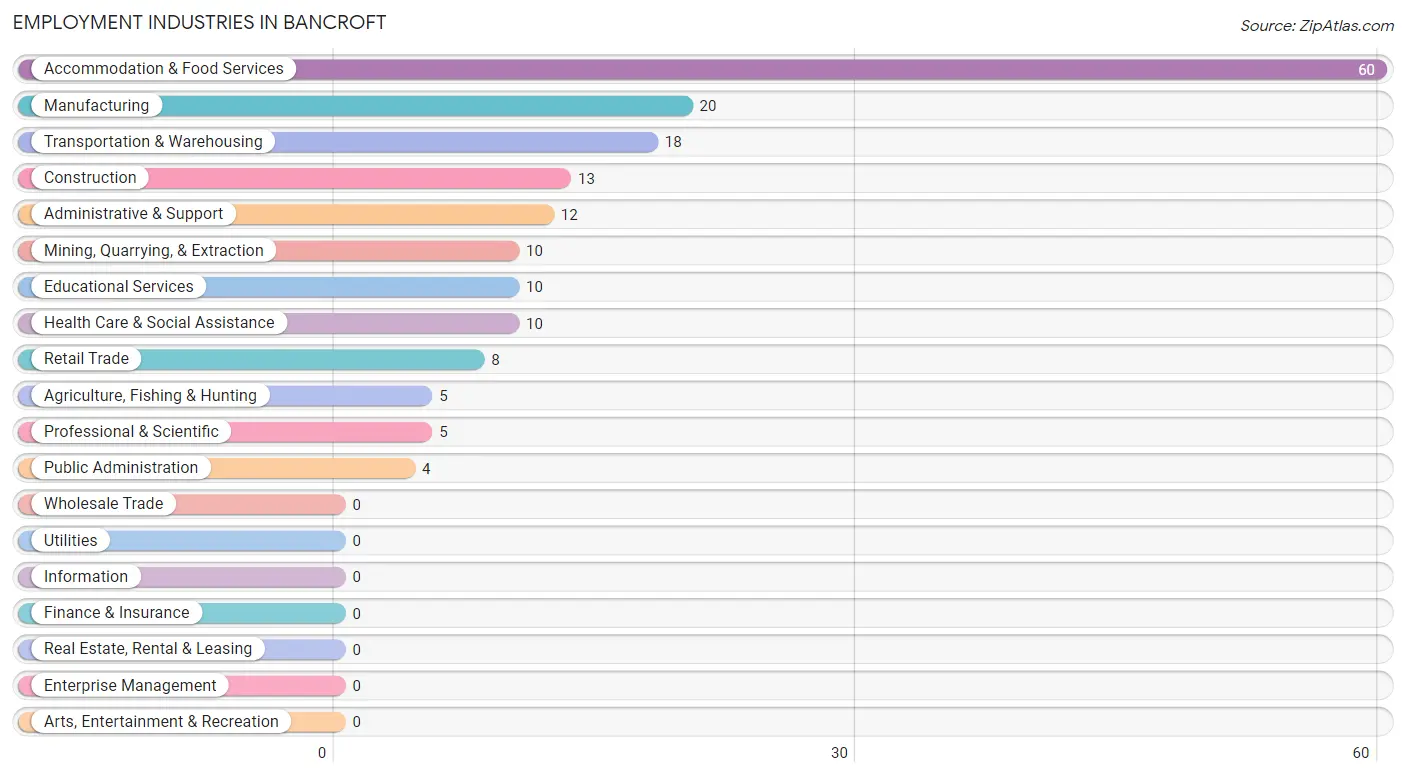
Employment Industries in Bancroft
The major employment industries in Bancroft include Accommodation & Food Services (60 | 34.3%), Manufacturing (20 | 11.4%), Transportation & Warehousing (18 | 10.3%), Construction (13 | 7.4%), and Administrative & Support (12 | 6.9%).
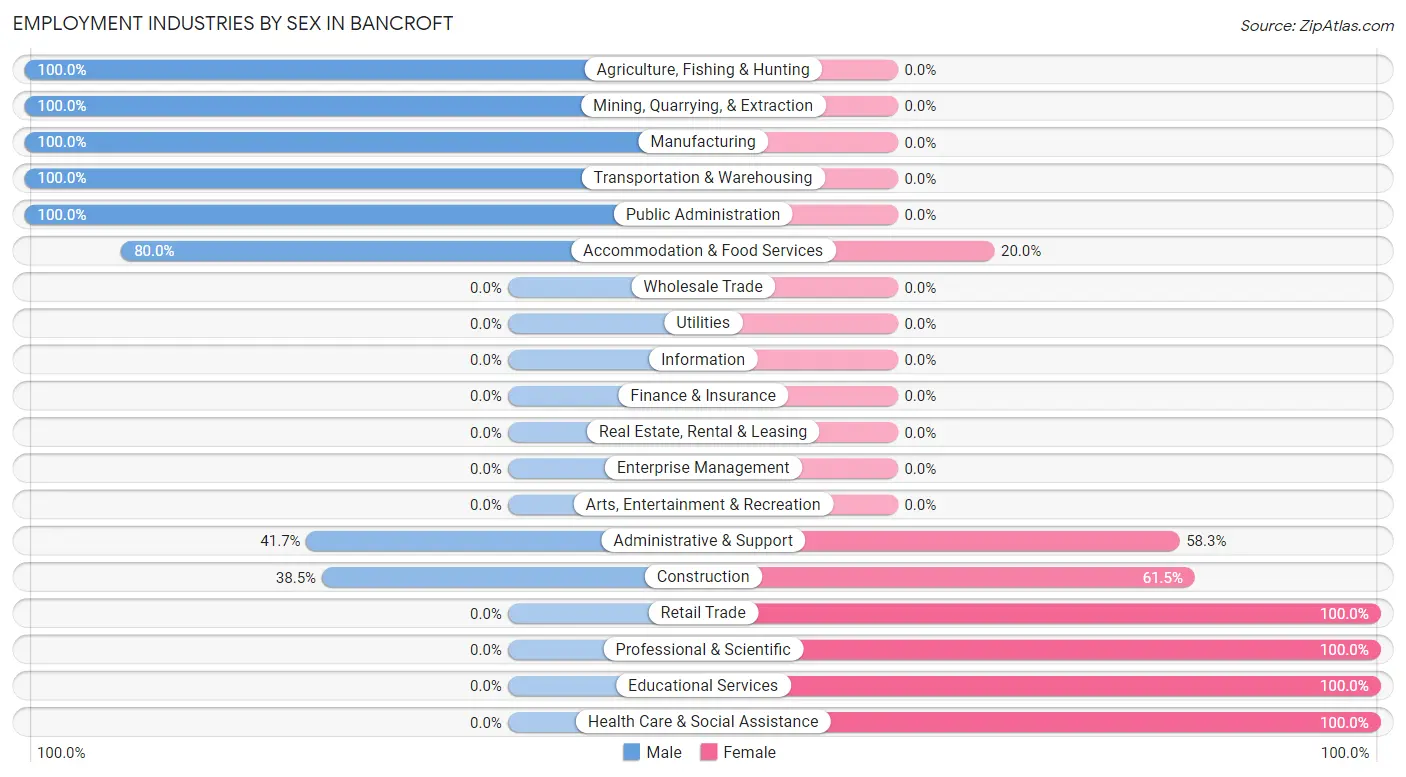
Employment Industries by Sex in Bancroft
The Bancroft industries that see more men than women are Agriculture, Fishing & Hunting (100.0%), Mining, Quarrying, & Extraction (100.0%), and Manufacturing (100.0%), whereas the industries that tend to have a higher number of women are Retail Trade (100.0%), Professional & Scientific (100.0%), and Educational Services (100.0%).
| Industry | Male | Female |
| Agriculture, Fishing & Hunting | 5 (100.0%) | 0 (0.0%) |
| Mining, Quarrying, & Extraction | 10 (100.0%) | 0 (0.0%) |
| Construction | 5 (38.5%) | 8 (61.5%) |
| Manufacturing | 20 (100.0%) | 0 (0.0%) |
| Wholesale Trade | 0 (0.0%) | 0 (0.0%) |
| Retail Trade | 0 (0.0%) | 8 (100.0%) |
| Transportation & Warehousing | 18 (100.0%) | 0 (0.0%) |
| Utilities | 0 (0.0%) | 0 (0.0%) |
| Information | 0 (0.0%) | 0 (0.0%) |
| Finance & Insurance | 0 (0.0%) | 0 (0.0%) |
| Real Estate, Rental & Leasing | 0 (0.0%) | 0 (0.0%) |
| Professional & Scientific | 0 (0.0%) | 5 (100.0%) |
| Enterprise Management | 0 (0.0%) | 0 (0.0%) |
| Administrative & Support | 5 (41.7%) | 7 (58.3%) |
| Educational Services | 0 (0.0%) | 10 (100.0%) |
| Health Care & Social Assistance | 0 (0.0%) | 10 (100.0%) |
| Arts, Entertainment & Recreation | 0 (0.0%) | 0 (0.0%) |
| Accommodation & Food Services | 48 (80.0%) | 12 (20.0%) |
| Public Administration | 4 (100.0%) | 0 (0.0%) |
| Total | 115 (65.7%) | 60 (34.3%) |
Education in Bancroft
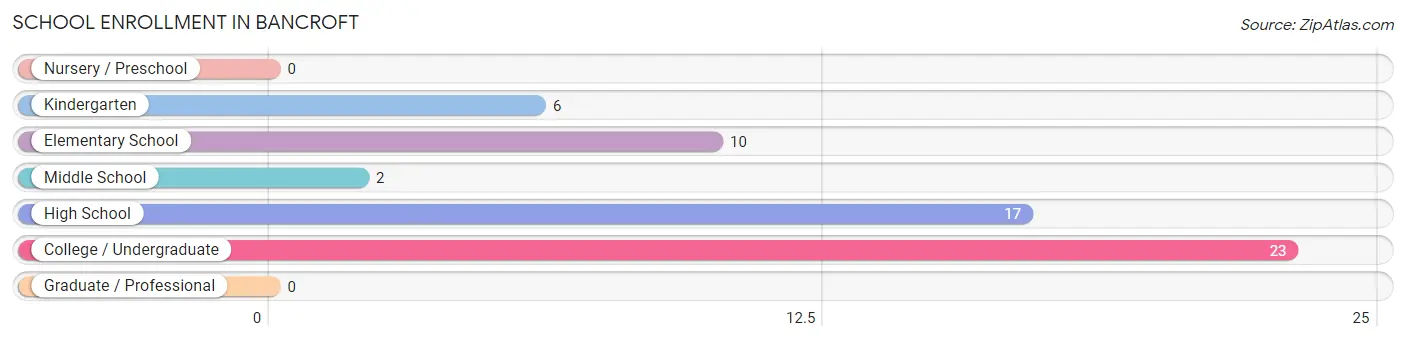
School Enrollment in Bancroft
The most common levels of schooling among the 58 students in Bancroft are college / undergraduate (23 | 39.7%), high school (17 | 29.3%), and elementary school (10 | 17.2%).
| School Level | # Students | % Students |
| Nursery / Preschool | 0 | 0.0% |
| Kindergarten | 6 | 10.3% |
| Elementary School | 10 | 17.2% |
| Middle School | 2 | 3.5% |
| High School | 17 | 29.3% |
| College / Undergraduate | 23 | 39.7% |
| Graduate / Professional | 0 | 0.0% |
| Total | 58 | 100.0% |
School Enrollment by Age by Funding Source in Bancroft
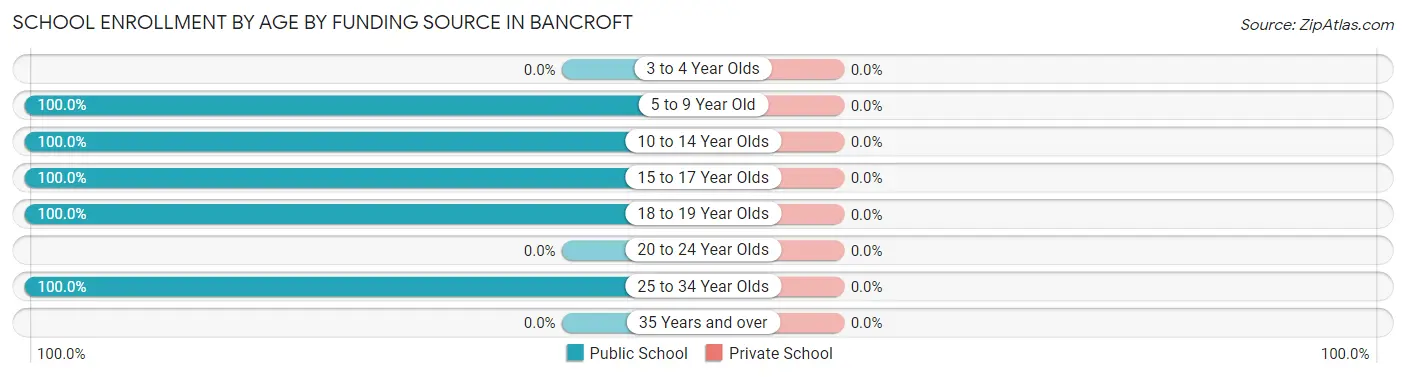
| Age Bracket | Public School | Private School |
| 3 to 4 Year Olds | 0 (0.0%) | 0 (0.0%) |
| 5 to 9 Year Old | 16 (100.0%) | 0 (0.0%) |
| 10 to 14 Year Olds | 4 (100.0%) | 0 (0.0%) |
| 15 to 17 Year Olds | 8 (100.0%) | 0 (0.0%) |
| 18 to 19 Year Olds | 28 (100.0%) | 0 (0.0%) |
| 20 to 24 Year Olds | 0 (0.0%) | 0 (0.0%) |
| 25 to 34 Year Olds | 2 (100.0%) | 0 (0.0%) |
| 35 Years and over | 0 (0.0%) | 0 (0.0%) |
| Total | 58 (100.0%) | 0 (0.0%) |
Educational Attainment by Field of Study in Bancroft
Education (11 | 68.8%), and liberal arts & history (5 | 31.2%) are the most common fields of study among 16 individuals in Bancroft who have obtained a bachelor's degree or higher.
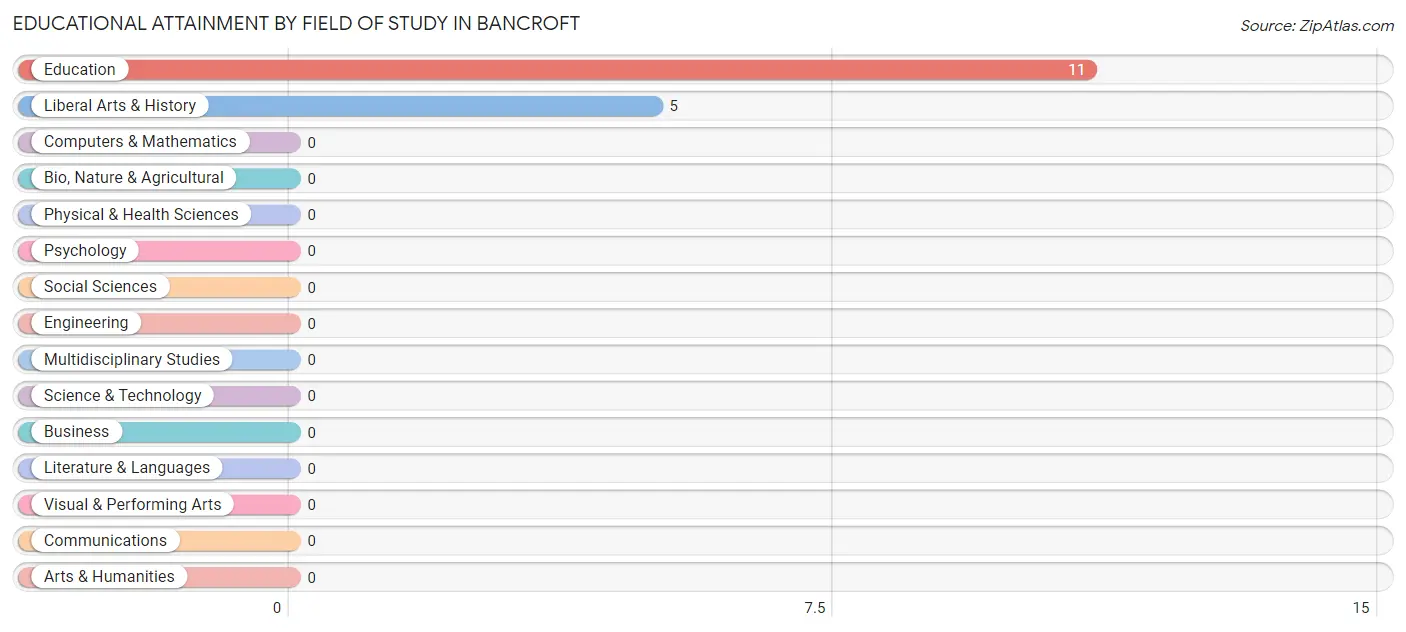
| Field of Study | # Graduates | % Graduates |
| Computers & Mathematics | 0 | 0.0% |
| Bio, Nature & Agricultural | 0 | 0.0% |
| Physical & Health Sciences | 0 | 0.0% |
| Psychology | 0 | 0.0% |
| Social Sciences | 0 | 0.0% |
| Engineering | 0 | 0.0% |
| Multidisciplinary Studies | 0 | 0.0% |
| Science & Technology | 0 | 0.0% |
| Business | 0 | 0.0% |
| Education | 11 | 68.8% |
| Literature & Languages | 0 | 0.0% |
| Liberal Arts & History | 5 | 31.2% |
| Visual & Performing Arts | 0 | 0.0% |
| Communications | 0 | 0.0% |
| Arts & Humanities | 0 | 0.0% |
| Total | 16 | 100.0% |
Transportation & Commute in Bancroft
Vehicle Availability by Sex in Bancroft
The most prevalent vehicle ownership categories in Bancroft are males with 3 vehicles (57, accounting for 49.6%) and females with 3 vehicles (16, making up 100.0%).
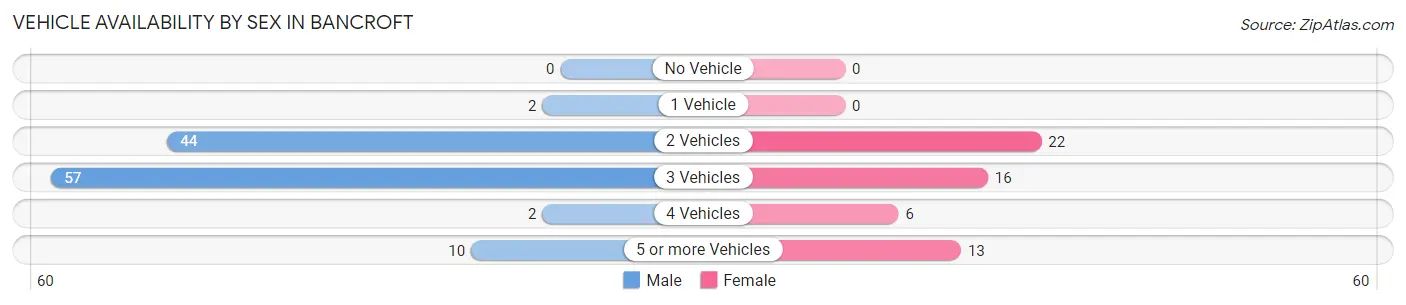
| Vehicles Available | Male | Female |
| No Vehicle | 0 (0.0%) | 0 (0.0%) |
| 1 Vehicle | 2 (1.7%) | 0 (0.0%) |
| 2 Vehicles | 44 (38.3%) | 22 (38.6%) |
| 3 Vehicles | 57 (49.6%) | 16 (28.1%) |
| 4 Vehicles | 2 (1.7%) | 6 (10.5%) |
| 5 or more Vehicles | 10 (8.7%) | 13 (22.8%) |
| Total | 115 (100.0%) | 57 (100.0%) |
Commute Time in Bancroft
The most frequently occuring commute durations in Bancroft are 25 to 29 minutes (68 commuters, 39.5%), 20 to 24 minutes (28 commuters, 16.3%), and less than 5 minutes (18 commuters, 10.5%).
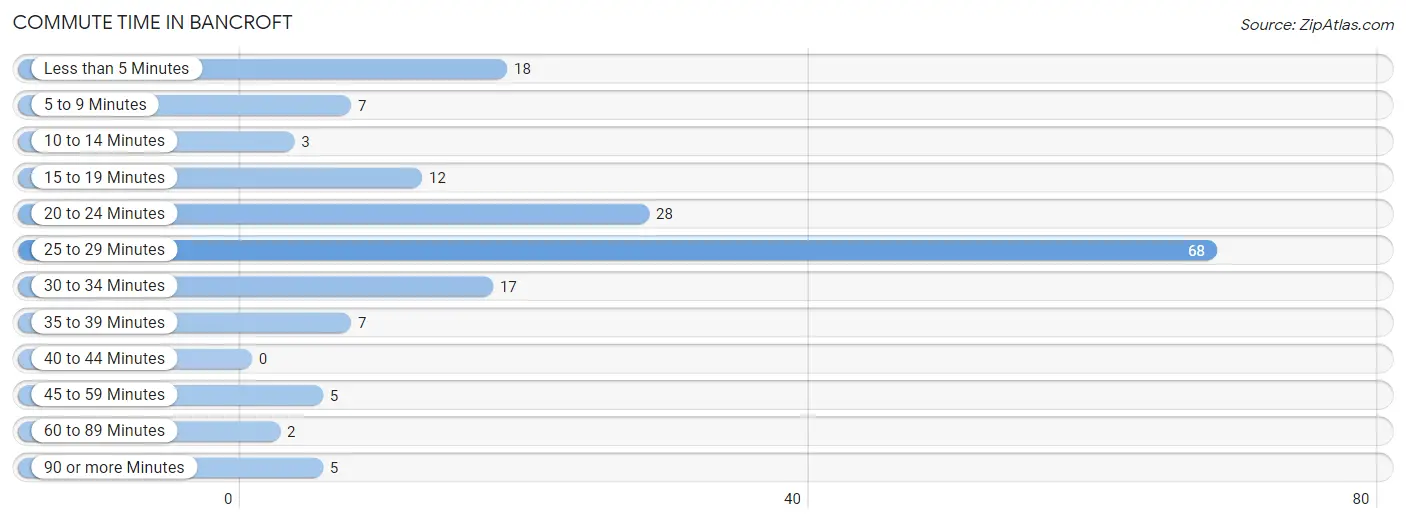
| Commute Time | # Commuters | % Commuters |
| Less than 5 Minutes | 18 | 10.5% |
| 5 to 9 Minutes | 7 | 4.1% |
| 10 to 14 Minutes | 3 | 1.7% |
| 15 to 19 Minutes | 12 | 7.0% |
| 20 to 24 Minutes | 28 | 16.3% |
| 25 to 29 Minutes | 68 | 39.5% |
| 30 to 34 Minutes | 17 | 9.9% |
| 35 to 39 Minutes | 7 | 4.1% |
| 40 to 44 Minutes | 0 | 0.0% |
| 45 to 59 Minutes | 5 | 2.9% |
| 60 to 89 Minutes | 2 | 1.2% |
| 90 or more Minutes | 5 | 2.9% |
Commute Time by Sex in Bancroft
The most common commute times in Bancroft are 25 to 29 minutes (52 commuters, 45.2%) for males and 25 to 29 minutes (16 commuters, 28.1%) for females.
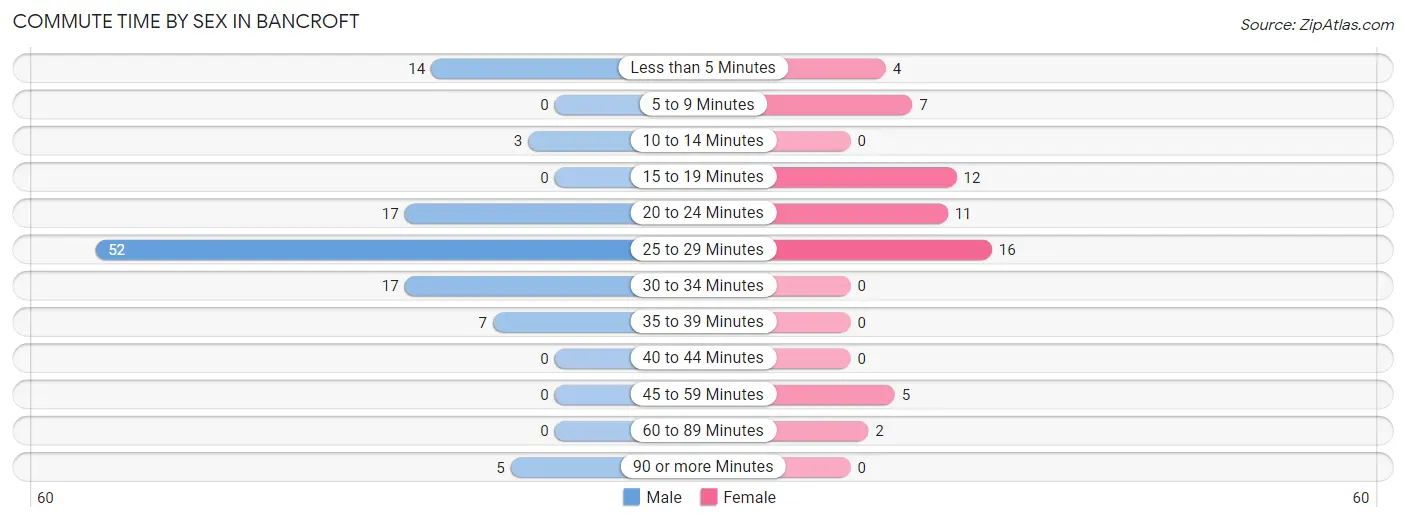
| Commute Time | Male | Female |
| Less than 5 Minutes | 14 (12.2%) | 4 (7.0%) |
| 5 to 9 Minutes | 0 (0.0%) | 7 (12.3%) |
| 10 to 14 Minutes | 3 (2.6%) | 0 (0.0%) |
| 15 to 19 Minutes | 0 (0.0%) | 12 (21.0%) |
| 20 to 24 Minutes | 17 (14.8%) | 11 (19.3%) |
| 25 to 29 Minutes | 52 (45.2%) | 16 (28.1%) |
| 30 to 34 Minutes | 17 (14.8%) | 0 (0.0%) |
| 35 to 39 Minutes | 7 (6.1%) | 0 (0.0%) |
| 40 to 44 Minutes | 0 (0.0%) | 0 (0.0%) |
| 45 to 59 Minutes | 0 (0.0%) | 5 (8.8%) |
| 60 to 89 Minutes | 0 (0.0%) | 2 (3.5%) |
| 90 or more Minutes | 5 (4.3%) | 0 (0.0%) |
Time of Departure to Work by Sex in Bancroft
The most frequent times of departure to work in Bancroft are 12:00 PM to 3:59 PM (51, 44.4%) for males and 7:00 AM to 7:29 AM (14, 24.6%) for females.
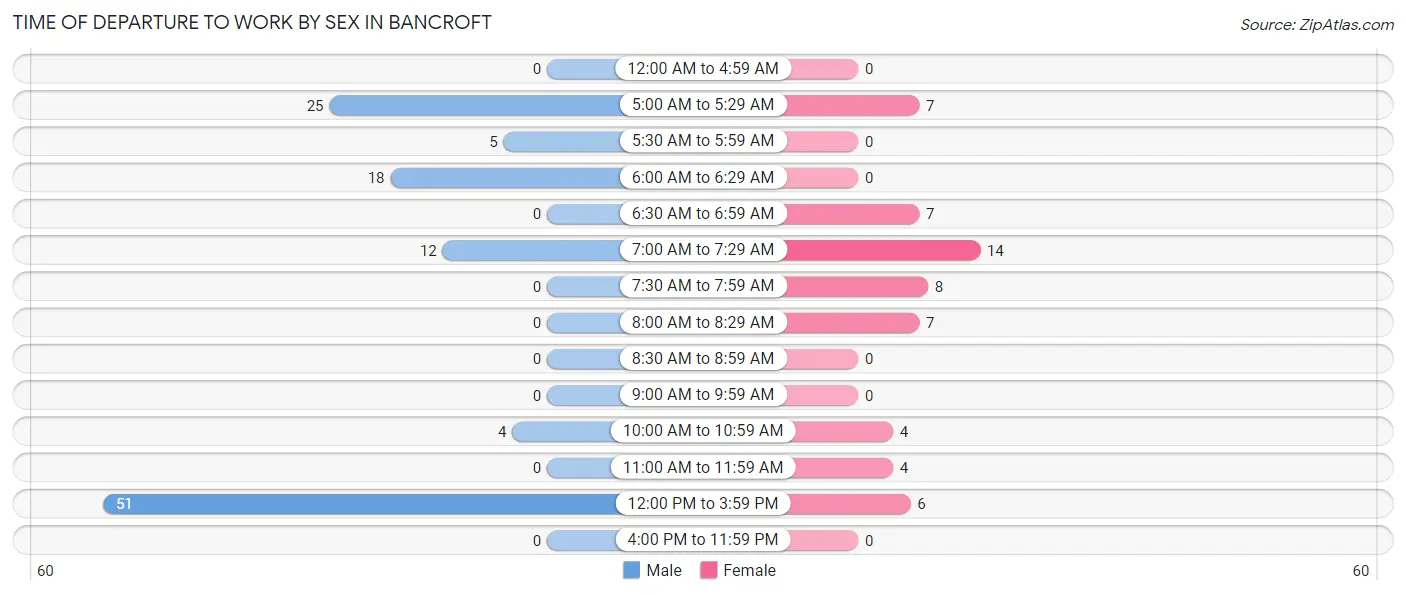
| Time of Departure | Male | Female |
| 12:00 AM to 4:59 AM | 0 (0.0%) | 0 (0.0%) |
| 5:00 AM to 5:29 AM | 25 (21.7%) | 7 (12.3%) |
| 5:30 AM to 5:59 AM | 5 (4.3%) | 0 (0.0%) |
| 6:00 AM to 6:29 AM | 18 (15.7%) | 0 (0.0%) |
| 6:30 AM to 6:59 AM | 0 (0.0%) | 7 (12.3%) |
| 7:00 AM to 7:29 AM | 12 (10.4%) | 14 (24.6%) |
| 7:30 AM to 7:59 AM | 0 (0.0%) | 8 (14.0%) |
| 8:00 AM to 8:29 AM | 0 (0.0%) | 7 (12.3%) |
| 8:30 AM to 8:59 AM | 0 (0.0%) | 0 (0.0%) |
| 9:00 AM to 9:59 AM | 0 (0.0%) | 0 (0.0%) |
| 10:00 AM to 10:59 AM | 4 (3.5%) | 4 (7.0%) |
| 11:00 AM to 11:59 AM | 0 (0.0%) | 4 (7.0%) |
| 12:00 PM to 3:59 PM | 51 (44.4%) | 6 (10.5%) |
| 4:00 PM to 11:59 PM | 0 (0.0%) | 0 (0.0%) |
| Total | 115 (100.0%) | 57 (100.0%) |
Housing Occupancy in Bancroft
Occupancy by Ownership in Bancroft
Of the total 121 dwellings in Bancroft, owner-occupied units account for 105 (86.8%), while renter-occupied units make up 16 (13.2%).
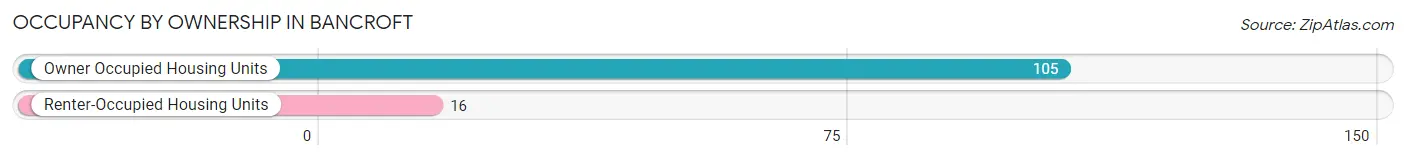
| Occupancy | # Housing Units | % Housing Units |
| Owner Occupied Housing Units | 105 | 86.8% |
| Renter-Occupied Housing Units | 16 | 13.2% |
| Total Occupied Housing Units | 121 | 100.0% |
Occupancy by Household Size in Bancroft
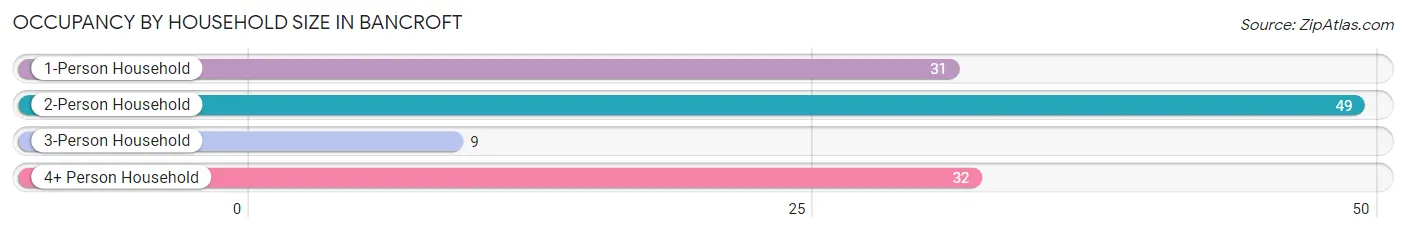
| Household Size | # Housing Units | % Housing Units |
| 1-Person Household | 31 | 25.6% |
| 2-Person Household | 49 | 40.5% |
| 3-Person Household | 9 | 7.4% |
| 4+ Person Household | 32 | 26.5% |
| Total Housing Units | 121 | 100.0% |
Occupancy by Ownership by Household Size in Bancroft
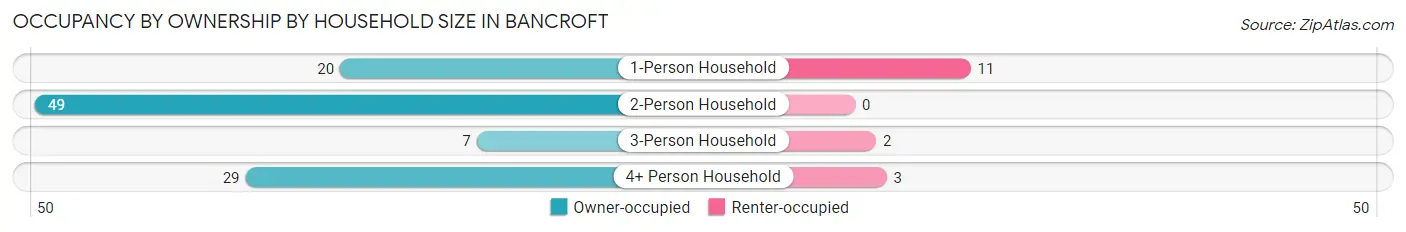
| Household Size | Owner-occupied | Renter-occupied |
| 1-Person Household | 20 (64.5%) | 11 (35.5%) |
| 2-Person Household | 49 (100.0%) | 0 (0.0%) |
| 3-Person Household | 7 (77.8%) | 2 (22.2%) |
| 4+ Person Household | 29 (90.6%) | 3 (9.4%) |
| Total Housing Units | 105 (86.8%) | 16 (13.2%) |
Occupancy by Educational Attainment in Bancroft
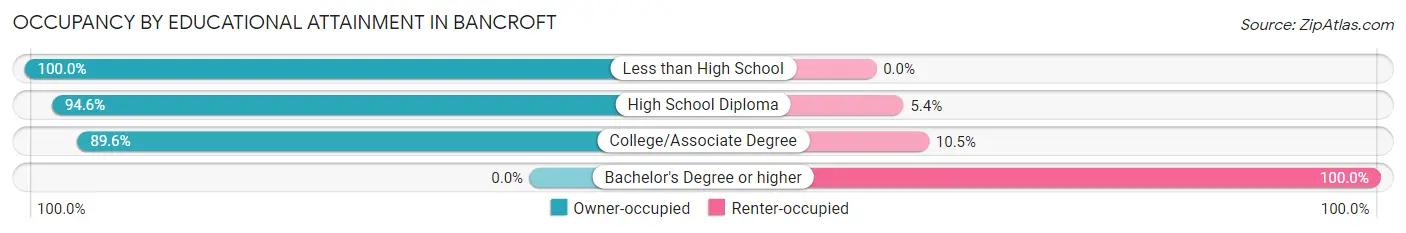
| Household Size | Owner-occupied | Renter-occupied |
| Less than High School | 10 (100.0%) | 0 (0.0%) |
| High School Diploma | 35 (94.6%) | 2 (5.4%) |
| College/Associate Degree | 60 (89.5%) | 7 (10.4%) |
| Bachelor's Degree or higher | 0 (0.0%) | 7 (100.0%) |
Occupancy by Age of Householder in Bancroft
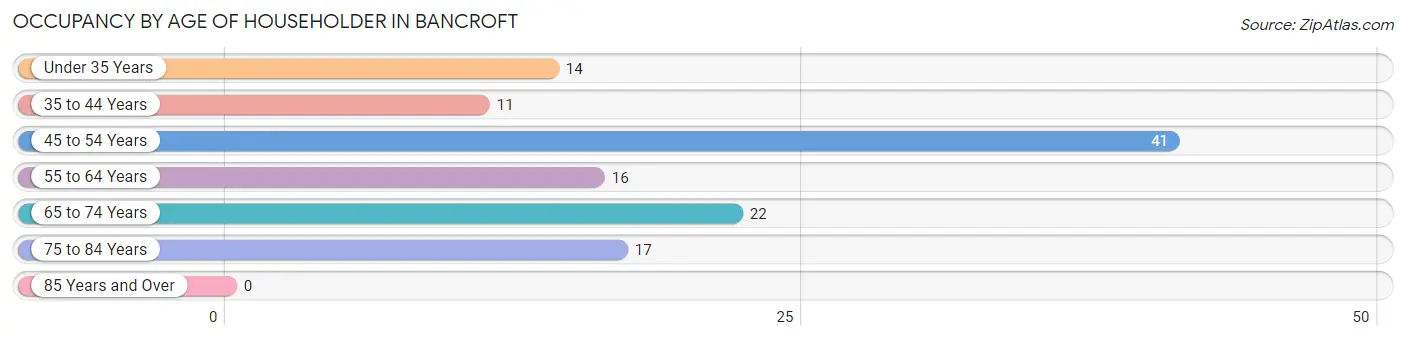
| Age Bracket | # Households | % Households |
| Under 35 Years | 14 | 11.6% |
| 35 to 44 Years | 11 | 9.1% |
| 45 to 54 Years | 41 | 33.9% |
| 55 to 64 Years | 16 | 13.2% |
| 65 to 74 Years | 22 | 18.2% |
| 75 to 84 Years | 17 | 14.1% |
| 85 Years and Over | 0 | 0.0% |
| Total | 121 | 100.0% |
Housing Finances in Bancroft
Median Income by Occupancy in Bancroft
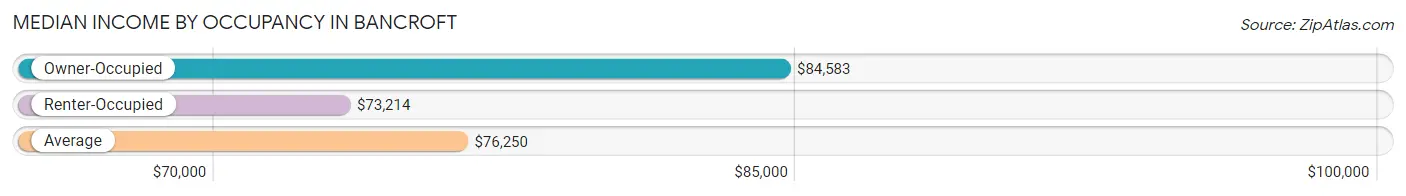
| Occupancy Type | # Households | Median Income |
| Owner-Occupied | 105 (86.8%) | $84,583 |
| Renter-Occupied | 16 (13.2%) | $73,214 |
| Average | 121 (100.0%) | $76,250 |
Occupancy by Householder Income Bracket in Bancroft
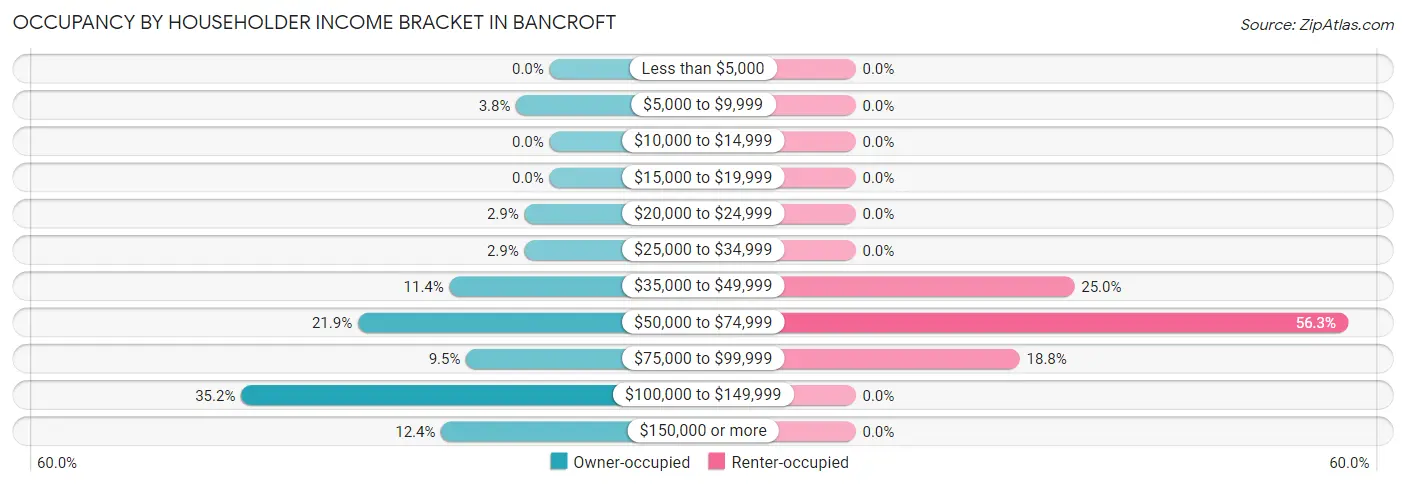
| Income Bracket | Owner-occupied | Renter-occupied |
| Less than $5,000 | 0 (0.0%) | 0 (0.0%) |
| $5,000 to $9,999 | 4 (3.8%) | 0 (0.0%) |
| $10,000 to $14,999 | 0 (0.0%) | 0 (0.0%) |
| $15,000 to $19,999 | 0 (0.0%) | 0 (0.0%) |
| $20,000 to $24,999 | 3 (2.9%) | 0 (0.0%) |
| $25,000 to $34,999 | 3 (2.9%) | 0 (0.0%) |
| $35,000 to $49,999 | 12 (11.4%) | 4 (25.0%) |
| $50,000 to $74,999 | 23 (21.9%) | 9 (56.2%) |
| $75,000 to $99,999 | 10 (9.5%) | 3 (18.8%) |
| $100,000 to $149,999 | 37 (35.2%) | 0 (0.0%) |
| $150,000 or more | 13 (12.4%) | 0 (0.0%) |
| Total | 105 (100.0%) | 16 (100.0%) |
Monthly Housing Cost Tiers in Bancroft
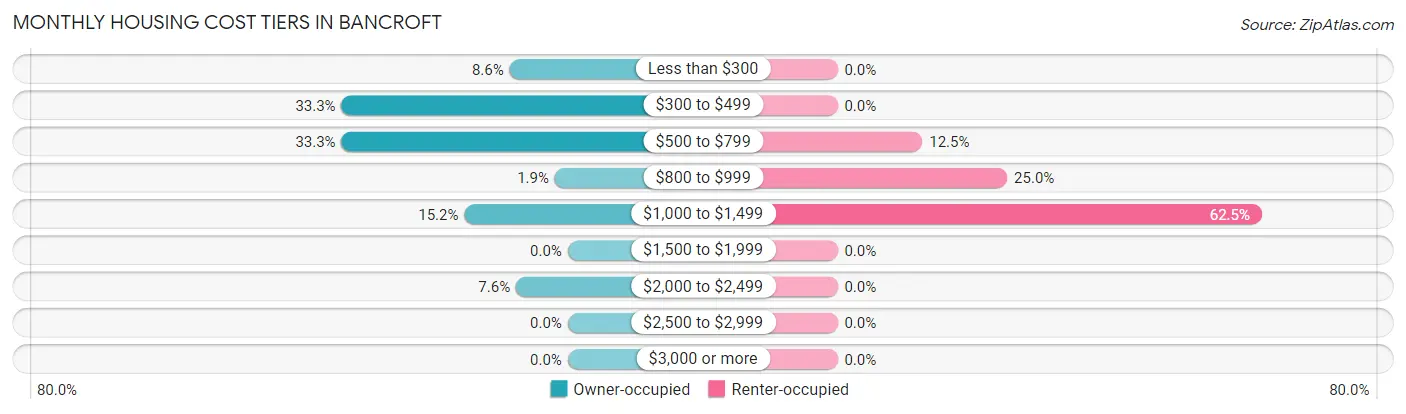
| Monthly Cost | Owner-occupied | Renter-occupied |
| Less than $300 | 9 (8.6%) | 0 (0.0%) |
| $300 to $499 | 35 (33.3%) | 0 (0.0%) |
| $500 to $799 | 35 (33.3%) | 2 (12.5%) |
| $800 to $999 | 2 (1.9%) | 4 (25.0%) |
| $1,000 to $1,499 | 16 (15.2%) | 10 (62.5%) |
| $1,500 to $1,999 | 0 (0.0%) | 0 (0.0%) |
| $2,000 to $2,499 | 8 (7.6%) | 0 (0.0%) |
| $2,500 to $2,999 | 0 (0.0%) | 0 (0.0%) |
| $3,000 or more | 0 (0.0%) | 0 (0.0%) |
| Total | 105 (100.0%) | 16 (100.0%) |
Physical Housing Characteristics in Bancroft
Housing Structures in Bancroft
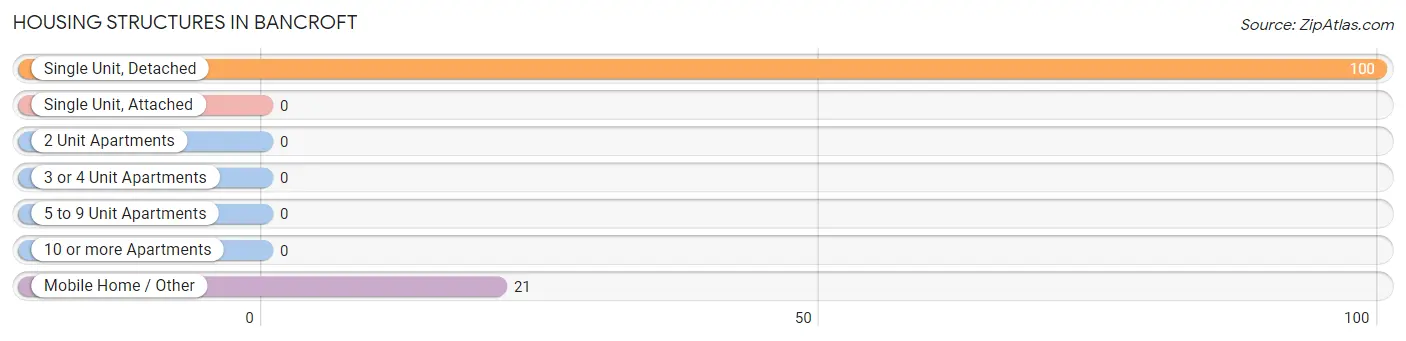
| Structure Type | # Housing Units | % Housing Units |
| Single Unit, Detached | 100 | 82.6% |
| Single Unit, Attached | 0 | 0.0% |
| 2 Unit Apartments | 0 | 0.0% |
| 3 or 4 Unit Apartments | 0 | 0.0% |
| 5 to 9 Unit Apartments | 0 | 0.0% |
| 10 or more Apartments | 0 | 0.0% |
| Mobile Home / Other | 21 | 17.4% |
| Total | 121 | 100.0% |
Housing Structures by Occupancy in Bancroft
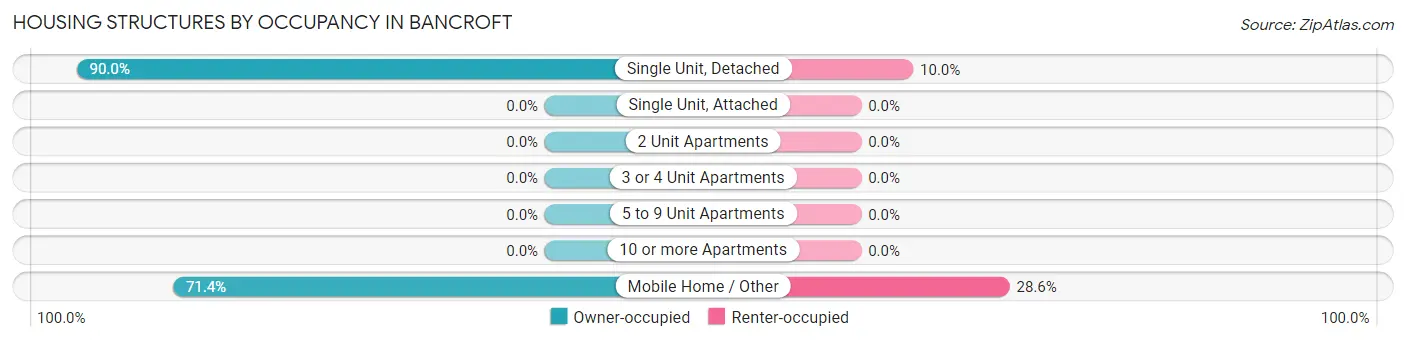
| Structure Type | Owner-occupied | Renter-occupied |
| Single Unit, Detached | 90 (90.0%) | 10 (10.0%) |
| Single Unit, Attached | 0 (0.0%) | 0 (0.0%) |
| 2 Unit Apartments | 0 (0.0%) | 0 (0.0%) |
| 3 or 4 Unit Apartments | 0 (0.0%) | 0 (0.0%) |
| 5 to 9 Unit Apartments | 0 (0.0%) | 0 (0.0%) |
| 10 or more Apartments | 0 (0.0%) | 0 (0.0%) |
| Mobile Home / Other | 15 (71.4%) | 6 (28.6%) |
| Total | 105 (86.8%) | 16 (13.2%) |
Housing Structures by Number of Rooms in Bancroft
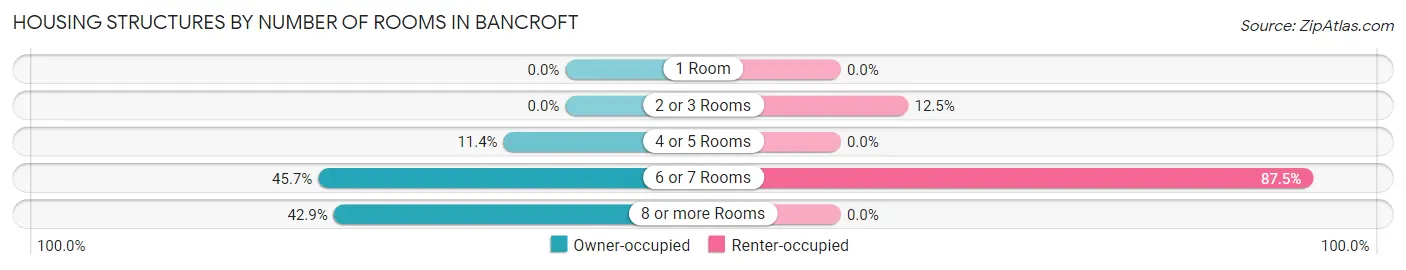
| Number of Rooms | Owner-occupied | Renter-occupied |
| 1 Room | 0 (0.0%) | 0 (0.0%) |
| 2 or 3 Rooms | 0 (0.0%) | 2 (12.5%) |
| 4 or 5 Rooms | 12 (11.4%) | 0 (0.0%) |
| 6 or 7 Rooms | 48 (45.7%) | 14 (87.5%) |
| 8 or more Rooms | 45 (42.9%) | 0 (0.0%) |
| Total | 105 (100.0%) | 16 (100.0%) |
Housing Structure by Heating Type in Bancroft
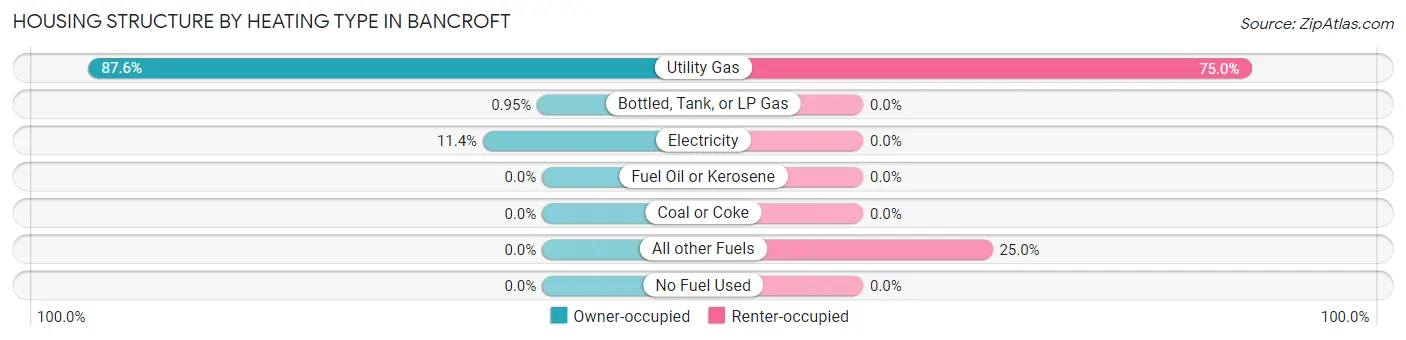
| Heating Type | Owner-occupied | Renter-occupied |
| Utility Gas | 92 (87.6%) | 12 (75.0%) |
| Bottled, Tank, or LP Gas | 1 (0.9%) | 0 (0.0%) |
| Electricity | 12 (11.4%) | 0 (0.0%) |
| Fuel Oil or Kerosene | 0 (0.0%) | 0 (0.0%) |
| Coal or Coke | 0 (0.0%) | 0 (0.0%) |
| All other Fuels | 0 (0.0%) | 4 (25.0%) |
| No Fuel Used | 0 (0.0%) | 0 (0.0%) |
| Total | 105 (100.0%) | 16 (100.0%) |
Household Vehicle Usage in Bancroft
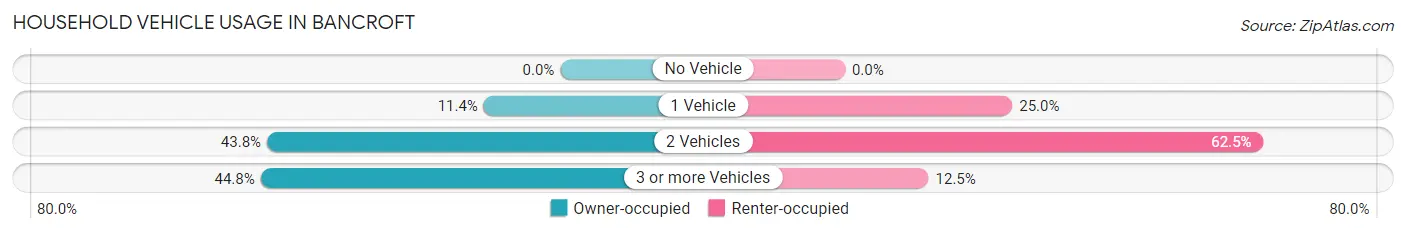
| Vehicles per Household | Owner-occupied | Renter-occupied |
| No Vehicle | 0 (0.0%) | 0 (0.0%) |
| 1 Vehicle | 12 (11.4%) | 4 (25.0%) |
| 2 Vehicles | 46 (43.8%) | 10 (62.5%) |
| 3 or more Vehicles | 47 (44.8%) | 2 (12.5%) |
| Total | 105 (100.0%) | 16 (100.0%) |
Real Estate & Mortgages in Bancroft
Real Estate and Mortgage Overview in Bancroft
| Characteristic | Without Mortgage | With Mortgage |
| Housing Units | 71 | 34 |
| Median Property Value | $156,600 | $233,300 |
| Median Household Income | $102,768 | $5 |
| Monthly Housing Costs | $456 | $0 |
| Real Estate Taxes | $1,323 | $0 |
Property Value by Mortgage Status in Bancroft
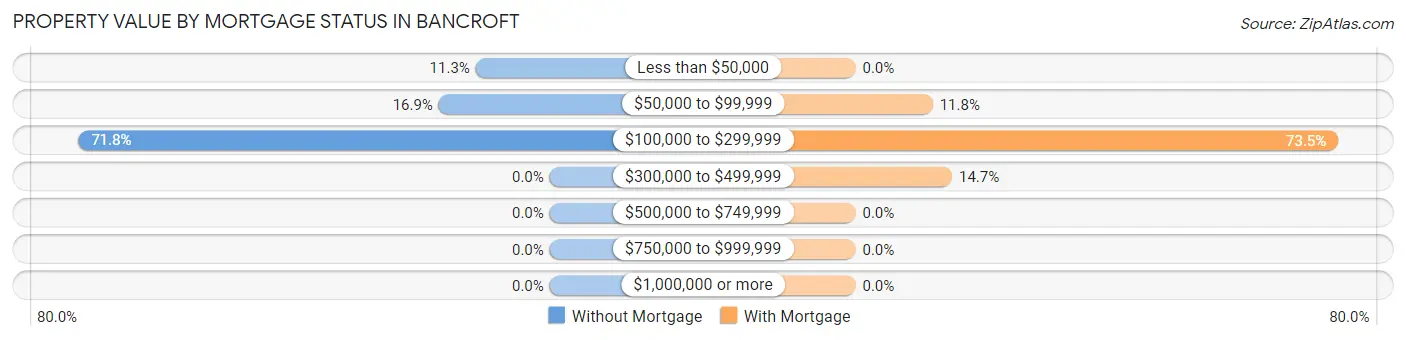
| Property Value | Without Mortgage | With Mortgage |
| Less than $50,000 | 8 (11.3%) | 0 (0.0%) |
| $50,000 to $99,999 | 12 (16.9%) | 4 (11.8%) |
| $100,000 to $299,999 | 51 (71.8%) | 25 (73.5%) |
| $300,000 to $499,999 | 0 (0.0%) | 5 (14.7%) |
| $500,000 to $749,999 | 0 (0.0%) | 0 (0.0%) |
| $750,000 to $999,999 | 0 (0.0%) | 0 (0.0%) |
| $1,000,000 or more | 0 (0.0%) | 0 (0.0%) |
| Total | 71 (100.0%) | 34 (100.0%) |
Household Income by Mortgage Status in Bancroft
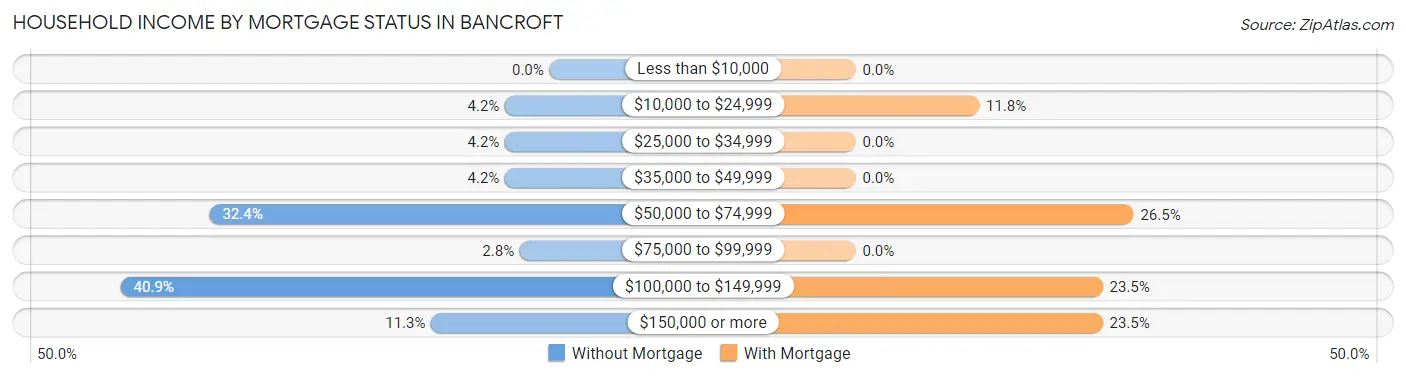
| Household Income | Without Mortgage | With Mortgage |
| Less than $10,000 | 0 (0.0%) | 0 (0.0%) |
| $10,000 to $24,999 | 3 (4.2%) | 4 (11.8%) |
| $25,000 to $34,999 | 3 (4.2%) | 0 (0.0%) |
| $35,000 to $49,999 | 3 (4.2%) | 0 (0.0%) |
| $50,000 to $74,999 | 23 (32.4%) | 9 (26.5%) |
| $75,000 to $99,999 | 2 (2.8%) | 0 (0.0%) |
| $100,000 to $149,999 | 29 (40.8%) | 8 (23.5%) |
| $150,000 or more | 8 (11.3%) | 8 (23.5%) |
| Total | 71 (100.0%) | 34 (100.0%) |
Property Value to Household Income Ratio in Bancroft
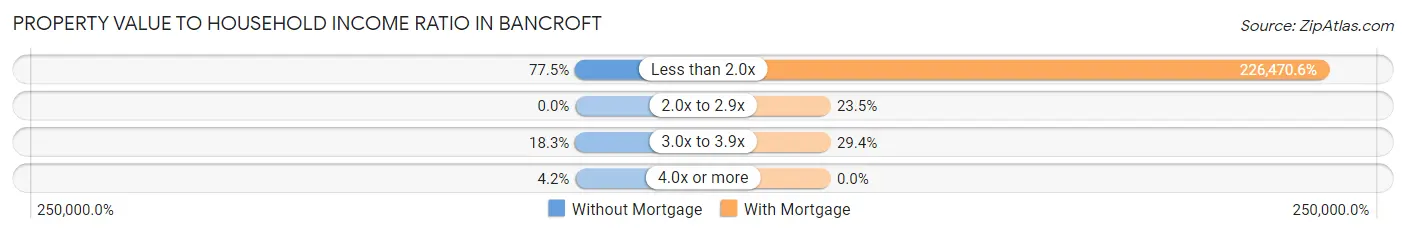
| Value-to-Income Ratio | Without Mortgage | With Mortgage |
| Less than 2.0x | 55 (77.5%) | 77,000 (226,470.6%) |
| 2.0x to 2.9x | 0 (0.0%) | 8 (23.5%) |
| 3.0x to 3.9x | 13 (18.3%) | 10 (29.4%) |
| 4.0x or more | 3 (4.2%) | 0 (0.0%) |
| Total | 71 (100.0%) | 34 (100.0%) |
Real Estate Taxes by Mortgage Status in Bancroft
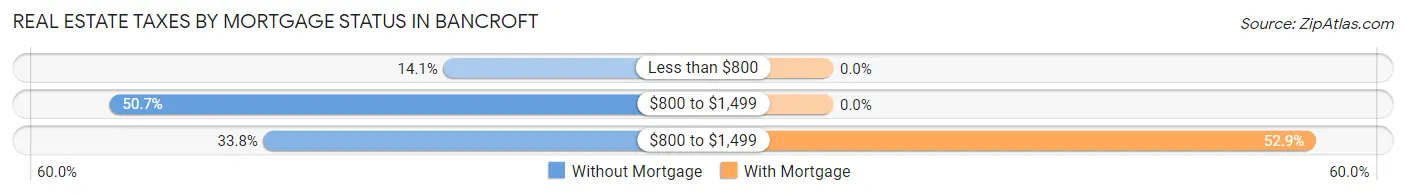
| Property Taxes | Without Mortgage | With Mortgage |
| Less than $800 | 10 (14.1%) | 0 (0.0%) |
| $800 to $1,499 | 36 (50.7%) | 0 (0.0%) |
| $800 to $1,499 | 24 (33.8%) | 18 (52.9%) |
| Total | 71 (100.0%) | 34 (100.0%) |
Health & Disability in Bancroft
Health Insurance Coverage by Age in Bancroft
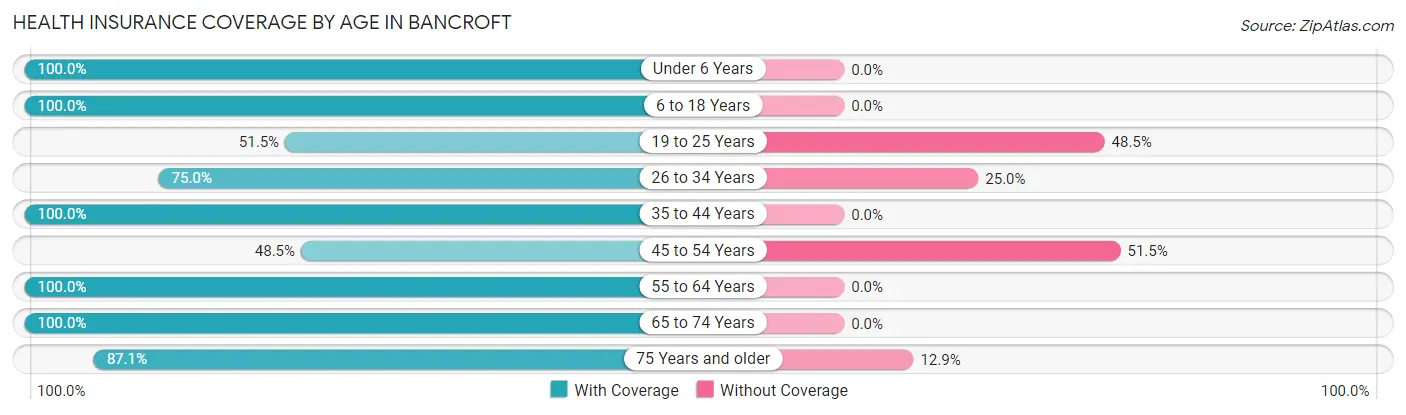
| Age Bracket | With Coverage | Without Coverage |
| Under 6 Years | 22 (100.0%) | 0 (0.0%) |
| 6 to 18 Years | 35 (100.0%) | 0 (0.0%) |
| 19 to 25 Years | 53 (51.5%) | 50 (48.5%) |
| 26 to 34 Years | 21 (75.0%) | 7 (25.0%) |
| 35 to 44 Years | 11 (100.0%) | 0 (0.0%) |
| 45 to 54 Years | 32 (48.5%) | 34 (51.5%) |
| 55 to 64 Years | 25 (100.0%) | 0 (0.0%) |
| 65 to 74 Years | 26 (100.0%) | 0 (0.0%) |
| 75 Years and older | 27 (87.1%) | 4 (12.9%) |
| Total | 252 (72.6%) | 95 (27.4%) |
Health Insurance Coverage by Citizenship Status in Bancroft
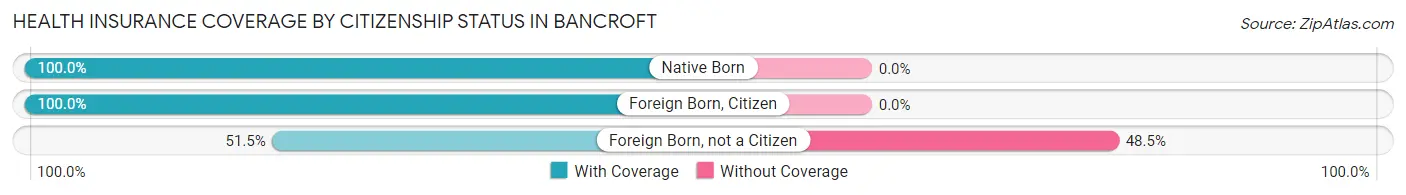
| Citizenship Status | With Coverage | Without Coverage |
| Native Born | 22 (100.0%) | 0 (0.0%) |
| Foreign Born, Citizen | 35 (100.0%) | 0 (0.0%) |
| Foreign Born, not a Citizen | 53 (51.5%) | 50 (48.5%) |
Health Insurance Coverage by Household Income in Bancroft
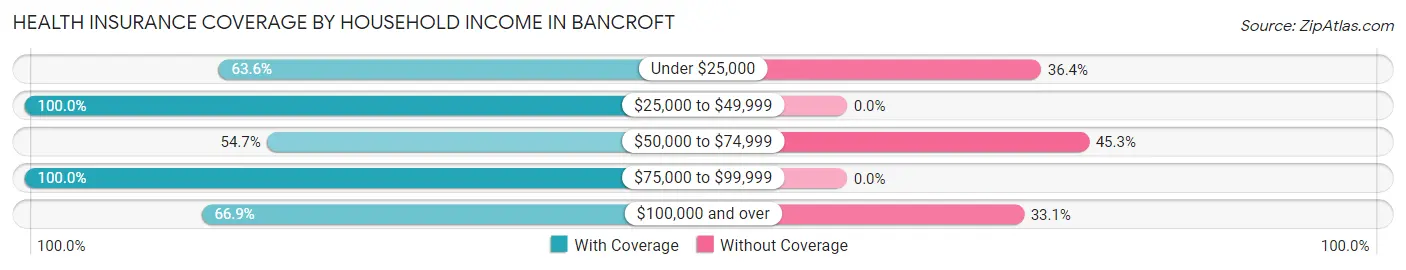
| Household Income | With Coverage | Without Coverage |
| Under $25,000 | 7 (63.6%) | 4 (36.4%) |
| $25,000 to $49,999 | 39 (100.0%) | 0 (0.0%) |
| $50,000 to $74,999 | 41 (54.7%) | 34 (45.3%) |
| $75,000 to $99,999 | 50 (100.0%) | 0 (0.0%) |
| $100,000 and over | 115 (66.9%) | 57 (33.1%) |
Public vs Private Health Insurance Coverage by Age in Bancroft
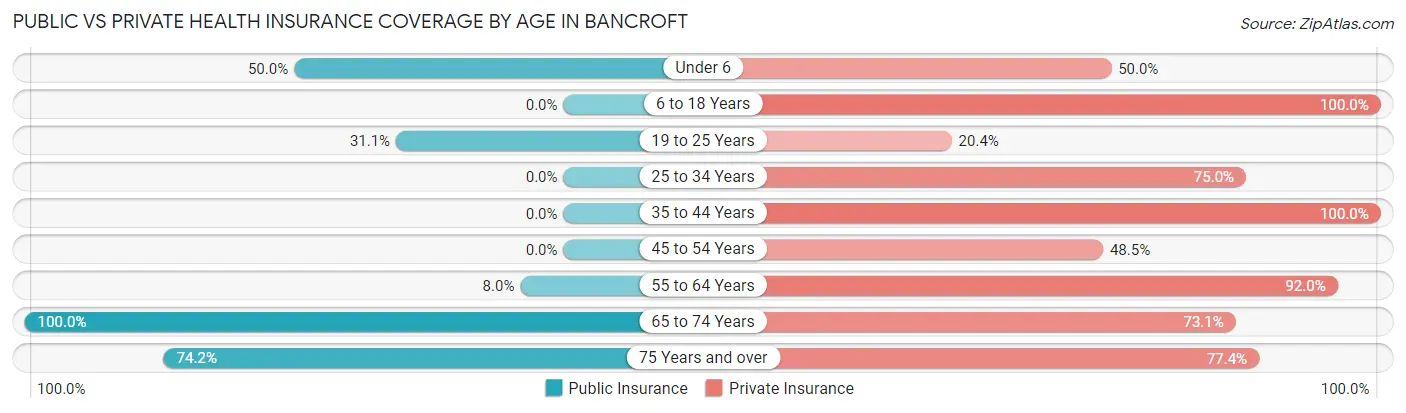
| Age Bracket | Public Insurance | Private Insurance |
| Under 6 | 11 (50.0%) | 11 (50.0%) |
| 6 to 18 Years | 0 (0.0%) | 35 (100.0%) |
| 19 to 25 Years | 32 (31.1%) | 21 (20.4%) |
| 25 to 34 Years | 0 (0.0%) | 21 (75.0%) |
| 35 to 44 Years | 0 (0.0%) | 11 (100.0%) |
| 45 to 54 Years | 0 (0.0%) | 32 (48.5%) |
| 55 to 64 Years | 2 (8.0%) | 23 (92.0%) |
| 65 to 74 Years | 26 (100.0%) | 19 (73.1%) |
| 75 Years and over | 23 (74.2%) | 24 (77.4%) |
| Total | 94 (27.1%) | 197 (56.8%) |
Disability Status by Sex by Age in Bancroft
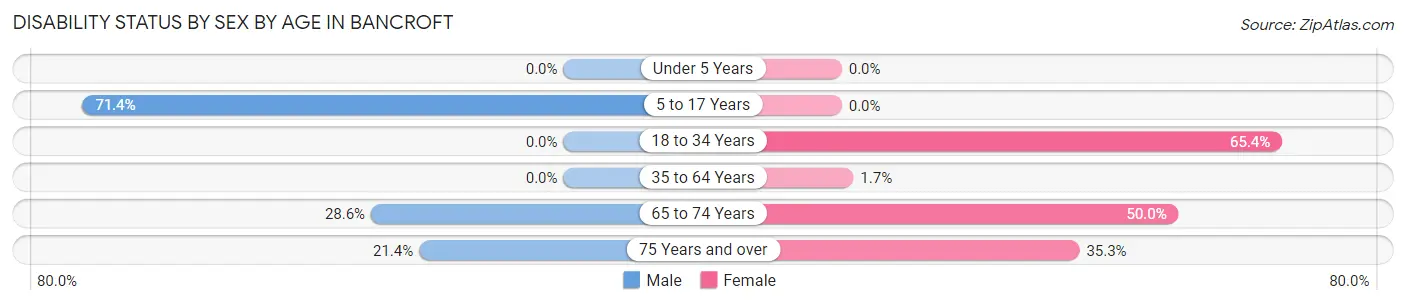
| Age Bracket | Male | Female |
| Under 5 Years | 0 (0.0%) | 0 (0.0%) |
| 5 to 17 Years | 5 (71.4%) | 0 (0.0%) |
| 18 to 34 Years | 0 (0.0%) | 34 (65.4%) |
| 35 to 64 Years | 0 (0.0%) | 1 (1.7%) |
| 65 to 74 Years | 4 (28.6%) | 6 (50.0%) |
| 75 Years and over | 3 (21.4%) | 6 (35.3%) |
Disability Class by Sex by Age in Bancroft
Disability Class: Hearing Difficulty
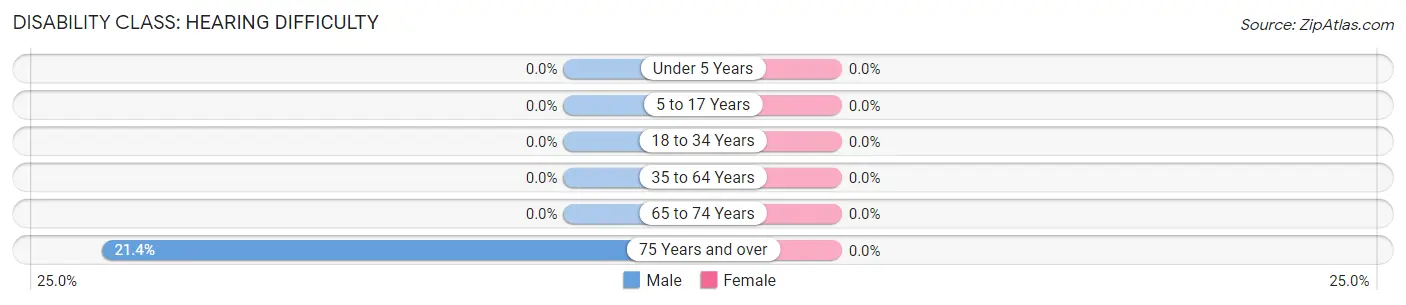
| Age Bracket | Male | Female |
| Under 5 Years | 0 (0.0%) | 0 (0.0%) |
| 5 to 17 Years | 0 (0.0%) | 0 (0.0%) |
| 18 to 34 Years | 0 (0.0%) | 0 (0.0%) |
| 35 to 64 Years | 0 (0.0%) | 0 (0.0%) |
| 65 to 74 Years | 0 (0.0%) | 0 (0.0%) |
| 75 Years and over | 3 (21.4%) | 0 (0.0%) |
Disability Class: Vision Difficulty
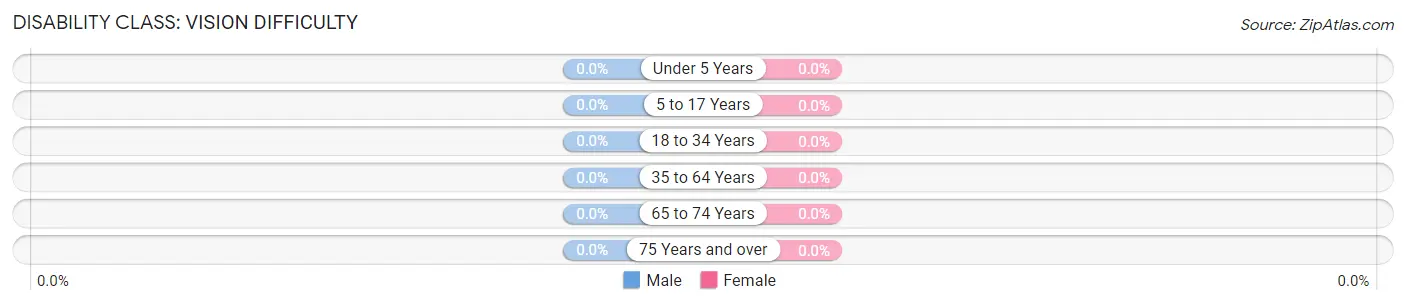
| Age Bracket | Male | Female |
| Under 5 Years | 0 (0.0%) | 0 (0.0%) |
| 5 to 17 Years | 0 (0.0%) | 0 (0.0%) |
| 18 to 34 Years | 0 (0.0%) | 0 (0.0%) |
| 35 to 64 Years | 0 (0.0%) | 0 (0.0%) |
| 65 to 74 Years | 0 (0.0%) | 0 (0.0%) |
| 75 Years and over | 0 (0.0%) | 0 (0.0%) |
Disability Class: Cognitive Difficulty
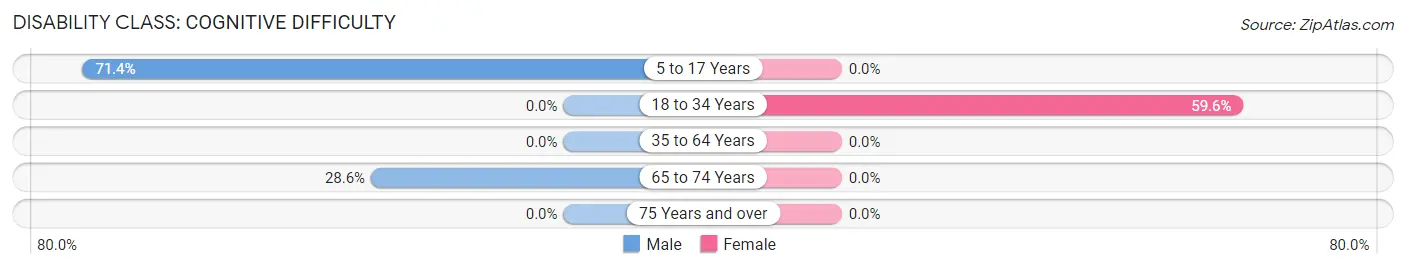
| Age Bracket | Male | Female |
| 5 to 17 Years | 5 (71.4%) | 0 (0.0%) |
| 18 to 34 Years | 0 (0.0%) | 31 (59.6%) |
| 35 to 64 Years | 0 (0.0%) | 0 (0.0%) |
| 65 to 74 Years | 4 (28.6%) | 0 (0.0%) |
| 75 Years and over | 0 (0.0%) | 0 (0.0%) |
Disability Class: Ambulatory Difficulty
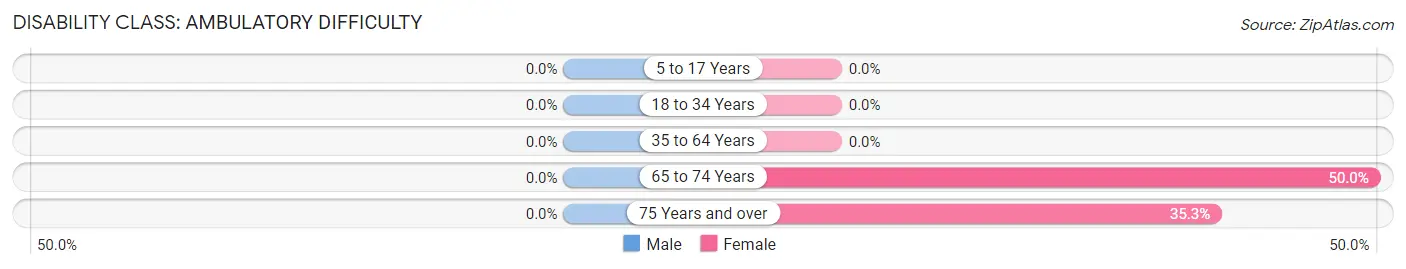
| Age Bracket | Male | Female |
| 5 to 17 Years | 0 (0.0%) | 0 (0.0%) |
| 18 to 34 Years | 0 (0.0%) | 0 (0.0%) |
| 35 to 64 Years | 0 (0.0%) | 0 (0.0%) |
| 65 to 74 Years | 0 (0.0%) | 6 (50.0%) |
| 75 Years and over | 0 (0.0%) | 6 (35.3%) |
Disability Class: Self-Care Difficulty
| Age Bracket | Male | Female |
| 5 to 17 Years | 0 (0.0%) | 0 (0.0%) |
| 18 to 34 Years | 0 (0.0%) | 0 (0.0%) |
| 35 to 64 Years | 0 (0.0%) | 0 (0.0%) |
| 65 to 74 Years | 0 (0.0%) | 0 (0.0%) |
| 75 Years and over | 0 (0.0%) | 0 (0.0%) |
Technology Access in Bancroft
Computing Device Access in Bancroft
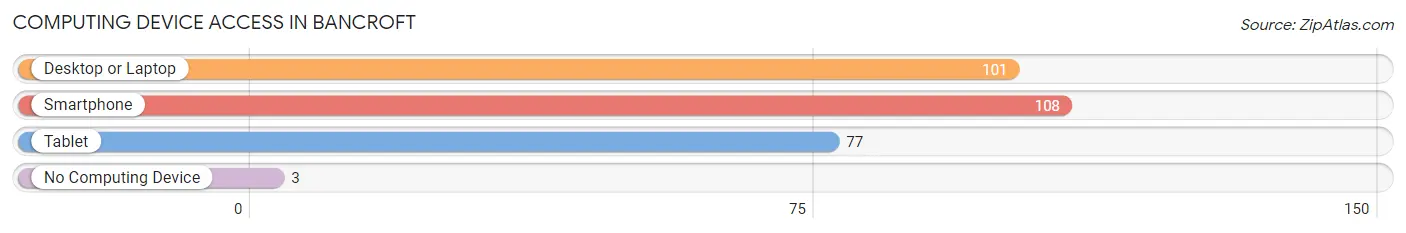
| Device Type | # Households | % Households |
| Desktop or Laptop | 101 | 83.5% |
| Smartphone | 108 | 89.3% |
| Tablet | 77 | 63.6% |
| No Computing Device | 3 | 2.5% |
| Total | 121 | 100.0% |
Internet Access in Bancroft
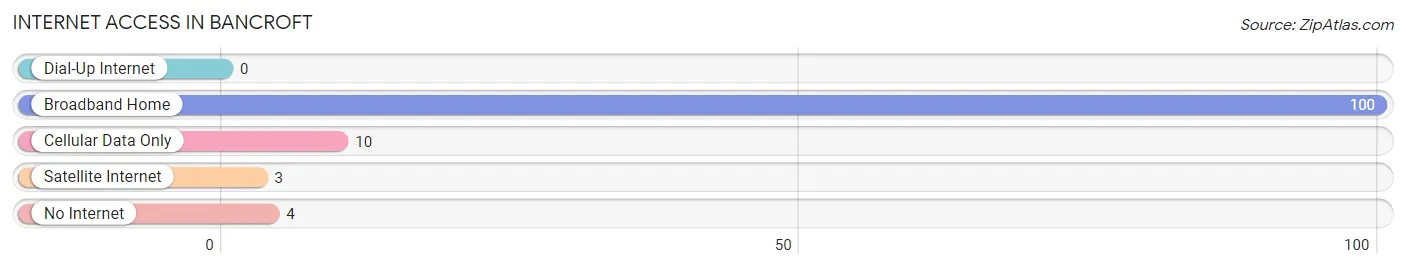
| Internet Type | # Households | % Households |
| Dial-Up Internet | 0 | 0.0% |
| Broadband Home | 100 | 82.6% |
| Cellular Data Only | 10 | 8.3% |
| Satellite Internet | 3 | 2.5% |
| No Internet | 4 | 3.3% |
| Total | 121 | 100.0% |
Bancroft Summary
Bancroft is a small town located in the southeastern corner of Power County, Idaho. It is situated on the Snake River, near the border of Utah and Wyoming. The town was founded in 1883 and was named after the Bancroft family, who were early settlers in the area. The population of Bancroft was estimated to be around 500 in 2020.
History
The area around Bancroft was first settled by the Shoshone and Bannock Native American tribes. The first white settlers arrived in the area in the late 1800s, and the town of Bancroft was officially founded in 1883. The town was named after the Bancroft family, who were early settlers in the area.
The town grew quickly, and by the early 1900s, it had become a bustling center of commerce and industry. The town was home to several businesses, including a flour mill, a sawmill, a creamery, and a blacksmith shop. The town also had a school, a post office, and a hotel.
In the early 1900s, the town was also home to a large population of Chinese immigrants. The Chinese immigrants worked in the local businesses and helped to build the town.
Geography
Bancroft is located in the southeastern corner of Power County, Idaho. It is situated on the Snake River, near the border of Utah and Wyoming. The town is located in a semi-arid region, with an average annual precipitation of around 10 inches. The town is surrounded by rolling hills and sagebrush-covered plains.
The town is located at an elevation of 4,890 feet above sea level. The climate in Bancroft is generally mild, with hot summers and cold winters.
Economy
The economy of Bancroft is largely based on agriculture and tourism. The town is home to several farms, which produce a variety of crops, including potatoes, alfalfa, and wheat. The town is also home to several tourist attractions, including the Snake River Canyon, the Bancroft Museum, and the Bancroft Hot Springs.
The town is also home to several businesses, including a grocery store, a hardware store, and a restaurant. The town is served by the Bancroft-Power County Airport, which offers flights to nearby cities.
Demographics
The population of Bancroft was estimated to be around 500 in 2020. The town is predominantly white, with a small Hispanic population. The median household income in Bancroft is around $35,000, and the median home value is around $150,000. The town has a low unemployment rate, and the poverty rate is below the national average.
Common Questions
What is Per Capita Income in Bancroft?
Per Capita income in Bancroft is $29,418.
What is the Median Family Income in Bancroft?
Median Family Income in Bancroft is $85,000.
What is the Median Household income in Bancroft?
Median Household Income in Bancroft is $76,250.
What is Inequality or Gini Index in Bancroft?
Inequality or Gini Index in Bancroft is 0.27.
What is the Total Population of Bancroft?
Total Population of Bancroft is 347.
What is the Total Male Population of Bancroft?
Total Male Population of Bancroft is 187.
What is the Total Female Population of Bancroft?
Total Female Population of Bancroft is 160.
What is the Ratio of Males per 100 Females in Bancroft?
There are 116.88 Males per 100 Females in Bancroft.
What is the Ratio of Females per 100 Males in Bancroft?
There are 85.56 Females per 100 Males in Bancroft.
What is the Median Population Age in Bancroft?
Median Population Age in Bancroft is 30.8 Years.
What is the Average Family Size in Bancroft
Average Family Size in Bancroft is 3.4 People.
What is the Average Household Size in Bancroft
Average Household Size in Bancroft is 2.9 People.
How Large is the Labor Force in Bancroft?
There are 175 People in the Labor Forcein in Bancroft.
What is the Percentage of People in the Labor Force in Bancroft?
57.4% of People are in the Labor Force in Bancroft.