Athol, ID Map & Demographics
Athol Map
Athol Overview
$24,211
PER CAPITA INCOME
$76,563
AVG FAMILY INCOME
$48,500
AVG HOUSEHOLD INCOME
33.5%
WAGE / INCOME GAP [ % ]
66.5¢/ $1
WAGE / INCOME GAP [ $ ]
0.40
INEQUALITY / GINI INDEX
790
TOTAL POPULATION
390
MALE POPULATION
400
FEMALE POPULATION
97.50
MALES / 100 FEMALES
102.56
FEMALES / 100 MALES
42.7
MEDIAN AGE
3.6
AVG FAMILY SIZE
2.7
AVG HOUSEHOLD SIZE
304
LABOR FORCE [ PEOPLE ]
50.5%
PERCENT IN LABOR FORCE
0.7%
UNEMPLOYMENT RATE
Athol Zip Codes
Athol Area Codes
Income in Athol
Income Overview in Athol
Per Capita Income in Athol is $24,211, while median incomes of families and households are $76,563 and $48,500 respectively.
| Characteristic | Number | Measure |
| Per Capita Income | 790 | $24,211 |
| Median Family Income | 174 | $76,563 |
| Mean Family Income | 174 | $80,185 |
| Median Household Income | 292 | $48,500 |
| Mean Household Income | 292 | $63,446 |
| Income Deficit | 174 | $0 |
| Wage / Income Gap (%) | 790 | 33.48% |
| Wage / Income Gap ($) | 790 | 66.52¢ per $1 |
| Gini / Inequality Index | 790 | 0.40 |
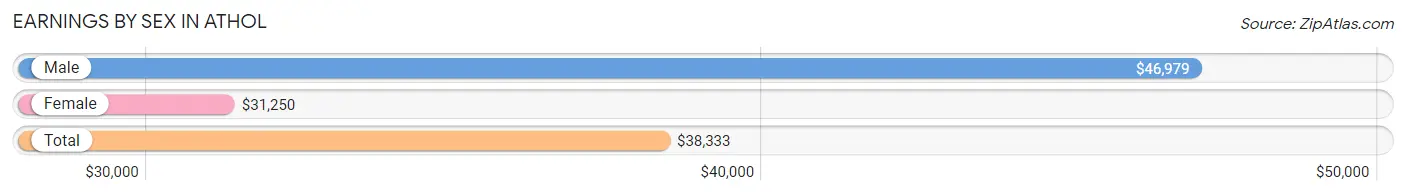
Earnings by Sex in Athol
Average Earnings in Athol are $38,333, $46,979 for men and $31,250 for women, a difference of 33.5%.
| Sex | Number | Average Earnings |
| Male | 153 (48.7%) | $46,979 |
| Female | 161 (51.3%) | $31,250 |
| Total | 314 (100.0%) | $38,333 |
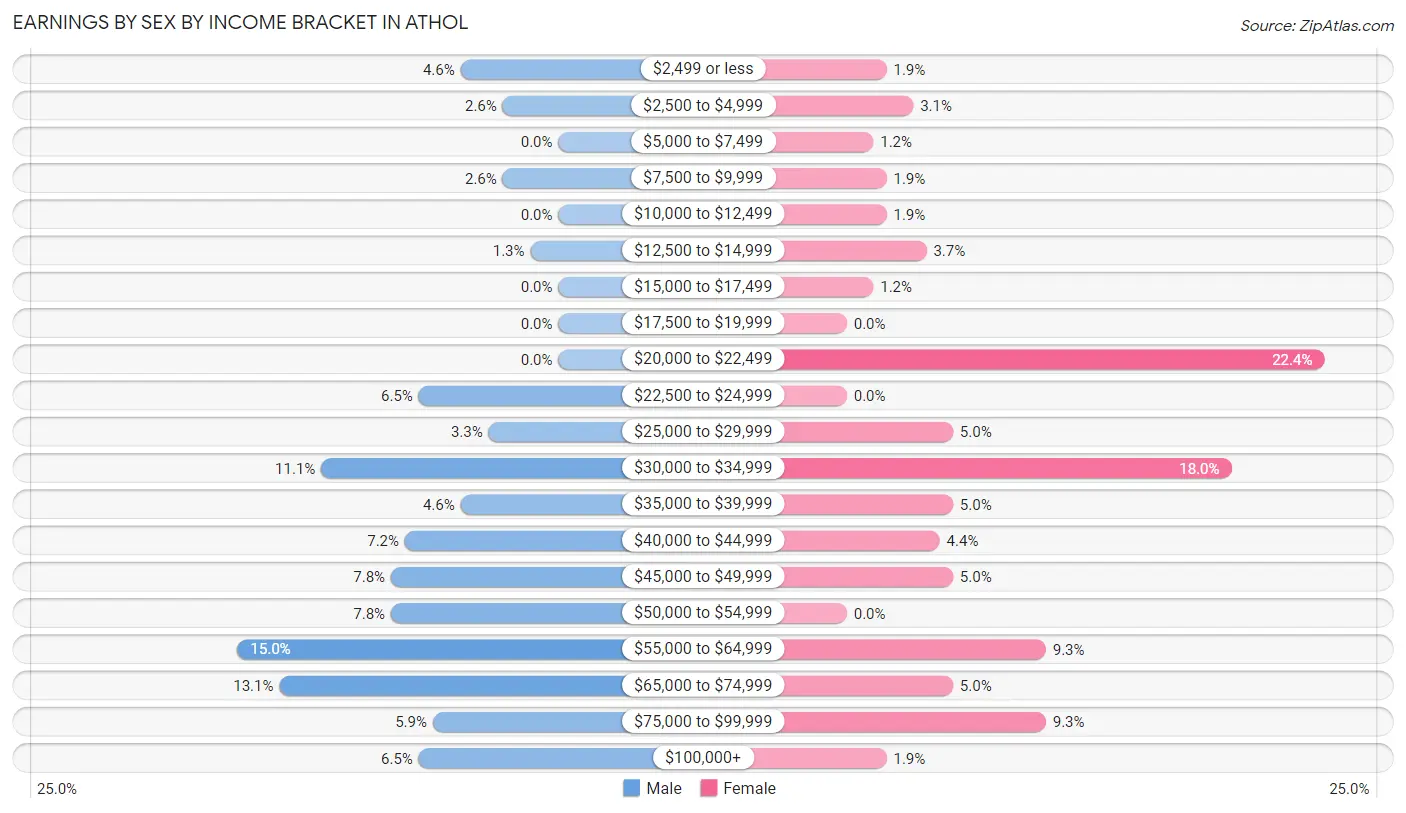
Earnings by Sex by Income Bracket in Athol
The most common earnings brackets in Athol are $55,000 to $64,999 for men (23 | 15.0%) and $20,000 to $22,499 for women (36 | 22.4%).
| Income | Male | Female |
| $2,499 or less | 7 (4.6%) | 3 (1.9%) |
| $2,500 to $4,999 | 4 (2.6%) | 5 (3.1%) |
| $5,000 to $7,499 | 0 (0.0%) | 2 (1.2%) |
| $7,500 to $9,999 | 4 (2.6%) | 3 (1.9%) |
| $10,000 to $12,499 | 0 (0.0%) | 3 (1.9%) |
| $12,500 to $14,999 | 2 (1.3%) | 6 (3.7%) |
| $15,000 to $17,499 | 0 (0.0%) | 2 (1.2%) |
| $17,500 to $19,999 | 0 (0.0%) | 0 (0.0%) |
| $20,000 to $22,499 | 0 (0.0%) | 36 (22.4%) |
| $22,500 to $24,999 | 10 (6.5%) | 0 (0.0%) |
| $25,000 to $29,999 | 5 (3.3%) | 8 (5.0%) |
| $30,000 to $34,999 | 17 (11.1%) | 29 (18.0%) |
| $35,000 to $39,999 | 7 (4.6%) | 8 (5.0%) |
| $40,000 to $44,999 | 11 (7.2%) | 7 (4.3%) |
| $45,000 to $49,999 | 12 (7.8%) | 8 (5.0%) |
| $50,000 to $54,999 | 12 (7.8%) | 0 (0.0%) |
| $55,000 to $64,999 | 23 (15.0%) | 15 (9.3%) |
| $65,000 to $74,999 | 20 (13.1%) | 8 (5.0%) |
| $75,000 to $99,999 | 9 (5.9%) | 15 (9.3%) |
| $100,000+ | 10 (6.5%) | 3 (1.9%) |
| Total | 153 (100.0%) | 161 (100.0%) |
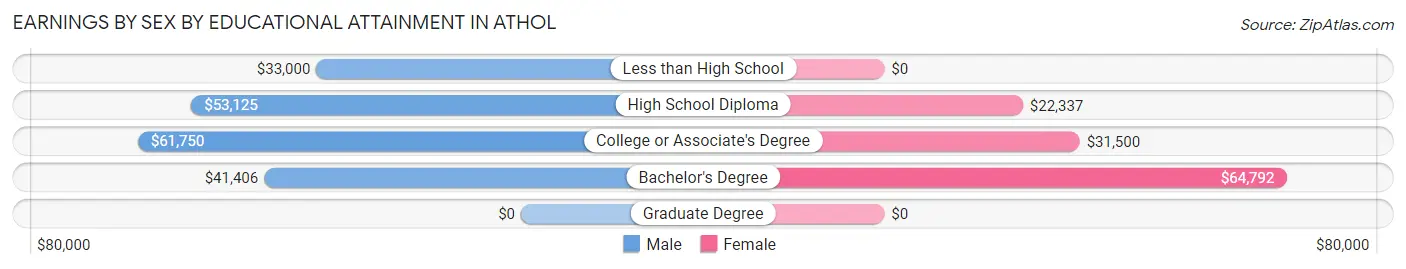
Earnings by Sex by Educational Attainment in Athol
Average earnings in Athol are $53,472 for men and $31,450 for women, a difference of 41.2%. Men with an educational attainment of college or associate's degree enjoy the highest average annual earnings of $61,750, while those with less than high school education earn the least with $33,000. Women with an educational attainment of bachelor's degree earn the most with the average annual earnings of $64,792, while those with high school diploma education have the smallest earnings of $22,337.
| Educational Attainment | Male Income | Female Income |
| Less than High School | $33,000 | $0 |
| High School Diploma | $53,125 | $22,337 |
| College or Associate's Degree | $61,750 | $31,500 |
| Bachelor's Degree | $41,406 | $64,792 |
| Graduate Degree | - | - |
| Total | $53,472 | $31,450 |
Family Income in Athol
Family Income Brackets in Athol
According to the Athol family income data, there are 52 families falling into the $75,000 to $99,999 income range, which is the most common income bracket and makes up 29.9% of all families.
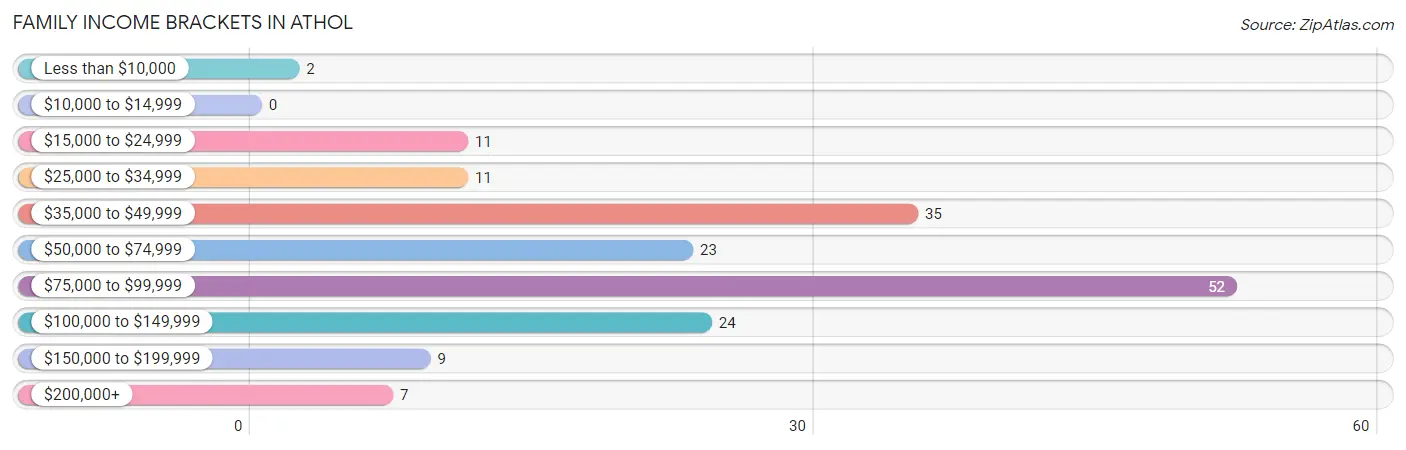
| Income Bracket | # Families | % Families |
| Less than $10,000 | 2 | 1.1% |
| $10,000 to $14,999 | 0 | 0.0% |
| $15,000 to $24,999 | 11 | 6.3% |
| $25,000 to $34,999 | 11 | 6.3% |
| $35,000 to $49,999 | 35 | 20.1% |
| $50,000 to $74,999 | 23 | 13.2% |
| $75,000 to $99,999 | 52 | 29.9% |
| $100,000 to $149,999 | 24 | 13.8% |
| $150,000 to $199,999 | 9 | 5.2% |
| $200,000+ | 7 | 4.0% |
Family Income by Famaliy Size in Athol
5-person families (20 | 11.5%) account for the highest median family income in Athol with $127,917 per family, while 3-person families (35 | 20.1%) have the highest median income of $28,438 per family member.
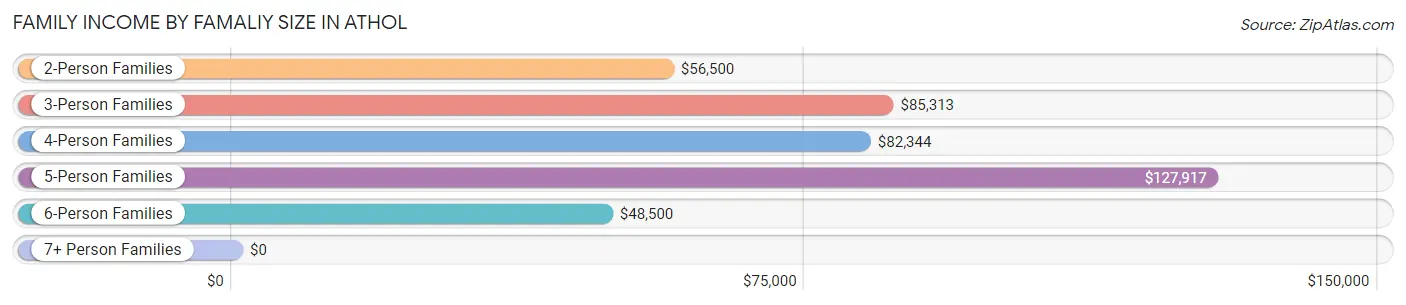
| Income Bracket | # Families | Median Income |
| 2-Person Families | 80 (46.0%) | $56,500 |
| 3-Person Families | 35 (20.1%) | $85,313 |
| 4-Person Families | 19 (10.9%) | $82,344 |
| 5-Person Families | 20 (11.5%) | $127,917 |
| 6-Person Families | 10 (5.8%) | $48,500 |
| 7+ Person Families | 10 (5.8%) | $0 |
| Total | 174 (100.0%) | $76,563 |
Family Income by Number of Earners in Athol
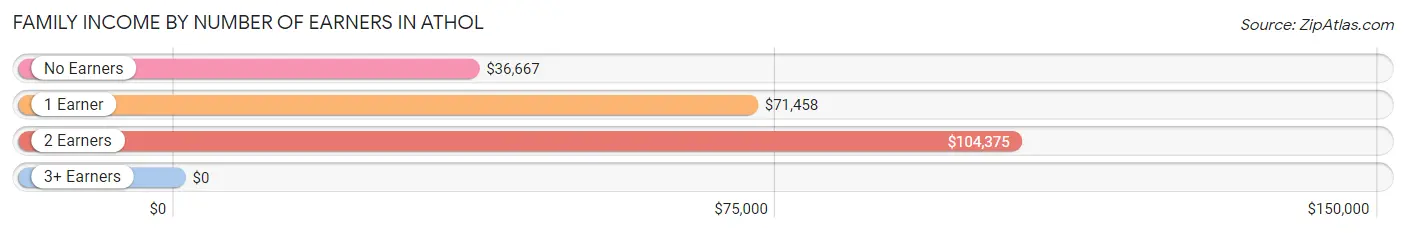
| Number of Earners | # Families | Median Income |
| No Earners | 38 (21.8%) | $36,667 |
| 1 Earner | 59 (33.9%) | $71,458 |
| 2 Earners | 63 (36.2%) | $104,375 |
| 3+ Earners | 14 (8.1%) | $0 |
| Total | 174 (100.0%) | $76,563 |
Household Income in Athol
Household Income Brackets in Athol
With 61 households falling in the category, the $75,000 to $99,999 income range is the most frequent in Athol, accounting for 20.9% of all households. In contrast, only 7 households (2.4%) fall into the $200,000+ income bracket, making it the least populous group.
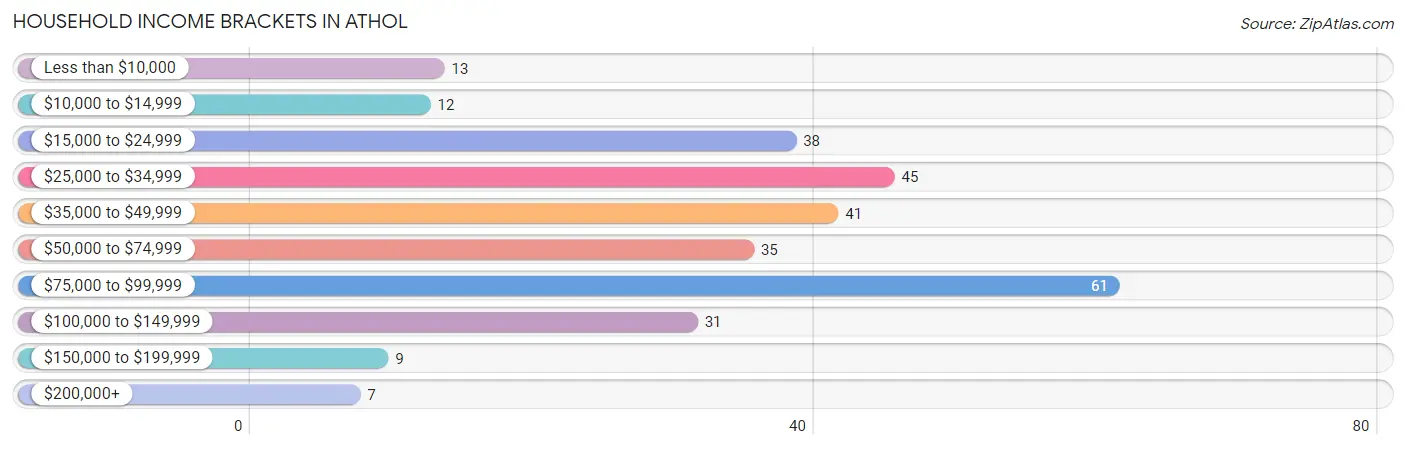
| Income Bracket | # Households | % Households |
| Less than $10,000 | 13 | 4.5% |
| $10,000 to $14,999 | 12 | 4.1% |
| $15,000 to $24,999 | 38 | 13.0% |
| $25,000 to $34,999 | 45 | 15.4% |
| $35,000 to $49,999 | 41 | 14.0% |
| $50,000 to $74,999 | 35 | 12.0% |
| $75,000 to $99,999 | 61 | 20.9% |
| $100,000 to $149,999 | 31 | 10.6% |
| $150,000 to $199,999 | 9 | 3.1% |
| $200,000+ | 7 | 2.4% |
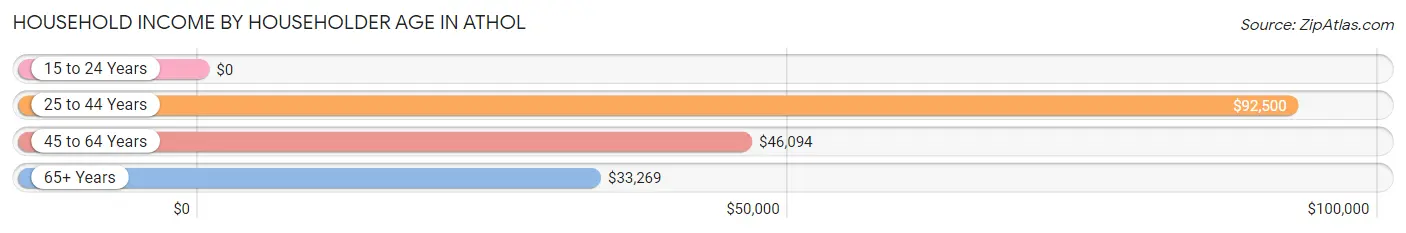
Household Income by Householder Age in Athol
The median household income in Athol is $48,500, with the highest median household income of $92,500 found in the 25 to 44 years age bracket for the primary householder. A total of 78 households (26.7%) fall into this category. Meanwhile, the 15 to 24 years age bracket for the primary householder has the lowest median household income of $0, with 7 households (2.4%) in this group.
| Income Bracket | # Households | Median Income |
| 15 to 24 Years | 7 (2.4%) | $0 |
| 25 to 44 Years | 78 (26.7%) | $92,500 |
| 45 to 64 Years | 113 (38.7%) | $46,094 |
| 65+ Years | 94 (32.2%) | $33,269 |
| Total | 292 (100.0%) | $48,500 |
Poverty in Athol
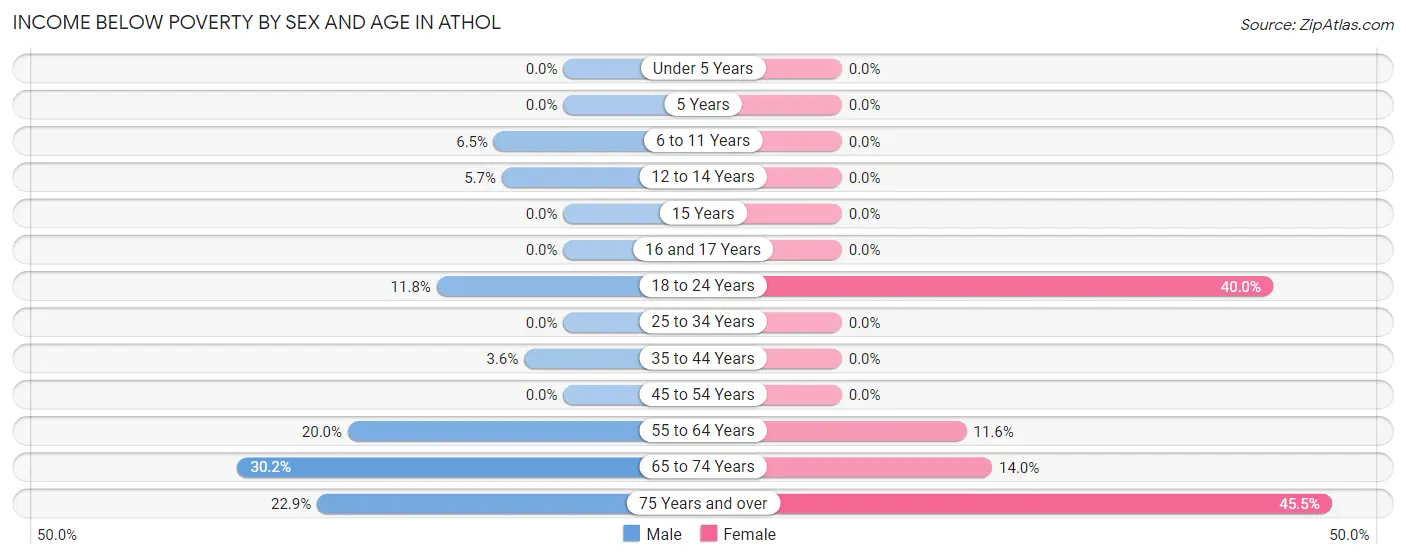
Income Below Poverty by Sex and Age in Athol
With 9.5% poverty level for males and 9.5% for females among the residents of Athol, 65 to 74 year old males and 75 year old and over females are the most vulnerable to poverty, with 13 males (30.2%) and 15 females (45.5%) in their respective age groups living below the poverty level.
| Age Bracket | Male | Female |
| Under 5 Years | 0 (0.0%) | 0 (0.0%) |
| 5 Years | 0 (0.0%) | 0 (0.0%) |
| 6 to 11 Years | 2 (6.5%) | 0 (0.0%) |
| 12 to 14 Years | 2 (5.7%) | 0 (0.0%) |
| 15 Years | 0 (0.0%) | 0 (0.0%) |
| 16 and 17 Years | 0 (0.0%) | 0 (0.0%) |
| 18 to 24 Years | 2 (11.8%) | 6 (40.0%) |
| 25 to 34 Years | 0 (0.0%) | 0 (0.0%) |
| 35 to 44 Years | 2 (3.6%) | 0 (0.0%) |
| 45 to 54 Years | 0 (0.0%) | 0 (0.0%) |
| 55 to 64 Years | 8 (20.0%) | 11 (11.6%) |
| 65 to 74 Years | 13 (30.2%) | 6 (14.0%) |
| 75 Years and over | 8 (22.9%) | 15 (45.5%) |
| Total | 37 (9.5%) | 38 (9.5%) |
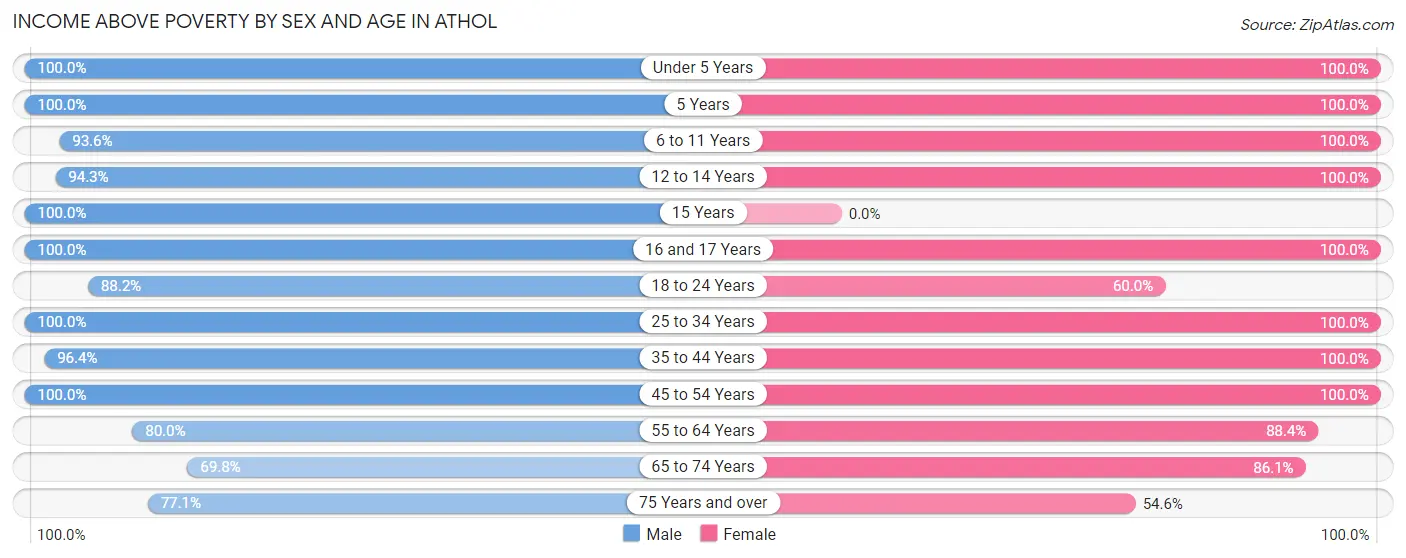
Income Above Poverty by Sex and Age in Athol
According to the poverty statistics in Athol, males aged under 5 years and females aged under 5 years are the age groups that are most secure financially, with 100.0% of males and 100.0% of females in these age groups living above the poverty line.
| Age Bracket | Male | Female |
| Under 5 Years | 9 (100.0%) | 41 (100.0%) |
| 5 Years | 2 (100.0%) | 8 (100.0%) |
| 6 to 11 Years | 29 (93.5%) | 27 (100.0%) |
| 12 to 14 Years | 33 (94.3%) | 18 (100.0%) |
| 15 Years | 17 (100.0%) | 0 (0.0%) |
| 16 and 17 Years | 11 (100.0%) | 6 (100.0%) |
| 18 to 24 Years | 15 (88.2%) | 9 (60.0%) |
| 25 to 34 Years | 35 (100.0%) | 39 (100.0%) |
| 35 to 44 Years | 53 (96.4%) | 45 (100.0%) |
| 45 to 54 Years | 60 (100.0%) | 30 (100.0%) |
| 55 to 64 Years | 32 (80.0%) | 84 (88.4%) |
| 65 to 74 Years | 30 (69.8%) | 37 (86.1%) |
| 75 Years and over | 27 (77.1%) | 18 (54.5%) |
| Total | 353 (90.5%) | 362 (90.5%) |
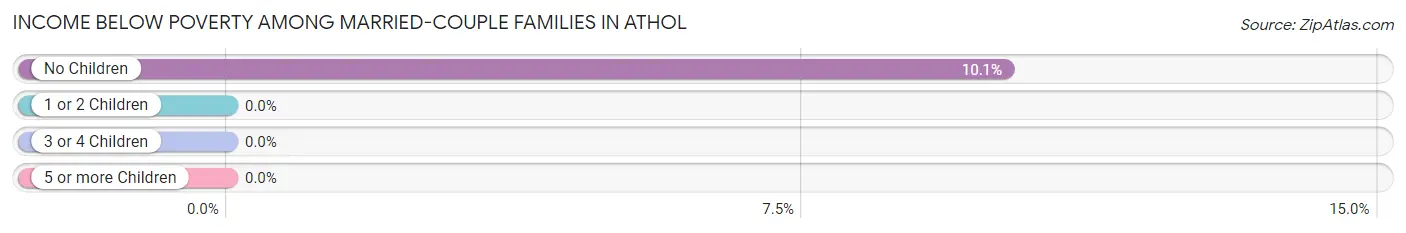
Income Below Poverty Among Married-Couple Families in Athol
The poverty statistics for married-couple families in Athol show that 5.4% or 8 of the total 149 families live below the poverty line. Families with no children have the highest poverty rate of 10.1%, comprising of 8 families. On the other hand, families with 1 or 2 children have the lowest poverty rate of 0.0%, which includes 0 families.
| Children | Above Poverty | Below Poverty |
| No Children | 71 (89.9%) | 8 (10.1%) |
| 1 or 2 Children | 40 (100.0%) | 0 (0.0%) |
| 3 or 4 Children | 20 (100.0%) | 0 (0.0%) |
| 5 or more Children | 10 (100.0%) | 0 (0.0%) |
| Total | 141 (94.6%) | 8 (5.4%) |
Income Below Poverty Among Single-Parent Households in Athol
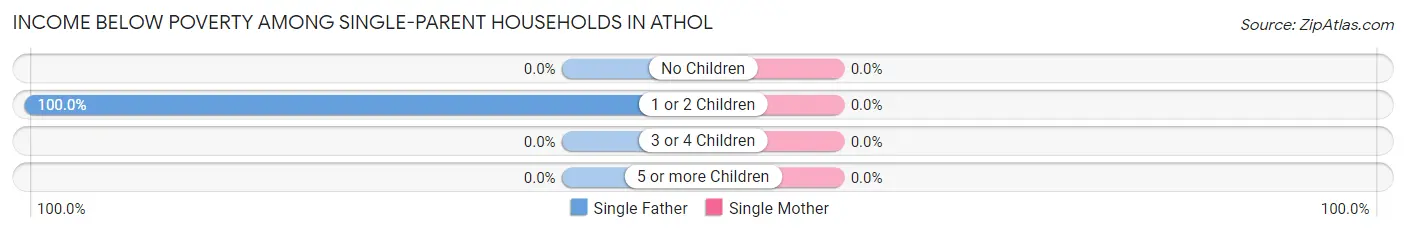
| Children | Single Father | Single Mother |
| No Children | 0 (0.0%) | 0 (0.0%) |
| 1 or 2 Children | 2 (100.0%) | 0 (0.0%) |
| 3 or 4 Children | 0 (0.0%) | 0 (0.0%) |
| 5 or more Children | 0 (0.0%) | 0 (0.0%) |
| Total | 2 (33.3%) | 0 (0.0%) |
Income Below Poverty Among Married-Couple vs Single-Parent Households in Athol
The poverty data for Athol shows that 8 of the married-couple family households (5.4%) and 2 of the single-parent households (8.0%) are living below the poverty level. Within the married-couple family households, those with no children have the highest poverty rate, with 8 households (10.1%) falling below the poverty line. Among the single-parent households, those with 1 or 2 children have the highest poverty rate, with 2 household (20.0%) living below poverty.
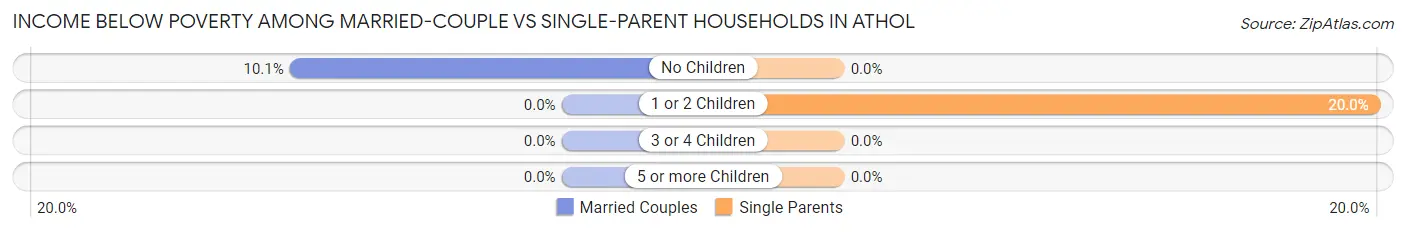
| Children | Married-Couple Families | Single-Parent Households |
| No Children | 8 (10.1%) | 0 (0.0%) |
| 1 or 2 Children | 0 (0.0%) | 2 (20.0%) |
| 3 or 4 Children | 0 (0.0%) | 0 (0.0%) |
| 5 or more Children | 0 (0.0%) | 0 (0.0%) |
| Total | 8 (5.4%) | 2 (8.0%) |
Race in Athol
The most populous races in Athol are White / Caucasian (634 | 80.2%), Two or more Races (97 | 12.3%), and Hispanic or Latino (85 | 10.8%).
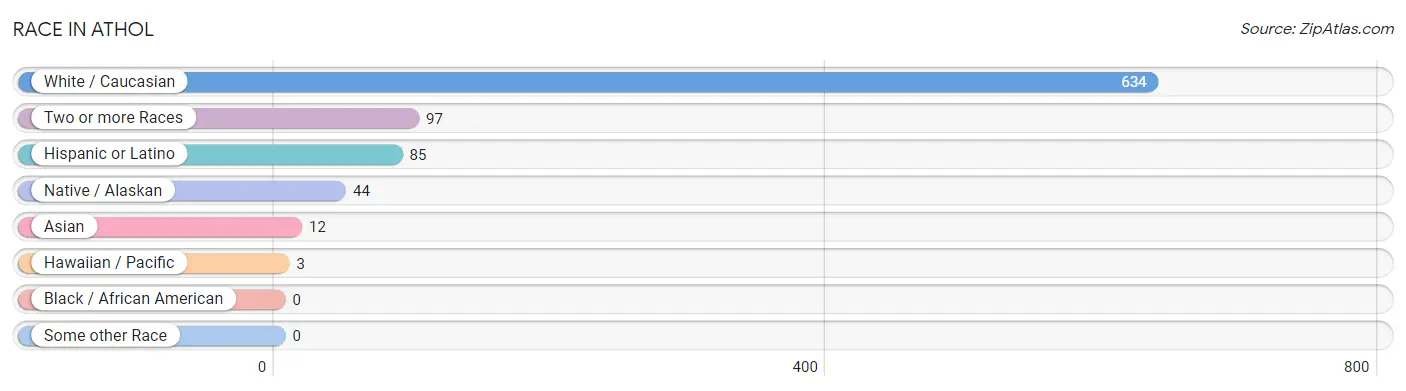
| Race | # Population | % Population |
| Asian | 12 | 1.5% |
| Black / African American | 0 | 0.0% |
| Hawaiian / Pacific | 3 | 0.4% |
| Hispanic or Latino | 85 | 10.8% |
| Native / Alaskan | 44 | 5.6% |
| White / Caucasian | 634 | 80.2% |
| Two or more Races | 97 | 12.3% |
| Some other Race | 0 | 0.0% |
| Total | 790 | 100.0% |
Ancestry in Athol
The most populous ancestries reported in Athol are German (113 | 14.3%), English (107 | 13.5%), Mexican (85 | 10.8%), Irish (77 | 9.8%), and Korean (65 | 8.2%), together accounting for 56.6% of all Athol residents.
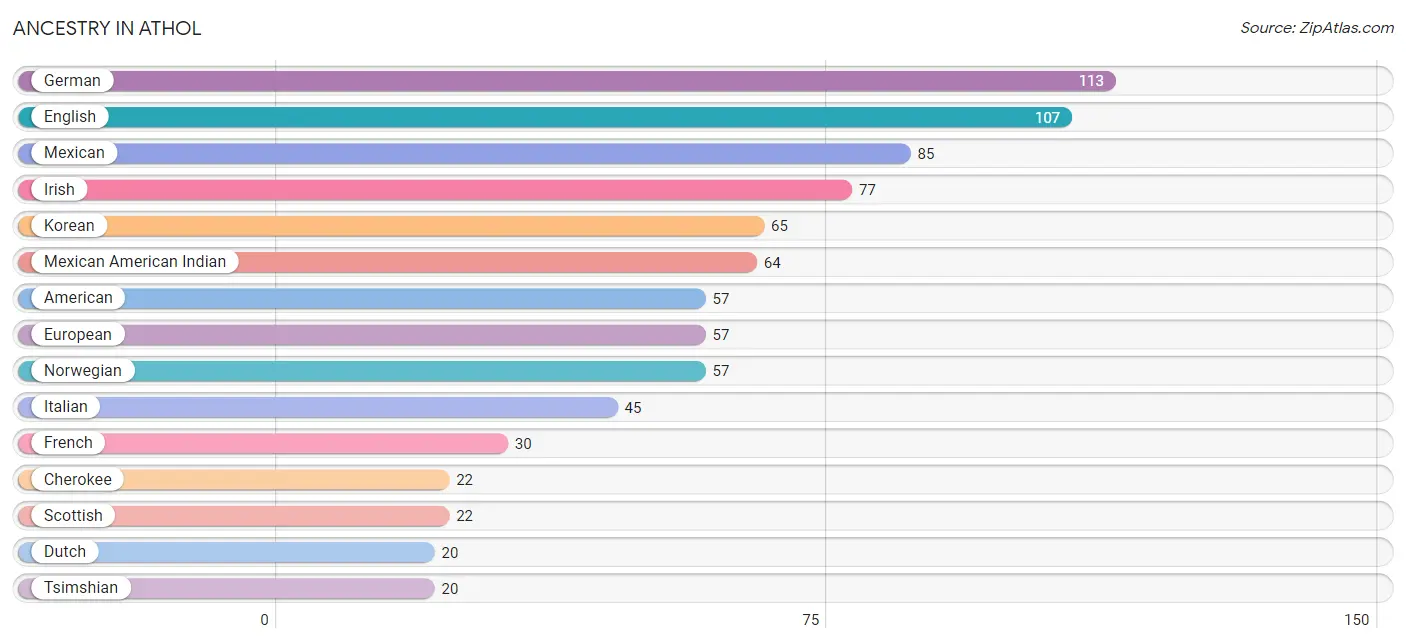
| Ancestry | # Population | % Population |
| American | 57 | 7.2% |
| Arab | 3 | 0.4% |
| Canadian | 2 | 0.3% |
| Cherokee | 22 | 2.8% |
| Comanche | 7 | 0.9% |
| Danish | 19 | 2.4% |
| Dutch | 20 | 2.5% |
| English | 107 | 13.5% |
| European | 57 | 7.2% |
| Finnish | 3 | 0.4% |
| French | 30 | 3.8% |
| German | 113 | 14.3% |
| Greek | 8 | 1.0% |
| Hungarian | 6 | 0.8% |
| Indian (Asian) | 1 | 0.1% |
| Irish | 77 | 9.8% |
| Italian | 45 | 5.7% |
| Korean | 65 | 8.2% |
| Latvian | 6 | 0.8% |
| Lithuanian | 2 | 0.3% |
| Mexican | 85 | 10.8% |
| Mexican American Indian | 64 | 8.1% |
| Native Hawaiian | 3 | 0.4% |
| Norwegian | 57 | 7.2% |
| Polish | 17 | 2.1% |
| Scandinavian | 8 | 1.0% |
| Scotch-Irish | 9 | 1.1% |
| Scottish | 22 | 2.8% |
| Swedish | 6 | 0.8% |
| Syrian | 3 | 0.4% |
| Tsimshian | 20 | 2.5% |
| Welsh | 13 | 1.7% | View All 32 Rows |
Immigrants in Athol
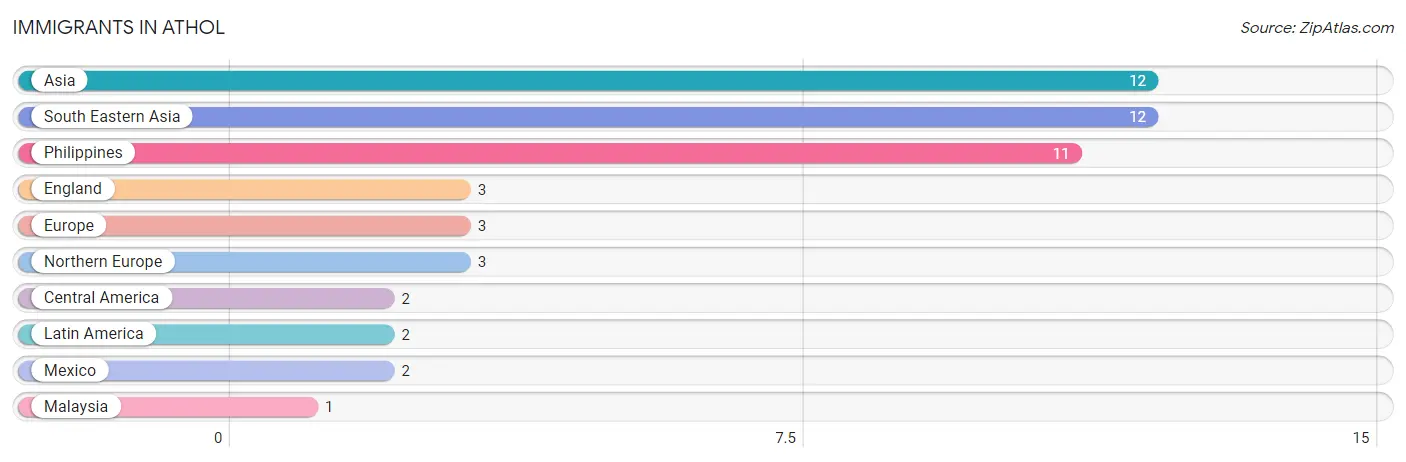
The most numerous immigrant groups reported in Athol came from Asia (12 | 1.5%), South Eastern Asia (12 | 1.5%), Philippines (11 | 1.4%), England (3 | 0.4%), and Europe (3 | 0.4%), together accounting for 5.2% of all Athol residents.
| Immigration Origin | # Population | % Population |
| Asia | 12 | 1.5% |
| Central America | 2 | 0.3% |
| England | 3 | 0.4% |
| Europe | 3 | 0.4% |
| Latin America | 2 | 0.3% |
| Malaysia | 1 | 0.1% |
| Mexico | 2 | 0.3% |
| Northern Europe | 3 | 0.4% |
| Philippines | 11 | 1.4% |
| South Eastern Asia | 12 | 1.5% | View All 10 Rows |
Sex and Age in Athol
Sex and Age in Athol
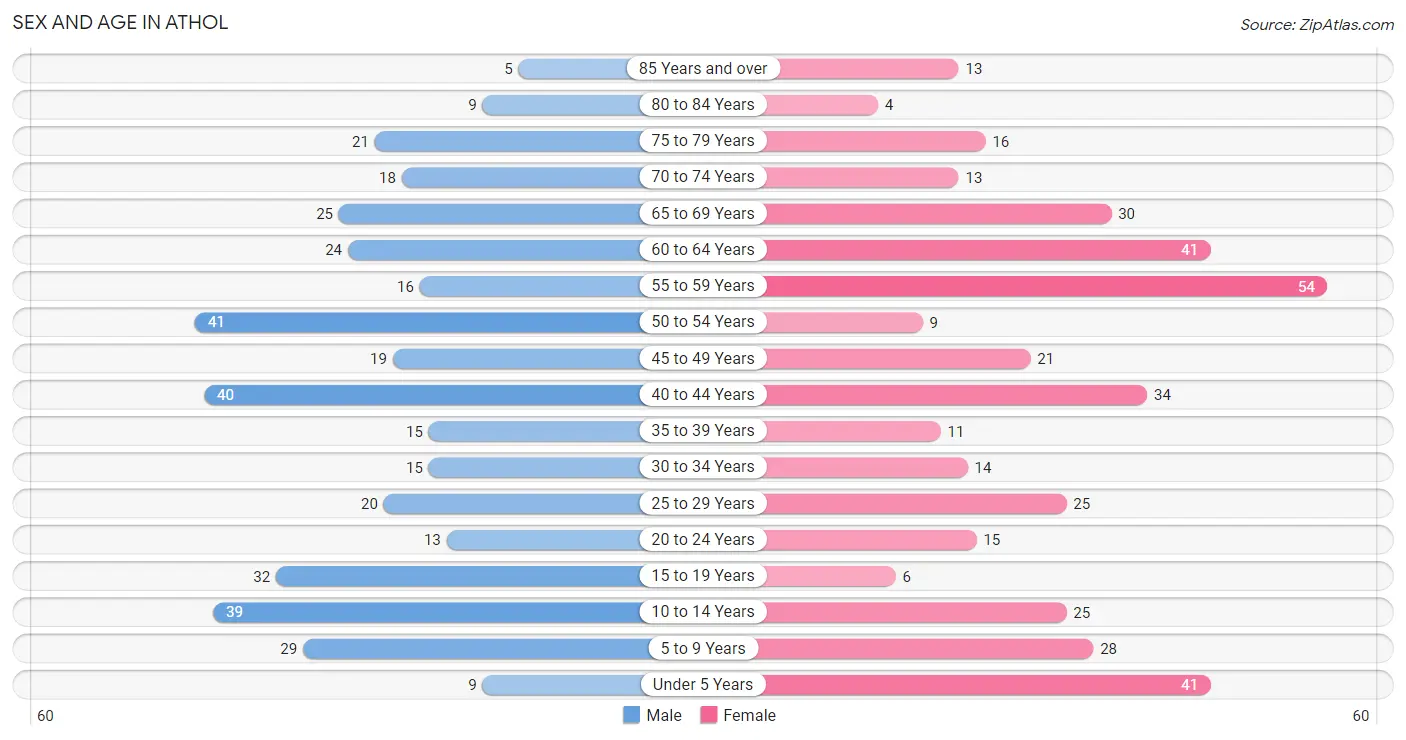
The most populous age groups in Athol are 50 to 54 Years (41 | 10.5%) for men and 55 to 59 Years (54 | 13.5%) for women.
| Age Bracket | Male | Female |
| Under 5 Years | 9 (2.3%) | 41 (10.2%) |
| 5 to 9 Years | 29 (7.4%) | 28 (7.0%) |
| 10 to 14 Years | 39 (10.0%) | 25 (6.2%) |
| 15 to 19 Years | 32 (8.2%) | 6 (1.5%) |
| 20 to 24 Years | 13 (3.3%) | 15 (3.7%) |
| 25 to 29 Years | 20 (5.1%) | 25 (6.2%) |
| 30 to 34 Years | 15 (3.8%) | 14 (3.5%) |
| 35 to 39 Years | 15 (3.8%) | 11 (2.8%) |
| 40 to 44 Years | 40 (10.3%) | 34 (8.5%) |
| 45 to 49 Years | 19 (4.9%) | 21 (5.2%) |
| 50 to 54 Years | 41 (10.5%) | 9 (2.2%) |
| 55 to 59 Years | 16 (4.1%) | 54 (13.5%) |
| 60 to 64 Years | 24 (6.1%) | 41 (10.2%) |
| 65 to 69 Years | 25 (6.4%) | 30 (7.5%) |
| 70 to 74 Years | 18 (4.6%) | 13 (3.3%) |
| 75 to 79 Years | 21 (5.4%) | 16 (4.0%) |
| 80 to 84 Years | 9 (2.3%) | 4 (1.0%) |
| 85 Years and over | 5 (1.3%) | 13 (3.3%) |
| Total | 390 (100.0%) | 400 (100.0%) |
Families and Households in Athol
Median Family Size in Athol
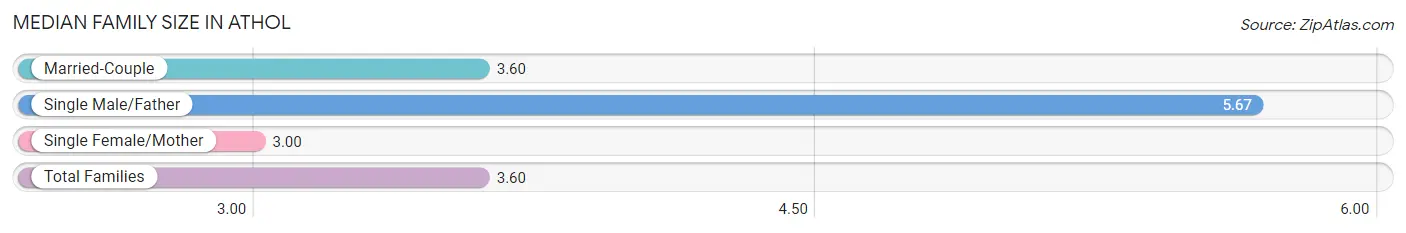
The median family size in Athol is 3.60 persons per family, with single male/father families (6 | 3.5%) accounting for the largest median family size of 5.67 persons per family. On the other hand, single female/mother families (19 | 10.9%) represent the smallest median family size with 3.00 persons per family.
| Family Type | # Families | Family Size |
| Married-Couple | 149 (85.6%) | 3.60 |
| Single Male/Father | 6 (3.5%) | 5.67 |
| Single Female/Mother | 19 (10.9%) | 3.00 |
| Total Families | 174 (100.0%) | 3.60 |
Median Household Size in Athol
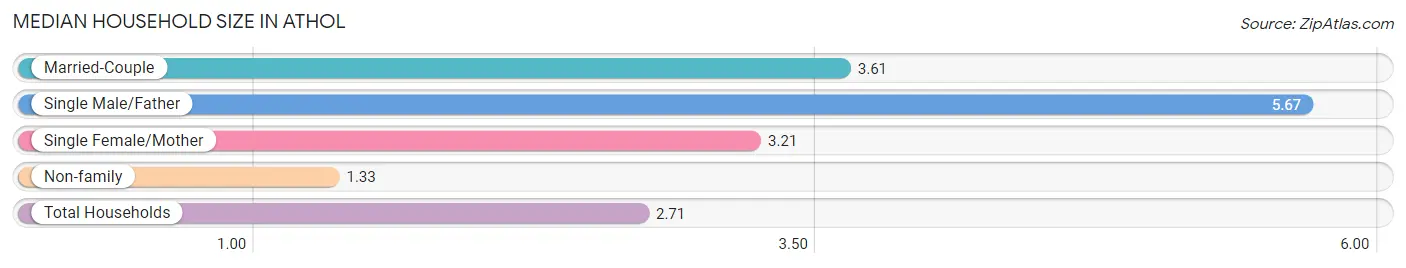
The median household size in Athol is 2.71 persons per household, with single male/father households (6 | 2.1%) accounting for the largest median household size of 5.67 persons per household. non-family households (118 | 40.4%) represent the smallest median household size with 1.33 persons per household.
| Household Type | # Households | Household Size |
| Married-Couple | 149 (51.0%) | 3.61 |
| Single Male/Father | 6 (2.1%) | 5.67 |
| Single Female/Mother | 19 (6.5%) | 3.21 |
| Non-family | 118 (40.4%) | 1.33 |
| Total Households | 292 (100.0%) | 2.71 |
Household Size by Marriage Status in Athol
Out of a total of 292 households in Athol, 174 (59.6%) are family households, while 118 (40.4%) are nonfamily households. The most numerous type of family households are 2-person households, comprising 75, and the most common type of nonfamily households are 1-person households, comprising 85.
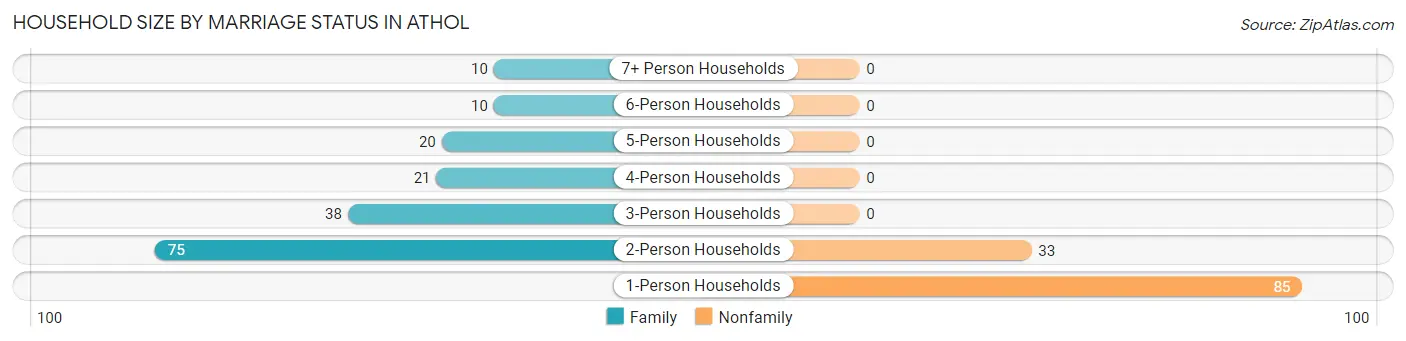
| Household Size | Family Households | Nonfamily Households |
| 1-Person Households | - | 85 (29.1%) |
| 2-Person Households | 75 (25.7%) | 33 (11.3%) |
| 3-Person Households | 38 (13.0%) | 0 (0.0%) |
| 4-Person Households | 21 (7.2%) | 0 (0.0%) |
| 5-Person Households | 20 (6.9%) | 0 (0.0%) |
| 6-Person Households | 10 (3.4%) | 0 (0.0%) |
| 7+ Person Households | 10 (3.4%) | 0 (0.0%) |
| Total | 174 (59.6%) | 118 (40.4%) |
Female Fertility in Athol
Fertility by Age in Athol
Average fertility rate in Athol is 24.0 births per 1,000 women. Women in the age bracket of 35 to 50 years have the highest fertility rate with 45.0 births per 1,000 women. Women in the age bracket of 35 to 50 years acount for 100.0% of all women with births.
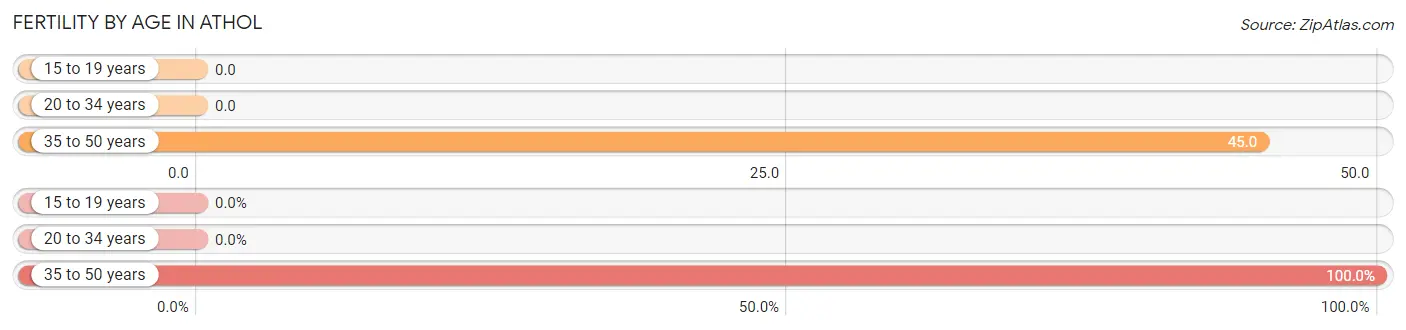
| Age Bracket | Women with Births | Births / 1,000 Women |
| 15 to 19 years | 0 (0.0%) | 0.0 |
| 20 to 34 years | 0 (0.0%) | 0.0 |
| 35 to 50 years | 3 (100.0%) | 45.0 |
| Total | 3 (100.0%) | 24.0 |
Fertility by Age by Marriage Status in Athol
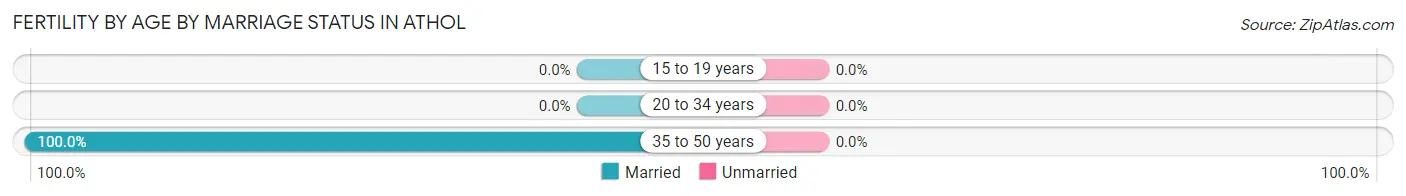
| Age Bracket | Married | Unmarried |
| 15 to 19 years | 0 (0.0%) | 0 (0.0%) |
| 20 to 34 years | 0 (0.0%) | 0 (0.0%) |
| 35 to 50 years | 3 (100.0%) | 0 (0.0%) |
| Total | 3 (100.0%) | 0 (0.0%) |
Fertility by Education in Athol
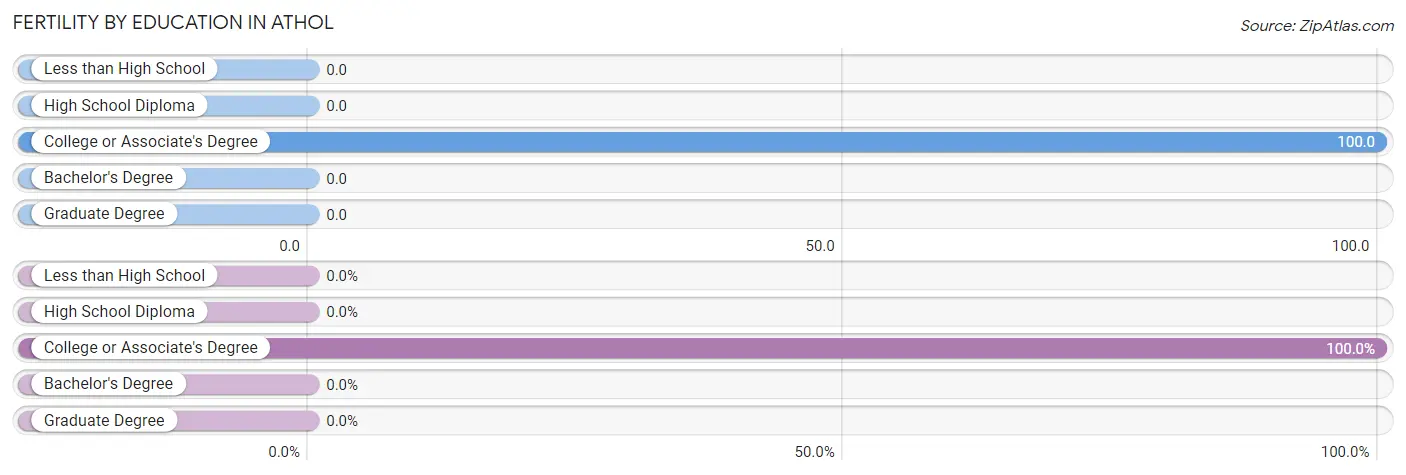
| Educational Attainment | Women with Births | Births / 1,000 Women |
| Less than High School | 0 (0.0%) | 0.0 |
| High School Diploma | 0 (0.0%) | 0.0 |
| College or Associate's Degree | 3 (100.0%) | 100.0 |
| Bachelor's Degree | 0 (0.0%) | 0.0 |
| Graduate Degree | 0 (0.0%) | 0.0 |
| Total | 3 (100.0%) | 24.0 |
Fertility by Education by Marriage Status in Athol
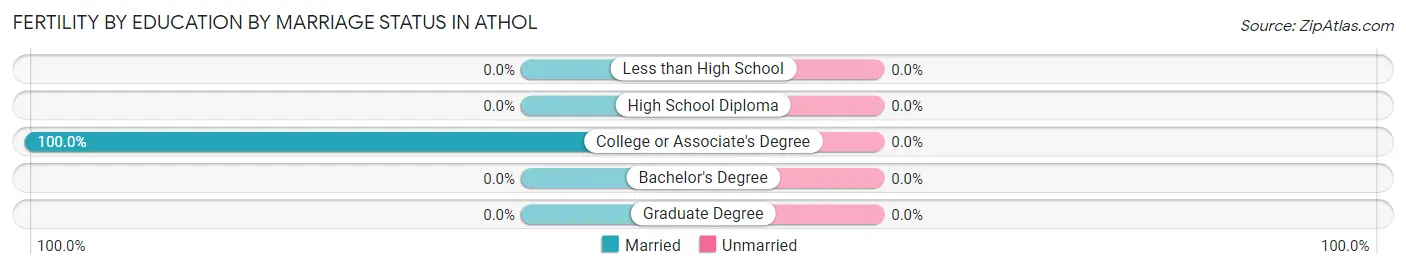
| Educational Attainment | Married | Unmarried |
| Less than High School | 0 (0.0%) | 0 (0.0%) |
| High School Diploma | 0 (0.0%) | 0 (0.0%) |
| College or Associate's Degree | 3 (100.0%) | 0 (0.0%) |
| Bachelor's Degree | 0 (0.0%) | 0 (0.0%) |
| Graduate Degree | 0 (0.0%) | 0 (0.0%) |
| Total | 3 (100.0%) | 0 (0.0%) |
Employment Characteristics in Athol
Employment by Class of Employer in Athol
Among the 293 employed individuals in Athol, private company employees (216 | 73.7%), local government employees (24 | 8.2%), and self-employed (not incorporated) (14 | 4.8%) make up the most common classes of employment.
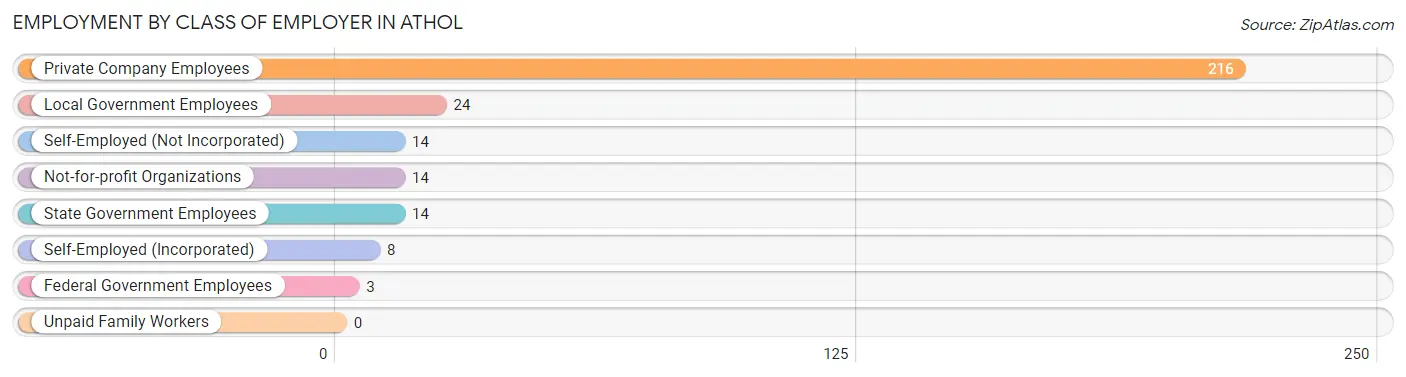
| Employer Class | # Employees | % Employees |
| Private Company Employees | 216 | 73.7% |
| Self-Employed (Incorporated) | 8 | 2.7% |
| Self-Employed (Not Incorporated) | 14 | 4.8% |
| Not-for-profit Organizations | 14 | 4.8% |
| Local Government Employees | 24 | 8.2% |
| State Government Employees | 14 | 4.8% |
| Federal Government Employees | 3 | 1.0% |
| Unpaid Family Workers | 0 | 0.0% |
| Total | 293 | 100.0% |
Employment Status by Age in Athol
According to the labor force statistics for Athol, out of the total population over 16 years of age (602), 50.5% or 304 individuals are in the labor force, with 0.7% or 2 of them unemployed. The age group with the highest labor force participation rate is 35 to 44 years, with 92.0% or 92 individuals in the labor force. Within the labor force, the 30 to 34 years age range has the highest percentage of unemployed individuals, with 9.5% or 2 of them being unemployed.
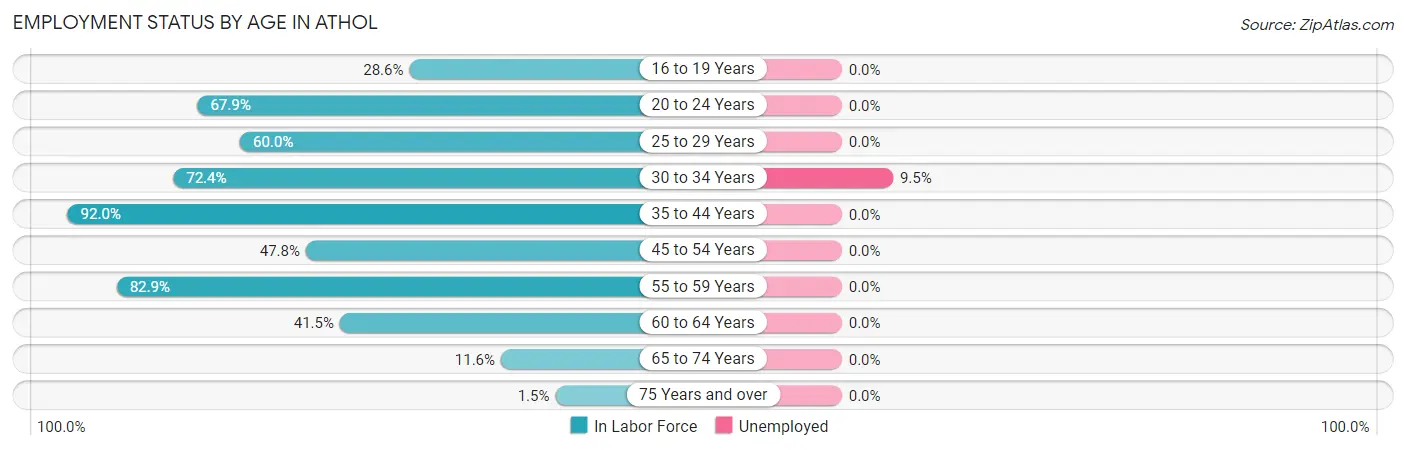
| Age Bracket | In Labor Force | Unemployed |
| 16 to 19 Years | 6 (28.6%) | 0 (0.0%) |
| 20 to 24 Years | 19 (67.9%) | 0 (0.0%) |
| 25 to 29 Years | 27 (60.0%) | 0 (0.0%) |
| 30 to 34 Years | 21 (72.4%) | 2 (9.5%) |
| 35 to 44 Years | 92 (92.0%) | 0 (0.0%) |
| 45 to 54 Years | 43 (47.8%) | 0 (0.0%) |
| 55 to 59 Years | 58 (82.9%) | 0 (0.0%) |
| 60 to 64 Years | 27 (41.5%) | 0 (0.0%) |
| 65 to 74 Years | 10 (11.6%) | 0 (0.0%) |
| 75 Years and over | 1 (1.5%) | 0 (0.0%) |
| Total | 304 (50.5%) | 2 (0.7%) |
Employment Status by Educational Attainment in Athol
According to labor force statistics for Athol, 67.2% of individuals (268) out of the total population between 25 and 64 years of age (399) are in the labor force, with 0.7% or 2 of them being unemployed. The group with the highest labor force participation rate are those with the educational attainment of bachelor's degree or higher, with 96.7% or 58 individuals in the labor force. Within the labor force, individuals with college / associate degree education have the highest percentage of unemployment, with 2.5% or 2 of them being unemployed.
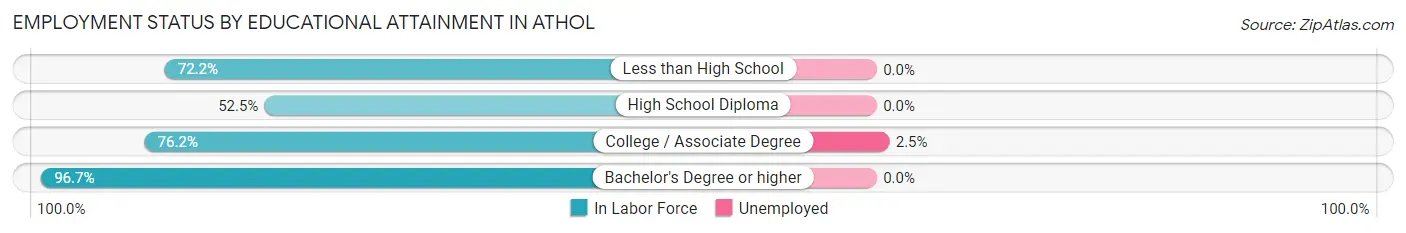
| Educational Attainment | In Labor Force | Unemployed |
| Less than High School | 26 (72.2%) | 0 (0.0%) |
| High School Diploma | 104 (52.5%) | 0 (0.0%) |
| College / Associate Degree | 80 (76.2%) | 3 (2.5%) |
| Bachelor's Degree or higher | 58 (96.7%) | 0 (0.0%) |
| Total | 268 (67.2%) | 3 (0.7%) |
Employment Occupations by Sex in Athol
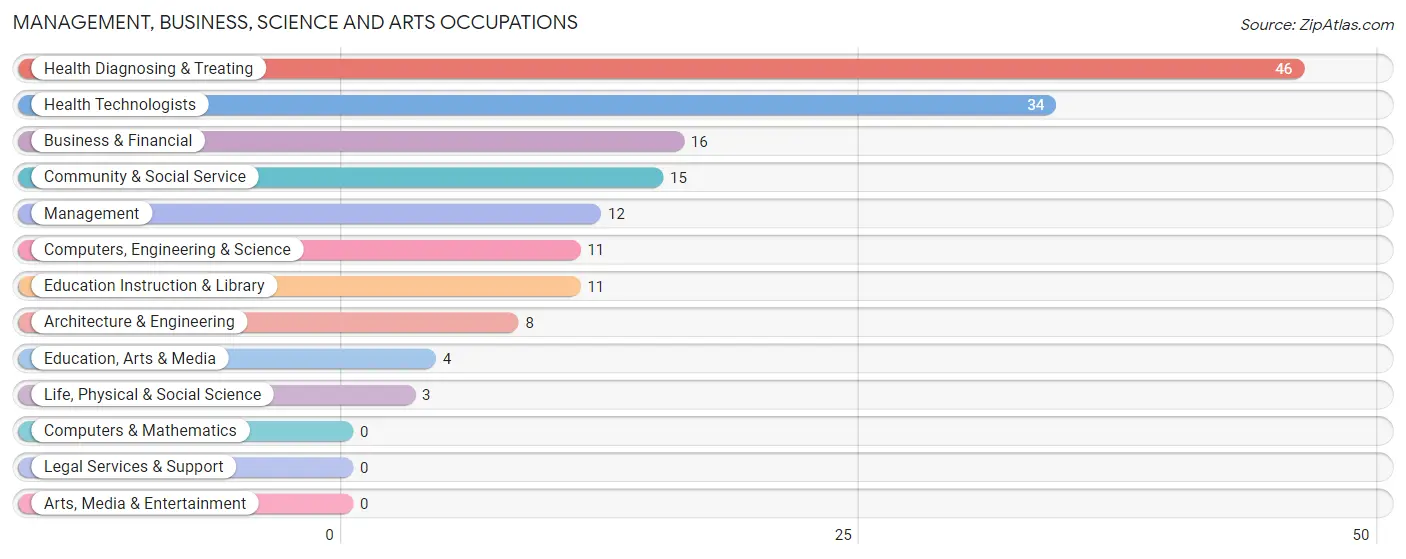
Management, Business, Science and Arts Occupations
The most common Management, Business, Science and Arts occupations in Athol are Health Diagnosing & Treating (46 | 15.2%), Health Technologists (34 | 11.3%), Business & Financial (16 | 5.3%), Community & Social Service (15 | 5.0%), and Management (12 | 4.0%).
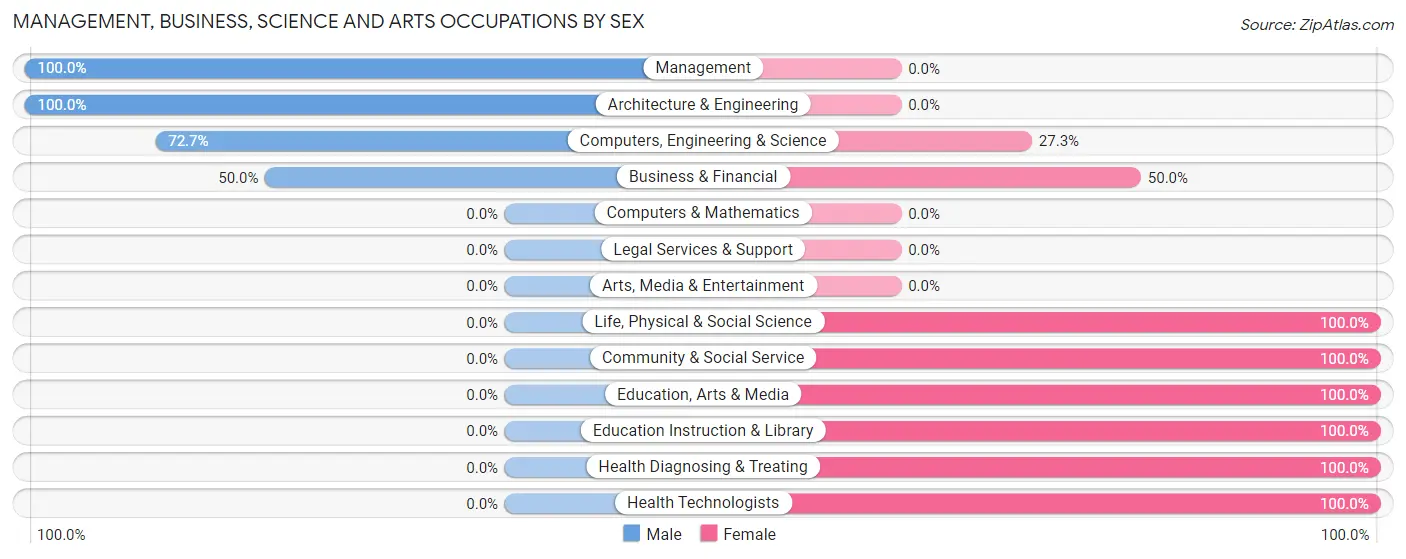
Management, Business, Science and Arts Occupations by Sex
Within the Management, Business, Science and Arts occupations in Athol, the most male-oriented occupations are Management (100.0%), Architecture & Engineering (100.0%), and Computers, Engineering & Science (72.7%), while the most female-oriented occupations are Life, Physical & Social Science (100.0%), Community & Social Service (100.0%), and Education, Arts & Media (100.0%).
| Occupation | Male | Female |
| Management | 12 (100.0%) | 0 (0.0%) |
| Business & Financial | 8 (50.0%) | 8 (50.0%) |
| Computers, Engineering & Science | 8 (72.7%) | 3 (27.3%) |
| Computers & Mathematics | 0 (0.0%) | 0 (0.0%) |
| Architecture & Engineering | 8 (100.0%) | 0 (0.0%) |
| Life, Physical & Social Science | 0 (0.0%) | 3 (100.0%) |
| Community & Social Service | 0 (0.0%) | 15 (100.0%) |
| Education, Arts & Media | 0 (0.0%) | 4 (100.0%) |
| Legal Services & Support | 0 (0.0%) | 0 (0.0%) |
| Education Instruction & Library | 0 (0.0%) | 11 (100.0%) |
| Arts, Media & Entertainment | 0 (0.0%) | 0 (0.0%) |
| Health Diagnosing & Treating | 0 (0.0%) | 46 (100.0%) |
| Health Technologists | 0 (0.0%) | 34 (100.0%) |
| Total (Category) | 28 (28.0%) | 72 (72.0%) |
| Total (Overall) | 144 (47.7%) | 158 (52.3%) |
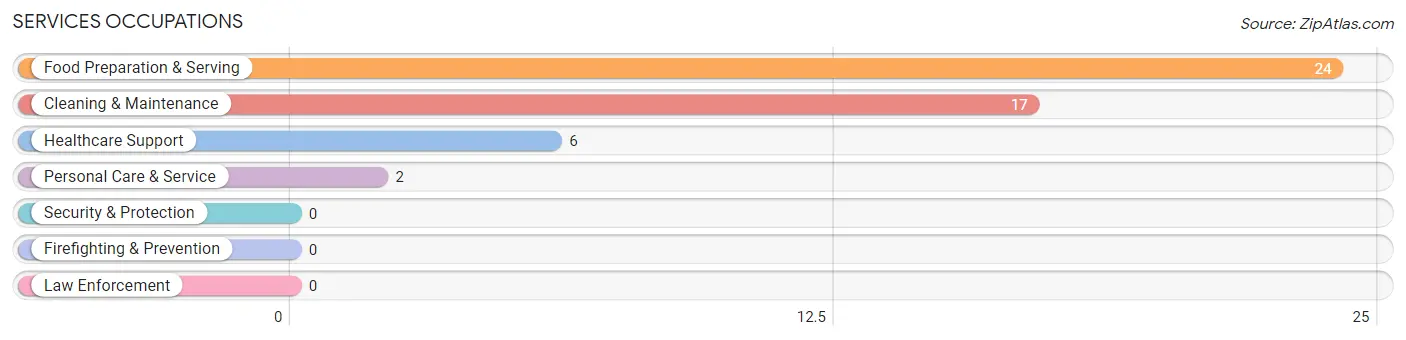
Services Occupations
The most common Services occupations in Athol are Food Preparation & Serving (24 | 8.0%), Cleaning & Maintenance (17 | 5.6%), Healthcare Support (6 | 2.0%), and Personal Care & Service (2 | 0.7%).
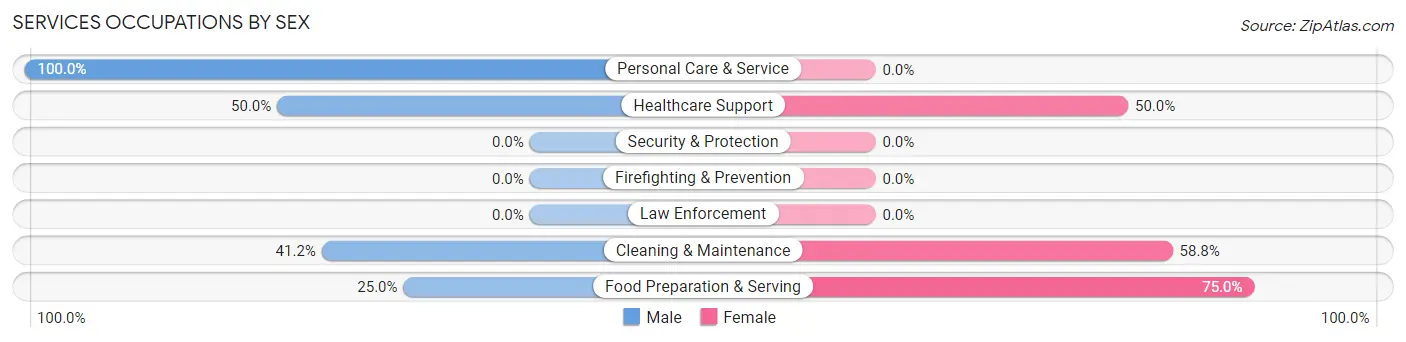
Services Occupations by Sex
Within the Services occupations in Athol, the most male-oriented occupations are Personal Care & Service (100.0%), Healthcare Support (50.0%), and Cleaning & Maintenance (41.2%), while the most female-oriented occupations are Food Preparation & Serving (75.0%), Cleaning & Maintenance (58.8%), and Healthcare Support (50.0%).
| Occupation | Male | Female |
| Healthcare Support | 3 (50.0%) | 3 (50.0%) |
| Security & Protection | 0 (0.0%) | 0 (0.0%) |
| Firefighting & Prevention | 0 (0.0%) | 0 (0.0%) |
| Law Enforcement | 0 (0.0%) | 0 (0.0%) |
| Food Preparation & Serving | 6 (25.0%) | 18 (75.0%) |
| Cleaning & Maintenance | 7 (41.2%) | 10 (58.8%) |
| Personal Care & Service | 2 (100.0%) | 0 (0.0%) |
| Total (Category) | 18 (36.7%) | 31 (63.3%) |
| Total (Overall) | 144 (47.7%) | 158 (52.3%) |
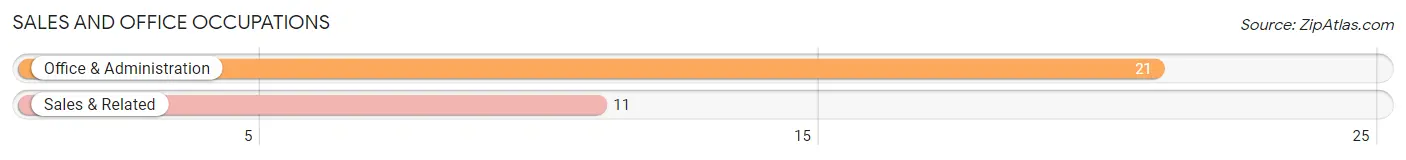
Sales and Office Occupations
The most common Sales and Office occupations in Athol are Office & Administration (21 | 7.0%), and Sales & Related (11 | 3.6%).
Sales and Office Occupations by Sex
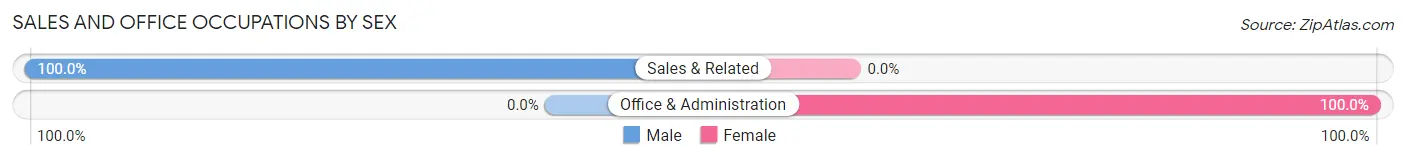
| Occupation | Male | Female |
| Sales & Related | 11 (100.0%) | 0 (0.0%) |
| Office & Administration | 0 (0.0%) | 21 (100.0%) |
| Total (Category) | 11 (34.4%) | 21 (65.6%) |
| Total (Overall) | 144 (47.7%) | 158 (52.3%) |
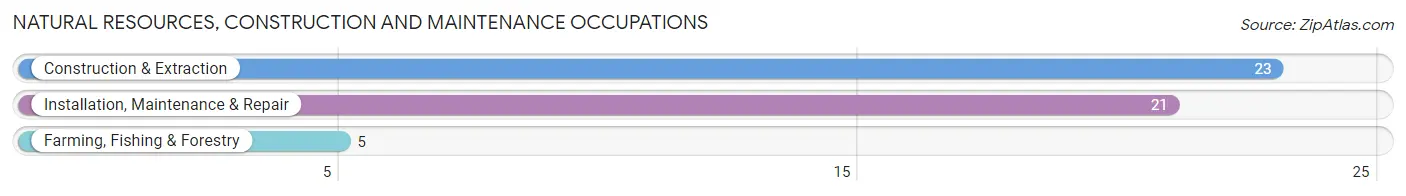
Natural Resources, Construction and Maintenance Occupations
The most common Natural Resources, Construction and Maintenance occupations in Athol are Construction & Extraction (23 | 7.6%), Installation, Maintenance & Repair (21 | 7.0%), and Farming, Fishing & Forestry (5 | 1.7%).
Natural Resources, Construction and Maintenance Occupations by Sex
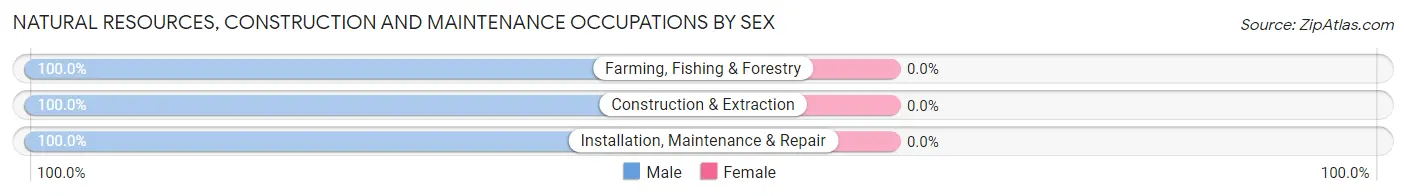
| Occupation | Male | Female |
| Farming, Fishing & Forestry | 5 (100.0%) | 0 (0.0%) |
| Construction & Extraction | 23 (100.0%) | 0 (0.0%) |
| Installation, Maintenance & Repair | 21 (100.0%) | 0 (0.0%) |
| Total (Category) | 49 (100.0%) | 0 (0.0%) |
| Total (Overall) | 144 (47.7%) | 158 (52.3%) |
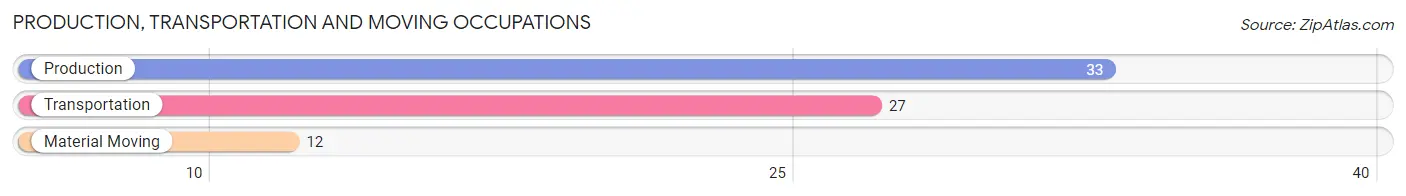
Production, Transportation and Moving Occupations
The most common Production, Transportation and Moving occupations in Athol are Production (33 | 10.9%), Transportation (27 | 8.9%), and Material Moving (12 | 4.0%).
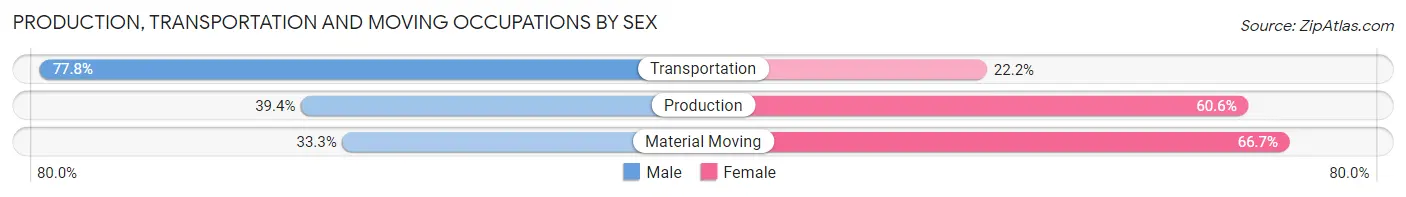
Production, Transportation and Moving Occupations by Sex
| Occupation | Male | Female |
| Production | 13 (39.4%) | 20 (60.6%) |
| Transportation | 21 (77.8%) | 6 (22.2%) |
| Material Moving | 4 (33.3%) | 8 (66.7%) |
| Total (Category) | 38 (52.8%) | 34 (47.2%) |
| Total (Overall) | 144 (47.7%) | 158 (52.3%) |
Employment Industries by Sex in Athol
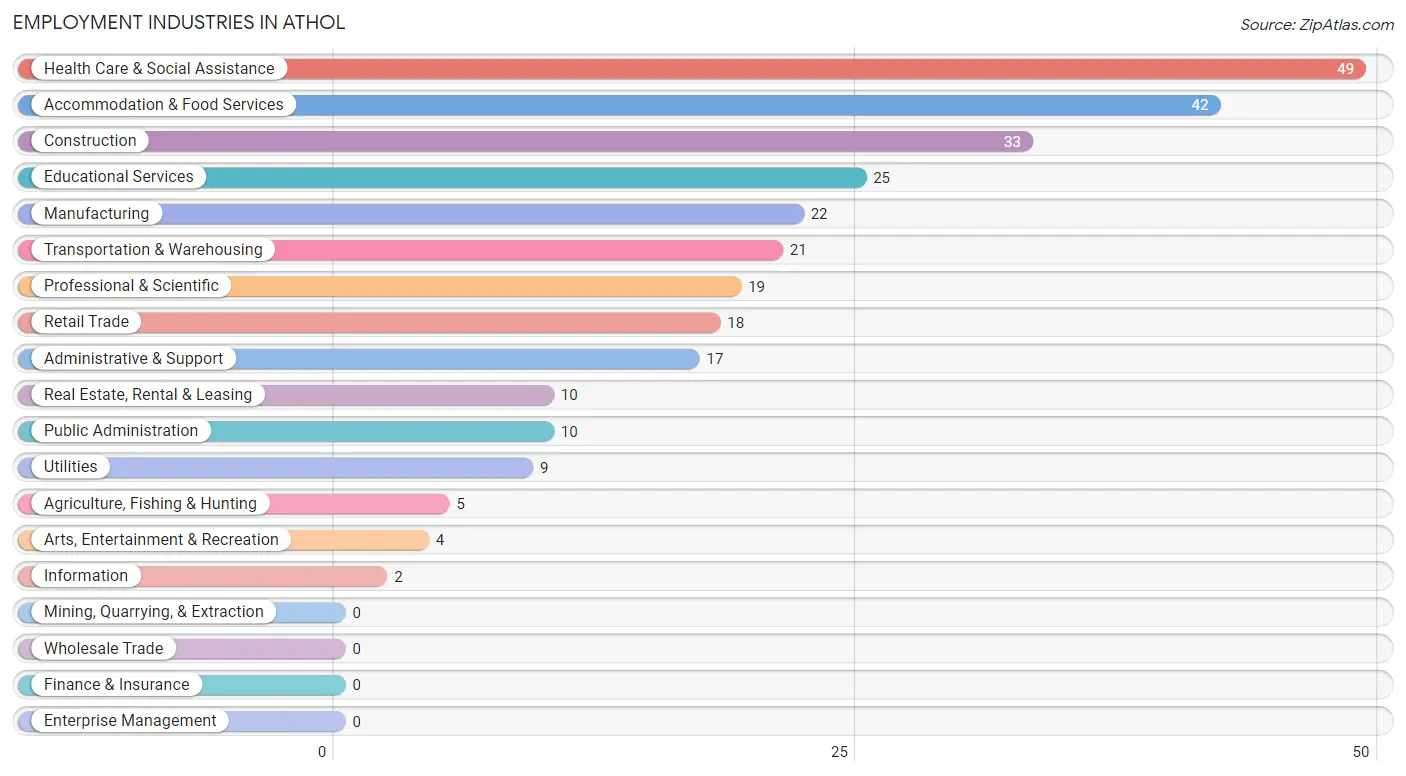
Employment Industries in Athol
The major employment industries in Athol include Health Care & Social Assistance (49 | 16.2%), Accommodation & Food Services (42 | 13.9%), Construction (33 | 10.9%), Educational Services (25 | 8.3%), and Manufacturing (22 | 7.3%).
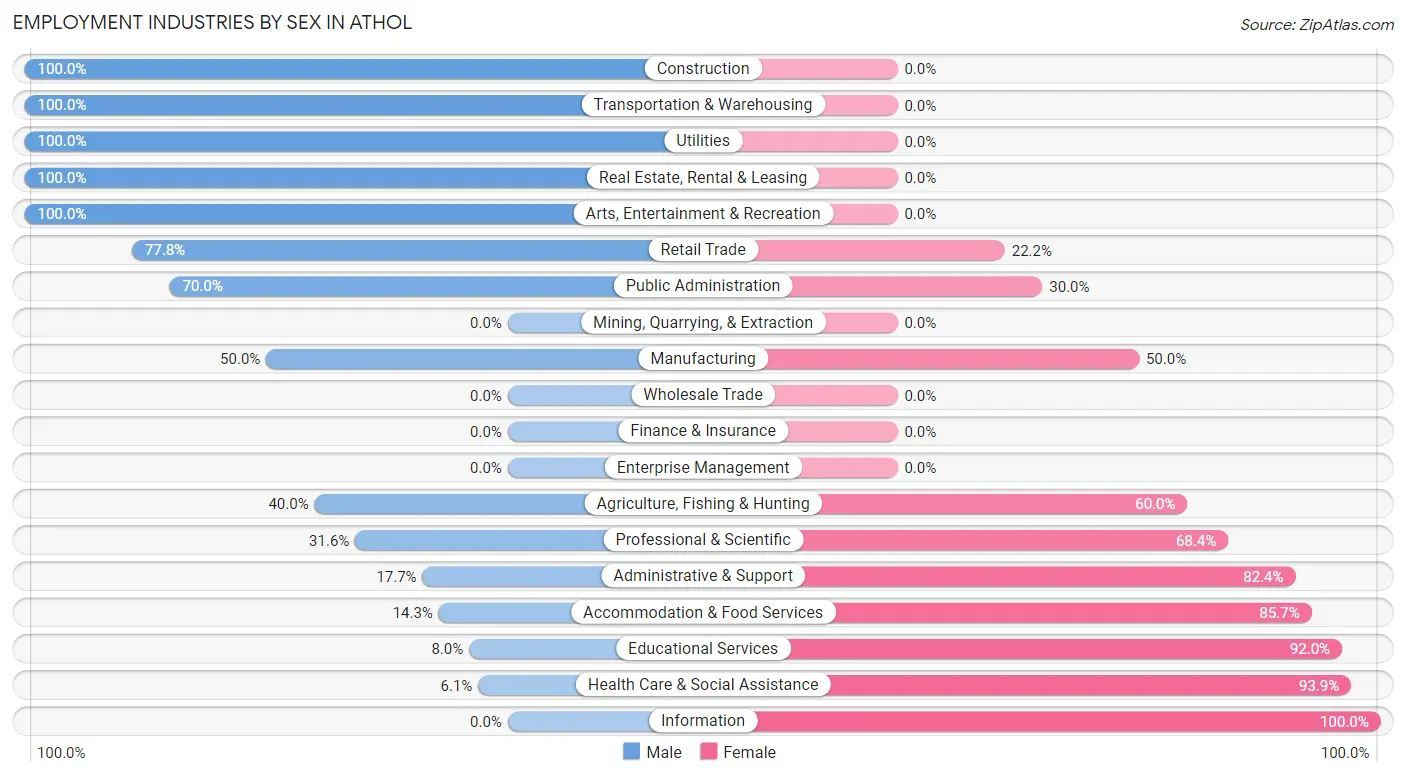
Employment Industries by Sex in Athol
The Athol industries that see more men than women are Construction (100.0%), Transportation & Warehousing (100.0%), and Utilities (100.0%), whereas the industries that tend to have a higher number of women are Information (100.0%), Health Care & Social Assistance (93.9%), and Educational Services (92.0%).
| Industry | Male | Female |
| Agriculture, Fishing & Hunting | 2 (40.0%) | 3 (60.0%) |
| Mining, Quarrying, & Extraction | 0 (0.0%) | 0 (0.0%) |
| Construction | 33 (100.0%) | 0 (0.0%) |
| Manufacturing | 11 (50.0%) | 11 (50.0%) |
| Wholesale Trade | 0 (0.0%) | 0 (0.0%) |
| Retail Trade | 14 (77.8%) | 4 (22.2%) |
| Transportation & Warehousing | 21 (100.0%) | 0 (0.0%) |
| Utilities | 9 (100.0%) | 0 (0.0%) |
| Information | 0 (0.0%) | 2 (100.0%) |
| Finance & Insurance | 0 (0.0%) | 0 (0.0%) |
| Real Estate, Rental & Leasing | 10 (100.0%) | 0 (0.0%) |
| Professional & Scientific | 6 (31.6%) | 13 (68.4%) |
| Enterprise Management | 0 (0.0%) | 0 (0.0%) |
| Administrative & Support | 3 (17.6%) | 14 (82.4%) |
| Educational Services | 2 (8.0%) | 23 (92.0%) |
| Health Care & Social Assistance | 3 (6.1%) | 46 (93.9%) |
| Arts, Entertainment & Recreation | 4 (100.0%) | 0 (0.0%) |
| Accommodation & Food Services | 6 (14.3%) | 36 (85.7%) |
| Public Administration | 7 (70.0%) | 3 (30.0%) |
| Total | 144 (47.7%) | 158 (52.3%) |
Education in Athol
School Enrollment in Athol
The most common levels of schooling among the 184 students in Athol are middle school (55 | 29.9%), elementary school (43 | 23.4%), and high school (42 | 22.8%).
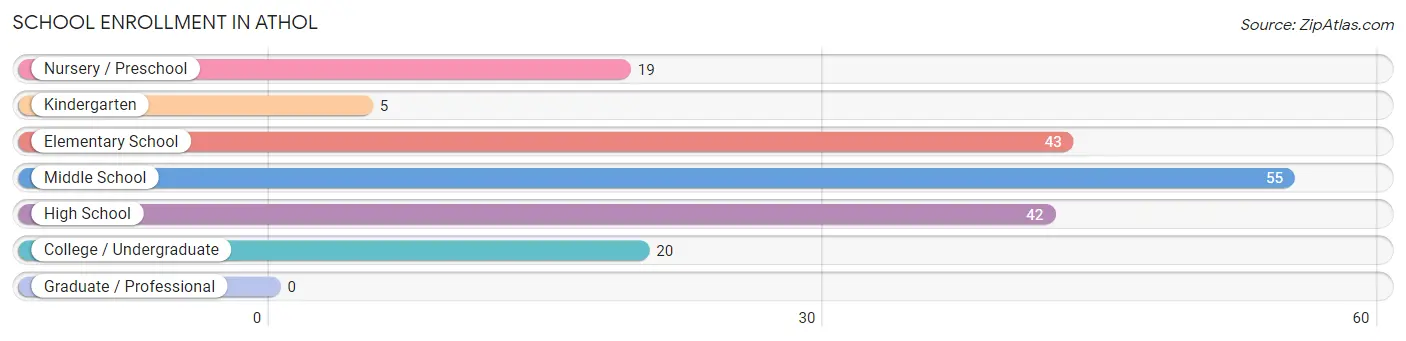
| School Level | # Students | % Students |
| Nursery / Preschool | 19 | 10.3% |
| Kindergarten | 5 | 2.7% |
| Elementary School | 43 | 23.4% |
| Middle School | 55 | 29.9% |
| High School | 42 | 22.8% |
| College / Undergraduate | 20 | 10.9% |
| Graduate / Professional | 0 | 0.0% |
| Total | 184 | 100.0% |
School Enrollment by Age by Funding Source in Athol
Out of a total of 184 students who are enrolled in schools in Athol, 62 (33.7%) attend a private institution, while the remaining 122 (66.3%) are enrolled in public schools. The age group of 5 to 9 year old has the highest likelihood of being enrolled in private schools, with 24 (43.6% in the age bracket) enrolled. Conversely, the age group of 3 to 4 year olds has the lowest likelihood of being enrolled in a private school, with 11 (100.0% in the age bracket) attending a public institution.
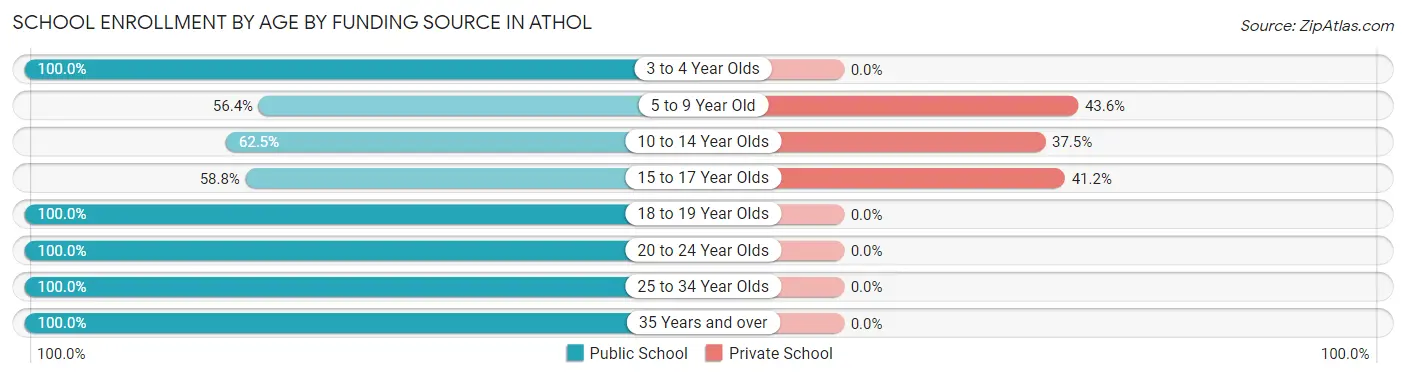
| Age Bracket | Public School | Private School |
| 3 to 4 Year Olds | 11 (100.0%) | 0 (0.0%) |
| 5 to 9 Year Old | 31 (56.4%) | 24 (43.6%) |
| 10 to 14 Year Olds | 40 (62.5%) | 24 (37.5%) |
| 15 to 17 Year Olds | 20 (58.8%) | 14 (41.2%) |
| 18 to 19 Year Olds | 2 (100.0%) | 0 (0.0%) |
| 20 to 24 Year Olds | 4 (100.0%) | 0 (0.0%) |
| 25 to 34 Year Olds | 3 (100.0%) | 0 (0.0%) |
| 35 Years and over | 11 (100.0%) | 0 (0.0%) |
| Total | 122 (66.3%) | 62 (33.7%) |
Educational Attainment by Field of Study in Athol
Science & technology (24 | 35.3%), bio, nature & agricultural (22 | 32.4%), physical & health sciences (6 | 8.8%), business (4 | 5.9%), and liberal arts & history (4 | 5.9%) are the most common fields of study among 68 individuals in Athol who have obtained a bachelor's degree or higher.
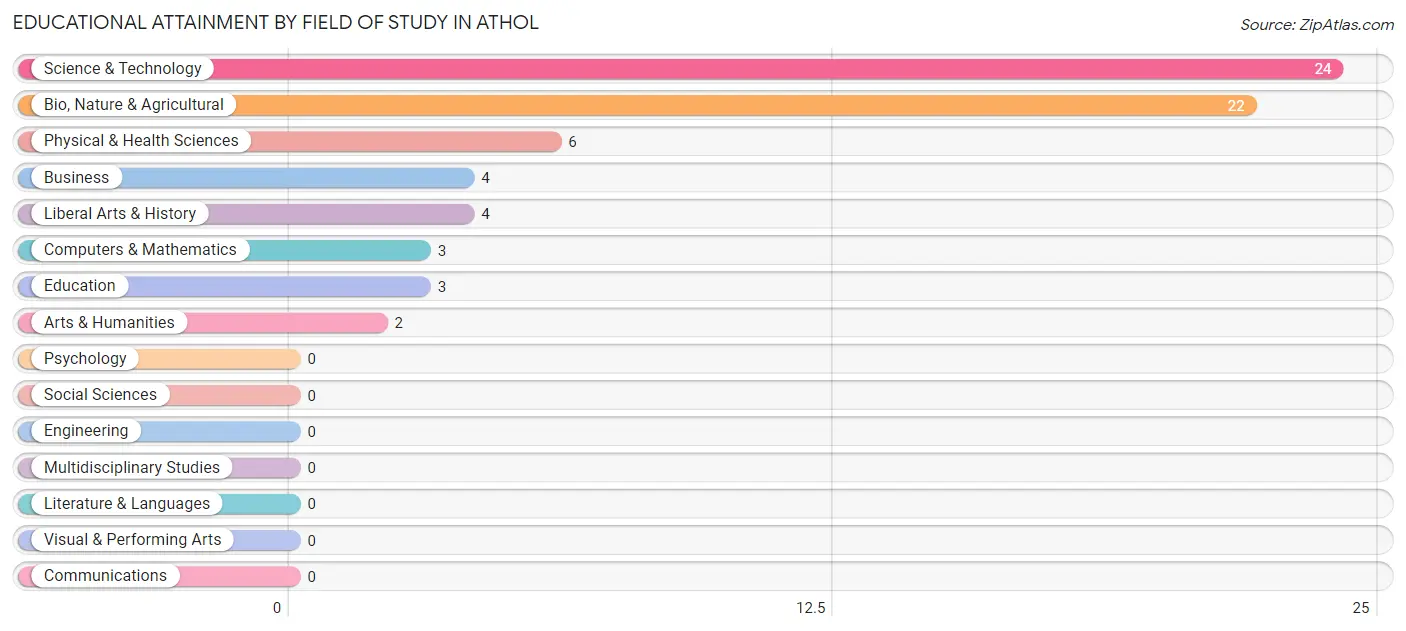
| Field of Study | # Graduates | % Graduates |
| Computers & Mathematics | 3 | 4.4% |
| Bio, Nature & Agricultural | 22 | 32.4% |
| Physical & Health Sciences | 6 | 8.8% |
| Psychology | 0 | 0.0% |
| Social Sciences | 0 | 0.0% |
| Engineering | 0 | 0.0% |
| Multidisciplinary Studies | 0 | 0.0% |
| Science & Technology | 24 | 35.3% |
| Business | 4 | 5.9% |
| Education | 3 | 4.4% |
| Literature & Languages | 0 | 0.0% |
| Liberal Arts & History | 4 | 5.9% |
| Visual & Performing Arts | 0 | 0.0% |
| Communications | 0 | 0.0% |
| Arts & Humanities | 2 | 2.9% |
| Total | 68 | 100.0% |
Transportation & Commute in Athol
Vehicle Availability by Sex in Athol
The most prevalent vehicle ownership categories in Athol are males with 2 vehicles (52, accounting for 36.9%) and females with 2 vehicles (47, making up 34.2%).
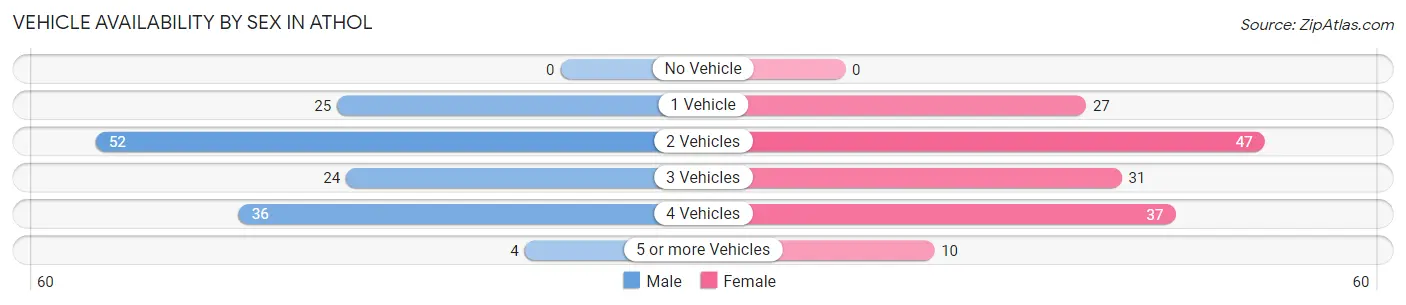
| Vehicles Available | Male | Female |
| No Vehicle | 0 (0.0%) | 0 (0.0%) |
| 1 Vehicle | 25 (17.7%) | 27 (17.8%) |
| 2 Vehicles | 52 (36.9%) | 47 (30.9%) |
| 3 Vehicles | 24 (17.0%) | 31 (20.4%) |
| 4 Vehicles | 36 (25.5%) | 37 (24.3%) |
| 5 or more Vehicles | 4 (2.8%) | 10 (6.6%) |
| Total | 141 (100.0%) | 152 (100.0%) |
Commute Time in Athol
The most frequently occuring commute durations in Athol are 30 to 34 minutes (74 commuters, 25.5%), 25 to 29 minutes (37 commuters, 12.8%), and 15 to 19 minutes (30 commuters, 10.3%).
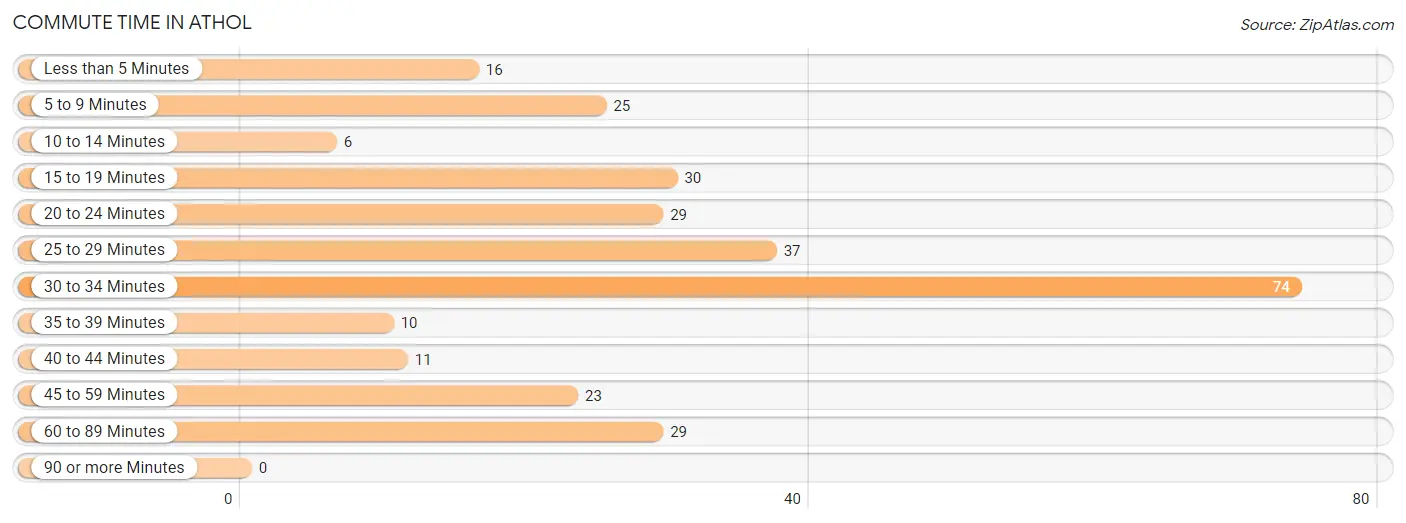
| Commute Time | # Commuters | % Commuters |
| Less than 5 Minutes | 16 | 5.5% |
| 5 to 9 Minutes | 25 | 8.6% |
| 10 to 14 Minutes | 6 | 2.1% |
| 15 to 19 Minutes | 30 | 10.3% |
| 20 to 24 Minutes | 29 | 10.0% |
| 25 to 29 Minutes | 37 | 12.8% |
| 30 to 34 Minutes | 74 | 25.5% |
| 35 to 39 Minutes | 10 | 3.5% |
| 40 to 44 Minutes | 11 | 3.8% |
| 45 to 59 Minutes | 23 | 7.9% |
| 60 to 89 Minutes | 29 | 10.0% |
| 90 or more Minutes | 0 | 0.0% |
Commute Time by Sex in Athol
The most common commute times in Athol are 30 to 34 minutes (32 commuters, 22.7%) for males and 30 to 34 minutes (42 commuters, 28.2%) for females.
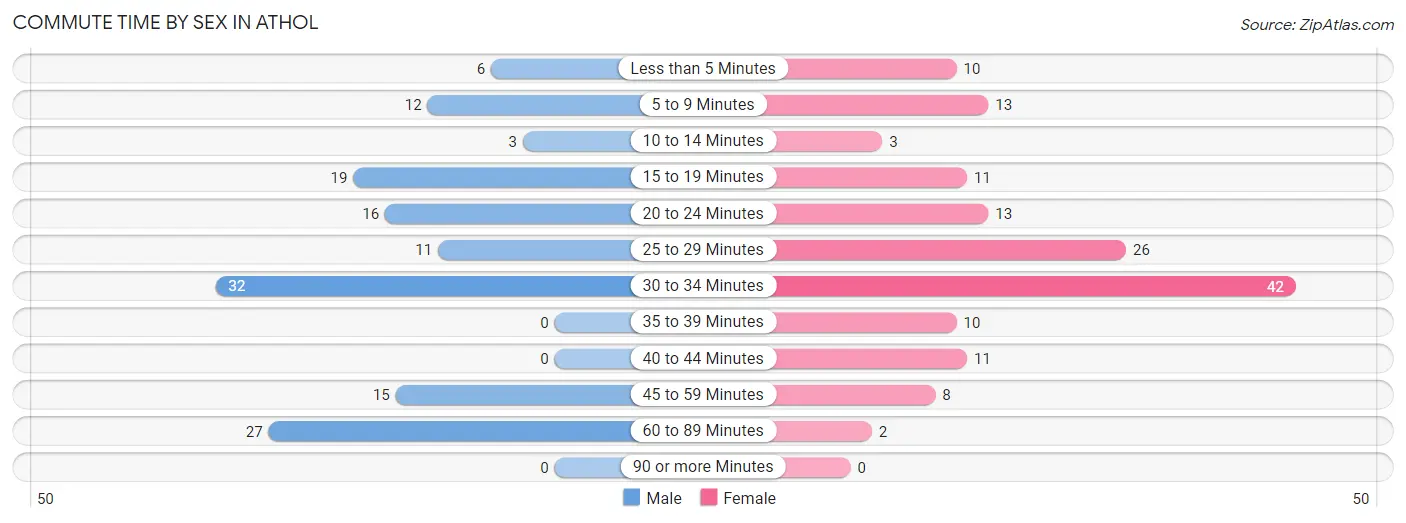
| Commute Time | Male | Female |
| Less than 5 Minutes | 6 (4.3%) | 10 (6.7%) |
| 5 to 9 Minutes | 12 (8.5%) | 13 (8.7%) |
| 10 to 14 Minutes | 3 (2.1%) | 3 (2.0%) |
| 15 to 19 Minutes | 19 (13.5%) | 11 (7.4%) |
| 20 to 24 Minutes | 16 (11.4%) | 13 (8.7%) |
| 25 to 29 Minutes | 11 (7.8%) | 26 (17.4%) |
| 30 to 34 Minutes | 32 (22.7%) | 42 (28.2%) |
| 35 to 39 Minutes | 0 (0.0%) | 10 (6.7%) |
| 40 to 44 Minutes | 0 (0.0%) | 11 (7.4%) |
| 45 to 59 Minutes | 15 (10.6%) | 8 (5.4%) |
| 60 to 89 Minutes | 27 (19.2%) | 2 (1.3%) |
| 90 or more Minutes | 0 (0.0%) | 0 (0.0%) |
Time of Departure to Work by Sex in Athol
The most frequent times of departure to work in Athol are 5:30 AM to 5:59 AM (35, 24.8%) for males and 5:30 AM to 5:59 AM (30, 20.1%) for females.
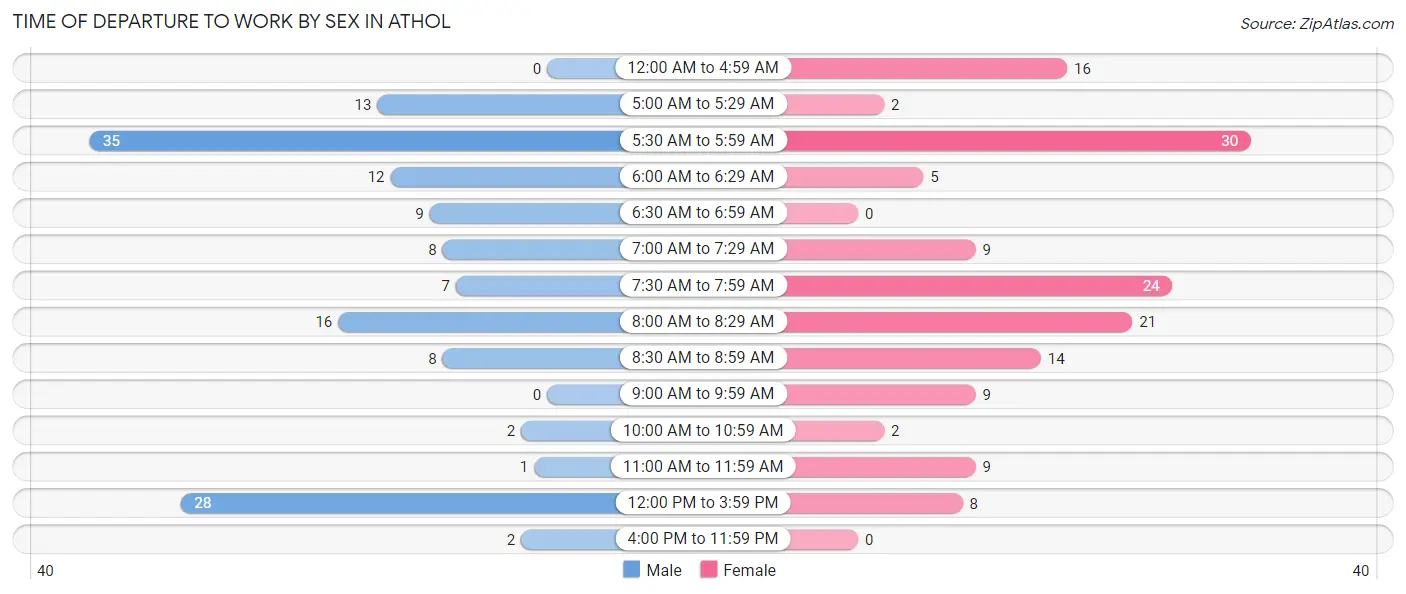
| Time of Departure | Male | Female |
| 12:00 AM to 4:59 AM | 0 (0.0%) | 16 (10.7%) |
| 5:00 AM to 5:29 AM | 13 (9.2%) | 2 (1.3%) |
| 5:30 AM to 5:59 AM | 35 (24.8%) | 30 (20.1%) |
| 6:00 AM to 6:29 AM | 12 (8.5%) | 5 (3.4%) |
| 6:30 AM to 6:59 AM | 9 (6.4%) | 0 (0.0%) |
| 7:00 AM to 7:29 AM | 8 (5.7%) | 9 (6.0%) |
| 7:30 AM to 7:59 AM | 7 (5.0%) | 24 (16.1%) |
| 8:00 AM to 8:29 AM | 16 (11.4%) | 21 (14.1%) |
| 8:30 AM to 8:59 AM | 8 (5.7%) | 14 (9.4%) |
| 9:00 AM to 9:59 AM | 0 (0.0%) | 9 (6.0%) |
| 10:00 AM to 10:59 AM | 2 (1.4%) | 2 (1.3%) |
| 11:00 AM to 11:59 AM | 1 (0.7%) | 9 (6.0%) |
| 12:00 PM to 3:59 PM | 28 (19.9%) | 8 (5.4%) |
| 4:00 PM to 11:59 PM | 2 (1.4%) | 0 (0.0%) |
| Total | 141 (100.0%) | 149 (100.0%) |
Housing Occupancy in Athol
Occupancy by Ownership in Athol
Of the total 292 dwellings in Athol, owner-occupied units account for 240 (82.2%), while renter-occupied units make up 52 (17.8%).
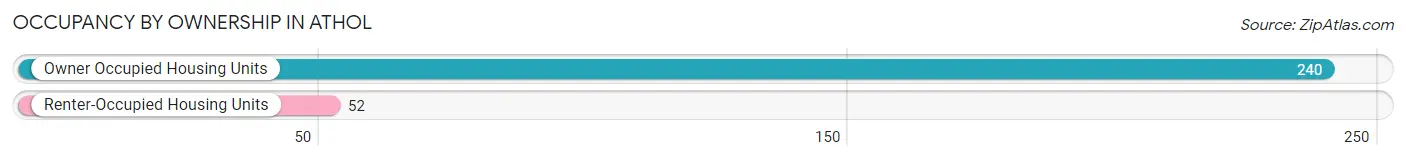
| Occupancy | # Housing Units | % Housing Units |
| Owner Occupied Housing Units | 240 | 82.2% |
| Renter-Occupied Housing Units | 52 | 17.8% |
| Total Occupied Housing Units | 292 | 100.0% |
Occupancy by Household Size in Athol
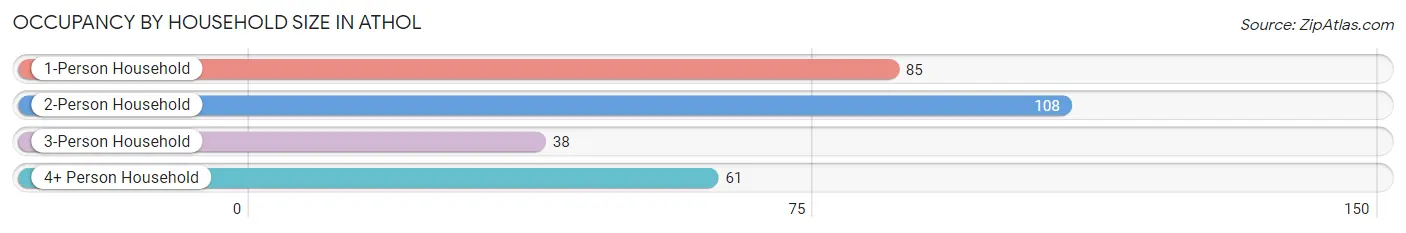
| Household Size | # Housing Units | % Housing Units |
| 1-Person Household | 85 | 29.1% |
| 2-Person Household | 108 | 37.0% |
| 3-Person Household | 38 | 13.0% |
| 4+ Person Household | 61 | 20.9% |
| Total Housing Units | 292 | 100.0% |
Occupancy by Ownership by Household Size in Athol
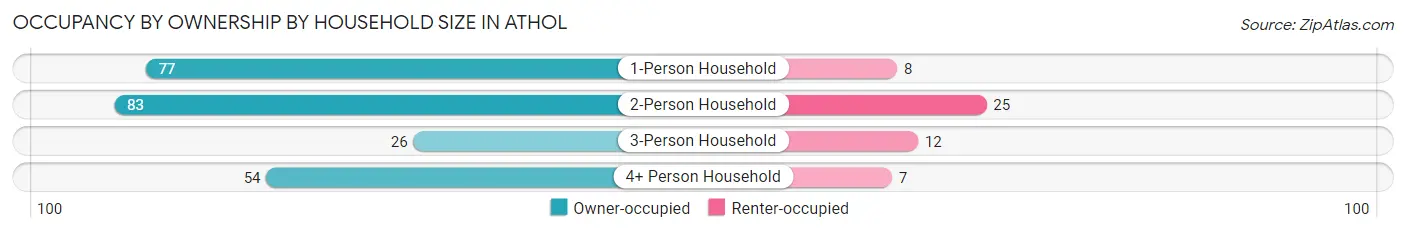
| Household Size | Owner-occupied | Renter-occupied |
| 1-Person Household | 77 (90.6%) | 8 (9.4%) |
| 2-Person Household | 83 (76.8%) | 25 (23.2%) |
| 3-Person Household | 26 (68.4%) | 12 (31.6%) |
| 4+ Person Household | 54 (88.5%) | 7 (11.5%) |
| Total Housing Units | 240 (82.2%) | 52 (17.8%) |
Occupancy by Educational Attainment in Athol
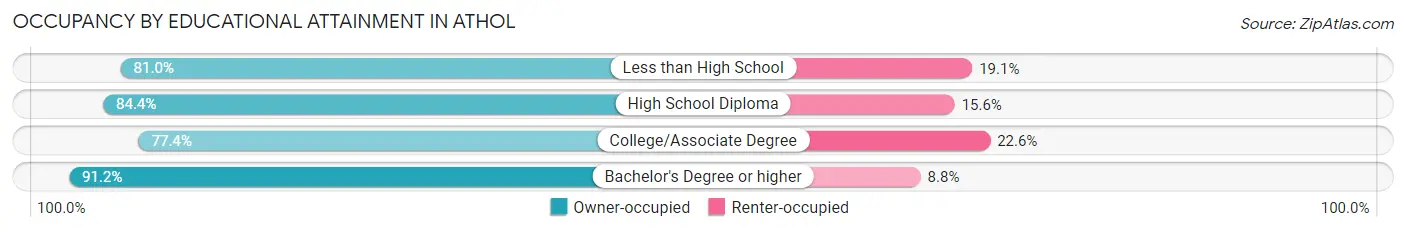
| Household Size | Owner-occupied | Renter-occupied |
| Less than High School | 17 (80.9%) | 4 (19.1%) |
| High School Diploma | 103 (84.4%) | 19 (15.6%) |
| College/Associate Degree | 89 (77.4%) | 26 (22.6%) |
| Bachelor's Degree or higher | 31 (91.2%) | 3 (8.8%) |
Occupancy by Age of Householder in Athol
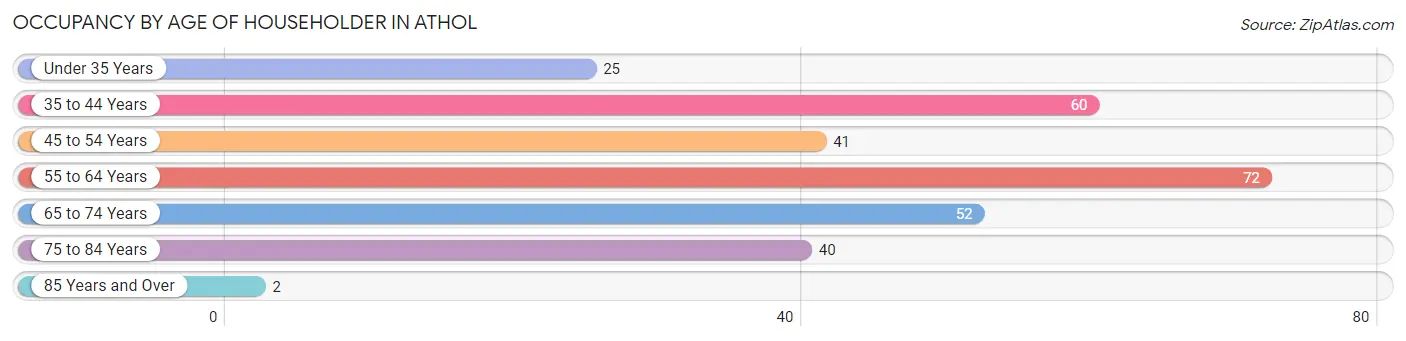
| Age Bracket | # Households | % Households |
| Under 35 Years | 25 | 8.6% |
| 35 to 44 Years | 60 | 20.5% |
| 45 to 54 Years | 41 | 14.0% |
| 55 to 64 Years | 72 | 24.7% |
| 65 to 74 Years | 52 | 17.8% |
| 75 to 84 Years | 40 | 13.7% |
| 85 Years and Over | 2 | 0.7% |
| Total | 292 | 100.0% |
Housing Finances in Athol
Median Income by Occupancy in Athol
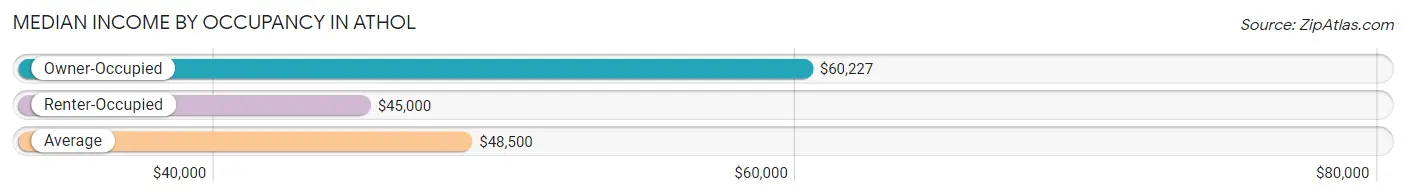
| Occupancy Type | # Households | Median Income |
| Owner-Occupied | 240 (82.2%) | $60,227 |
| Renter-Occupied | 52 (17.8%) | $45,000 |
| Average | 292 (100.0%) | $48,500 |
Occupancy by Householder Income Bracket in Athol
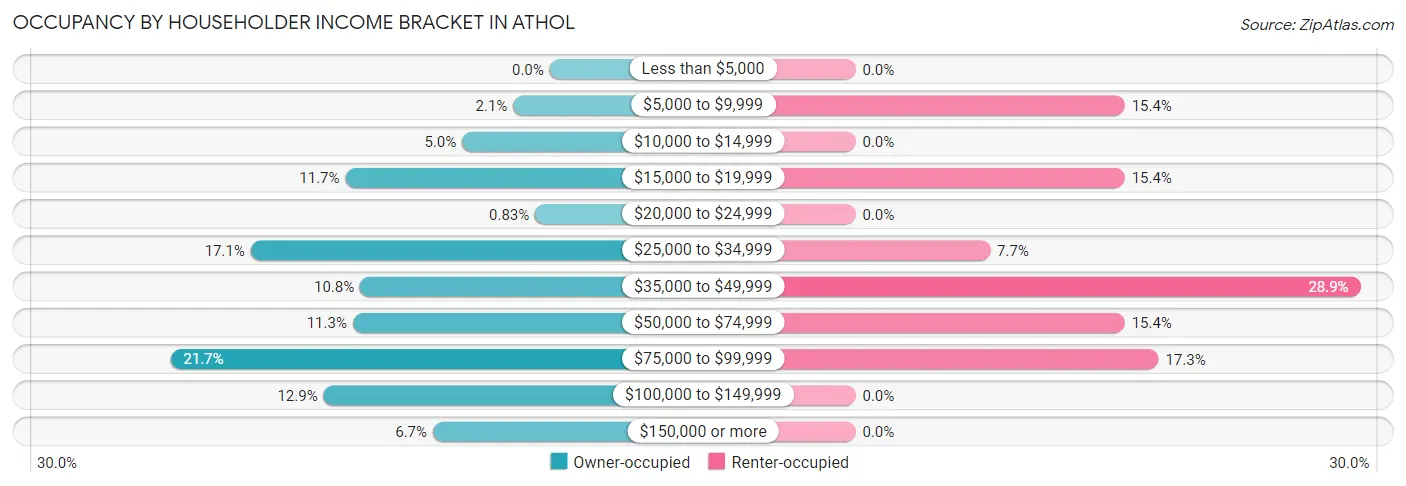
| Income Bracket | Owner-occupied | Renter-occupied |
| Less than $5,000 | 0 (0.0%) | 0 (0.0%) |
| $5,000 to $9,999 | 5 (2.1%) | 8 (15.4%) |
| $10,000 to $14,999 | 12 (5.0%) | 0 (0.0%) |
| $15,000 to $19,999 | 28 (11.7%) | 8 (15.4%) |
| $20,000 to $24,999 | 2 (0.8%) | 0 (0.0%) |
| $25,000 to $34,999 | 41 (17.1%) | 4 (7.7%) |
| $35,000 to $49,999 | 26 (10.8%) | 15 (28.8%) |
| $50,000 to $74,999 | 27 (11.3%) | 8 (15.4%) |
| $75,000 to $99,999 | 52 (21.7%) | 9 (17.3%) |
| $100,000 to $149,999 | 31 (12.9%) | 0 (0.0%) |
| $150,000 or more | 16 (6.7%) | 0 (0.0%) |
| Total | 240 (100.0%) | 52 (100.0%) |
Monthly Housing Cost Tiers in Athol
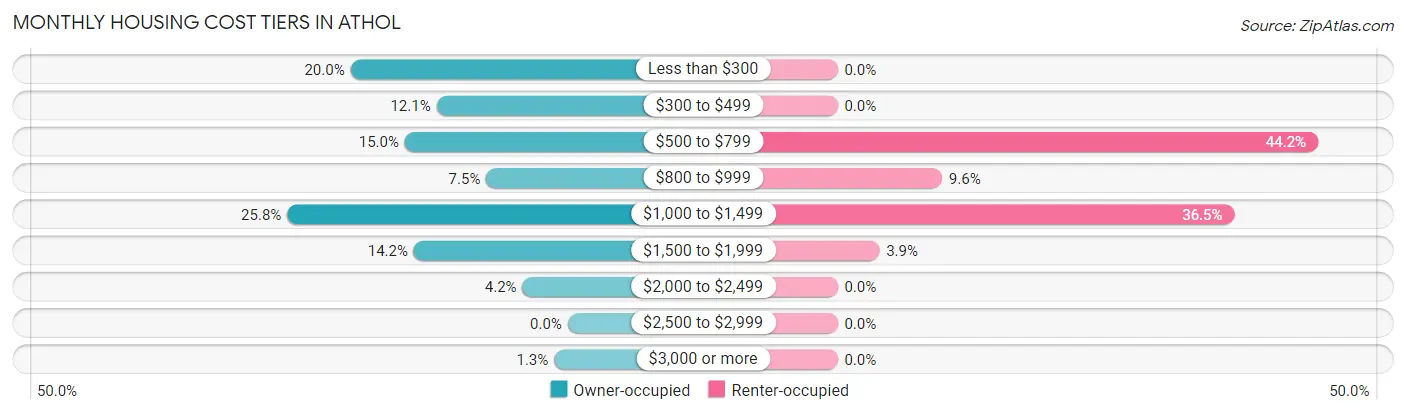
| Monthly Cost | Owner-occupied | Renter-occupied |
| Less than $300 | 48 (20.0%) | 0 (0.0%) |
| $300 to $499 | 29 (12.1%) | 0 (0.0%) |
| $500 to $799 | 36 (15.0%) | 23 (44.2%) |
| $800 to $999 | 18 (7.5%) | 5 (9.6%) |
| $1,000 to $1,499 | 62 (25.8%) | 19 (36.5%) |
| $1,500 to $1,999 | 34 (14.2%) | 2 (3.8%) |
| $2,000 to $2,499 | 10 (4.2%) | 0 (0.0%) |
| $2,500 to $2,999 | 0 (0.0%) | 0 (0.0%) |
| $3,000 or more | 3 (1.3%) | 0 (0.0%) |
| Total | 240 (100.0%) | 52 (100.0%) |
Physical Housing Characteristics in Athol
Housing Structures in Athol
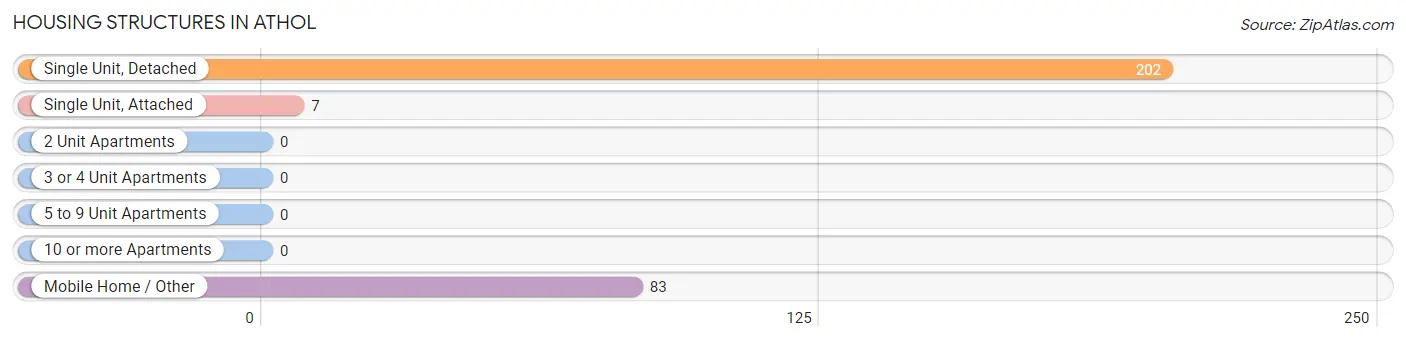
| Structure Type | # Housing Units | % Housing Units |
| Single Unit, Detached | 202 | 69.2% |
| Single Unit, Attached | 7 | 2.4% |
| 2 Unit Apartments | 0 | 0.0% |
| 3 or 4 Unit Apartments | 0 | 0.0% |
| 5 to 9 Unit Apartments | 0 | 0.0% |
| 10 or more Apartments | 0 | 0.0% |
| Mobile Home / Other | 83 | 28.4% |
| Total | 292 | 100.0% |
Housing Structures by Occupancy in Athol
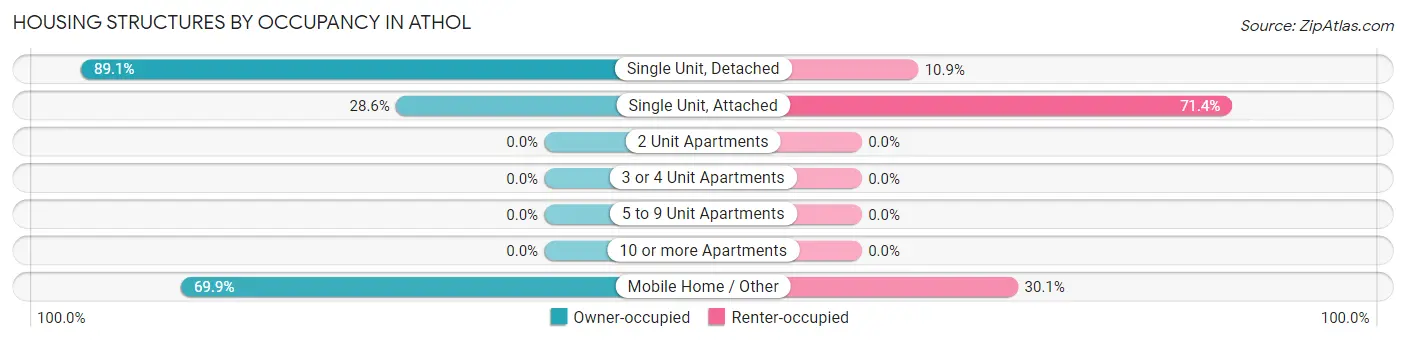
| Structure Type | Owner-occupied | Renter-occupied |
| Single Unit, Detached | 180 (89.1%) | 22 (10.9%) |
| Single Unit, Attached | 2 (28.6%) | 5 (71.4%) |
| 2 Unit Apartments | 0 (0.0%) | 0 (0.0%) |
| 3 or 4 Unit Apartments | 0 (0.0%) | 0 (0.0%) |
| 5 to 9 Unit Apartments | 0 (0.0%) | 0 (0.0%) |
| 10 or more Apartments | 0 (0.0%) | 0 (0.0%) |
| Mobile Home / Other | 58 (69.9%) | 25 (30.1%) |
| Total | 240 (82.2%) | 52 (17.8%) |
Housing Structures by Number of Rooms in Athol
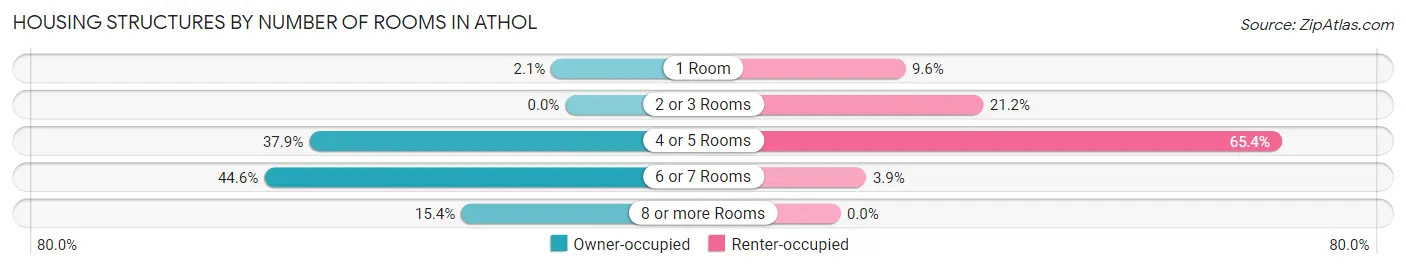
| Number of Rooms | Owner-occupied | Renter-occupied |
| 1 Room | 5 (2.1%) | 5 (9.6%) |
| 2 or 3 Rooms | 0 (0.0%) | 11 (21.1%) |
| 4 or 5 Rooms | 91 (37.9%) | 34 (65.4%) |
| 6 or 7 Rooms | 107 (44.6%) | 2 (3.8%) |
| 8 or more Rooms | 37 (15.4%) | 0 (0.0%) |
| Total | 240 (100.0%) | 52 (100.0%) |
Housing Structure by Heating Type in Athol
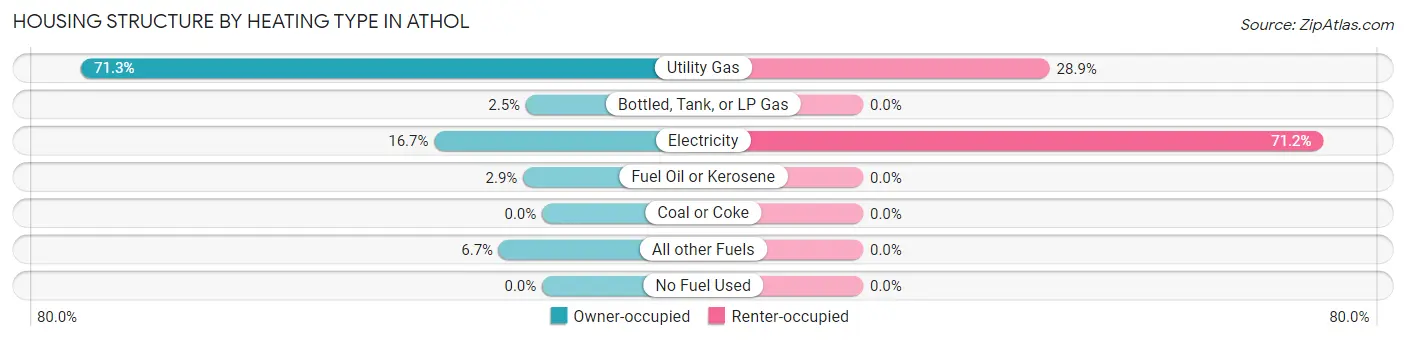
| Heating Type | Owner-occupied | Renter-occupied |
| Utility Gas | 171 (71.3%) | 15 (28.8%) |
| Bottled, Tank, or LP Gas | 6 (2.5%) | 0 (0.0%) |
| Electricity | 40 (16.7%) | 37 (71.2%) |
| Fuel Oil or Kerosene | 7 (2.9%) | 0 (0.0%) |
| Coal or Coke | 0 (0.0%) | 0 (0.0%) |
| All other Fuels | 16 (6.7%) | 0 (0.0%) |
| No Fuel Used | 0 (0.0%) | 0 (0.0%) |
| Total | 240 (100.0%) | 52 (100.0%) |
Household Vehicle Usage in Athol
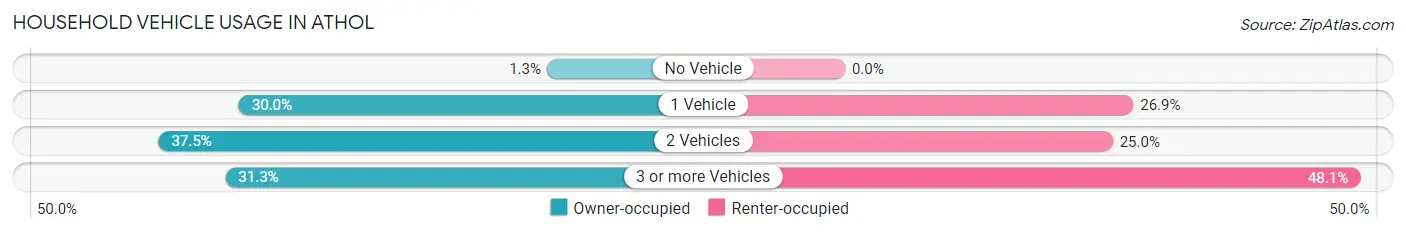
| Vehicles per Household | Owner-occupied | Renter-occupied |
| No Vehicle | 3 (1.3%) | 0 (0.0%) |
| 1 Vehicle | 72 (30.0%) | 14 (26.9%) |
| 2 Vehicles | 90 (37.5%) | 13 (25.0%) |
| 3 or more Vehicles | 75 (31.2%) | 25 (48.1%) |
| Total | 240 (100.0%) | 52 (100.0%) |
Real Estate & Mortgages in Athol
Real Estate and Mortgage Overview in Athol
| Characteristic | Without Mortgage | With Mortgage |
| Housing Units | 82 | 158 |
| Median Property Value | - | - |
| Median Household Income | $35,500 | $15 |
| Monthly Housing Costs | $260 | $3 |
| Real Estate Taxes | $950 | $8 |
Property Value by Mortgage Status in Athol
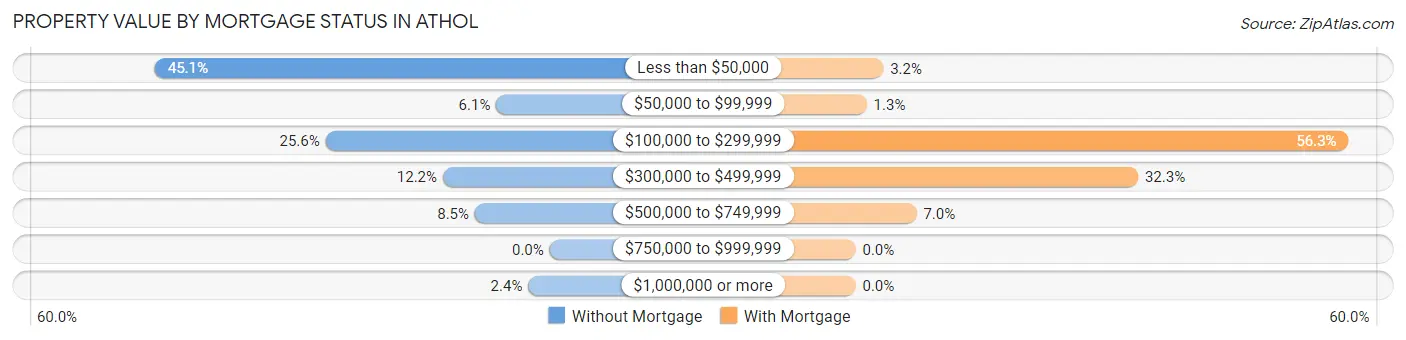
| Property Value | Without Mortgage | With Mortgage |
| Less than $50,000 | 37 (45.1%) | 5 (3.2%) |
| $50,000 to $99,999 | 5 (6.1%) | 2 (1.3%) |
| $100,000 to $299,999 | 21 (25.6%) | 89 (56.3%) |
| $300,000 to $499,999 | 10 (12.2%) | 51 (32.3%) |
| $500,000 to $749,999 | 7 (8.5%) | 11 (7.0%) |
| $750,000 to $999,999 | 0 (0.0%) | 0 (0.0%) |
| $1,000,000 or more | 2 (2.4%) | 0 (0.0%) |
| Total | 82 (100.0%) | 158 (100.0%) |
Household Income by Mortgage Status in Athol
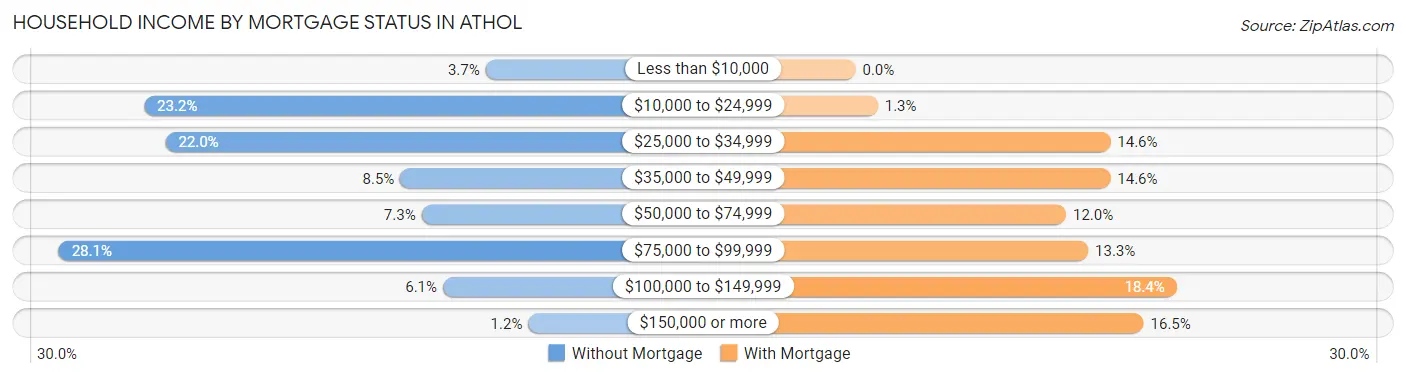
| Household Income | Without Mortgage | With Mortgage |
| Less than $10,000 | 3 (3.7%) | 0 (0.0%) |
| $10,000 to $24,999 | 19 (23.2%) | 2 (1.3%) |
| $25,000 to $34,999 | 18 (22.0%) | 23 (14.6%) |
| $35,000 to $49,999 | 7 (8.5%) | 23 (14.6%) |
| $50,000 to $74,999 | 6 (7.3%) | 19 (12.0%) |
| $75,000 to $99,999 | 23 (28.1%) | 21 (13.3%) |
| $100,000 to $149,999 | 5 (6.1%) | 29 (18.3%) |
| $150,000 or more | 1 (1.2%) | 26 (16.5%) |
| Total | 82 (100.0%) | 158 (100.0%) |
Property Value to Household Income Ratio in Athol
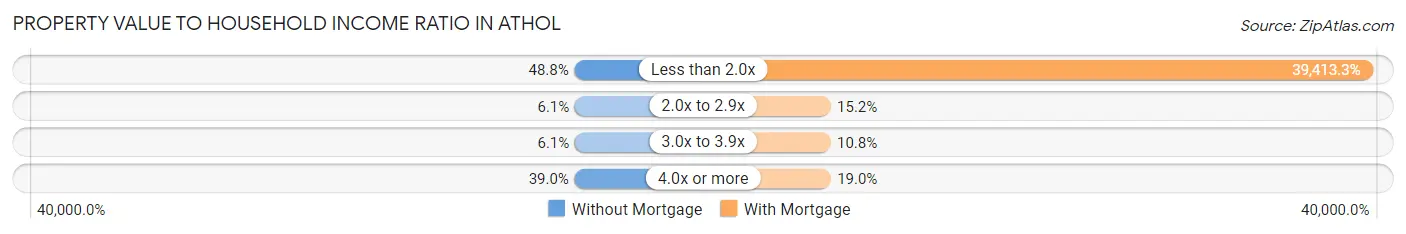
| Value-to-Income Ratio | Without Mortgage | With Mortgage |
| Less than 2.0x | 40 (48.8%) | 62,273 (39,413.3%) |
| 2.0x to 2.9x | 5 (6.1%) | 24 (15.2%) |
| 3.0x to 3.9x | 5 (6.1%) | 17 (10.8%) |
| 4.0x or more | 32 (39.0%) | 30 (19.0%) |
| Total | 82 (100.0%) | 158 (100.0%) |
Real Estate Taxes by Mortgage Status in Athol
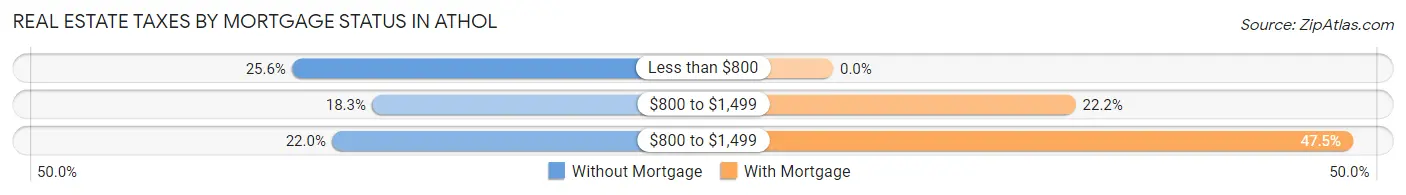
| Property Taxes | Without Mortgage | With Mortgage |
| Less than $800 | 21 (25.6%) | 0 (0.0%) |
| $800 to $1,499 | 15 (18.3%) | 35 (22.2%) |
| $800 to $1,499 | 18 (22.0%) | 75 (47.5%) |
| Total | 82 (100.0%) | 158 (100.0%) |
Health & Disability in Athol
Health Insurance Coverage by Age in Athol
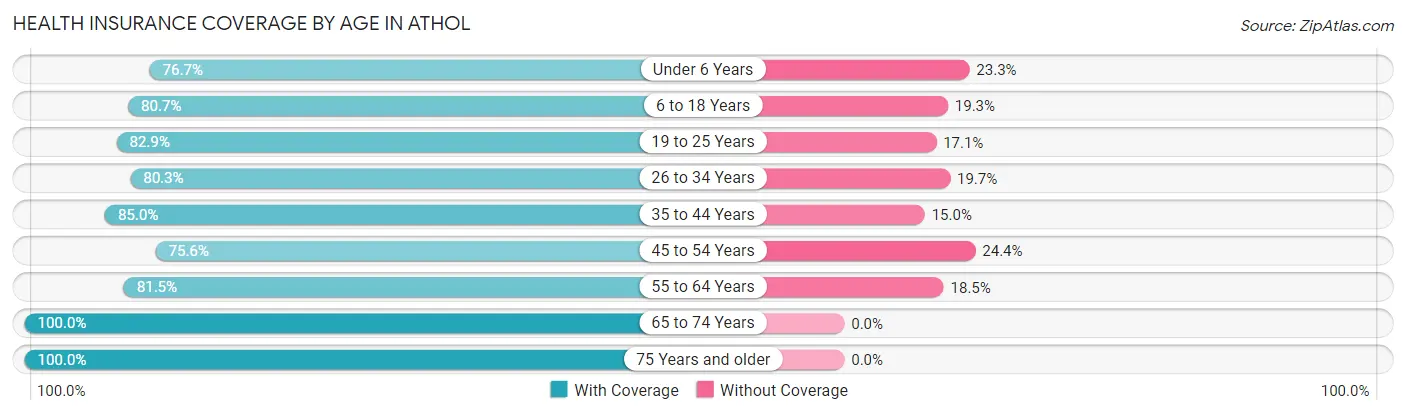
| Age Bracket | With Coverage | Without Coverage |
| Under 6 Years | 46 (76.7%) | 14 (23.3%) |
| 6 to 18 Years | 117 (80.7%) | 28 (19.3%) |
| 19 to 25 Years | 29 (82.9%) | 6 (17.1%) |
| 26 to 34 Years | 57 (80.3%) | 14 (19.7%) |
| 35 to 44 Years | 85 (85.0%) | 15 (15.0%) |
| 45 to 54 Years | 68 (75.6%) | 22 (24.4%) |
| 55 to 64 Years | 110 (81.5%) | 25 (18.5%) |
| 65 to 74 Years | 86 (100.0%) | 0 (0.0%) |
| 75 Years and older | 68 (100.0%) | 0 (0.0%) |
| Total | 666 (84.3%) | 124 (15.7%) |
Health Insurance Coverage by Citizenship Status in Athol
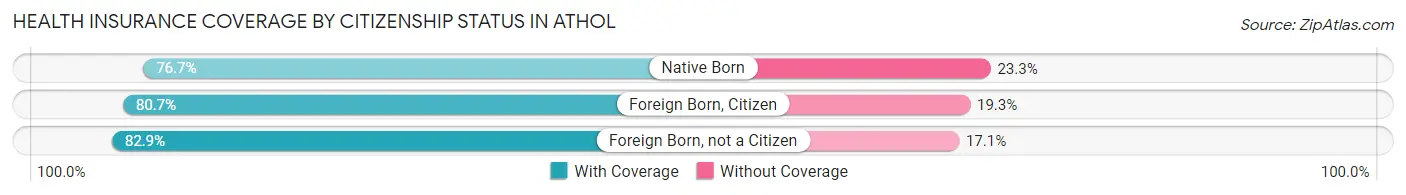
| Citizenship Status | With Coverage | Without Coverage |
| Native Born | 46 (76.7%) | 14 (23.3%) |
| Foreign Born, Citizen | 117 (80.7%) | 28 (19.3%) |
| Foreign Born, not a Citizen | 29 (82.9%) | 6 (17.1%) |
Health Insurance Coverage by Household Income in Athol
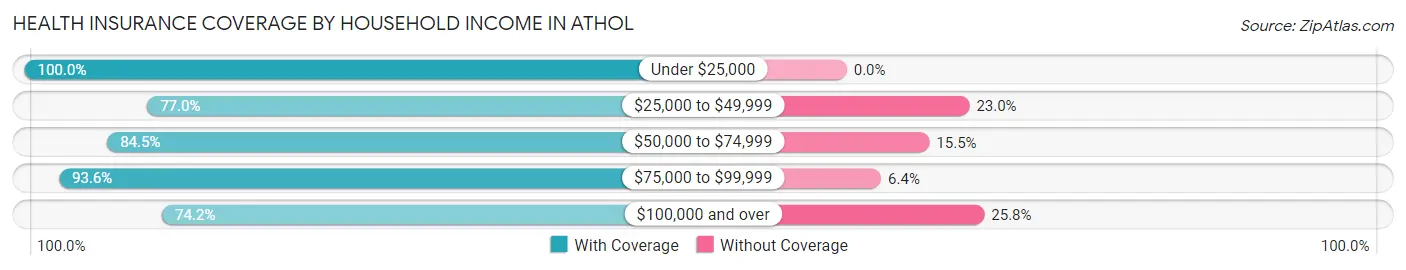
| Household Income | With Coverage | Without Coverage |
| Under $25,000 | 75 (100.0%) | 0 (0.0%) |
| $25,000 to $49,999 | 181 (77.0%) | 54 (23.0%) |
| $50,000 to $74,999 | 71 (84.5%) | 13 (15.5%) |
| $75,000 to $99,999 | 218 (93.6%) | 15 (6.4%) |
| $100,000 and over | 121 (74.2%) | 42 (25.8%) |
Public vs Private Health Insurance Coverage by Age in Athol
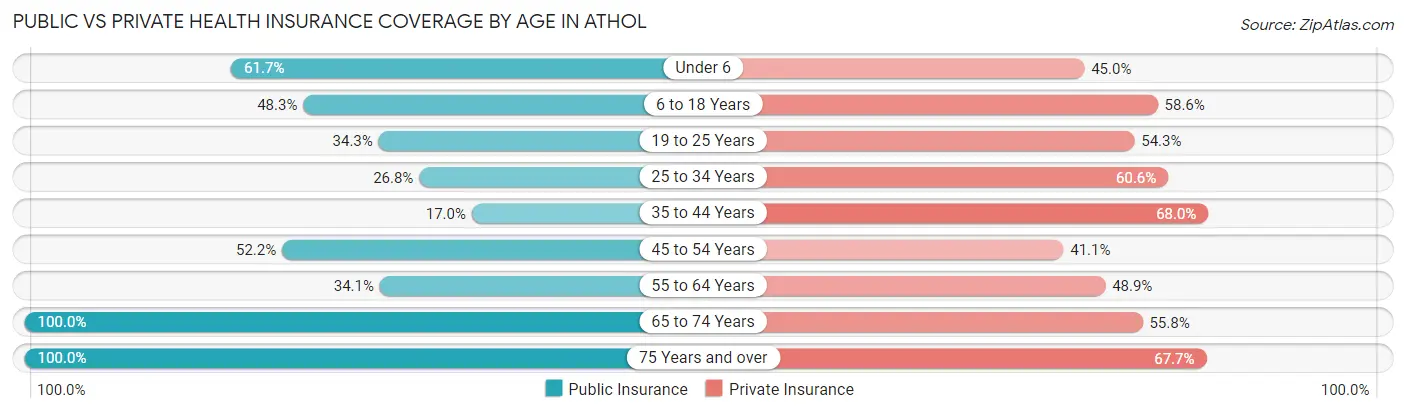
| Age Bracket | Public Insurance | Private Insurance |
| Under 6 | 37 (61.7%) | 27 (45.0%) |
| 6 to 18 Years | 70 (48.3%) | 85 (58.6%) |
| 19 to 25 Years | 12 (34.3%) | 19 (54.3%) |
| 25 to 34 Years | 19 (26.8%) | 43 (60.6%) |
| 35 to 44 Years | 17 (17.0%) | 68 (68.0%) |
| 45 to 54 Years | 47 (52.2%) | 37 (41.1%) |
| 55 to 64 Years | 46 (34.1%) | 66 (48.9%) |
| 65 to 74 Years | 86 (100.0%) | 48 (55.8%) |
| 75 Years and over | 68 (100.0%) | 46 (67.6%) |
| Total | 402 (50.9%) | 439 (55.6%) |
Disability Status by Sex by Age in Athol
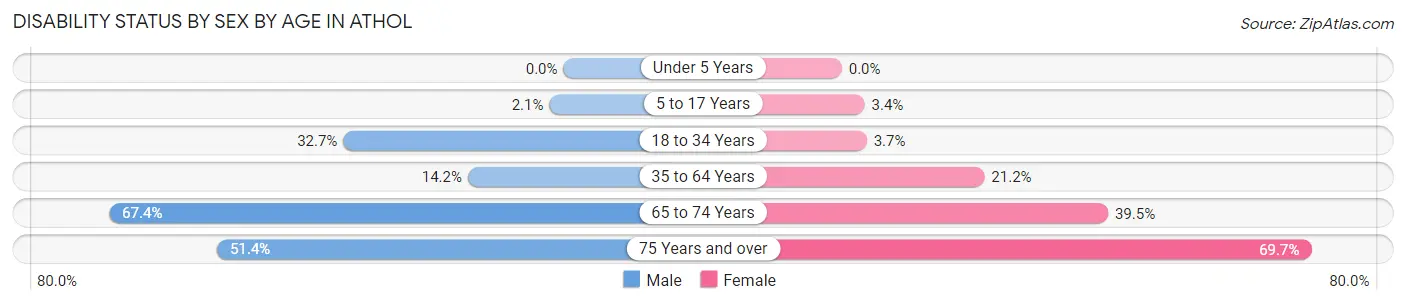
| Age Bracket | Male | Female |
| Under 5 Years | 0 (0.0%) | 0 (0.0%) |
| 5 to 17 Years | 2 (2.1%) | 2 (3.4%) |
| 18 to 34 Years | 17 (32.7%) | 2 (3.7%) |
| 35 to 64 Years | 22 (14.2%) | 36 (21.2%) |
| 65 to 74 Years | 29 (67.4%) | 17 (39.5%) |
| 75 Years and over | 18 (51.4%) | 23 (69.7%) |
Disability Class by Sex by Age in Athol
Disability Class: Hearing Difficulty
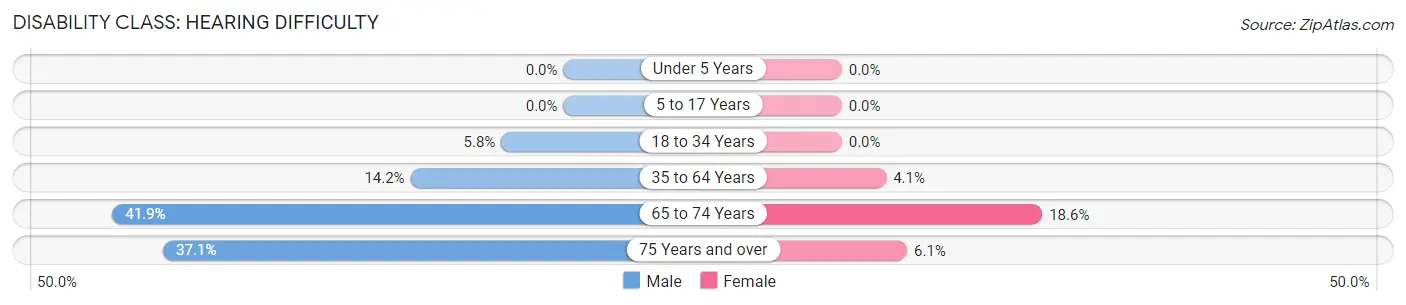
| Age Bracket | Male | Female |
| Under 5 Years | 0 (0.0%) | 0 (0.0%) |
| 5 to 17 Years | 0 (0.0%) | 0 (0.0%) |
| 18 to 34 Years | 3 (5.8%) | 0 (0.0%) |
| 35 to 64 Years | 22 (14.2%) | 7 (4.1%) |
| 65 to 74 Years | 18 (41.9%) | 8 (18.6%) |
| 75 Years and over | 13 (37.1%) | 2 (6.1%) |
Disability Class: Vision Difficulty
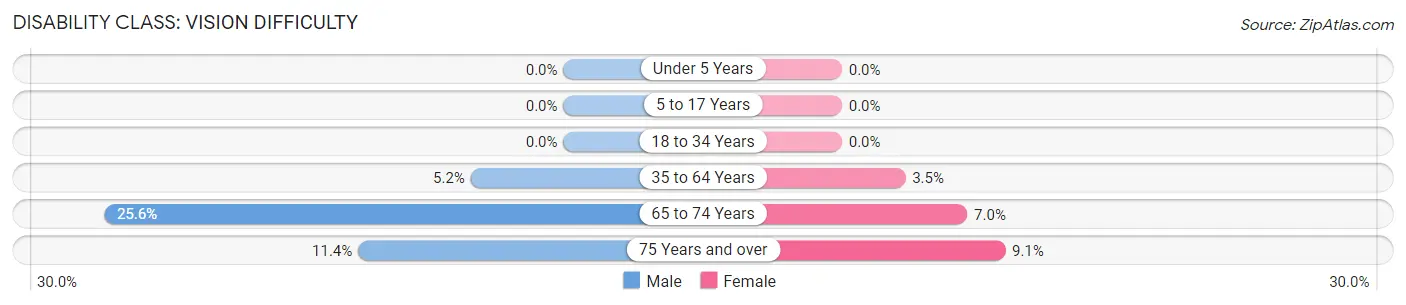
| Age Bracket | Male | Female |
| Under 5 Years | 0 (0.0%) | 0 (0.0%) |
| 5 to 17 Years | 0 (0.0%) | 0 (0.0%) |
| 18 to 34 Years | 0 (0.0%) | 0 (0.0%) |
| 35 to 64 Years | 8 (5.2%) | 6 (3.5%) |
| 65 to 74 Years | 11 (25.6%) | 3 (7.0%) |
| 75 Years and over | 4 (11.4%) | 3 (9.1%) |
Disability Class: Cognitive Difficulty
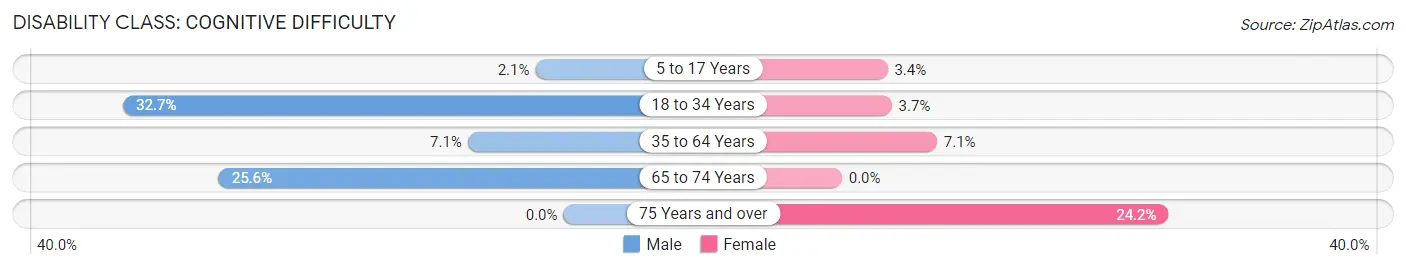
| Age Bracket | Male | Female |
| 5 to 17 Years | 2 (2.1%) | 2 (3.4%) |
| 18 to 34 Years | 17 (32.7%) | 2 (3.7%) |
| 35 to 64 Years | 11 (7.1%) | 12 (7.1%) |
| 65 to 74 Years | 11 (25.6%) | 0 (0.0%) |
| 75 Years and over | 0 (0.0%) | 8 (24.2%) |
Disability Class: Ambulatory Difficulty
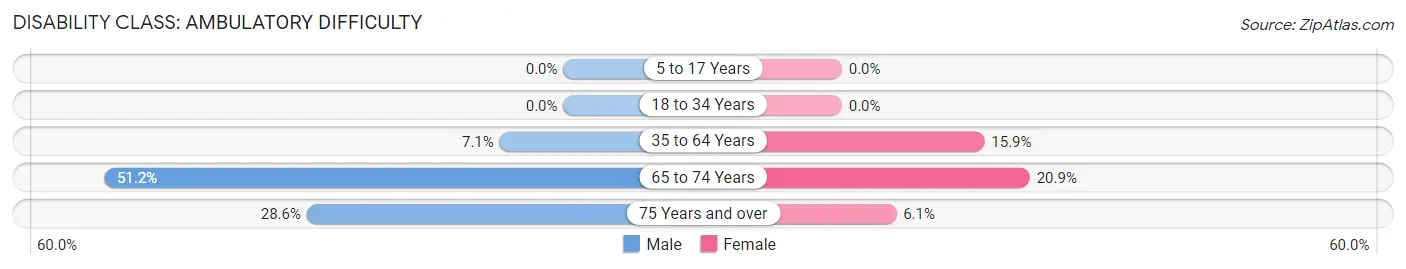
| Age Bracket | Male | Female |
| 5 to 17 Years | 0 (0.0%) | 0 (0.0%) |
| 18 to 34 Years | 0 (0.0%) | 0 (0.0%) |
| 35 to 64 Years | 11 (7.1%) | 27 (15.9%) |
| 65 to 74 Years | 22 (51.2%) | 9 (20.9%) |
| 75 Years and over | 10 (28.6%) | 2 (6.1%) |
Disability Class: Self-Care Difficulty
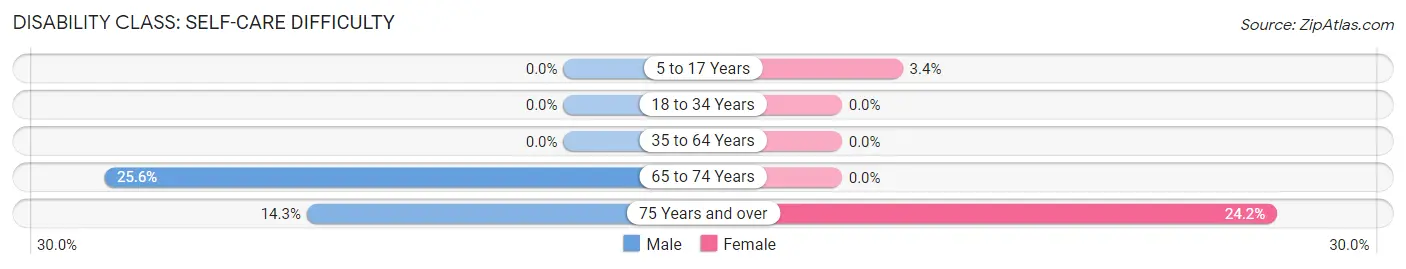
| Age Bracket | Male | Female |
| 5 to 17 Years | 0 (0.0%) | 2 (3.4%) |
| 18 to 34 Years | 0 (0.0%) | 0 (0.0%) |
| 35 to 64 Years | 0 (0.0%) | 0 (0.0%) |
| 65 to 74 Years | 11 (25.6%) | 0 (0.0%) |
| 75 Years and over | 5 (14.3%) | 8 (24.2%) |
Technology Access in Athol
Computing Device Access in Athol
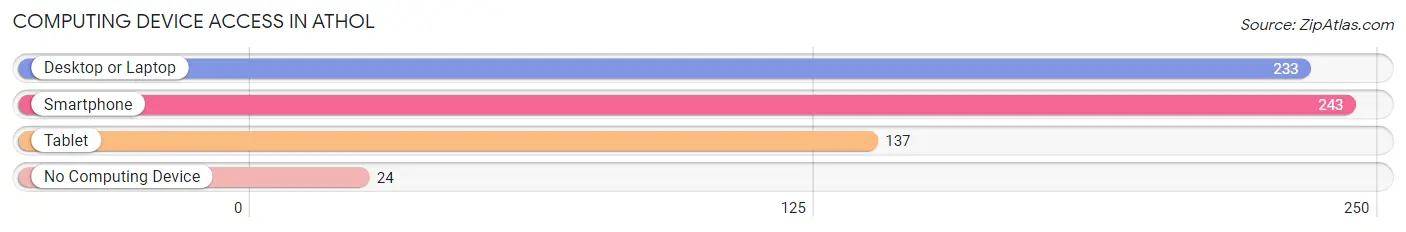
| Device Type | # Households | % Households |
| Desktop or Laptop | 233 | 79.8% |
| Smartphone | 243 | 83.2% |
| Tablet | 137 | 46.9% |
| No Computing Device | 24 | 8.2% |
| Total | 292 | 100.0% |
Internet Access in Athol
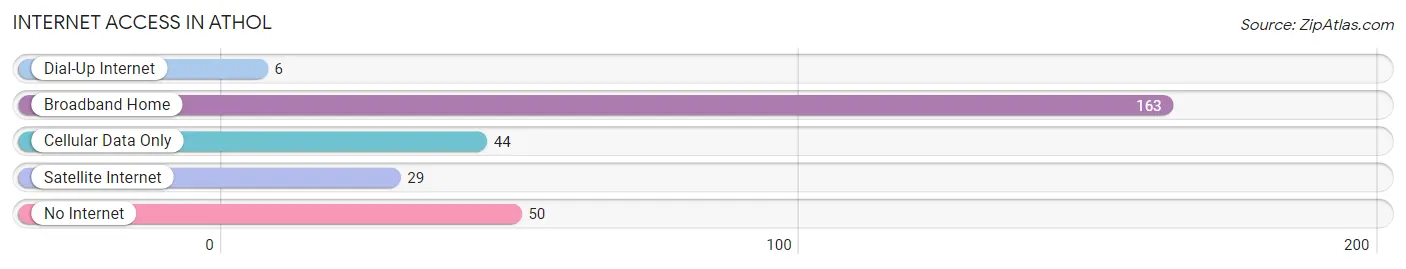
| Internet Type | # Households | % Households |
| Dial-Up Internet | 6 | 2.1% |
| Broadband Home | 163 | 55.8% |
| Cellular Data Only | 44 | 15.1% |
| Satellite Internet | 29 | 9.9% |
| No Internet | 50 | 17.1% |
| Total | 292 | 100.0% |
Athol Summary
Athol is a small town located in Kootenai County, Idaho, United States. It is situated in the northern part of the state, about 20 miles north of Coeur d'Alene. The population of Athol was 1,093 at the 2010 census.
History
The area that is now Athol was first settled in the late 1800s by homesteaders. The town was officially founded in 1891 and was named after Athol, Massachusetts. The town was originally a logging and farming community, but in the early 1900s, the area began to develop into a resort destination. The first resort in the area was the Athol Hotel, which was built in 1906. The hotel was a popular destination for tourists and locals alike, and it was the center of the town's social life.
In the 1920s, the town began to grow and develop. The first school was built in 1923, and the first post office was established in 1924. The town also had a general store, a blacksmith shop, and a sawmill.
Geography
Athol is located in northern Idaho, about 20 miles north of Coeur d'Alene. The town is situated in the foothills of the Rocky Mountains, and is surrounded by forests and lakes. The town is located at an elevation of 2,743 feet above sea level.
The climate in Athol is generally mild, with warm summers and cold winters. The average high temperature in the summer is around 80 degrees Fahrenheit, and the average low temperature in the winter is around 20 degrees Fahrenheit.
Economy
The economy of Athol is largely based on tourism and recreation. The town is a popular destination for outdoor activities such as fishing, hunting, camping, and hiking. The town also has several resorts and lodges that cater to tourists.
In addition to tourism, Athol also has a small manufacturing sector. The town is home to several small businesses, including a sawmill, a woodworking shop, and a furniture factory.
Demographics
As of the 2010 census, the population of Athol was 1,093. The racial makeup of the town was 95.3% White, 0.7% Native American, 0.3% Asian, 0.2% African American, 0.1% Pacific Islander, and 3.4% from other races. The median household income in Athol was $41,250, and the median family income was $50,000.
Conclusion
Athol is a small town located in northern Idaho. It is a popular destination for outdoor activities, and the town's economy is largely based on tourism and recreation. The population of Athol was 1,093 at the 2010 census, and the town has a diverse racial makeup.
Common Questions
What is Per Capita Income in Athol?
Per Capita income in Athol is $24,211.
What is the Median Family Income in Athol?
Median Family Income in Athol is $76,563.
What is the Median Household income in Athol?
Median Household Income in Athol is $48,500.
What is Income or Wage Gap in Athol?
Income or Wage Gap in Athol is 33.5%.
Women in Athol earn 66.5 cents for every dollar earned by a man.
What is Inequality or Gini Index in Athol?
Inequality or Gini Index in Athol is 0.40.
What is the Total Population of Athol?
Total Population of Athol is 790.
What is the Total Male Population of Athol?
Total Male Population of Athol is 390.
What is the Total Female Population of Athol?
Total Female Population of Athol is 400.
What is the Ratio of Males per 100 Females in Athol?
There are 97.50 Males per 100 Females in Athol.
What is the Ratio of Females per 100 Males in Athol?
There are 102.56 Females per 100 Males in Athol.
What is the Median Population Age in Athol?
Median Population Age in Athol is 42.7 Years.
What is the Average Family Size in Athol
Average Family Size in Athol is 3.6 People.
What is the Average Household Size in Athol
Average Household Size in Athol is 2.7 People.
How Large is the Labor Force in Athol?
There are 304 People in the Labor Forcein in Athol.
What is the Percentage of People in the Labor Force in Athol?
50.5% of People are in the Labor Force in Athol.
What is the Unemployment Rate in Athol?
Unemployment Rate in Athol is 0.7%.