Ashton, ID Map & Demographics
Ashton Map
Ashton Overview
$27,161
PER CAPITA INCOME
$67,792
AVG FAMILY INCOME
$62,819
AVG HOUSEHOLD INCOME
24.2%
WAGE / INCOME GAP [ % ]
75.8¢/ $1
WAGE / INCOME GAP [ $ ]
0.30
INEQUALITY / GINI INDEX
1,367
TOTAL POPULATION
752
MALE POPULATION
615
FEMALE POPULATION
122.28
MALES / 100 FEMALES
81.78
FEMALES / 100 MALES
40.6
MEDIAN AGE
3.6
AVG FAMILY SIZE
2.9
AVG HOUSEHOLD SIZE
706
LABOR FORCE [ PEOPLE ]
66.7%
PERCENT IN LABOR FORCE
8.8%
UNEMPLOYMENT RATE
Ashton Zip Codes
Ashton Area Codes
Income in Ashton
Income Overview in Ashton
Per Capita Income in Ashton is $27,161, while median incomes of families and households are $67,792 and $62,819 respectively.
| Characteristic | Number | Measure |
| Per Capita Income | 1,367 | $27,161 |
| Median Family Income | 327 | $67,792 |
| Mean Family Income | 327 | $74,707 |
| Median Household Income | 460 | $62,819 |
| Mean Household Income | 460 | $69,657 |
| Income Deficit | 327 | $0 |
| Wage / Income Gap (%) | 1,367 | 24.17% |
| Wage / Income Gap ($) | 1,367 | 75.83¢ per $1 |
| Gini / Inequality Index | 1,367 | 0.30 |
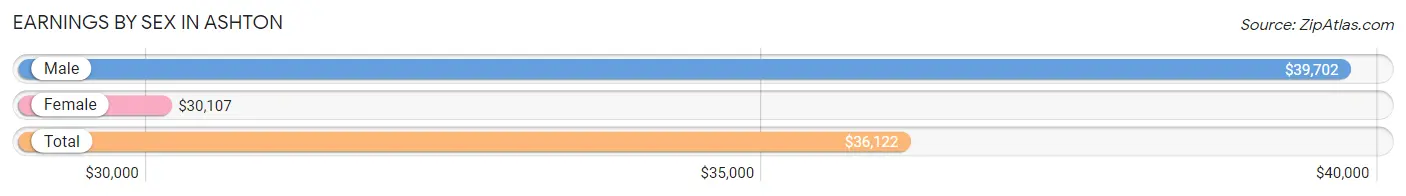
Earnings by Sex in Ashton
Average Earnings in Ashton are $36,122, $39,702 for men and $30,107 for women, a difference of 24.2%.
| Sex | Number | Average Earnings |
| Male | 404 (54.4%) | $39,702 |
| Female | 339 (45.6%) | $30,107 |
| Total | 743 (100.0%) | $36,122 |
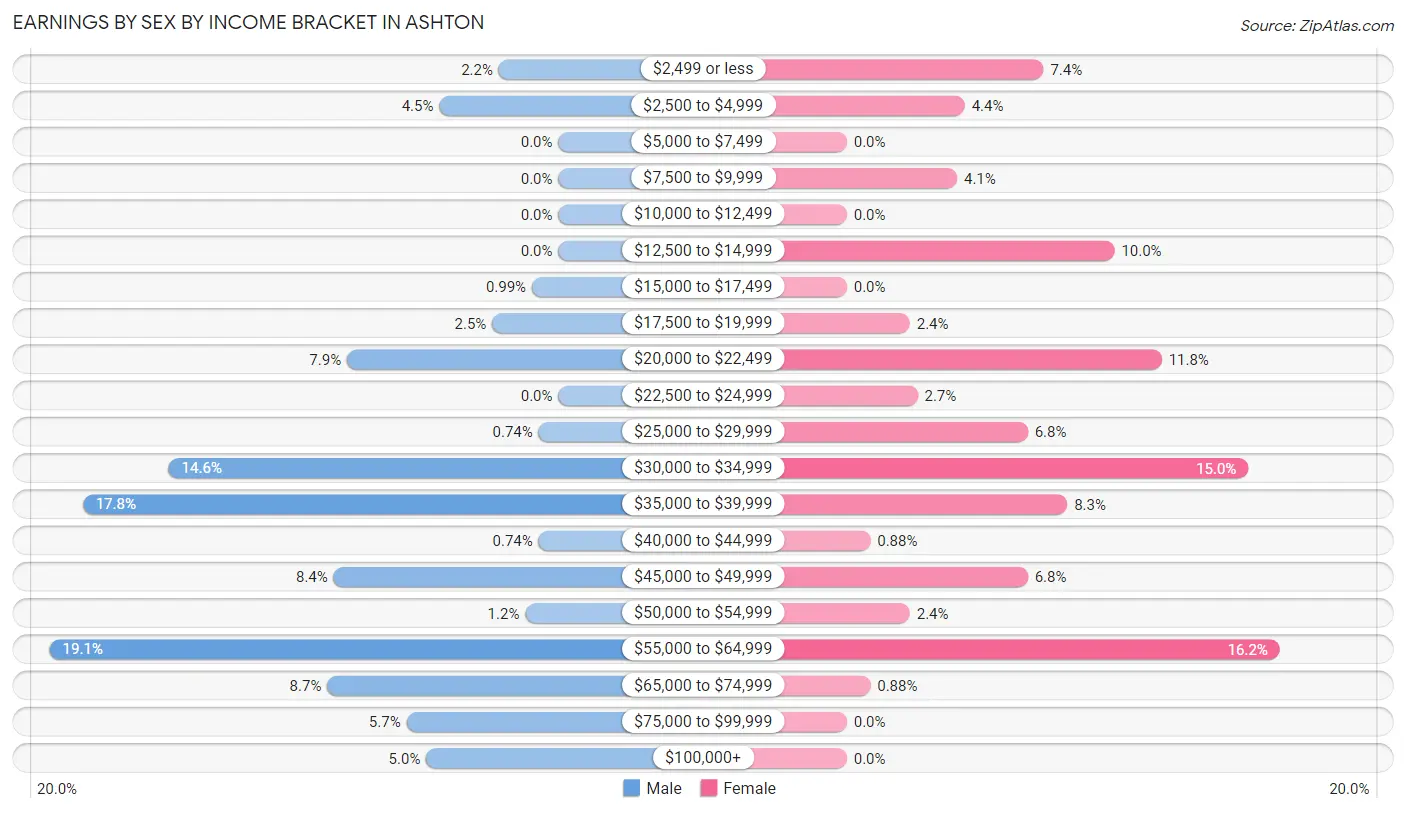
Earnings by Sex by Income Bracket in Ashton
The most common earnings brackets in Ashton are $55,000 to $64,999 for men (77 | 19.1%) and $55,000 to $64,999 for women (55 | 16.2%).
| Income | Male | Female |
| $2,499 or less | 9 (2.2%) | 25 (7.4%) |
| $2,500 to $4,999 | 18 (4.5%) | 15 (4.4%) |
| $5,000 to $7,499 | 0 (0.0%) | 0 (0.0%) |
| $7,500 to $9,999 | 0 (0.0%) | 14 (4.1%) |
| $10,000 to $12,499 | 0 (0.0%) | 0 (0.0%) |
| $12,500 to $14,999 | 0 (0.0%) | 34 (10.0%) |
| $15,000 to $17,499 | 4 (1.0%) | 0 (0.0%) |
| $17,500 to $19,999 | 10 (2.5%) | 8 (2.4%) |
| $20,000 to $22,499 | 32 (7.9%) | 40 (11.8%) |
| $22,500 to $24,999 | 0 (0.0%) | 9 (2.6%) |
| $25,000 to $29,999 | 3 (0.7%) | 23 (6.8%) |
| $30,000 to $34,999 | 59 (14.6%) | 51 (15.0%) |
| $35,000 to $39,999 | 72 (17.8%) | 28 (8.3%) |
| $40,000 to $44,999 | 3 (0.7%) | 3 (0.9%) |
| $45,000 to $49,999 | 34 (8.4%) | 23 (6.8%) |
| $50,000 to $54,999 | 5 (1.2%) | 8 (2.4%) |
| $55,000 to $64,999 | 77 (19.1%) | 55 (16.2%) |
| $65,000 to $74,999 | 35 (8.7%) | 3 (0.9%) |
| $75,000 to $99,999 | 23 (5.7%) | 0 (0.0%) |
| $100,000+ | 20 (5.0%) | 0 (0.0%) |
| Total | 404 (100.0%) | 339 (100.0%) |
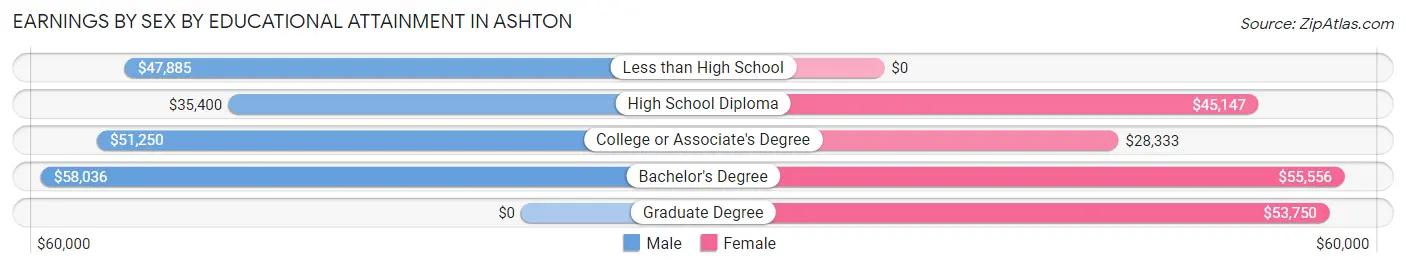
Earnings by Sex by Educational Attainment in Ashton
Average earnings in Ashton are $39,107 for men and $31,786 for women, a difference of 18.7%. Men with an educational attainment of bachelor's degree enjoy the highest average annual earnings of $58,036, while those with high school diploma education earn the least with $35,400. Women with an educational attainment of bachelor's degree earn the most with the average annual earnings of $55,556, while those with college or associate's degree education have the smallest earnings of $28,333.
| Educational Attainment | Male Income | Female Income |
| Less than High School | $47,885 | $0 |
| High School Diploma | $35,400 | $45,147 |
| College or Associate's Degree | $51,250 | $28,333 |
| Bachelor's Degree | $58,036 | $55,556 |
| Graduate Degree | - | - |
| Total | $39,107 | $31,786 |
Family Income in Ashton
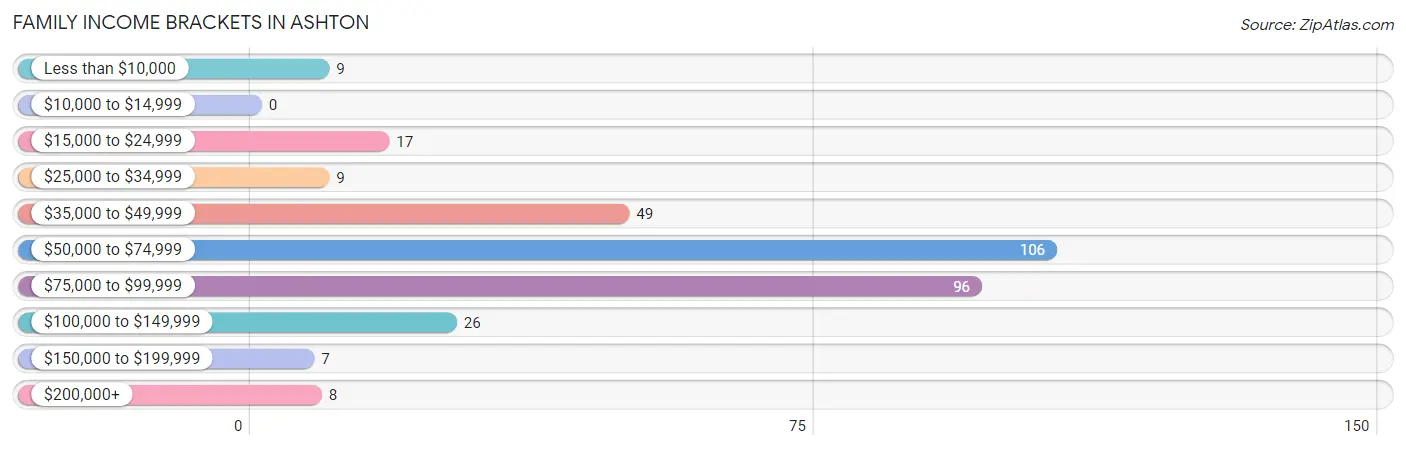
Family Income Brackets in Ashton
According to the Ashton family income data, there are 106 families falling into the $50,000 to $74,999 income range, which is the most common income bracket and makes up 32.4% of all families.
| Income Bracket | # Families | % Families |
| Less than $10,000 | 9 | 2.8% |
| $10,000 to $14,999 | 0 | 0.0% |
| $15,000 to $24,999 | 17 | 5.2% |
| $25,000 to $34,999 | 9 | 2.8% |
| $35,000 to $49,999 | 49 | 15.0% |
| $50,000 to $74,999 | 106 | 32.4% |
| $75,000 to $99,999 | 96 | 29.4% |
| $100,000 to $149,999 | 26 | 8.0% |
| $150,000 to $199,999 | 7 | 2.1% |
| $200,000+ | 8 | 2.4% |
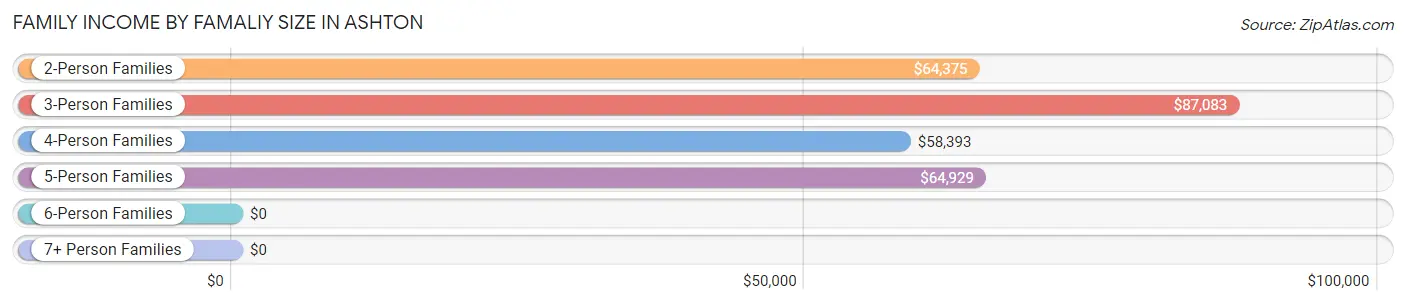
Family Income by Famaliy Size in Ashton
3-person families (59 | 18.0%) account for the highest median family income in Ashton with $87,083 per family, while 2-person families (132 | 40.4%) have the highest median income of $32,188 per family member.
| Income Bracket | # Families | Median Income |
| 2-Person Families | 132 (40.4%) | $64,375 |
| 3-Person Families | 59 (18.0%) | $87,083 |
| 4-Person Families | 25 (7.6%) | $58,393 |
| 5-Person Families | 86 (26.3%) | $64,929 |
| 6-Person Families | 10 (3.1%) | $0 |
| 7+ Person Families | 15 (4.6%) | $0 |
| Total | 327 (100.0%) | $67,792 |
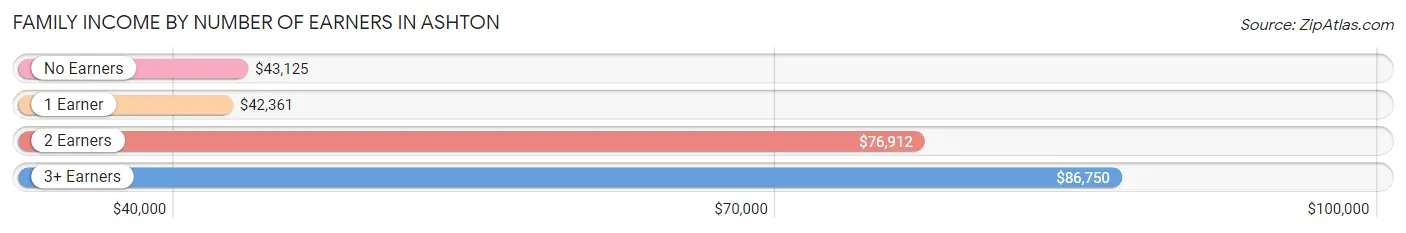
Family Income by Number of Earners in Ashton
The median family income in Ashton is $67,792, with families comprising 3+ earners (50) having the highest median family income of $86,750, while families with 1 earner (63) have the lowest median family income of $42,361, accounting for 15.3% and 19.3% of families, respectively.
| Number of Earners | # Families | Median Income |
| No Earners | 44 (13.5%) | $43,125 |
| 1 Earner | 63 (19.3%) | $42,361 |
| 2 Earners | 170 (52.0%) | $76,912 |
| 3+ Earners | 50 (15.3%) | $86,750 |
| Total | 327 (100.0%) | $67,792 |
Household Income in Ashton
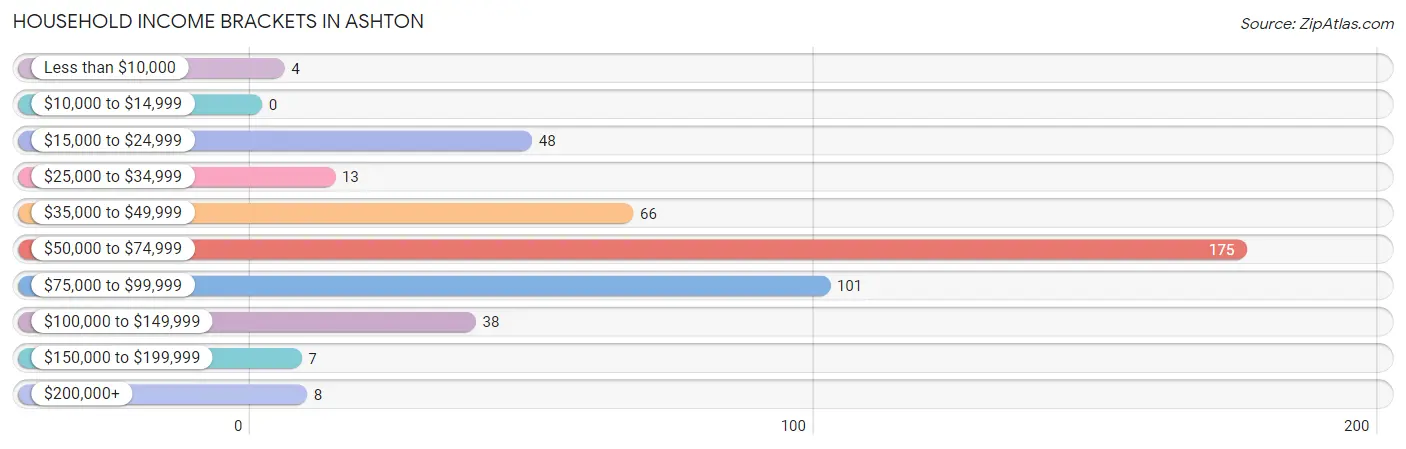
Household Income Brackets in Ashton
With 175 households falling in the category, the $50,000 to $74,999 income range is the most frequent in Ashton, accounting for 38.0% of all households.
| Income Bracket | # Households | % Households |
| Less than $10,000 | 4 | 0.9% |
| $10,000 to $14,999 | 0 | 0.0% |
| $15,000 to $24,999 | 48 | 10.4% |
| $25,000 to $34,999 | 13 | 2.8% |
| $35,000 to $49,999 | 66 | 14.3% |
| $50,000 to $74,999 | 175 | 38.0% |
| $75,000 to $99,999 | 101 | 22.0% |
| $100,000 to $149,999 | 38 | 8.3% |
| $150,000 to $199,999 | 7 | 1.5% |
| $200,000+ | 8 | 1.7% |
Household Income by Householder Age in Ashton
The median household income in Ashton is $62,819, with the highest median household income of $63,964 found in the 25 to 44 years age bracket for the primary householder. A total of 167 households (36.3%) fall into this category. Meanwhile, the 15 to 24 years age bracket for the primary householder has the lowest median household income of $0, with 30 households (6.5%) in this group.
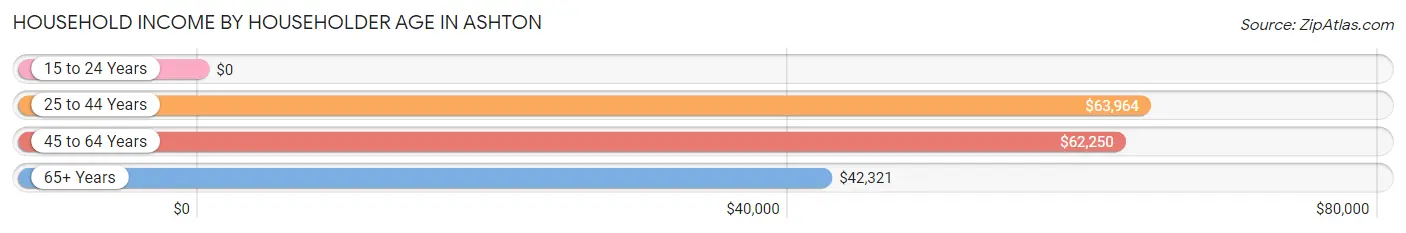
| Income Bracket | # Households | Median Income |
| 15 to 24 Years | 30 (6.5%) | $0 |
| 25 to 44 Years | 167 (36.3%) | $63,964 |
| 45 to 64 Years | 160 (34.8%) | $62,250 |
| 65+ Years | 103 (22.4%) | $42,321 |
| Total | 460 (100.0%) | $62,819 |
Poverty in Ashton
Income Below Poverty by Sex and Age in Ashton
With 4.9% poverty level for males and 7.2% for females among the residents of Ashton, 75 year old and over males and 5 year old females are the most vulnerable to poverty, with 13 males (54.2%) and 3 females (100.0%) in their respective age groups living below the poverty level.
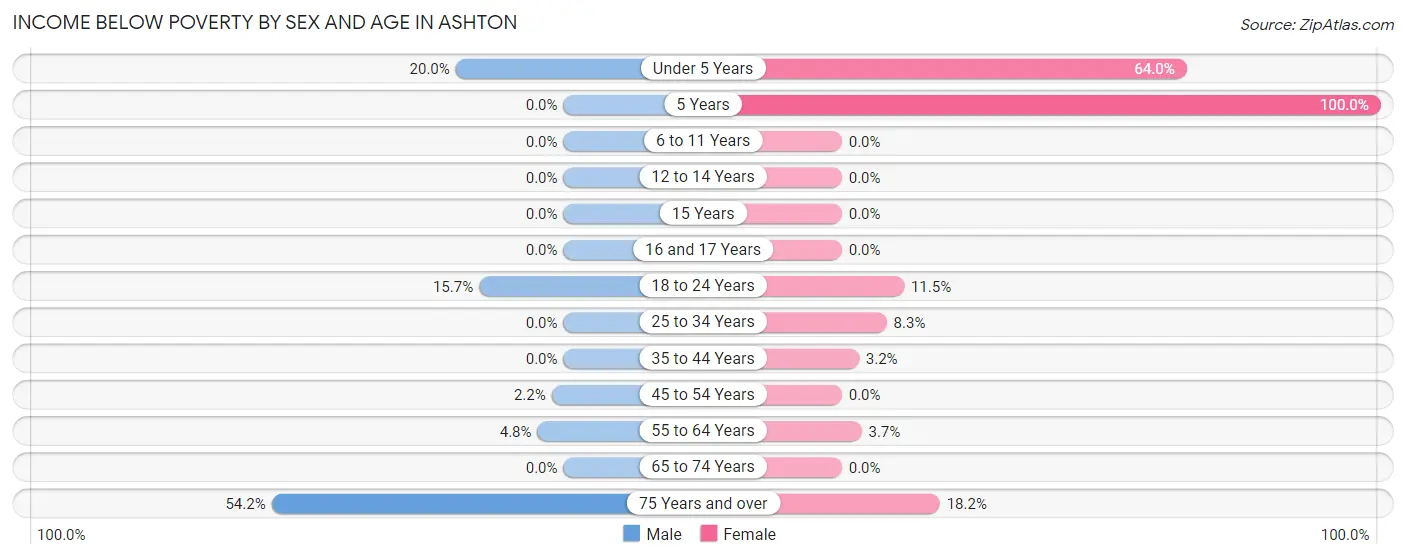
| Age Bracket | Male | Female |
| Under 5 Years | 3 (20.0%) | 16 (64.0%) |
| 5 Years | 0 (0.0%) | 3 (100.0%) |
| 6 to 11 Years | 0 (0.0%) | 0 (0.0%) |
| 12 to 14 Years | 0 (0.0%) | 0 (0.0%) |
| 15 Years | 0 (0.0%) | 0 (0.0%) |
| 16 and 17 Years | 0 (0.0%) | 0 (0.0%) |
| 18 to 24 Years | 13 (15.7%) | 6 (11.5%) |
| 25 to 34 Years | 0 (0.0%) | 4 (8.3%) |
| 35 to 44 Years | 0 (0.0%) | 4 (3.2%) |
| 45 to 54 Years | 3 (2.2%) | 0 (0.0%) |
| 55 to 64 Years | 4 (4.8%) | 3 (3.7%) |
| 65 to 74 Years | 0 (0.0%) | 0 (0.0%) |
| 75 Years and over | 13 (54.2%) | 8 (18.2%) |
| Total | 36 (4.9%) | 44 (7.2%) |
Income Above Poverty by Sex and Age in Ashton
According to the poverty statistics in Ashton, males aged 5 years and females aged 6 to 11 years are the age groups that are most secure financially, with 100.0% of males and 100.0% of females in these age groups living above the poverty line.
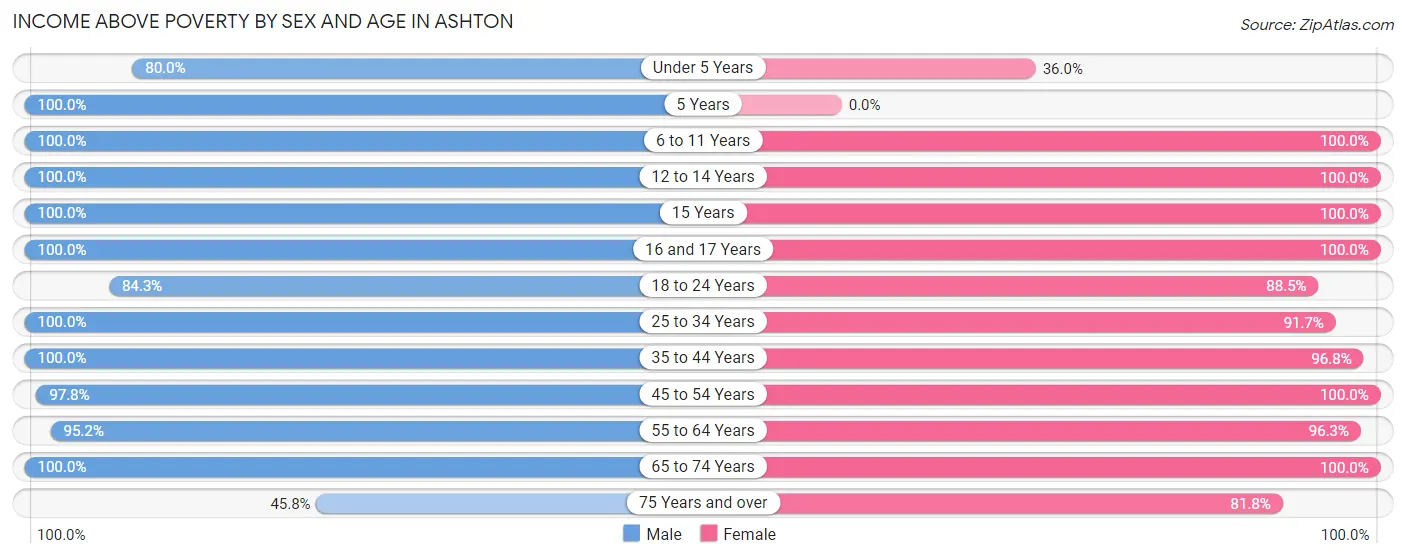
| Age Bracket | Male | Female |
| Under 5 Years | 12 (80.0%) | 9 (36.0%) |
| 5 Years | 1 (100.0%) | 0 (0.0%) |
| 6 to 11 Years | 63 (100.0%) | 89 (100.0%) |
| 12 to 14 Years | 93 (100.0%) | 7 (100.0%) |
| 15 Years | 3 (100.0%) | 10 (100.0%) |
| 16 and 17 Years | 10 (100.0%) | 14 (100.0%) |
| 18 to 24 Years | 70 (84.3%) | 46 (88.5%) |
| 25 to 34 Years | 43 (100.0%) | 44 (91.7%) |
| 35 to 44 Years | 102 (100.0%) | 122 (96.8%) |
| 45 to 54 Years | 134 (97.8%) | 73 (100.0%) |
| 55 to 64 Years | 79 (95.2%) | 79 (96.3%) |
| 65 to 74 Years | 79 (100.0%) | 35 (100.0%) |
| 75 Years and over | 11 (45.8%) | 36 (81.8%) |
| Total | 700 (95.1%) | 564 (92.8%) |
Income Below Poverty Among Married-Couple Families in Ashton
The poverty statistics for married-couple families in Ashton show that 6.9% or 20 of the total 292 families live below the poverty line. Families with no children have the highest poverty rate of 10.8%, comprising of 17 families. On the other hand, families with 1 or 2 children have the lowest poverty rate of 0.0%, which includes 0 families.
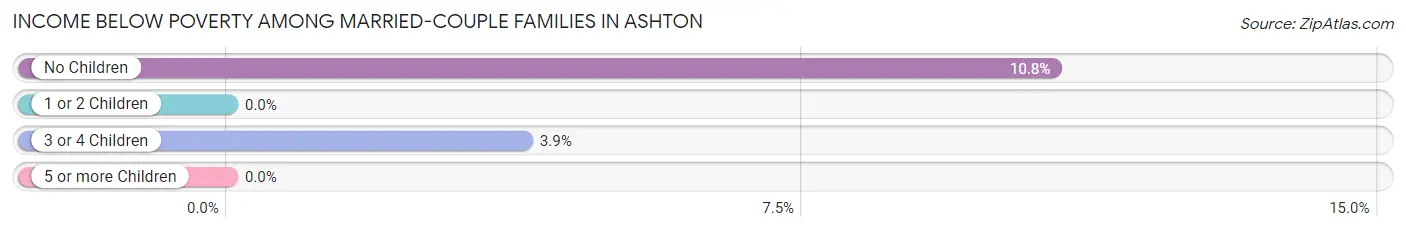
| Children | Above Poverty | Below Poverty |
| No Children | 141 (89.2%) | 17 (10.8%) |
| 1 or 2 Children | 49 (100.0%) | 0 (0.0%) |
| 3 or 4 Children | 75 (96.2%) | 3 (3.8%) |
| 5 or more Children | 7 (100.0%) | 0 (0.0%) |
| Total | 272 (93.1%) | 20 (6.9%) |
Income Below Poverty Among Single-Parent Households in Ashton
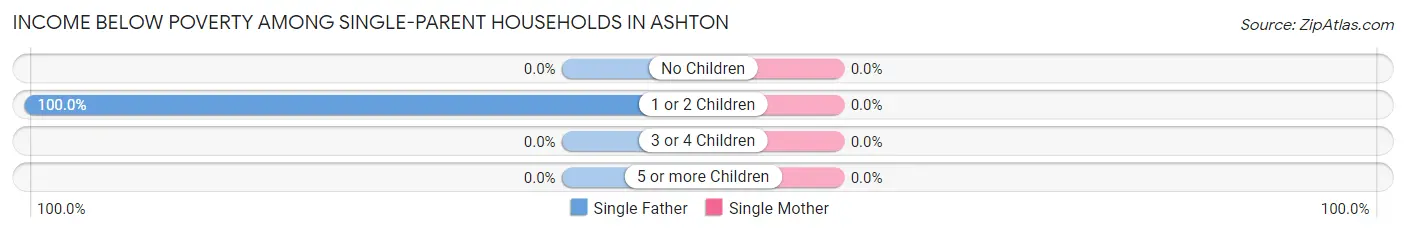
| Children | Single Father | Single Mother |
| No Children | 0 (0.0%) | 0 (0.0%) |
| 1 or 2 Children | 9 (100.0%) | 0 (0.0%) |
| 3 or 4 Children | 0 (0.0%) | 0 (0.0%) |
| 5 or more Children | 0 (0.0%) | 0 (0.0%) |
| Total | 9 (100.0%) | 0 (0.0%) |
Income Below Poverty Among Married-Couple vs Single-Parent Households in Ashton
The poverty data for Ashton shows that 20 of the married-couple family households (6.9%) and 9 of the single-parent households (25.7%) are living below the poverty level. Within the married-couple family households, those with no children have the highest poverty rate, with 17 households (10.8%) falling below the poverty line. Among the single-parent households, those with 1 or 2 children have the highest poverty rate, with 9 household (75.0%) living below poverty.
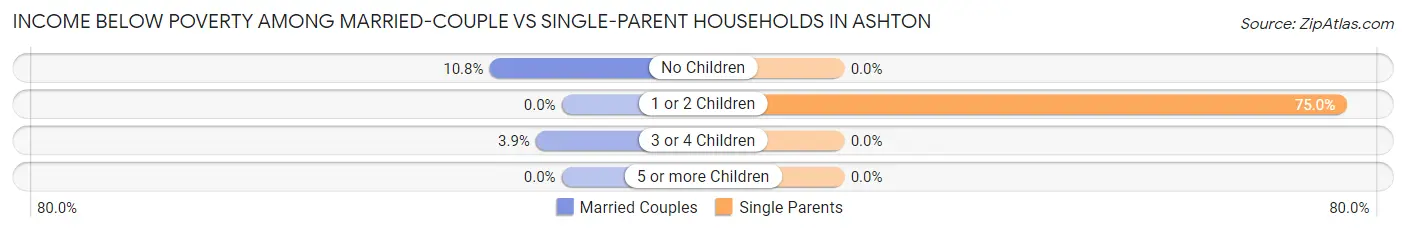
| Children | Married-Couple Families | Single-Parent Households |
| No Children | 17 (10.8%) | 0 (0.0%) |
| 1 or 2 Children | 0 (0.0%) | 9 (75.0%) |
| 3 or 4 Children | 3 (3.8%) | 0 (0.0%) |
| 5 or more Children | 0 (0.0%) | 0 (0.0%) |
| Total | 20 (6.9%) | 9 (25.7%) |
Race in Ashton
The most populous races in Ashton are White / Caucasian (1,171 | 85.7%), Two or more Races (177 | 13.0%), and Hispanic or Latino (170 | 12.4%).
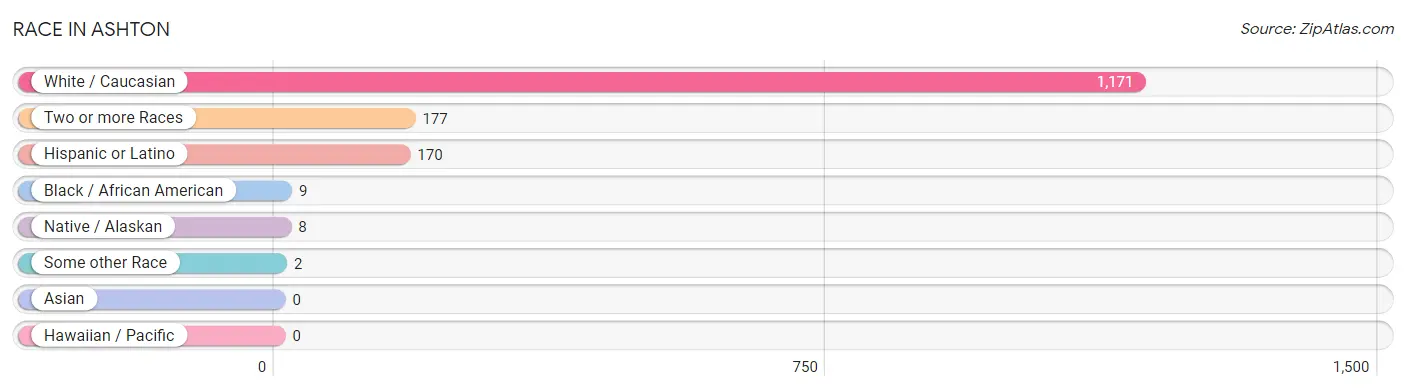
| Race | # Population | % Population |
| Asian | 0 | 0.0% |
| Black / African American | 9 | 0.7% |
| Hawaiian / Pacific | 0 | 0.0% |
| Hispanic or Latino | 170 | 12.4% |
| Native / Alaskan | 8 | 0.6% |
| White / Caucasian | 1,171 | 85.7% |
| Two or more Races | 177 | 13.0% |
| Some other Race | 2 | 0.2% |
| Total | 1,367 | 100.0% |
Ancestry in Ashton
The most populous ancestries reported in Ashton are Irish (425 | 31.1%), German (408 | 29.8%), English (211 | 15.4%), Mexican (158 | 11.6%), and American (80 | 5.9%), together accounting for 93.8% of all Ashton residents.
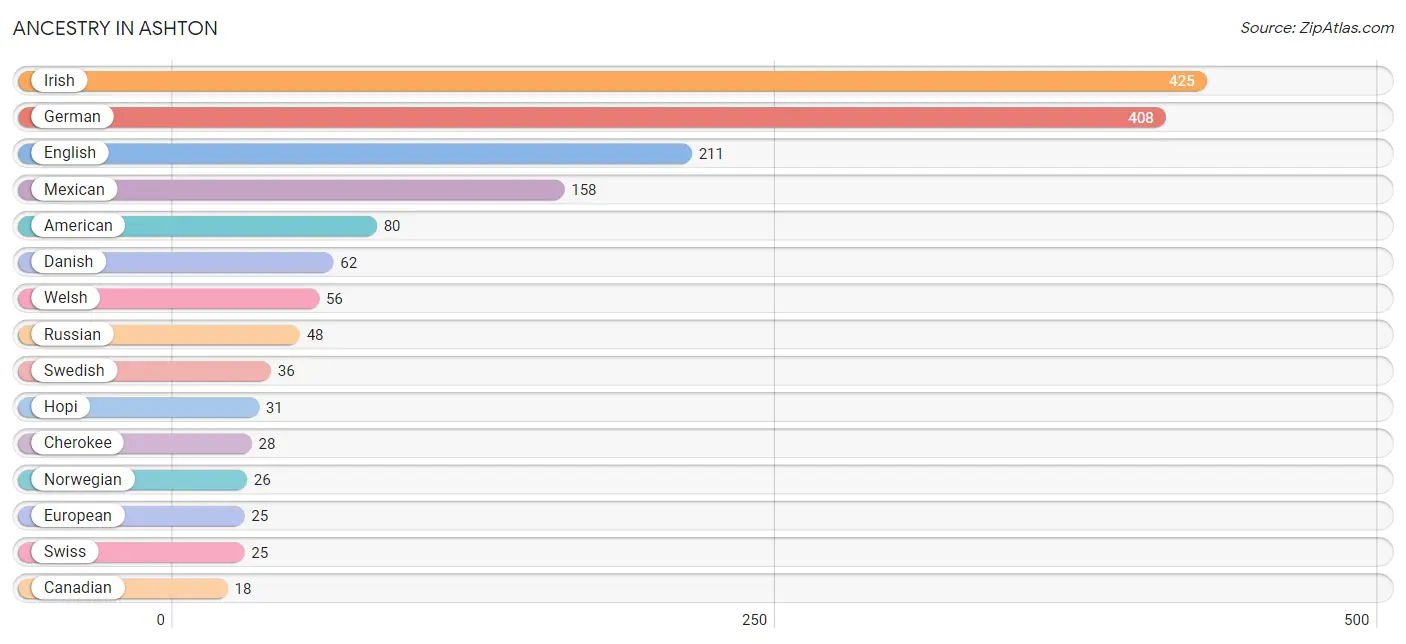
| Ancestry | # Population | % Population |
| African | 9 | 0.7% |
| American | 80 | 5.9% |
| Canadian | 18 | 1.3% |
| Cherokee | 28 | 2.1% |
| Danish | 62 | 4.5% |
| Dutch | 18 | 1.3% |
| English | 211 | 15.4% |
| European | 25 | 1.8% |
| French | 6 | 0.4% |
| German | 408 | 29.8% |
| Hopi | 31 | 2.3% |
| Irish | 425 | 31.1% |
| Mexican | 158 | 11.6% |
| Northern European | 14 | 1.0% |
| Norwegian | 26 | 1.9% |
| Polish | 6 | 0.4% |
| Russian | 48 | 3.5% |
| Scotch-Irish | 7 | 0.5% |
| Scottish | 18 | 1.3% |
| Serbian | 5 | 0.4% |
| Subsaharan African | 9 | 0.7% |
| Swedish | 36 | 2.6% |
| Swiss | 25 | 1.8% |
| Welsh | 56 | 4.1% | View All 24 Rows |
Immigrants in Ashton
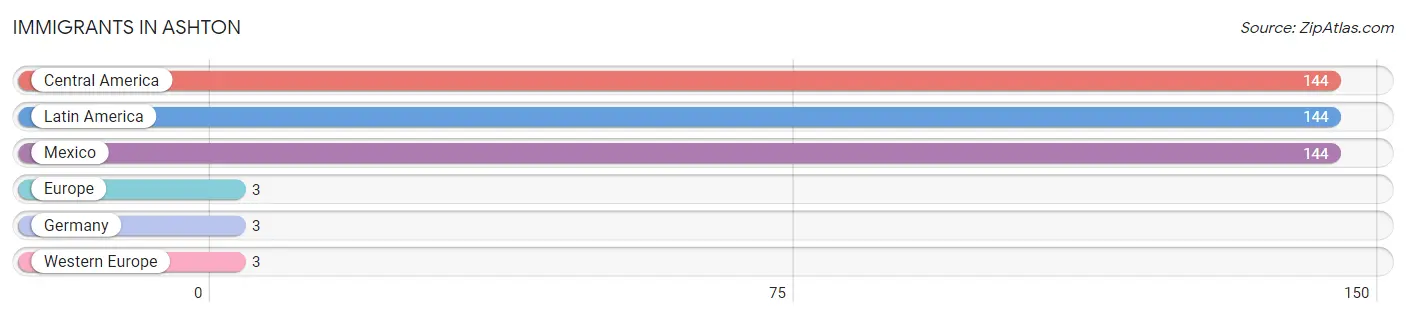
The most numerous immigrant groups reported in Ashton came from Central America (144 | 10.5%), Latin America (144 | 10.5%), Mexico (144 | 10.5%), Europe (3 | 0.2%), and Germany (3 | 0.2%), together accounting for 32.0% of all Ashton residents.
| Immigration Origin | # Population | % Population |
| Central America | 144 | 10.5% |
| Europe | 3 | 0.2% |
| Germany | 3 | 0.2% |
| Latin America | 144 | 10.5% |
| Mexico | 144 | 10.5% |
| Western Europe | 3 | 0.2% | View All 6 Rows |
Sex and Age in Ashton
Sex and Age in Ashton
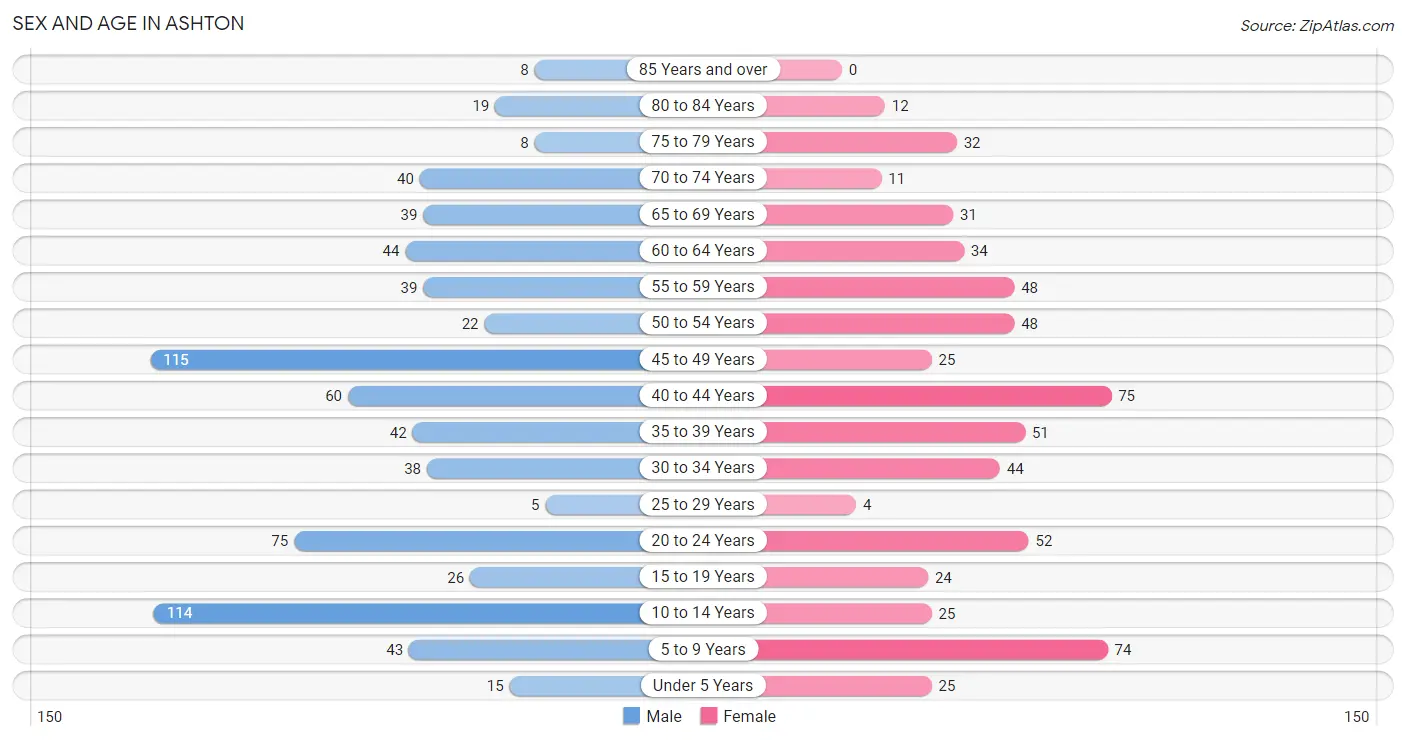
The most populous age groups in Ashton are 45 to 49 Years (115 | 15.3%) for men and 40 to 44 Years (75 | 12.2%) for women.
| Age Bracket | Male | Female |
| Under 5 Years | 15 (2.0%) | 25 (4.1%) |
| 5 to 9 Years | 43 (5.7%) | 74 (12.0%) |
| 10 to 14 Years | 114 (15.2%) | 25 (4.1%) |
| 15 to 19 Years | 26 (3.5%) | 24 (3.9%) |
| 20 to 24 Years | 75 (10.0%) | 52 (8.5%) |
| 25 to 29 Years | 5 (0.7%) | 4 (0.6%) |
| 30 to 34 Years | 38 (5.1%) | 44 (7.1%) |
| 35 to 39 Years | 42 (5.6%) | 51 (8.3%) |
| 40 to 44 Years | 60 (8.0%) | 75 (12.2%) |
| 45 to 49 Years | 115 (15.3%) | 25 (4.1%) |
| 50 to 54 Years | 22 (2.9%) | 48 (7.8%) |
| 55 to 59 Years | 39 (5.2%) | 48 (7.8%) |
| 60 to 64 Years | 44 (5.9%) | 34 (5.5%) |
| 65 to 69 Years | 39 (5.2%) | 31 (5.0%) |
| 70 to 74 Years | 40 (5.3%) | 11 (1.8%) |
| 75 to 79 Years | 8 (1.1%) | 32 (5.2%) |
| 80 to 84 Years | 19 (2.5%) | 12 (1.9%) |
| 85 Years and over | 8 (1.1%) | 0 (0.0%) |
| Total | 752 (100.0%) | 615 (100.0%) |
Families and Households in Ashton
Median Family Size in Ashton
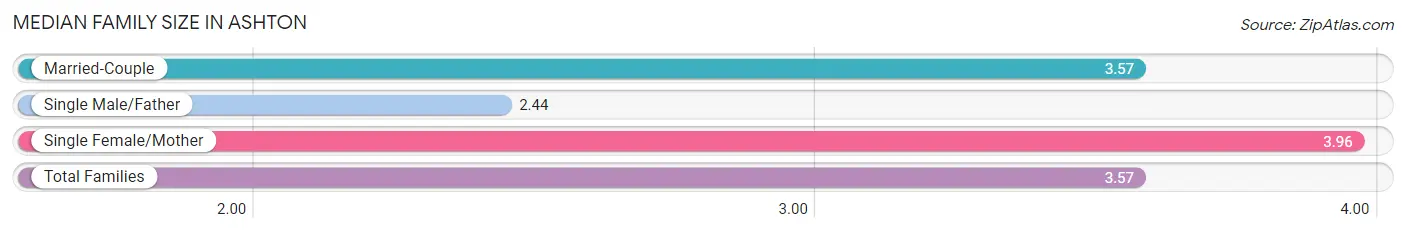
The median family size in Ashton is 3.57 persons per family, with single female/mother families (26 | 8.0%) accounting for the largest median family size of 3.96 persons per family. On the other hand, single male/father families (9 | 2.8%) represent the smallest median family size with 2.44 persons per family.
| Family Type | # Families | Family Size |
| Married-Couple | 292 (89.3%) | 3.57 |
| Single Male/Father | 9 (2.8%) | 2.44 |
| Single Female/Mother | 26 (8.0%) | 3.96 |
| Total Families | 327 (100.0%) | 3.57 |
Median Household Size in Ashton
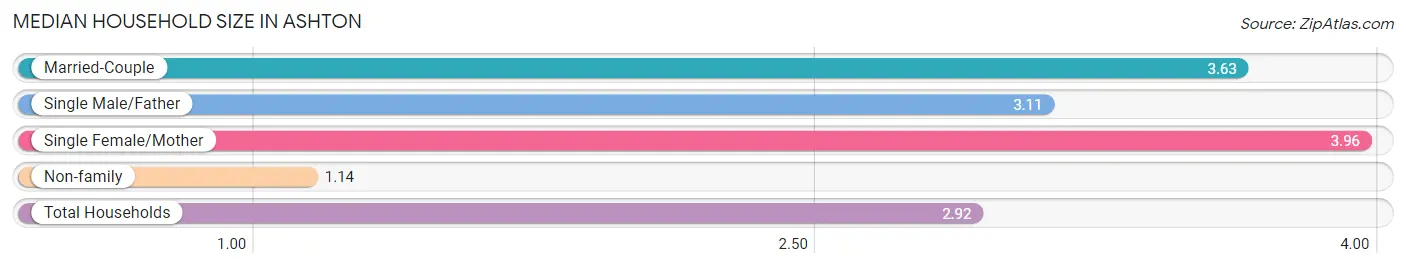
The median household size in Ashton is 2.92 persons per household, with single female/mother households (26 | 5.7%) accounting for the largest median household size of 3.96 persons per household. non-family households (133 | 28.9%) represent the smallest median household size with 1.14 persons per household.
| Household Type | # Households | Household Size |
| Married-Couple | 292 (63.5%) | 3.63 |
| Single Male/Father | 9 (2.0%) | 3.11 |
| Single Female/Mother | 26 (5.7%) | 3.96 |
| Non-family | 133 (28.9%) | 1.14 |
| Total Households | 460 (100.0%) | 2.92 |
Household Size by Marriage Status in Ashton
Out of a total of 460 households in Ashton, 327 (71.1%) are family households, while 133 (28.9%) are nonfamily households. The most numerous type of family households are 2-person households, comprising 132, and the most common type of nonfamily households are 1-person households, comprising 113.
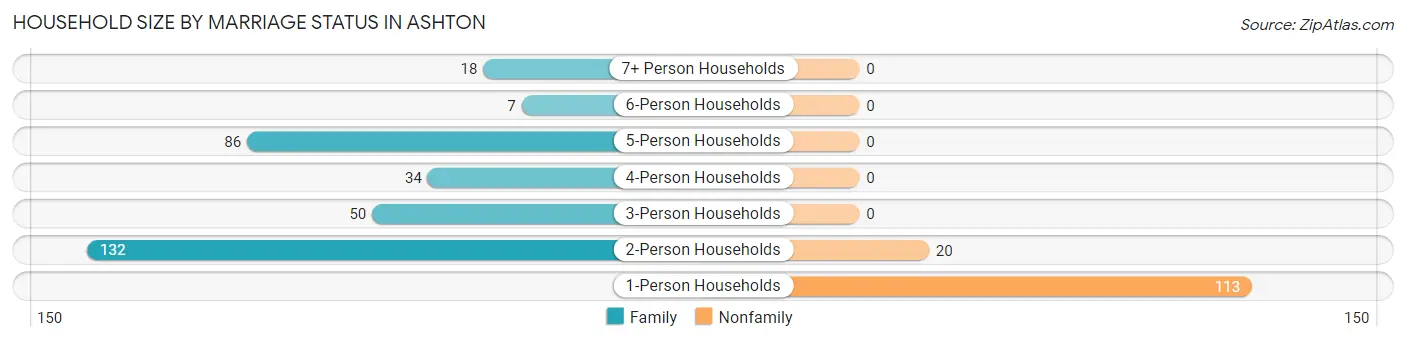
| Household Size | Family Households | Nonfamily Households |
| 1-Person Households | - | 113 (24.6%) |
| 2-Person Households | 132 (28.7%) | 20 (4.3%) |
| 3-Person Households | 50 (10.9%) | 0 (0.0%) |
| 4-Person Households | 34 (7.4%) | 0 (0.0%) |
| 5-Person Households | 86 (18.7%) | 0 (0.0%) |
| 6-Person Households | 7 (1.5%) | 0 (0.0%) |
| 7+ Person Households | 18 (3.9%) | 0 (0.0%) |
| Total | 327 (71.1%) | 133 (28.9%) |
Female Fertility in Ashton
Fertility by Age in Ashton
Average fertility rate in Ashton is 62.0 births per 1,000 women. Women in the age bracket of 20 to 34 years have the highest fertility rate with 170.0 births per 1,000 women. Women in the age bracket of 20 to 34 years acount for 100.0% of all women with births.
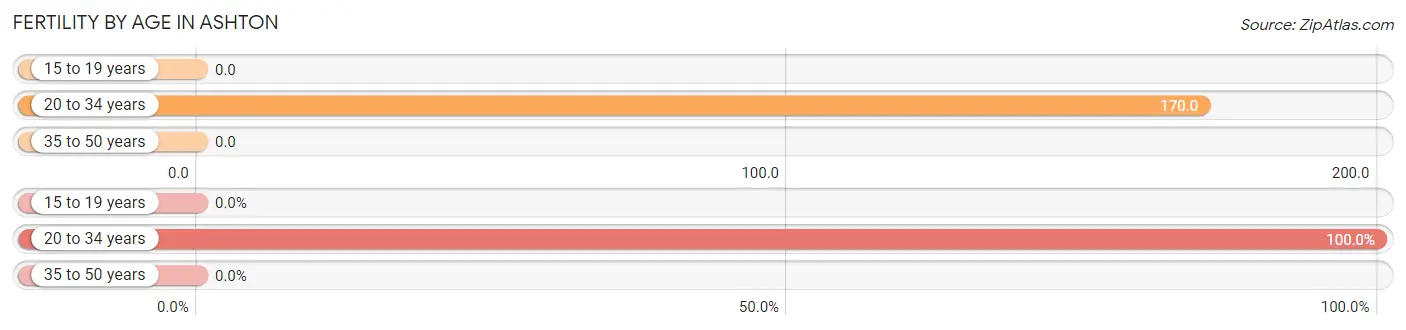
| Age Bracket | Women with Births | Births / 1,000 Women |
| 15 to 19 years | 0 (0.0%) | 0.0 |
| 20 to 34 years | 17 (100.0%) | 170.0 |
| 35 to 50 years | 0 (0.0%) | 0.0 |
| Total | 17 (100.0%) | 62.0 |
Fertility by Age by Marriage Status in Ashton
41.2% of women with births (17) in Ashton are married. The highest percentage of unmarried women with births falls into 20 to 34 years age bracket with 58.8% of them unmarried at the time of birth, while the lowest percentage of unmarried women with births belong to 20 to 34 years age bracket with 58.8% of them unmarried.
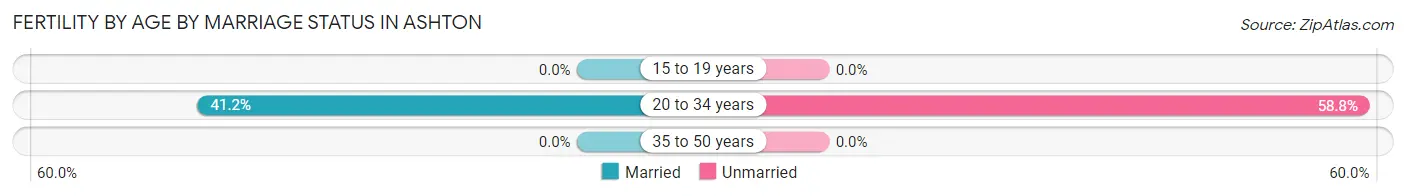
| Age Bracket | Married | Unmarried |
| 15 to 19 years | 0 (0.0%) | 0 (0.0%) |
| 20 to 34 years | 7 (41.2%) | 10 (58.8%) |
| 35 to 50 years | 0 (0.0%) | 0 (0.0%) |
| Total | 7 (41.2%) | 10 (58.8%) |
Fertility by Education in Ashton
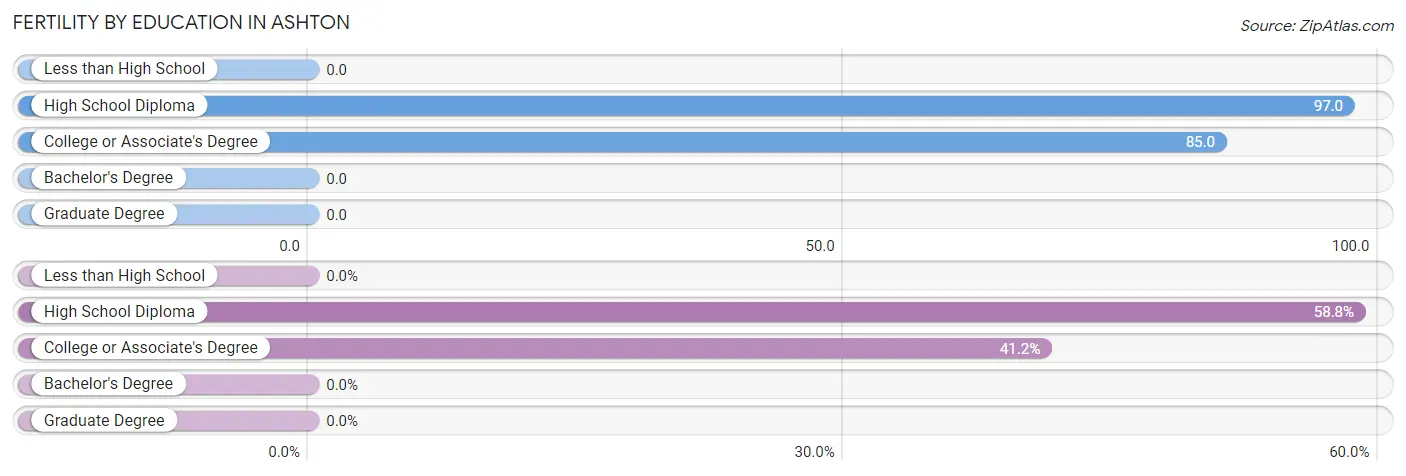
| Educational Attainment | Women with Births | Births / 1,000 Women |
| Less than High School | 0 (0.0%) | 0.0 |
| High School Diploma | 10 (58.8%) | 97.0 |
| College or Associate's Degree | 7 (41.2%) | 85.0 |
| Bachelor's Degree | 0 (0.0%) | 0.0 |
| Graduate Degree | 0 (0.0%) | 0.0 |
| Total | 17 (100.0%) | 62.0 |
Fertility by Education by Marriage Status in Ashton
58.8% of women with births in Ashton are unmarried. Women with the educational attainment of college or associate's degree are most likely to be married with 100.0% of them married at childbirth, while women with the educational attainment of high school diploma are least likely to be married with 100.0% of them unmarried at childbirth.
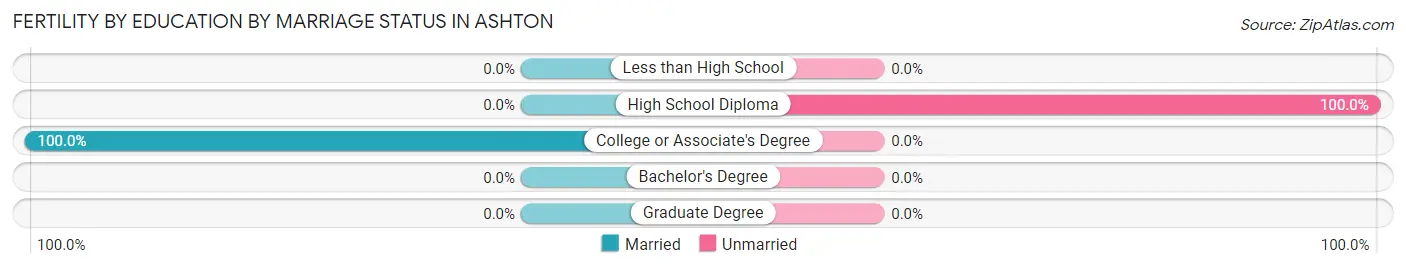
| Educational Attainment | Married | Unmarried |
| Less than High School | 0 (0.0%) | 0 (0.0%) |
| High School Diploma | 0 (0.0%) | 10 (100.0%) |
| College or Associate's Degree | 7 (100.0%) | 0 (0.0%) |
| Bachelor's Degree | 0 (0.0%) | 0 (0.0%) |
| Graduate Degree | 0 (0.0%) | 0 (0.0%) |
| Total | 7 (41.2%) | 10 (58.8%) |
Employment Characteristics in Ashton
Employment by Class of Employer in Ashton
Among the 635 employed individuals in Ashton, private company employees (339 | 53.4%), state government employees (147 | 23.2%), and not-for-profit organizations (69 | 10.9%) make up the most common classes of employment.
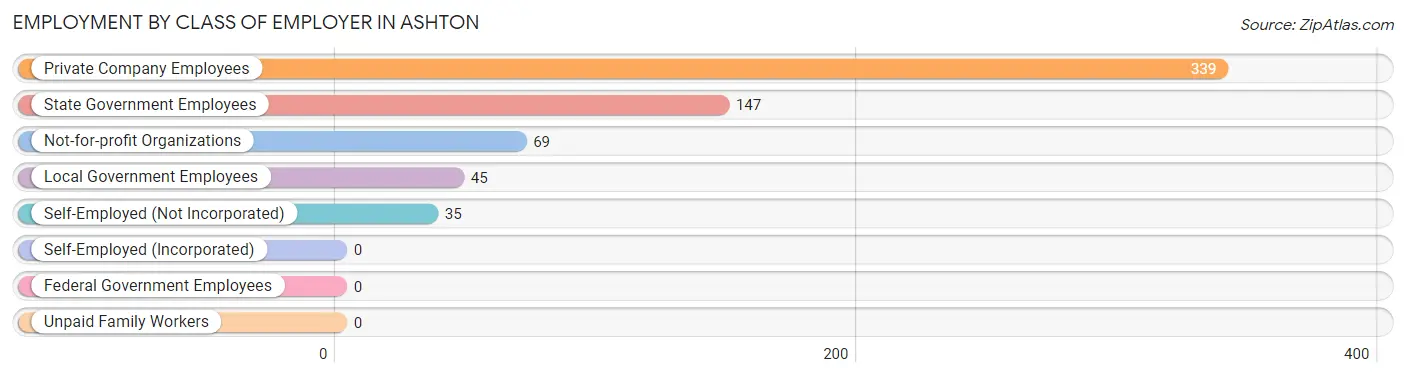
| Employer Class | # Employees | % Employees |
| Private Company Employees | 339 | 53.4% |
| Self-Employed (Incorporated) | 0 | 0.0% |
| Self-Employed (Not Incorporated) | 35 | 5.5% |
| Not-for-profit Organizations | 69 | 10.9% |
| Local Government Employees | 45 | 7.1% |
| State Government Employees | 147 | 23.2% |
| Federal Government Employees | 0 | 0.0% |
| Unpaid Family Workers | 0 | 0.0% |
| Total | 635 | 100.0% |
Employment Status by Age in Ashton
According to the labor force statistics for Ashton, out of the total population over 16 years of age (1,058), 66.7% or 706 individuals are in the labor force, with 8.8% or 62 of them unemployed. The age group with the highest labor force participation rate is 30 to 34 years, with 91.5% or 75 individuals in the labor force. Within the labor force, the 20 to 24 years age range has the highest percentage of unemployed individuals, with 32.3% or 30 of them being unemployed.
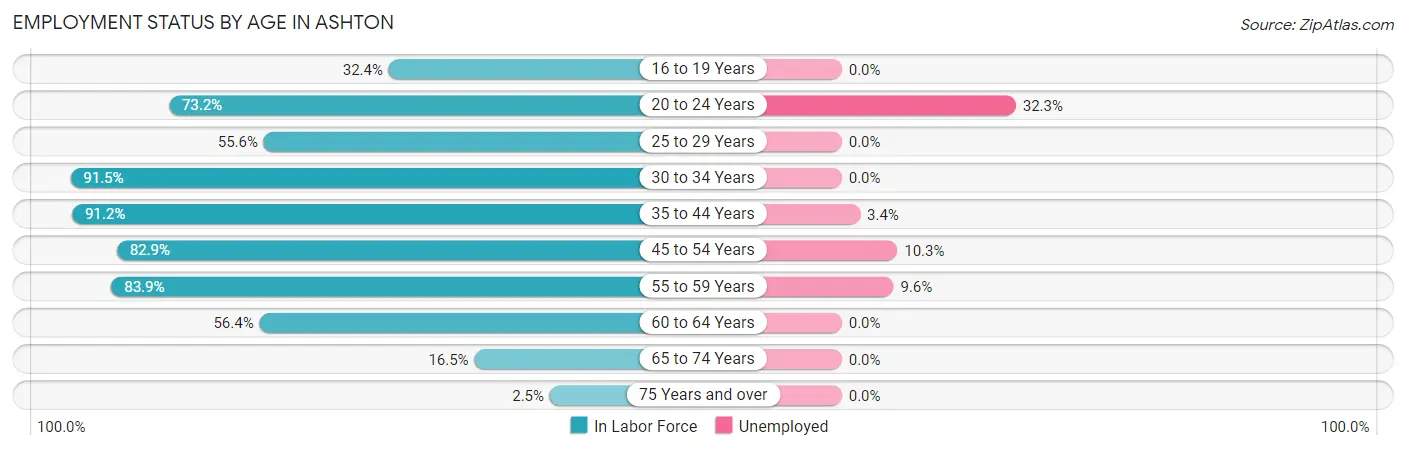
| Age Bracket | In Labor Force | Unemployed |
| 16 to 19 Years | 12 (32.4%) | 0 (0.0%) |
| 20 to 24 Years | 93 (73.2%) | 30 (32.3%) |
| 25 to 29 Years | 5 (55.6%) | 0 (0.0%) |
| 30 to 34 Years | 75 (91.5%) | 0 (0.0%) |
| 35 to 44 Years | 208 (91.2%) | 7 (3.4%) |
| 45 to 54 Years | 174 (82.9%) | 18 (10.3%) |
| 55 to 59 Years | 73 (83.9%) | 7 (9.6%) |
| 60 to 64 Years | 44 (56.4%) | 0 (0.0%) |
| 65 to 74 Years | 20 (16.5%) | 0 (0.0%) |
| 75 Years and over | 2 (2.5%) | 0 (0.0%) |
| Total | 706 (66.7%) | 62 (8.8%) |
Employment Status by Educational Attainment in Ashton
According to labor force statistics for Ashton, 83.4% of individuals (579) out of the total population between 25 and 64 years of age (694) are in the labor force, with 5.5% or 32 of them being unemployed. The group with the highest labor force participation rate are those with the educational attainment of less than high school, with 95.7% or 90 individuals in the labor force. Within the labor force, individuals with high school diploma education have the highest percentage of unemployment, with 13.6% or 25 of them being unemployed.
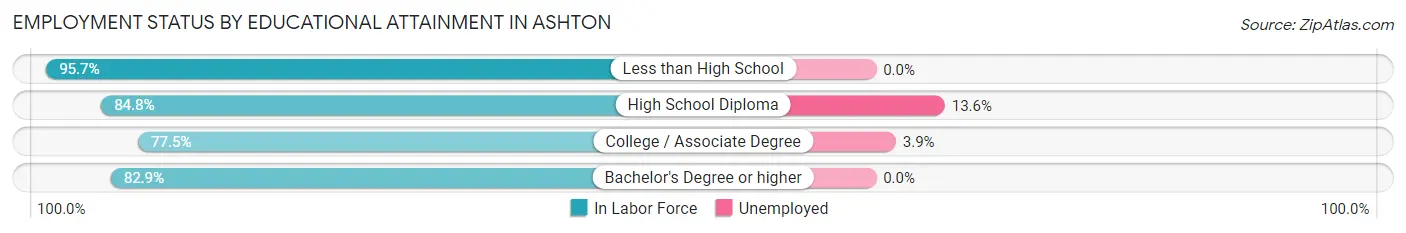
| Educational Attainment | In Labor Force | Unemployed |
| Less than High School | 90 (95.7%) | 0 (0.0%) |
| High School Diploma | 184 (84.8%) | 30 (13.6%) |
| College / Associate Degree | 179 (77.5%) | 9 (3.9%) |
| Bachelor's Degree or higher | 126 (82.9%) | 0 (0.0%) |
| Total | 579 (83.4%) | 38 (5.5%) |
Employment Occupations by Sex in Ashton
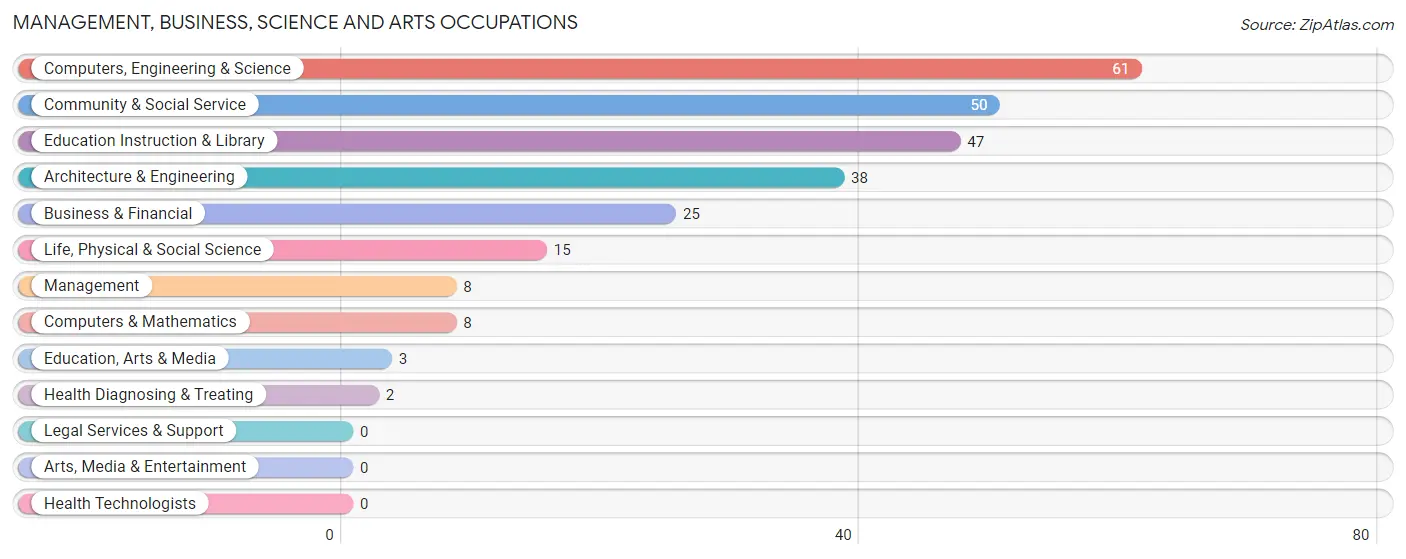
Management, Business, Science and Arts Occupations
The most common Management, Business, Science and Arts occupations in Ashton are Computers, Engineering & Science (61 | 9.5%), Community & Social Service (50 | 7.8%), Education Instruction & Library (47 | 7.3%), Architecture & Engineering (38 | 5.9%), and Business & Financial (25 | 3.9%).
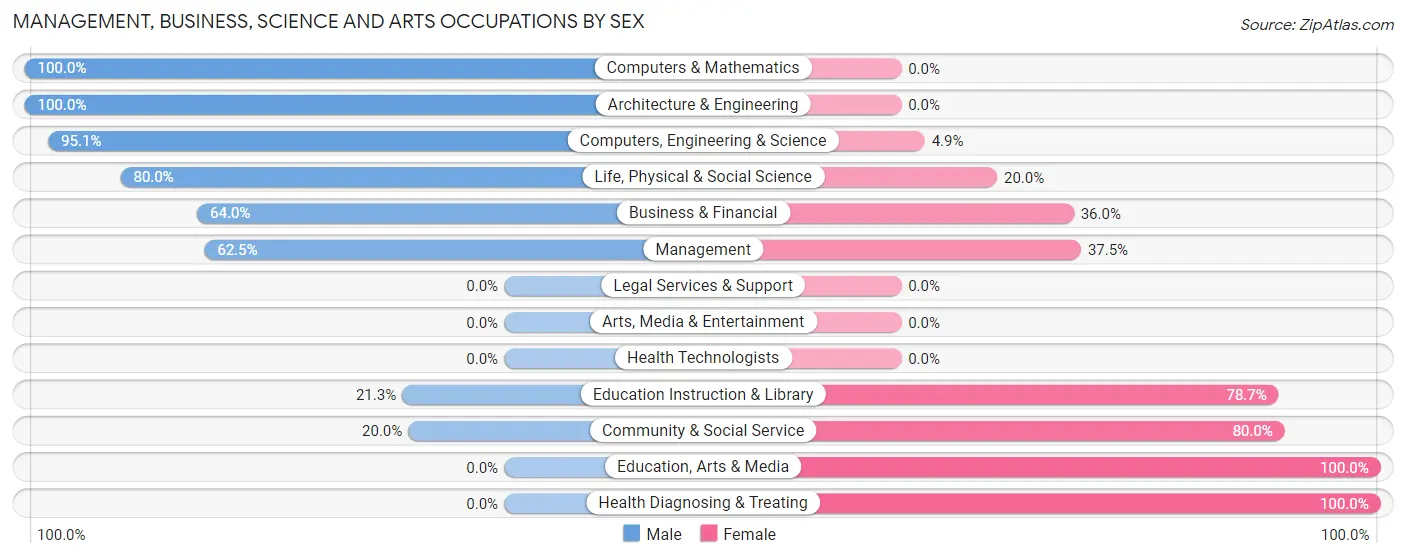
Management, Business, Science and Arts Occupations by Sex
Within the Management, Business, Science and Arts occupations in Ashton, the most male-oriented occupations are Computers & Mathematics (100.0%), Architecture & Engineering (100.0%), and Computers, Engineering & Science (95.1%), while the most female-oriented occupations are Education, Arts & Media (100.0%), Health Diagnosing & Treating (100.0%), and Community & Social Service (80.0%).
| Occupation | Male | Female |
| Management | 5 (62.5%) | 3 (37.5%) |
| Business & Financial | 16 (64.0%) | 9 (36.0%) |
| Computers, Engineering & Science | 58 (95.1%) | 3 (4.9%) |
| Computers & Mathematics | 8 (100.0%) | 0 (0.0%) |
| Architecture & Engineering | 38 (100.0%) | 0 (0.0%) |
| Life, Physical & Social Science | 12 (80.0%) | 3 (20.0%) |
| Community & Social Service | 10 (20.0%) | 40 (80.0%) |
| Education, Arts & Media | 0 (0.0%) | 3 (100.0%) |
| Legal Services & Support | 0 (0.0%) | 0 (0.0%) |
| Education Instruction & Library | 10 (21.3%) | 37 (78.7%) |
| Arts, Media & Entertainment | 0 (0.0%) | 0 (0.0%) |
| Health Diagnosing & Treating | 0 (0.0%) | 2 (100.0%) |
| Health Technologists | 0 (0.0%) | 0 (0.0%) |
| Total (Category) | 89 (61.0%) | 57 (39.0%) |
| Total (Overall) | 365 (56.7%) | 279 (43.3%) |
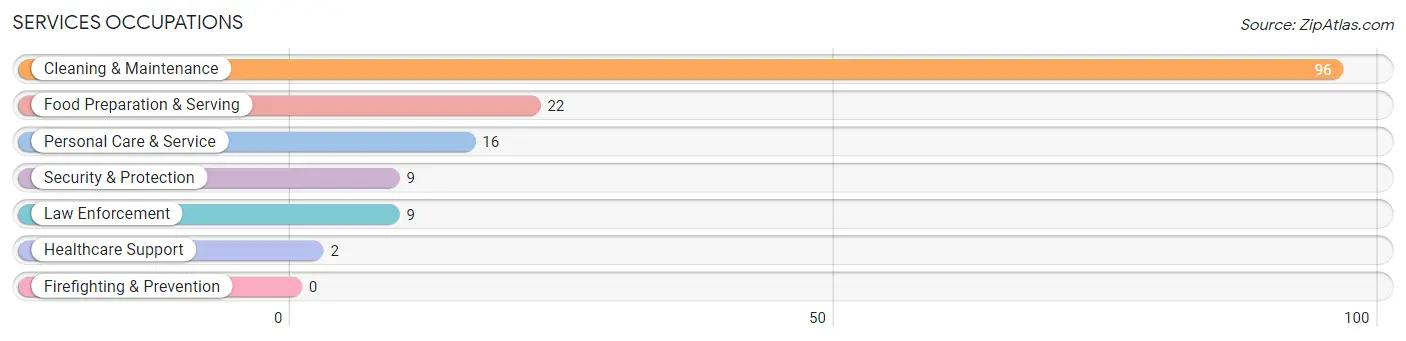
Services Occupations
The most common Services occupations in Ashton are Cleaning & Maintenance (96 | 14.9%), Food Preparation & Serving (22 | 3.4%), Personal Care & Service (16 | 2.5%), Security & Protection (9 | 1.4%), and Law Enforcement (9 | 1.4%).
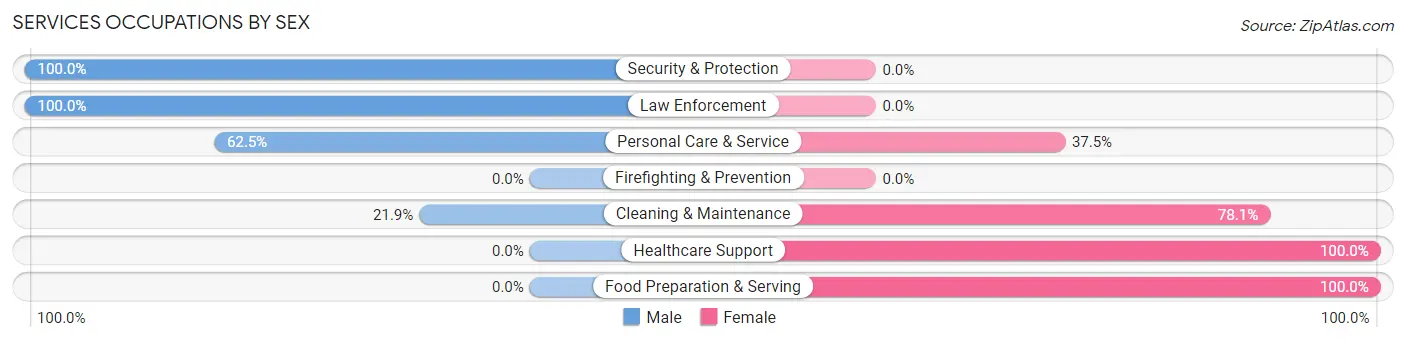
Services Occupations by Sex
Within the Services occupations in Ashton, the most male-oriented occupations are Security & Protection (100.0%), Law Enforcement (100.0%), and Personal Care & Service (62.5%), while the most female-oriented occupations are Healthcare Support (100.0%), Food Preparation & Serving (100.0%), and Cleaning & Maintenance (78.1%).
| Occupation | Male | Female |
| Healthcare Support | 0 (0.0%) | 2 (100.0%) |
| Security & Protection | 9 (100.0%) | 0 (0.0%) |
| Firefighting & Prevention | 0 (0.0%) | 0 (0.0%) |
| Law Enforcement | 9 (100.0%) | 0 (0.0%) |
| Food Preparation & Serving | 0 (0.0%) | 22 (100.0%) |
| Cleaning & Maintenance | 21 (21.9%) | 75 (78.1%) |
| Personal Care & Service | 10 (62.5%) | 6 (37.5%) |
| Total (Category) | 40 (27.6%) | 105 (72.4%) |
| Total (Overall) | 365 (56.7%) | 279 (43.3%) |
Sales and Office Occupations
The most common Sales and Office occupations in Ashton are Office & Administration (71 | 11.0%), and Sales & Related (42 | 6.5%).
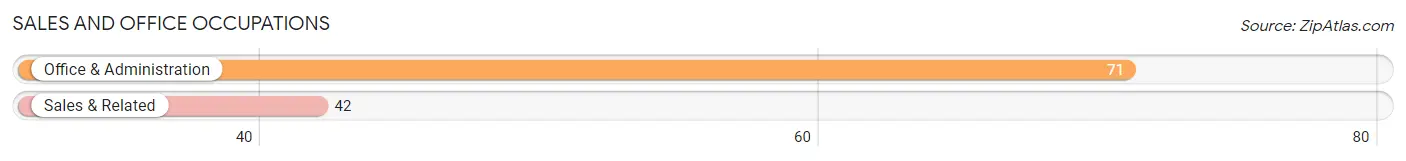
Sales and Office Occupations by Sex
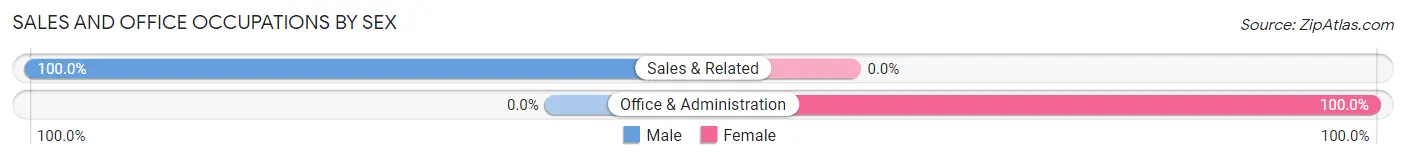
| Occupation | Male | Female |
| Sales & Related | 42 (100.0%) | 0 (0.0%) |
| Office & Administration | 0 (0.0%) | 71 (100.0%) |
| Total (Category) | 42 (37.2%) | 71 (62.8%) |
| Total (Overall) | 365 (56.7%) | 279 (43.3%) |
Natural Resources, Construction and Maintenance Occupations
The most common Natural Resources, Construction and Maintenance occupations in Ashton are Construction & Extraction (54 | 8.4%), Installation, Maintenance & Repair (46 | 7.1%), and Farming, Fishing & Forestry (27 | 4.2%).
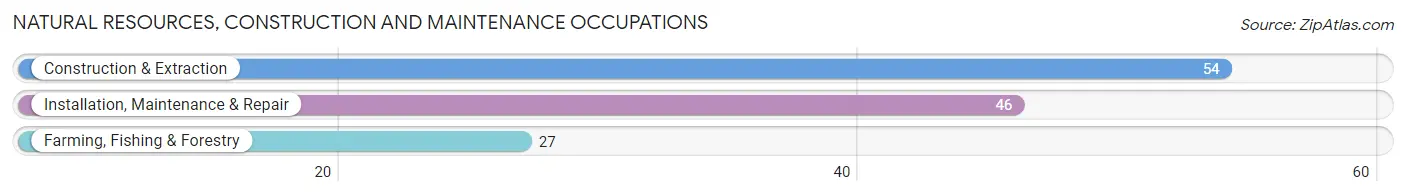
Natural Resources, Construction and Maintenance Occupations by Sex
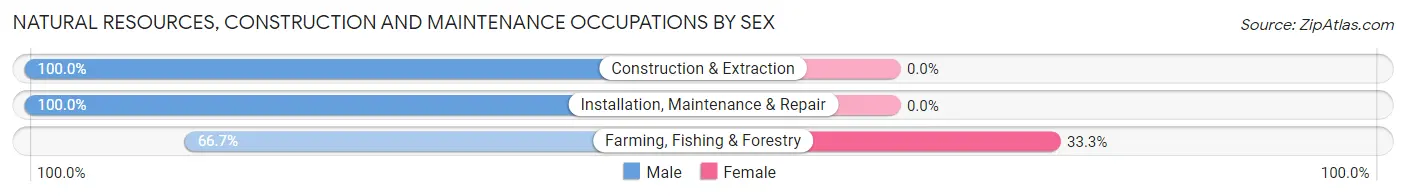
| Occupation | Male | Female |
| Farming, Fishing & Forestry | 18 (66.7%) | 9 (33.3%) |
| Construction & Extraction | 54 (100.0%) | 0 (0.0%) |
| Installation, Maintenance & Repair | 46 (100.0%) | 0 (0.0%) |
| Total (Category) | 118 (92.9%) | 9 (7.1%) |
| Total (Overall) | 365 (56.7%) | 279 (43.3%) |
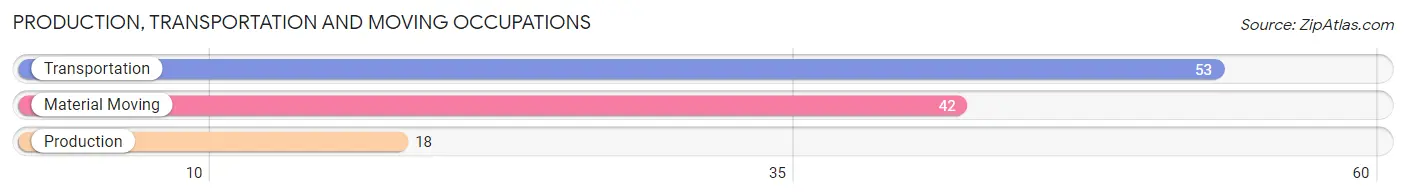
Production, Transportation and Moving Occupations
The most common Production, Transportation and Moving occupations in Ashton are Transportation (53 | 8.2%), Material Moving (42 | 6.5%), and Production (18 | 2.8%).
Production, Transportation and Moving Occupations by Sex
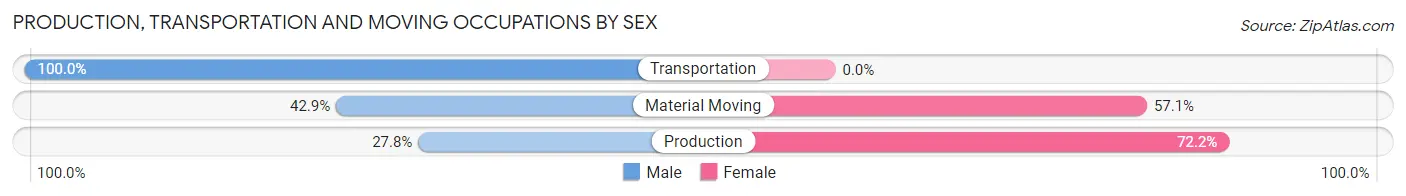
| Occupation | Male | Female |
| Production | 5 (27.8%) | 13 (72.2%) |
| Transportation | 53 (100.0%) | 0 (0.0%) |
| Material Moving | 18 (42.9%) | 24 (57.1%) |
| Total (Category) | 76 (67.3%) | 37 (32.7%) |
| Total (Overall) | 365 (56.7%) | 279 (43.3%) |
Employment Industries by Sex in Ashton
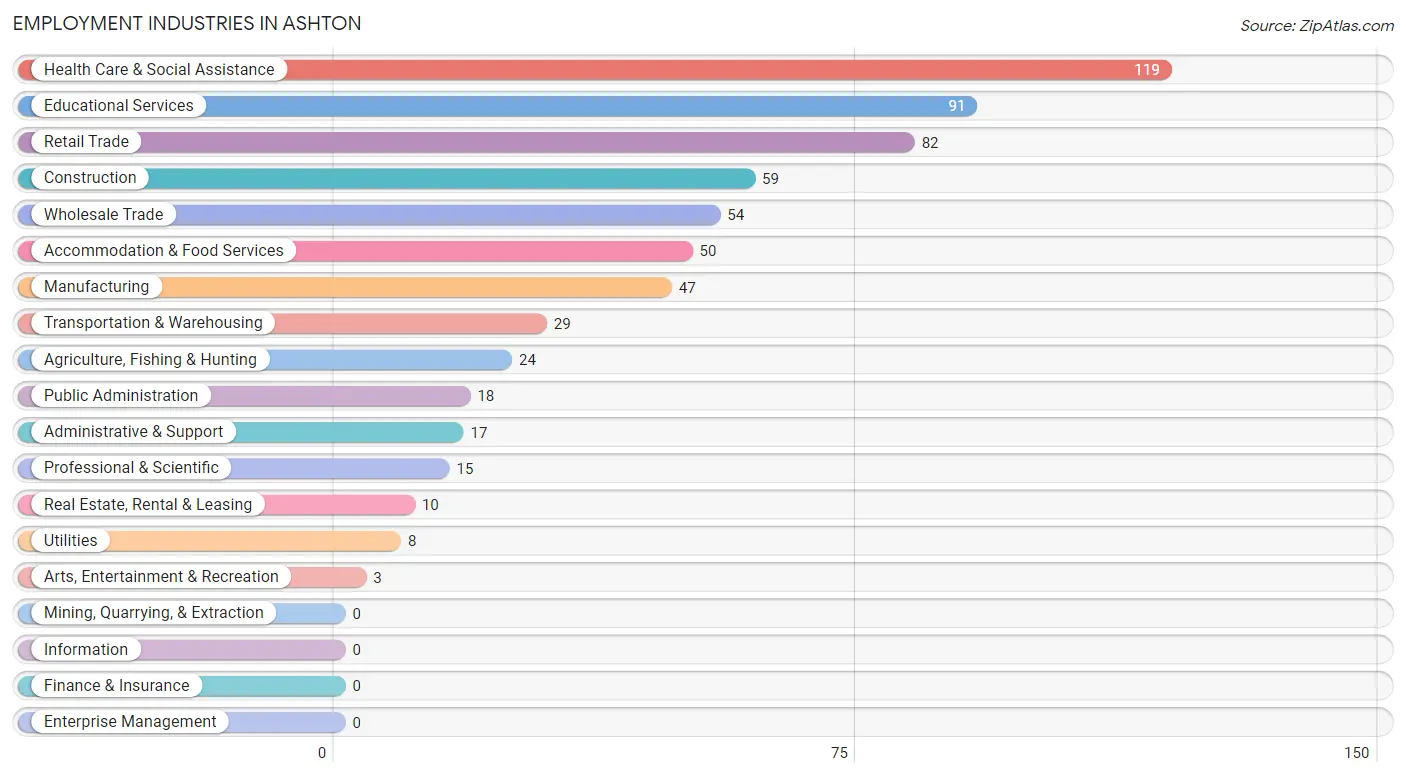
Employment Industries in Ashton
The major employment industries in Ashton include Health Care & Social Assistance (119 | 18.5%), Educational Services (91 | 14.1%), Retail Trade (82 | 12.7%), Construction (59 | 9.2%), and Wholesale Trade (54 | 8.4%).
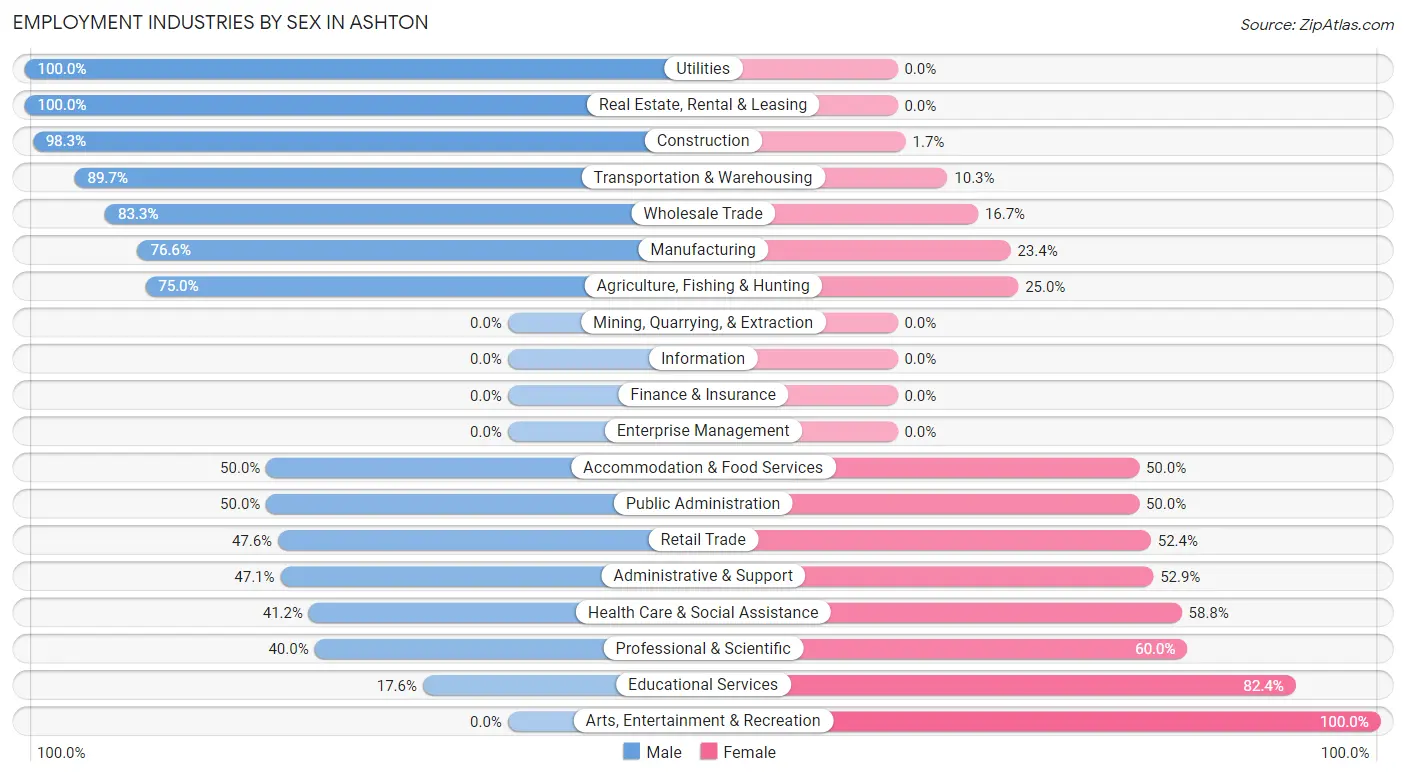
Employment Industries by Sex in Ashton
The Ashton industries that see more men than women are Utilities (100.0%), Real Estate, Rental & Leasing (100.0%), and Construction (98.3%), whereas the industries that tend to have a higher number of women are Arts, Entertainment & Recreation (100.0%), Educational Services (82.4%), and Professional & Scientific (60.0%).
| Industry | Male | Female |
| Agriculture, Fishing & Hunting | 18 (75.0%) | 6 (25.0%) |
| Mining, Quarrying, & Extraction | 0 (0.0%) | 0 (0.0%) |
| Construction | 58 (98.3%) | 1 (1.7%) |
| Manufacturing | 36 (76.6%) | 11 (23.4%) |
| Wholesale Trade | 45 (83.3%) | 9 (16.7%) |
| Retail Trade | 39 (47.6%) | 43 (52.4%) |
| Transportation & Warehousing | 26 (89.7%) | 3 (10.3%) |
| Utilities | 8 (100.0%) | 0 (0.0%) |
| Information | 0 (0.0%) | 0 (0.0%) |
| Finance & Insurance | 0 (0.0%) | 0 (0.0%) |
| Real Estate, Rental & Leasing | 10 (100.0%) | 0 (0.0%) |
| Professional & Scientific | 6 (40.0%) | 9 (60.0%) |
| Enterprise Management | 0 (0.0%) | 0 (0.0%) |
| Administrative & Support | 8 (47.1%) | 9 (52.9%) |
| Educational Services | 16 (17.6%) | 75 (82.4%) |
| Health Care & Social Assistance | 49 (41.2%) | 70 (58.8%) |
| Arts, Entertainment & Recreation | 0 (0.0%) | 3 (100.0%) |
| Accommodation & Food Services | 25 (50.0%) | 25 (50.0%) |
| Public Administration | 9 (50.0%) | 9 (50.0%) |
| Total | 365 (56.7%) | 279 (43.3%) |
Education in Ashton
School Enrollment in Ashton
The most common levels of schooling among the 343 students in Ashton are elementary school (122 | 35.6%), middle school (102 | 29.7%), and high school (59 | 17.2%).
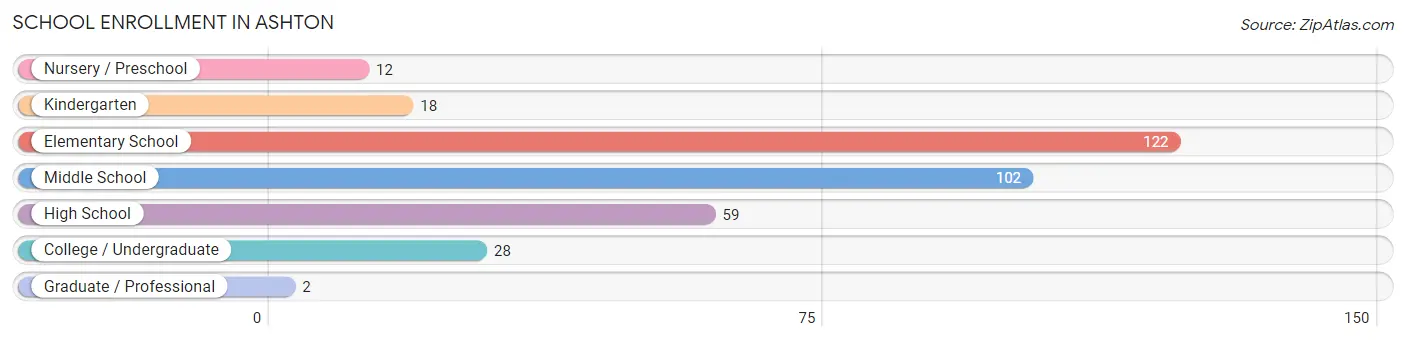
| School Level | # Students | % Students |
| Nursery / Preschool | 12 | 3.5% |
| Kindergarten | 18 | 5.2% |
| Elementary School | 122 | 35.6% |
| Middle School | 102 | 29.7% |
| High School | 59 | 17.2% |
| College / Undergraduate | 28 | 8.2% |
| Graduate / Professional | 2 | 0.6% |
| Total | 343 | 100.0% |
School Enrollment by Age by Funding Source in Ashton
Out of a total of 343 students who are enrolled in schools in Ashton, 50 (14.6%) attend a private institution, while the remaining 293 (85.4%) are enrolled in public schools. The age group of 3 to 4 year olds has the highest likelihood of being enrolled in private schools, with 12 (100.0% in the age bracket) enrolled. Conversely, the age group of 5 to 9 year old has the lowest likelihood of being enrolled in a private school, with 117 (100.0% in the age bracket) attending a public institution.
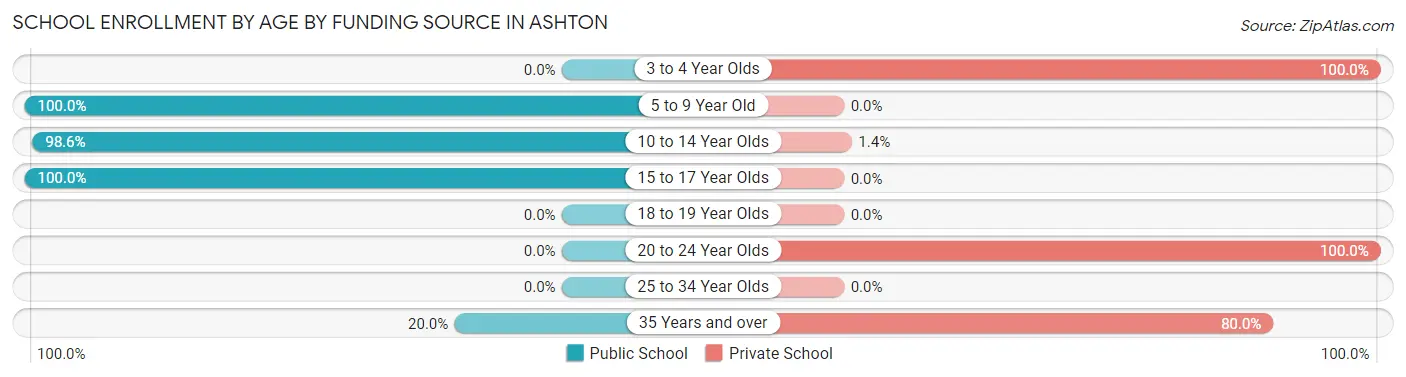
| Age Bracket | Public School | Private School |
| 3 to 4 Year Olds | 0 (0.0%) | 12 (100.0%) |
| 5 to 9 Year Old | 117 (100.0%) | 0 (0.0%) |
| 10 to 14 Year Olds | 137 (98.6%) | 2 (1.4%) |
| 15 to 17 Year Olds | 37 (100.0%) | 0 (0.0%) |
| 18 to 19 Year Olds | 0 (0.0%) | 0 (0.0%) |
| 20 to 24 Year Olds | 0 (0.0%) | 28 (100.0%) |
| 25 to 34 Year Olds | 0 (0.0%) | 0 (0.0%) |
| 35 Years and over | 2 (20.0%) | 8 (80.0%) |
| Total | 293 (85.4%) | 50 (14.6%) |
Educational Attainment by Field of Study in Ashton
Education (69 | 34.5%), bio, nature & agricultural (33 | 16.5%), business (23 | 11.5%), computers & mathematics (20 | 10.0%), and physical & health sciences (17 | 8.5%) are the most common fields of study among 200 individuals in Ashton who have obtained a bachelor's degree or higher.
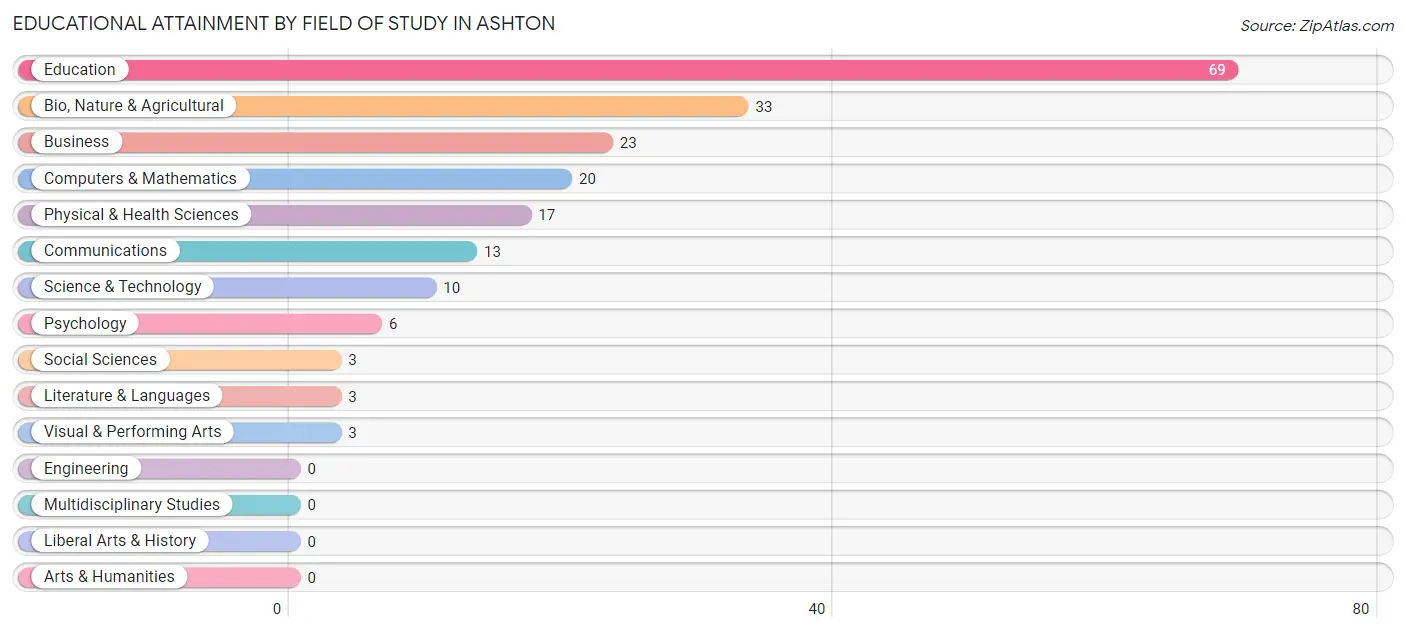
| Field of Study | # Graduates | % Graduates |
| Computers & Mathematics | 20 | 10.0% |
| Bio, Nature & Agricultural | 33 | 16.5% |
| Physical & Health Sciences | 17 | 8.5% |
| Psychology | 6 | 3.0% |
| Social Sciences | 3 | 1.5% |
| Engineering | 0 | 0.0% |
| Multidisciplinary Studies | 0 | 0.0% |
| Science & Technology | 10 | 5.0% |
| Business | 23 | 11.5% |
| Education | 69 | 34.5% |
| Literature & Languages | 3 | 1.5% |
| Liberal Arts & History | 0 | 0.0% |
| Visual & Performing Arts | 3 | 1.5% |
| Communications | 13 | 6.5% |
| Arts & Humanities | 0 | 0.0% |
| Total | 200 | 100.0% |
Transportation & Commute in Ashton
Vehicle Availability by Sex in Ashton
The most prevalent vehicle ownership categories in Ashton are males with 3 vehicles (91, accounting for 24.9%) and females with 3 vehicles (46, making up 33.7%).
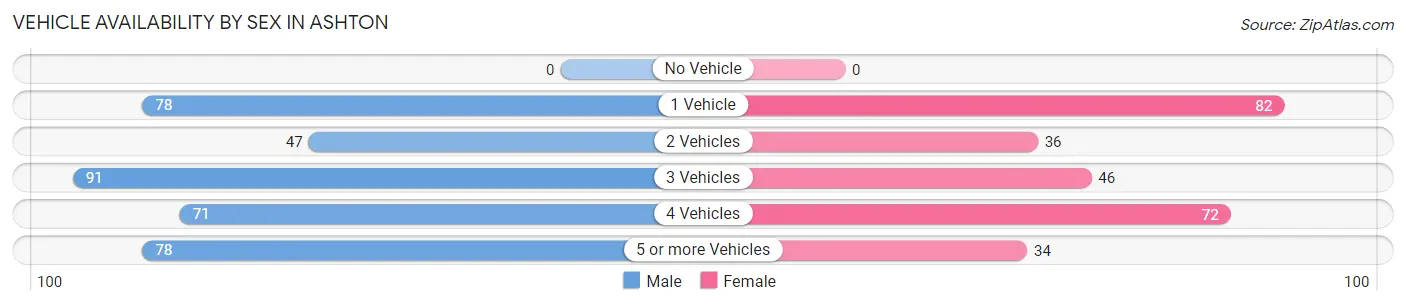
| Vehicles Available | Male | Female |
| No Vehicle | 0 (0.0%) | 0 (0.0%) |
| 1 Vehicle | 78 (21.4%) | 82 (30.4%) |
| 2 Vehicles | 47 (12.9%) | 36 (13.3%) |
| 3 Vehicles | 91 (24.9%) | 46 (17.0%) |
| 4 Vehicles | 71 (19.5%) | 72 (26.7%) |
| 5 or more Vehicles | 78 (21.4%) | 34 (12.6%) |
| Total | 365 (100.0%) | 270 (100.0%) |
Commute Time in Ashton
The most frequently occuring commute durations in Ashton are less than 5 minutes (255 commuters, 41.5%), 5 to 9 minutes (82 commuters, 13.4%), and 10 to 14 minutes (66 commuters, 10.7%).
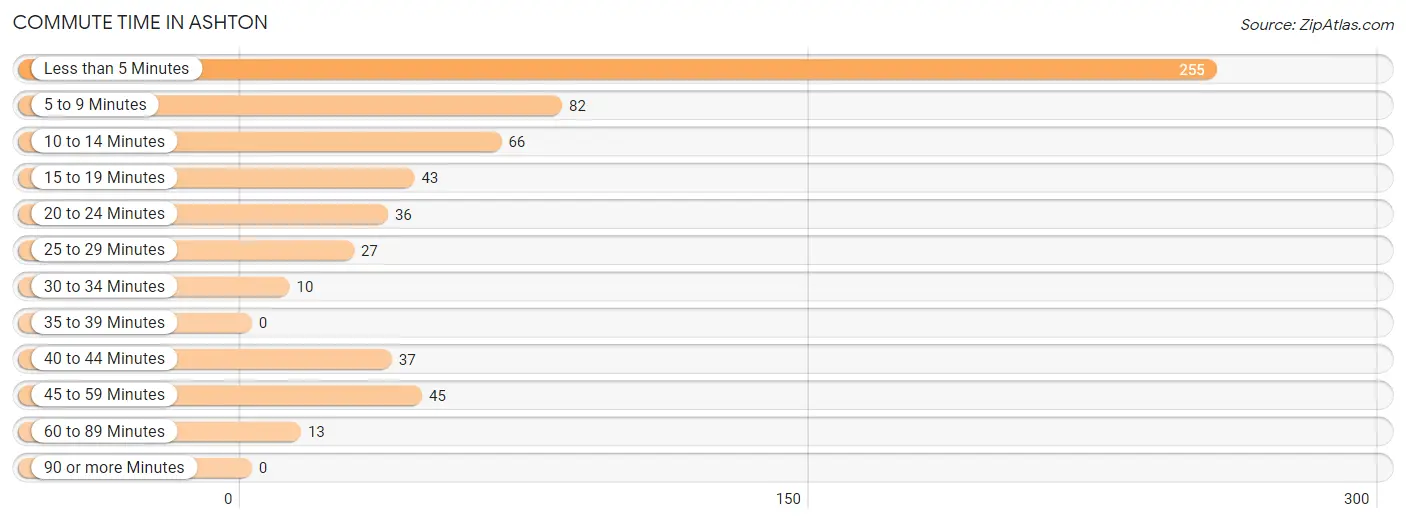
| Commute Time | # Commuters | % Commuters |
| Less than 5 Minutes | 255 | 41.5% |
| 5 to 9 Minutes | 82 | 13.4% |
| 10 to 14 Minutes | 66 | 10.7% |
| 15 to 19 Minutes | 43 | 7.0% |
| 20 to 24 Minutes | 36 | 5.9% |
| 25 to 29 Minutes | 27 | 4.4% |
| 30 to 34 Minutes | 10 | 1.6% |
| 35 to 39 Minutes | 0 | 0.0% |
| 40 to 44 Minutes | 37 | 6.0% |
| 45 to 59 Minutes | 45 | 7.3% |
| 60 to 89 Minutes | 13 | 2.1% |
| 90 or more Minutes | 0 | 0.0% |
Commute Time by Sex in Ashton
The most common commute times in Ashton are less than 5 minutes (161 commuters, 44.1%) for males and less than 5 minutes (94 commuters, 37.8%) for females.
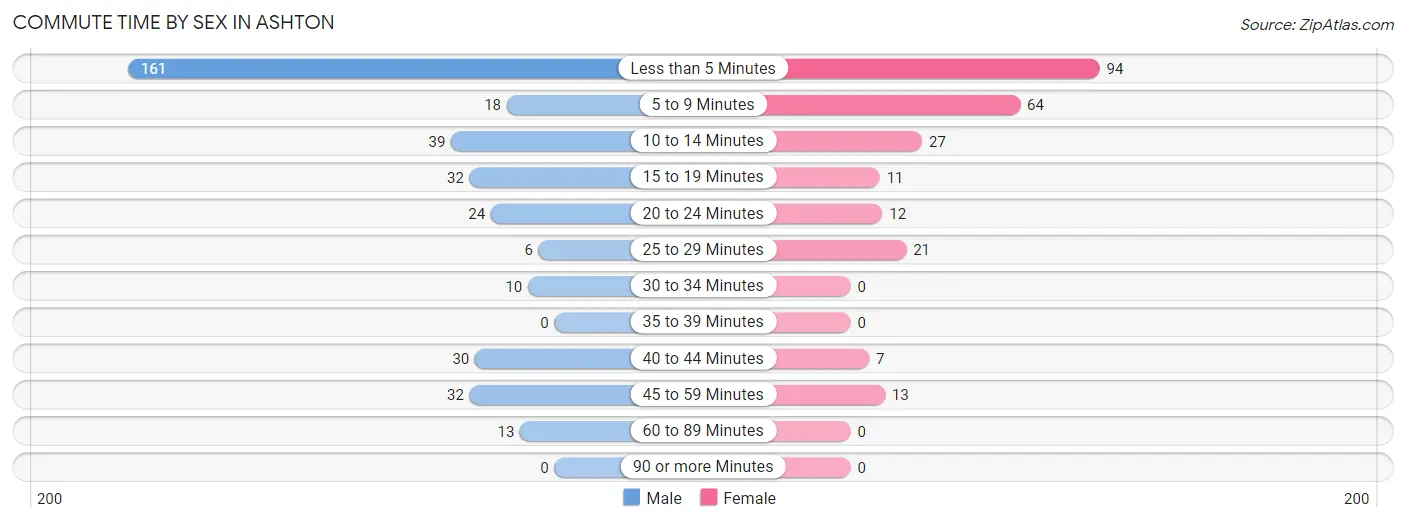
| Commute Time | Male | Female |
| Less than 5 Minutes | 161 (44.1%) | 94 (37.8%) |
| 5 to 9 Minutes | 18 (4.9%) | 64 (25.7%) |
| 10 to 14 Minutes | 39 (10.7%) | 27 (10.8%) |
| 15 to 19 Minutes | 32 (8.8%) | 11 (4.4%) |
| 20 to 24 Minutes | 24 (6.6%) | 12 (4.8%) |
| 25 to 29 Minutes | 6 (1.6%) | 21 (8.4%) |
| 30 to 34 Minutes | 10 (2.7%) | 0 (0.0%) |
| 35 to 39 Minutes | 0 (0.0%) | 0 (0.0%) |
| 40 to 44 Minutes | 30 (8.2%) | 7 (2.8%) |
| 45 to 59 Minutes | 32 (8.8%) | 13 (5.2%) |
| 60 to 89 Minutes | 13 (3.6%) | 0 (0.0%) |
| 90 or more Minutes | 0 (0.0%) | 0 (0.0%) |
Time of Departure to Work by Sex in Ashton
The most frequent times of departure to work in Ashton are 7:30 AM to 7:59 AM (102, 28.0%) for males and 8:00 AM to 8:29 AM (47, 18.9%) for females.
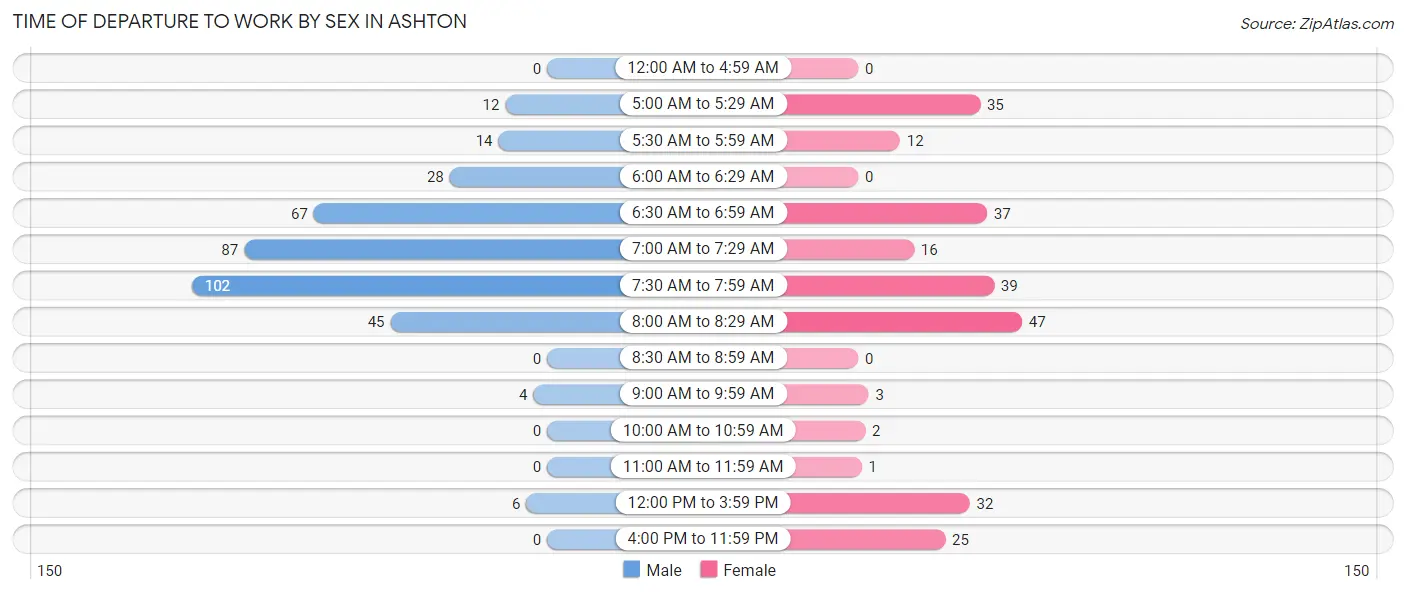
| Time of Departure | Male | Female |
| 12:00 AM to 4:59 AM | 0 (0.0%) | 0 (0.0%) |
| 5:00 AM to 5:29 AM | 12 (3.3%) | 35 (14.1%) |
| 5:30 AM to 5:59 AM | 14 (3.8%) | 12 (4.8%) |
| 6:00 AM to 6:29 AM | 28 (7.7%) | 0 (0.0%) |
| 6:30 AM to 6:59 AM | 67 (18.4%) | 37 (14.9%) |
| 7:00 AM to 7:29 AM | 87 (23.8%) | 16 (6.4%) |
| 7:30 AM to 7:59 AM | 102 (28.0%) | 39 (15.7%) |
| 8:00 AM to 8:29 AM | 45 (12.3%) | 47 (18.9%) |
| 8:30 AM to 8:59 AM | 0 (0.0%) | 0 (0.0%) |
| 9:00 AM to 9:59 AM | 4 (1.1%) | 3 (1.2%) |
| 10:00 AM to 10:59 AM | 0 (0.0%) | 2 (0.8%) |
| 11:00 AM to 11:59 AM | 0 (0.0%) | 1 (0.4%) |
| 12:00 PM to 3:59 PM | 6 (1.6%) | 32 (12.9%) |
| 4:00 PM to 11:59 PM | 0 (0.0%) | 25 (10.0%) |
| Total | 365 (100.0%) | 249 (100.0%) |
Housing Occupancy in Ashton
Occupancy by Ownership in Ashton
Of the total 460 dwellings in Ashton, owner-occupied units account for 316 (68.7%), while renter-occupied units make up 144 (31.3%).
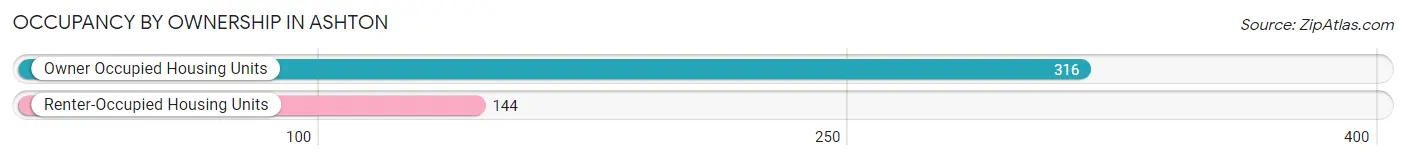
| Occupancy | # Housing Units | % Housing Units |
| Owner Occupied Housing Units | 316 | 68.7% |
| Renter-Occupied Housing Units | 144 | 31.3% |
| Total Occupied Housing Units | 460 | 100.0% |
Occupancy by Household Size in Ashton
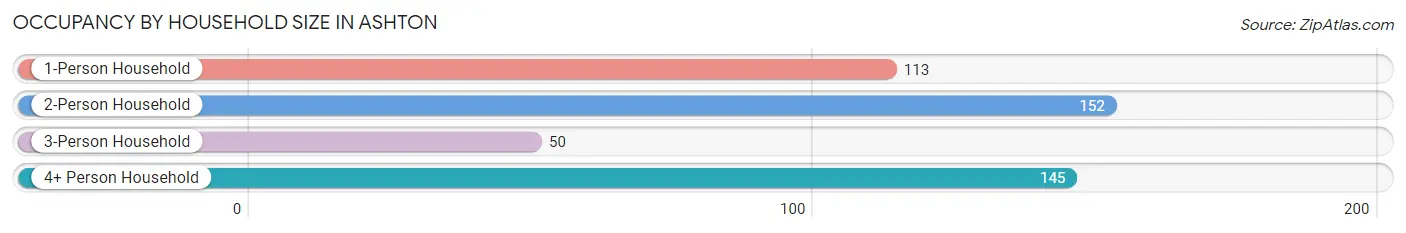
| Household Size | # Housing Units | % Housing Units |
| 1-Person Household | 113 | 24.6% |
| 2-Person Household | 152 | 33.0% |
| 3-Person Household | 50 | 10.9% |
| 4+ Person Household | 145 | 31.5% |
| Total Housing Units | 460 | 100.0% |
Occupancy by Ownership by Household Size in Ashton
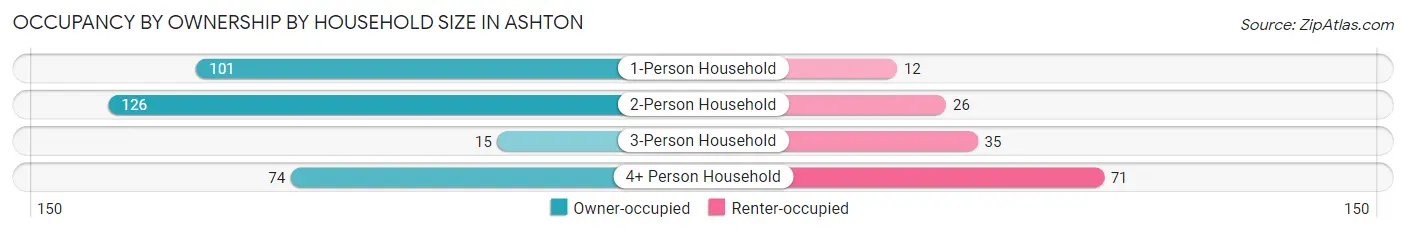
| Household Size | Owner-occupied | Renter-occupied |
| 1-Person Household | 101 (89.4%) | 12 (10.6%) |
| 2-Person Household | 126 (82.9%) | 26 (17.1%) |
| 3-Person Household | 15 (30.0%) | 35 (70.0%) |
| 4+ Person Household | 74 (51.0%) | 71 (49.0%) |
| Total Housing Units | 316 (68.7%) | 144 (31.3%) |
Occupancy by Educational Attainment in Ashton
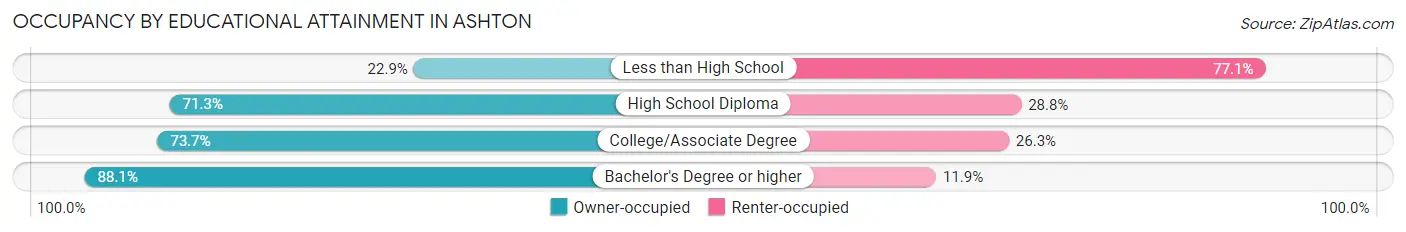
| Household Size | Owner-occupied | Renter-occupied |
| Less than High School | 16 (22.9%) | 54 (77.1%) |
| High School Diploma | 57 (71.3%) | 23 (28.7%) |
| College/Associate Degree | 154 (73.7%) | 55 (26.3%) |
| Bachelor's Degree or higher | 89 (88.1%) | 12 (11.9%) |
Occupancy by Age of Householder in Ashton
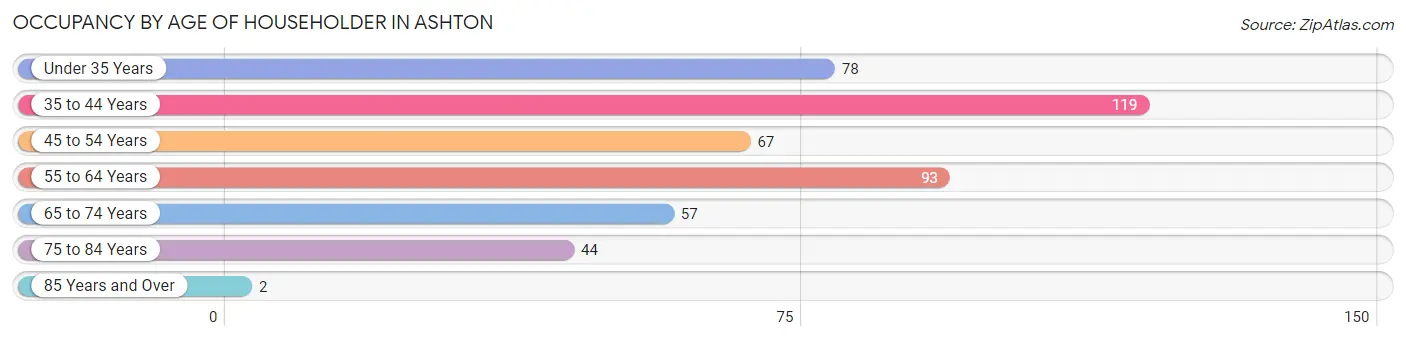
| Age Bracket | # Households | % Households |
| Under 35 Years | 78 | 17.0% |
| 35 to 44 Years | 119 | 25.9% |
| 45 to 54 Years | 67 | 14.6% |
| 55 to 64 Years | 93 | 20.2% |
| 65 to 74 Years | 57 | 12.4% |
| 75 to 84 Years | 44 | 9.6% |
| 85 Years and Over | 2 | 0.4% |
| Total | 460 | 100.0% |
Housing Finances in Ashton
Median Income by Occupancy in Ashton
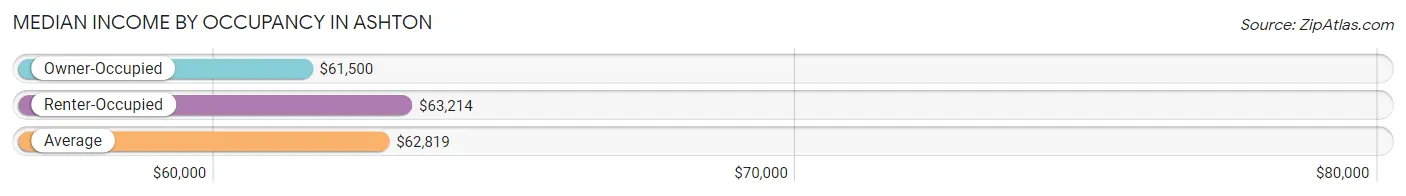
| Occupancy Type | # Households | Median Income |
| Owner-Occupied | 316 (68.7%) | $61,500 |
| Renter-Occupied | 144 (31.3%) | $63,214 |
| Average | 460 (100.0%) | $62,819 |
Occupancy by Householder Income Bracket in Ashton
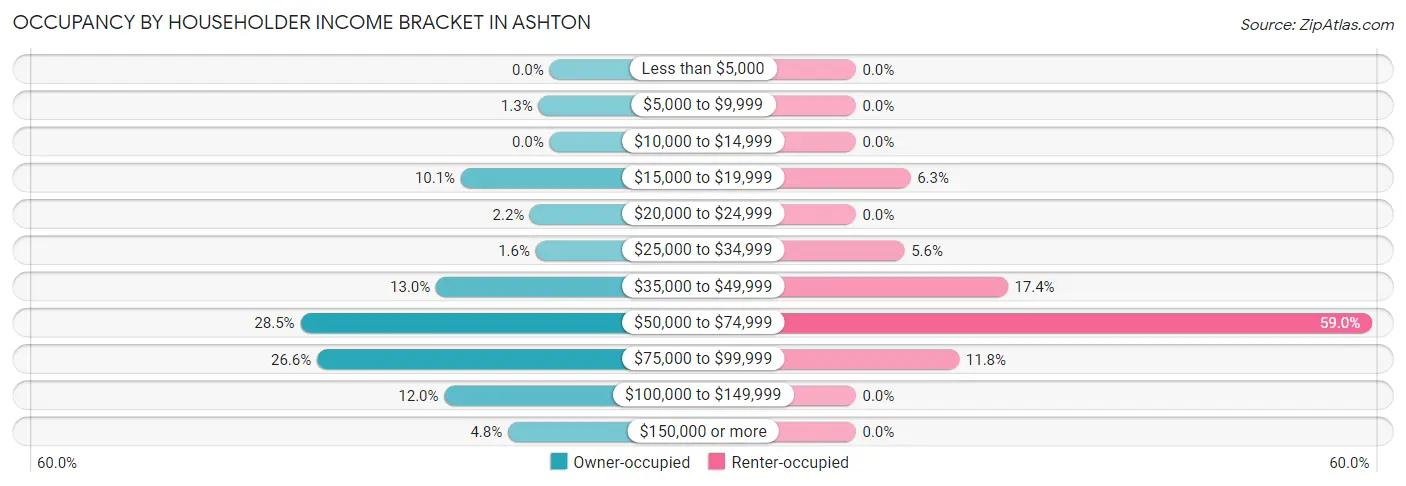
| Income Bracket | Owner-occupied | Renter-occupied |
| Less than $5,000 | 0 (0.0%) | 0 (0.0%) |
| $5,000 to $9,999 | 4 (1.3%) | 0 (0.0%) |
| $10,000 to $14,999 | 0 (0.0%) | 0 (0.0%) |
| $15,000 to $19,999 | 32 (10.1%) | 9 (6.2%) |
| $20,000 to $24,999 | 7 (2.2%) | 0 (0.0%) |
| $25,000 to $34,999 | 5 (1.6%) | 8 (5.6%) |
| $35,000 to $49,999 | 41 (13.0%) | 25 (17.4%) |
| $50,000 to $74,999 | 90 (28.5%) | 85 (59.0%) |
| $75,000 to $99,999 | 84 (26.6%) | 17 (11.8%) |
| $100,000 to $149,999 | 38 (12.0%) | 0 (0.0%) |
| $150,000 or more | 15 (4.8%) | 0 (0.0%) |
| Total | 316 (100.0%) | 144 (100.0%) |
Monthly Housing Cost Tiers in Ashton
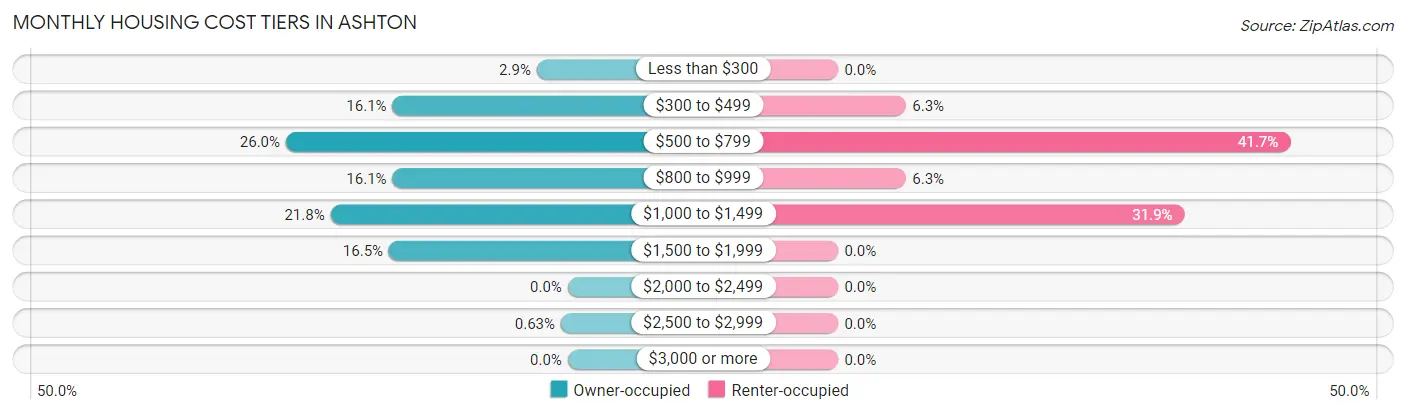
| Monthly Cost | Owner-occupied | Renter-occupied |
| Less than $300 | 9 (2.9%) | 0 (0.0%) |
| $300 to $499 | 51 (16.1%) | 9 (6.2%) |
| $500 to $799 | 82 (26.0%) | 60 (41.7%) |
| $800 to $999 | 51 (16.1%) | 9 (6.2%) |
| $1,000 to $1,499 | 69 (21.8%) | 46 (31.9%) |
| $1,500 to $1,999 | 52 (16.5%) | 0 (0.0%) |
| $2,000 to $2,499 | 0 (0.0%) | 0 (0.0%) |
| $2,500 to $2,999 | 2 (0.6%) | 0 (0.0%) |
| $3,000 or more | 0 (0.0%) | 0 (0.0%) |
| Total | 316 (100.0%) | 144 (100.0%) |
Physical Housing Characteristics in Ashton
Housing Structures in Ashton
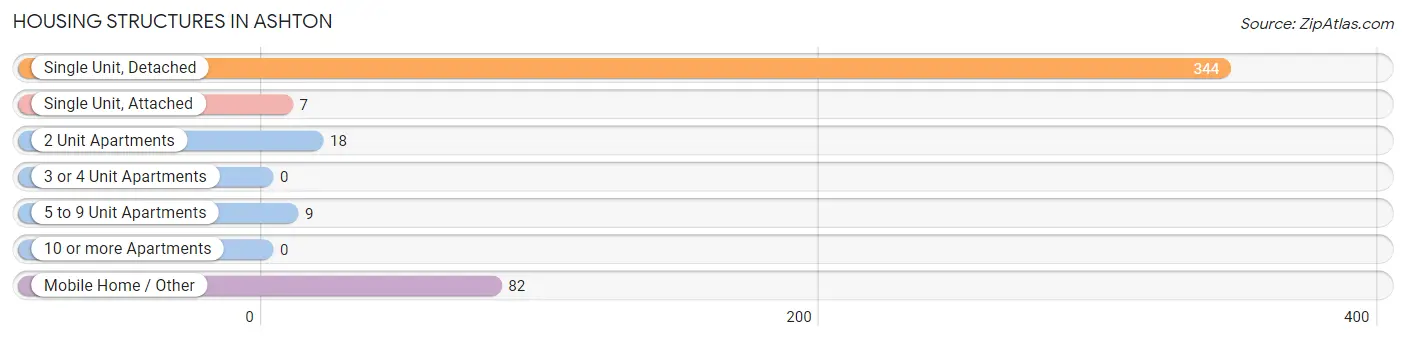
| Structure Type | # Housing Units | % Housing Units |
| Single Unit, Detached | 344 | 74.8% |
| Single Unit, Attached | 7 | 1.5% |
| 2 Unit Apartments | 18 | 3.9% |
| 3 or 4 Unit Apartments | 0 | 0.0% |
| 5 to 9 Unit Apartments | 9 | 2.0% |
| 10 or more Apartments | 0 | 0.0% |
| Mobile Home / Other | 82 | 17.8% |
| Total | 460 | 100.0% |
Housing Structures by Occupancy in Ashton
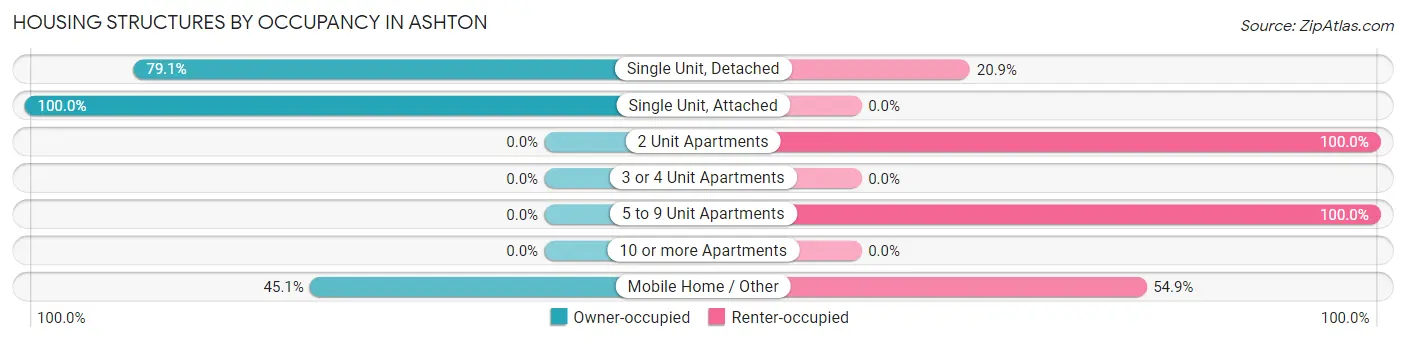
| Structure Type | Owner-occupied | Renter-occupied |
| Single Unit, Detached | 272 (79.1%) | 72 (20.9%) |
| Single Unit, Attached | 7 (100.0%) | 0 (0.0%) |
| 2 Unit Apartments | 0 (0.0%) | 18 (100.0%) |
| 3 or 4 Unit Apartments | 0 (0.0%) | 0 (0.0%) |
| 5 to 9 Unit Apartments | 0 (0.0%) | 9 (100.0%) |
| 10 or more Apartments | 0 (0.0%) | 0 (0.0%) |
| Mobile Home / Other | 37 (45.1%) | 45 (54.9%) |
| Total | 316 (68.7%) | 144 (31.3%) |
Housing Structures by Number of Rooms in Ashton
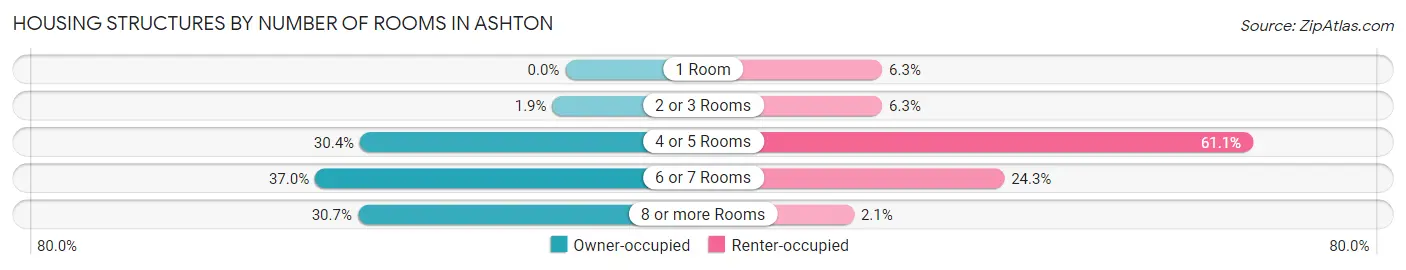
| Number of Rooms | Owner-occupied | Renter-occupied |
| 1 Room | 0 (0.0%) | 9 (6.2%) |
| 2 or 3 Rooms | 6 (1.9%) | 9 (6.2%) |
| 4 or 5 Rooms | 96 (30.4%) | 88 (61.1%) |
| 6 or 7 Rooms | 117 (37.0%) | 35 (24.3%) |
| 8 or more Rooms | 97 (30.7%) | 3 (2.1%) |
| Total | 316 (100.0%) | 144 (100.0%) |
Housing Structure by Heating Type in Ashton
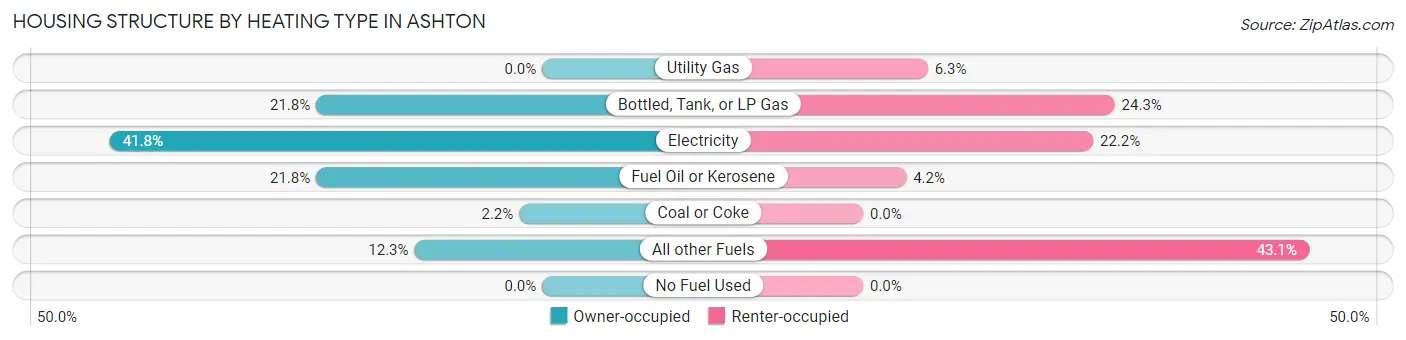
| Heating Type | Owner-occupied | Renter-occupied |
| Utility Gas | 0 (0.0%) | 9 (6.2%) |
| Bottled, Tank, or LP Gas | 69 (21.8%) | 35 (24.3%) |
| Electricity | 132 (41.8%) | 32 (22.2%) |
| Fuel Oil or Kerosene | 69 (21.8%) | 6 (4.2%) |
| Coal or Coke | 7 (2.2%) | 0 (0.0%) |
| All other Fuels | 39 (12.3%) | 62 (43.1%) |
| No Fuel Used | 0 (0.0%) | 0 (0.0%) |
| Total | 316 (100.0%) | 144 (100.0%) |
Household Vehicle Usage in Ashton
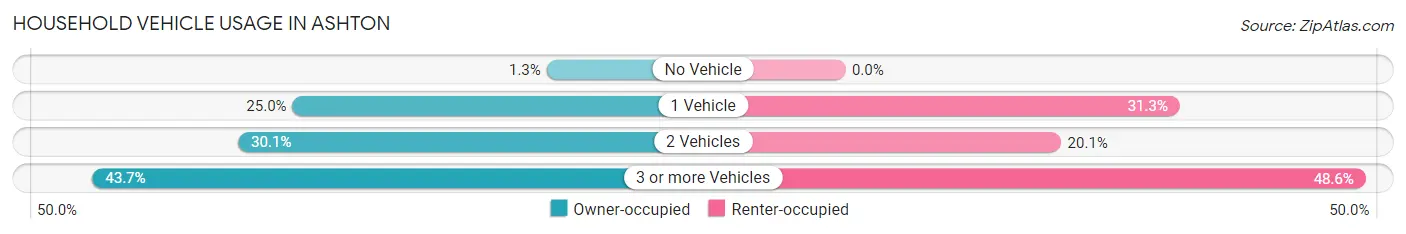
| Vehicles per Household | Owner-occupied | Renter-occupied |
| No Vehicle | 4 (1.3%) | 0 (0.0%) |
| 1 Vehicle | 79 (25.0%) | 45 (31.2%) |
| 2 Vehicles | 95 (30.1%) | 29 (20.1%) |
| 3 or more Vehicles | 138 (43.7%) | 70 (48.6%) |
| Total | 316 (100.0%) | 144 (100.0%) |
Real Estate & Mortgages in Ashton
Real Estate and Mortgage Overview in Ashton
| Characteristic | Without Mortgage | With Mortgage |
| Housing Units | 134 | 182 |
| Median Property Value | $172,400 | $171,100 |
| Median Household Income | $48,750 | $8 |
| Monthly Housing Costs | $518 | $0 |
| Real Estate Taxes | $1,186 | $0 |
Property Value by Mortgage Status in Ashton
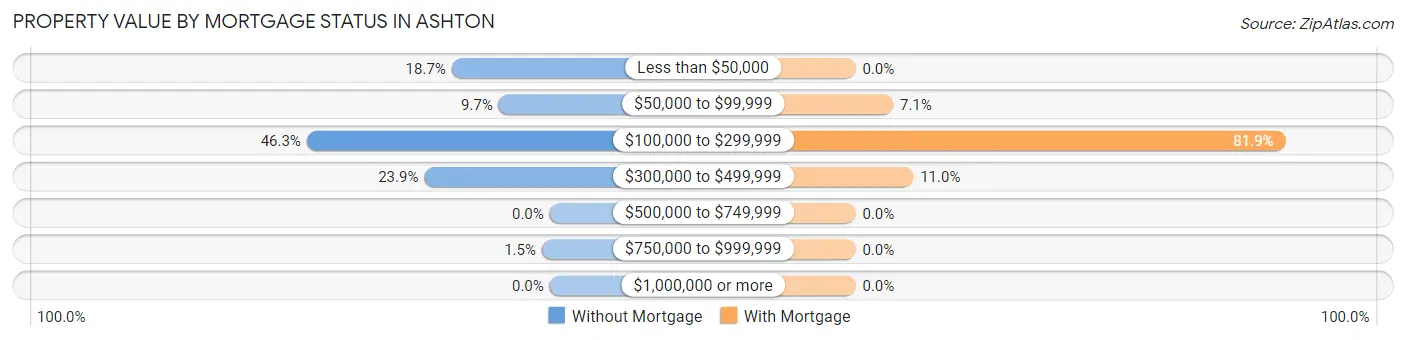
| Property Value | Without Mortgage | With Mortgage |
| Less than $50,000 | 25 (18.7%) | 0 (0.0%) |
| $50,000 to $99,999 | 13 (9.7%) | 13 (7.1%) |
| $100,000 to $299,999 | 62 (46.3%) | 149 (81.9%) |
| $300,000 to $499,999 | 32 (23.9%) | 20 (11.0%) |
| $500,000 to $749,999 | 0 (0.0%) | 0 (0.0%) |
| $750,000 to $999,999 | 2 (1.5%) | 0 (0.0%) |
| $1,000,000 or more | 0 (0.0%) | 0 (0.0%) |
| Total | 134 (100.0%) | 182 (100.0%) |
Household Income by Mortgage Status in Ashton
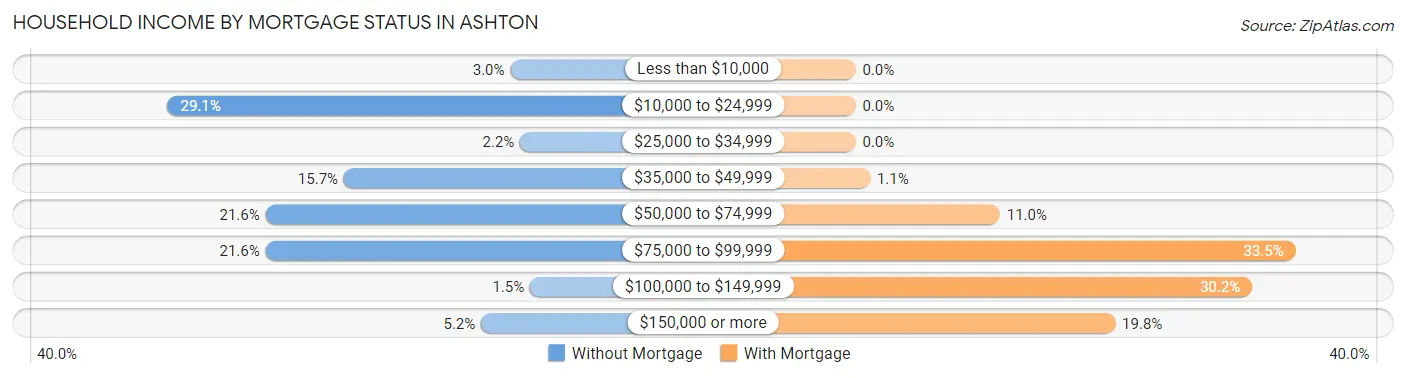
| Household Income | Without Mortgage | With Mortgage |
| Less than $10,000 | 4 (3.0%) | 0 (0.0%) |
| $10,000 to $24,999 | 39 (29.1%) | 0 (0.0%) |
| $25,000 to $34,999 | 3 (2.2%) | 0 (0.0%) |
| $35,000 to $49,999 | 21 (15.7%) | 2 (1.1%) |
| $50,000 to $74,999 | 29 (21.6%) | 20 (11.0%) |
| $75,000 to $99,999 | 29 (21.6%) | 61 (33.5%) |
| $100,000 to $149,999 | 2 (1.5%) | 55 (30.2%) |
| $150,000 or more | 7 (5.2%) | 36 (19.8%) |
| Total | 134 (100.0%) | 182 (100.0%) |
Property Value to Household Income Ratio in Ashton
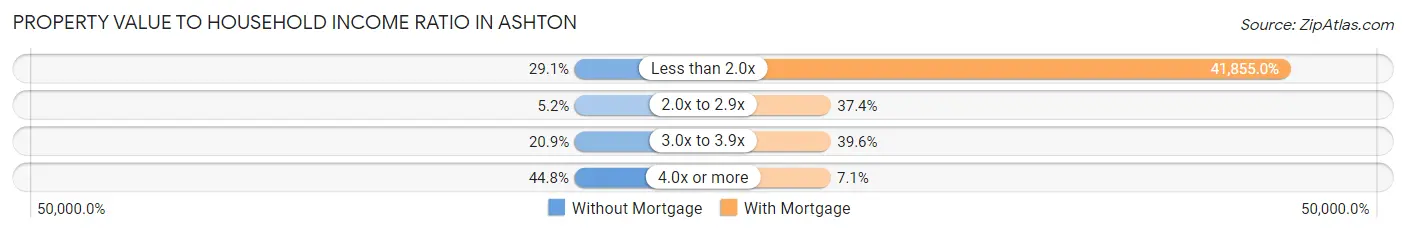
| Value-to-Income Ratio | Without Mortgage | With Mortgage |
| Less than 2.0x | 39 (29.1%) | 76,176 (41,855.0%) |
| 2.0x to 2.9x | 7 (5.2%) | 68 (37.4%) |
| 3.0x to 3.9x | 28 (20.9%) | 72 (39.6%) |
| 4.0x or more | 60 (44.8%) | 13 (7.1%) |
| Total | 134 (100.0%) | 182 (100.0%) |
Real Estate Taxes by Mortgage Status in Ashton
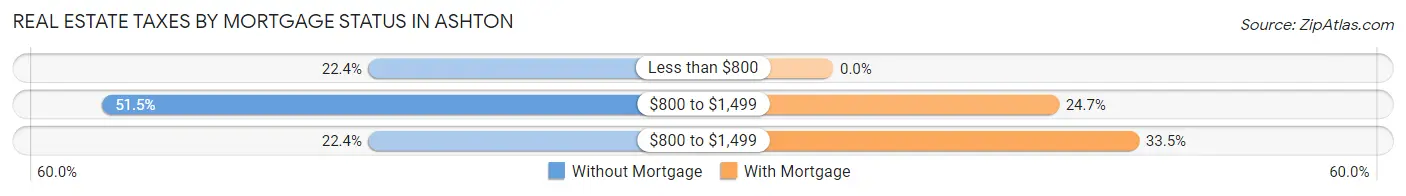
| Property Taxes | Without Mortgage | With Mortgage |
| Less than $800 | 30 (22.4%) | 0 (0.0%) |
| $800 to $1,499 | 69 (51.5%) | 45 (24.7%) |
| $800 to $1,499 | 30 (22.4%) | 61 (33.5%) |
| Total | 134 (100.0%) | 182 (100.0%) |
Health & Disability in Ashton
Health Insurance Coverage by Age in Ashton
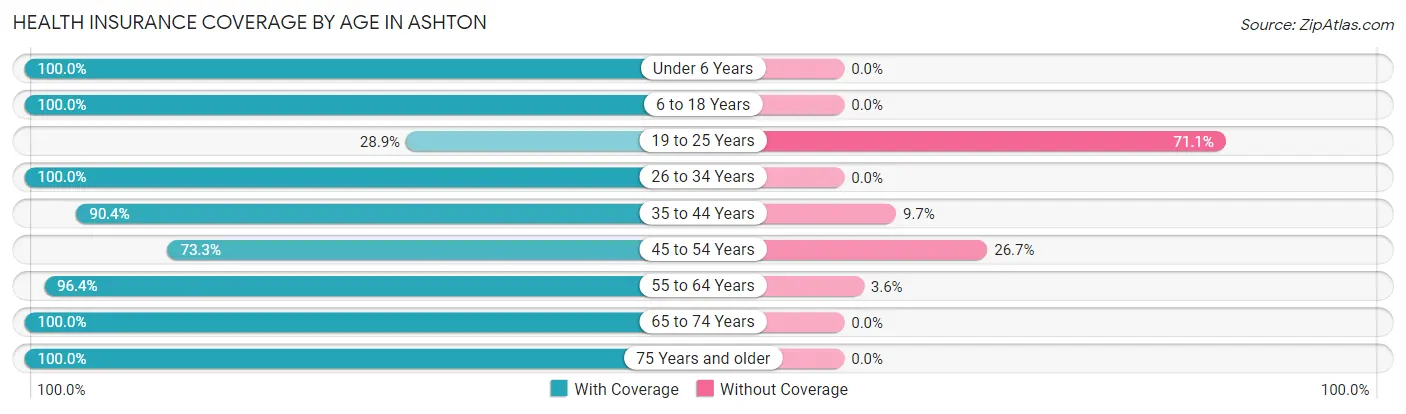
| Age Bracket | With Coverage | Without Coverage |
| Under 6 Years | 44 (100.0%) | 0 (0.0%) |
| 6 to 18 Years | 289 (100.0%) | 0 (0.0%) |
| 19 to 25 Years | 39 (28.9%) | 96 (71.1%) |
| 26 to 34 Years | 91 (100.0%) | 0 (0.0%) |
| 35 to 44 Years | 206 (90.3%) | 22 (9.7%) |
| 45 to 54 Years | 154 (73.3%) | 56 (26.7%) |
| 55 to 64 Years | 159 (96.4%) | 6 (3.6%) |
| 65 to 74 Years | 114 (100.0%) | 0 (0.0%) |
| 75 Years and older | 68 (100.0%) | 0 (0.0%) |
| Total | 1,164 (86.6%) | 180 (13.4%) |
Health Insurance Coverage by Citizenship Status in Ashton
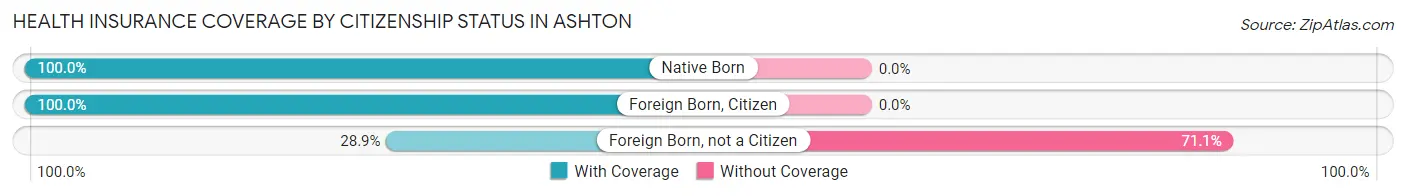
| Citizenship Status | With Coverage | Without Coverage |
| Native Born | 44 (100.0%) | 0 (0.0%) |
| Foreign Born, Citizen | 289 (100.0%) | 0 (0.0%) |
| Foreign Born, not a Citizen | 39 (28.9%) | 96 (71.1%) |
Health Insurance Coverage by Household Income in Ashton
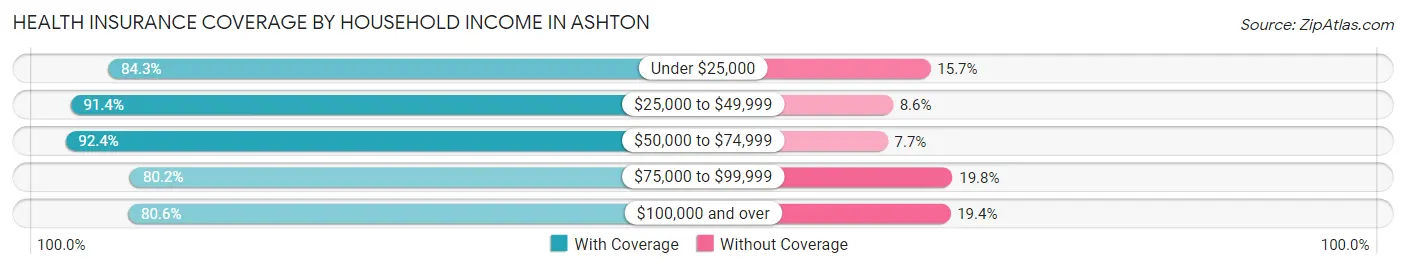
| Household Income | With Coverage | Without Coverage |
| Under $25,000 | 70 (84.3%) | 13 (15.7%) |
| $25,000 to $49,999 | 170 (91.4%) | 16 (8.6%) |
| $50,000 to $74,999 | 459 (92.3%) | 38 (7.6%) |
| $75,000 to $99,999 | 203 (80.2%) | 50 (19.8%) |
| $100,000 and over | 262 (80.6%) | 63 (19.4%) |
Public vs Private Health Insurance Coverage by Age in Ashton
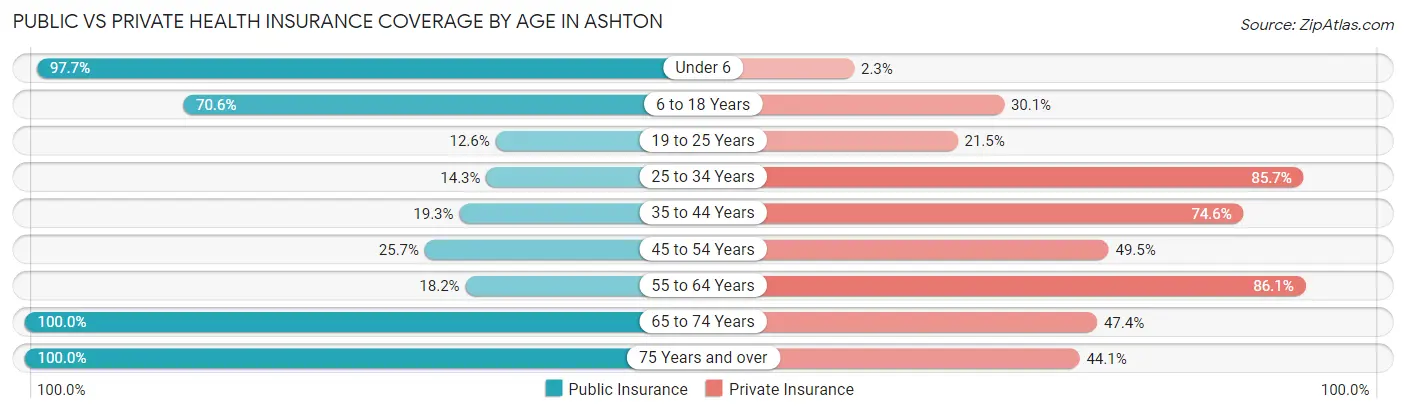
| Age Bracket | Public Insurance | Private Insurance |
| Under 6 | 43 (97.7%) | 1 (2.3%) |
| 6 to 18 Years | 204 (70.6%) | 87 (30.1%) |
| 19 to 25 Years | 17 (12.6%) | 29 (21.5%) |
| 25 to 34 Years | 13 (14.3%) | 78 (85.7%) |
| 35 to 44 Years | 44 (19.3%) | 170 (74.6%) |
| 45 to 54 Years | 54 (25.7%) | 104 (49.5%) |
| 55 to 64 Years | 30 (18.2%) | 142 (86.1%) |
| 65 to 74 Years | 114 (100.0%) | 54 (47.4%) |
| 75 Years and over | 68 (100.0%) | 30 (44.1%) |
| Total | 587 (43.7%) | 695 (51.7%) |
Disability Status by Sex by Age in Ashton
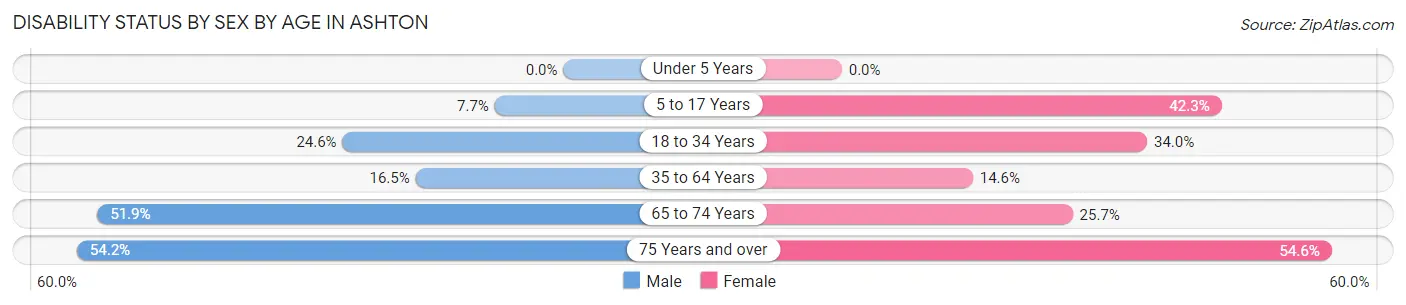
| Age Bracket | Male | Female |
| Under 5 Years | 0 (0.0%) | 0 (0.0%) |
| 5 to 17 Years | 13 (7.6%) | 52 (42.3%) |
| 18 to 34 Years | 31 (24.6%) | 34 (34.0%) |
| 35 to 64 Years | 53 (16.5%) | 41 (14.6%) |
| 65 to 74 Years | 41 (51.9%) | 9 (25.7%) |
| 75 Years and over | 13 (54.2%) | 24 (54.5%) |
Disability Class by Sex by Age in Ashton
Disability Class: Hearing Difficulty
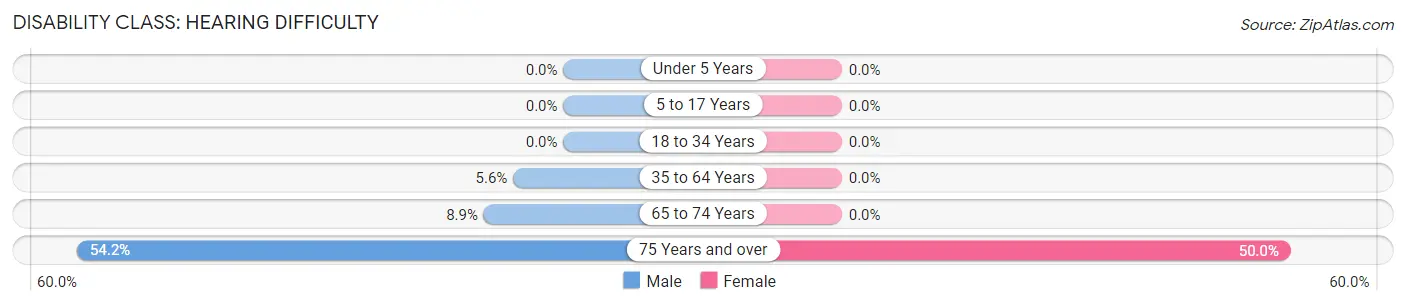
| Age Bracket | Male | Female |
| Under 5 Years | 0 (0.0%) | 0 (0.0%) |
| 5 to 17 Years | 0 (0.0%) | 0 (0.0%) |
| 18 to 34 Years | 0 (0.0%) | 0 (0.0%) |
| 35 to 64 Years | 18 (5.6%) | 0 (0.0%) |
| 65 to 74 Years | 7 (8.9%) | 0 (0.0%) |
| 75 Years and over | 13 (54.2%) | 22 (50.0%) |
Disability Class: Vision Difficulty
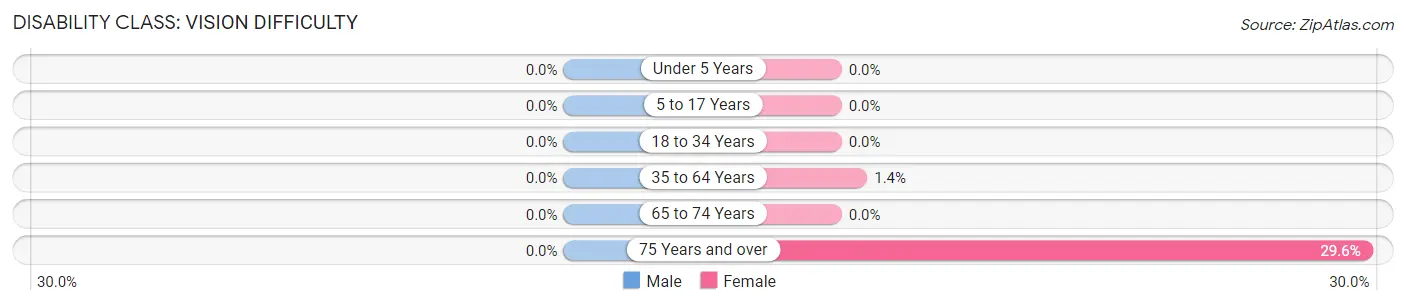
| Age Bracket | Male | Female |
| Under 5 Years | 0 (0.0%) | 0 (0.0%) |
| 5 to 17 Years | 0 (0.0%) | 0 (0.0%) |
| 18 to 34 Years | 0 (0.0%) | 0 (0.0%) |
| 35 to 64 Years | 0 (0.0%) | 4 (1.4%) |
| 65 to 74 Years | 0 (0.0%) | 0 (0.0%) |
| 75 Years and over | 0 (0.0%) | 13 (29.5%) |
Disability Class: Cognitive Difficulty
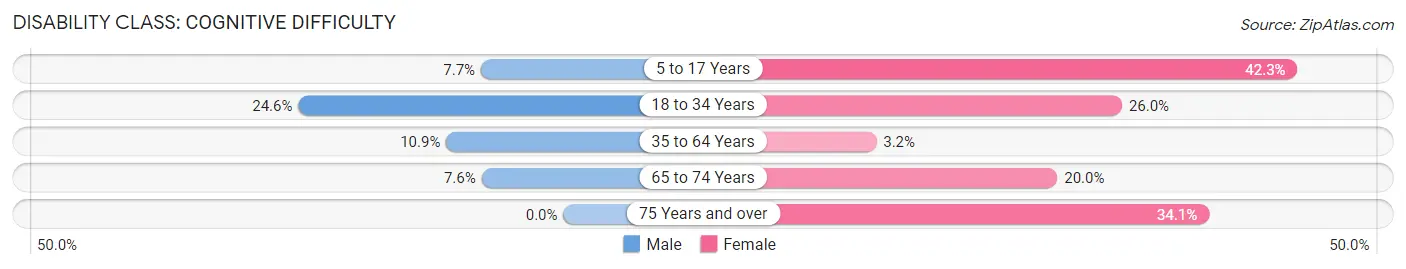
| Age Bracket | Male | Female |
| 5 to 17 Years | 13 (7.6%) | 52 (42.3%) |
| 18 to 34 Years | 31 (24.6%) | 26 (26.0%) |
| 35 to 64 Years | 35 (10.9%) | 9 (3.2%) |
| 65 to 74 Years | 6 (7.6%) | 7 (20.0%) |
| 75 Years and over | 0 (0.0%) | 15 (34.1%) |
Disability Class: Ambulatory Difficulty
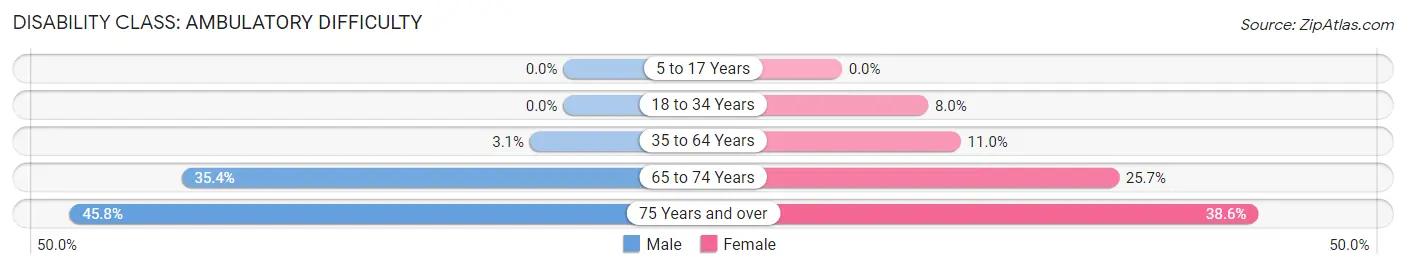
| Age Bracket | Male | Female |
| 5 to 17 Years | 0 (0.0%) | 0 (0.0%) |
| 18 to 34 Years | 0 (0.0%) | 8 (8.0%) |
| 35 to 64 Years | 10 (3.1%) | 31 (11.0%) |
| 65 to 74 Years | 28 (35.4%) | 9 (25.7%) |
| 75 Years and over | 11 (45.8%) | 17 (38.6%) |
Disability Class: Self-Care Difficulty
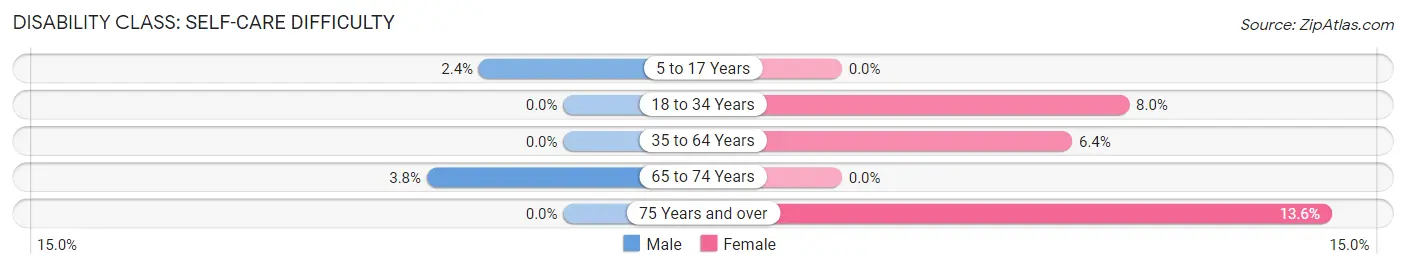
| Age Bracket | Male | Female |
| 5 to 17 Years | 4 (2.4%) | 0 (0.0%) |
| 18 to 34 Years | 0 (0.0%) | 8 (8.0%) |
| 35 to 64 Years | 0 (0.0%) | 18 (6.4%) |
| 65 to 74 Years | 3 (3.8%) | 0 (0.0%) |
| 75 Years and over | 0 (0.0%) | 6 (13.6%) |
Technology Access in Ashton
Computing Device Access in Ashton
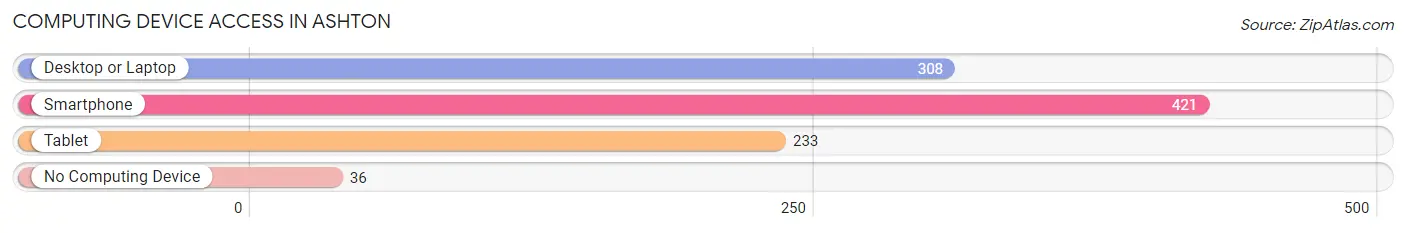
| Device Type | # Households | % Households |
| Desktop or Laptop | 308 | 67.0% |
| Smartphone | 421 | 91.5% |
| Tablet | 233 | 50.6% |
| No Computing Device | 36 | 7.8% |
| Total | 460 | 100.0% |
Internet Access in Ashton
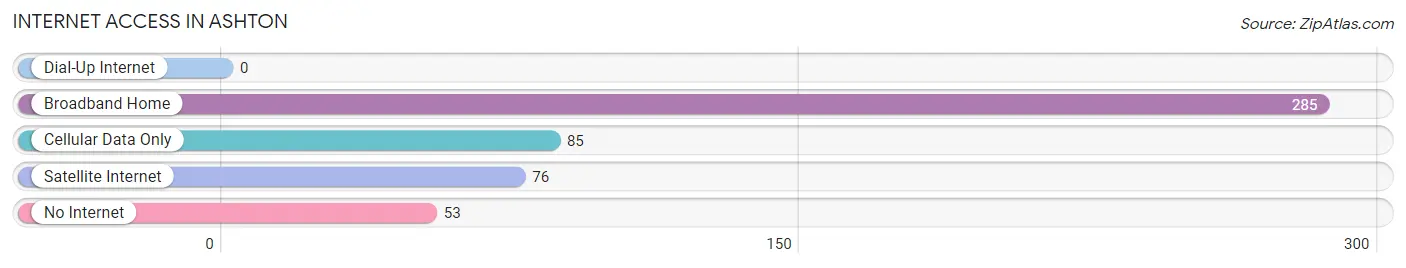
| Internet Type | # Households | % Households |
| Dial-Up Internet | 0 | 0.0% |
| Broadband Home | 285 | 62.0% |
| Cellular Data Only | 85 | 18.5% |
| Satellite Internet | 76 | 16.5% |
| No Internet | 53 | 11.5% |
| Total | 460 | 100.0% |
Ashton Summary
Ashton, Idaho is a small city located in the southeastern corner of the state, in Fremont County. It is situated at the base of the Teton Range, and is surrounded by the Targhee National Forest. Ashton is a rural community with a population of just over 1,000 people, and is known for its outdoor recreation opportunities and its proximity to Yellowstone National Park.
Geography
Ashton is located in the southeastern corner of Idaho, in Fremont County. It is situated at the base of the Teton Range, and is surrounded by the Targhee National Forest. The city is located at an elevation of 5,400 feet, and is approximately 40 miles from the Idaho-Wyoming border. The city is located on the banks of the Henry’s Fork of the Snake River, and is surrounded by mountains and forests.
The climate in Ashton is semi-arid, with hot summers and cold winters. The average annual temperature is 44 degrees Fahrenheit, and the average annual precipitation is 16 inches.
Economy
The economy of Ashton is largely based on tourism and outdoor recreation. The city is home to several resorts and lodges, as well as a variety of outdoor activities such as fishing, hunting, camping, and hiking. The city is also home to several small businesses, including restaurants, retail stores, and service providers.
The city is also home to several agricultural operations, including cattle ranches, hay farms, and potato farms. The city is also home to several manufacturing operations, including a wood products plant and a metal fabrication plant.
Demographics
As of the 2010 census, the population of Ashton was 1,068. The racial makeup of the city was 95.3% White, 0.3% African American, 0.7% Native American, 0.3% Asian, 0.1% Pacific Islander, 1.2% from other races, and 2.3% from two or more races. Hispanic or Latino of any race were 3.2% of the population.
The median household income in Ashton was $37,917, and the median family income was $45,000. The per capita income for the city was $19,945. About 11.2% of families and 14.2% of the population were below the poverty line, including 18.2% of those under age 18 and 8.3% of those age 65 or over.
Conclusion
Ashton, Idaho is a small city located in the southeastern corner of the state, in Fremont County. It is situated at the base of the Teton Range, and is surrounded by the Targhee National Forest. The city is known for its outdoor recreation opportunities and its proximity to Yellowstone National Park. The economy of Ashton is largely based on tourism and outdoor recreation, as well as agriculture and manufacturing. The population of Ashton is 1,068, and the median household income is $37,917.
Common Questions
What is Per Capita Income in Ashton?
Per Capita income in Ashton is $27,161.
What is the Median Family Income in Ashton?
Median Family Income in Ashton is $67,792.
What is the Median Household income in Ashton?
Median Household Income in Ashton is $62,819.
What is Income or Wage Gap in Ashton?
Income or Wage Gap in Ashton is 24.2%.
Women in Ashton earn 75.8 cents for every dollar earned by a man.
What is Inequality or Gini Index in Ashton?
Inequality or Gini Index in Ashton is 0.30.
What is the Total Population of Ashton?
Total Population of Ashton is 1,367.
What is the Total Male Population of Ashton?
Total Male Population of Ashton is 752.
What is the Total Female Population of Ashton?
Total Female Population of Ashton is 615.
What is the Ratio of Males per 100 Females in Ashton?
There are 122.28 Males per 100 Females in Ashton.
What is the Ratio of Females per 100 Males in Ashton?
There are 81.78 Females per 100 Males in Ashton.
What is the Median Population Age in Ashton?
Median Population Age in Ashton is 40.6 Years.
What is the Average Family Size in Ashton
Average Family Size in Ashton is 3.6 People.
What is the Average Household Size in Ashton
Average Household Size in Ashton is 2.9 People.
How Large is the Labor Force in Ashton?
There are 706 People in the Labor Forcein in Ashton.
What is the Percentage of People in the Labor Force in Ashton?
66.7% of People are in the Labor Force in Ashton.
What is the Unemployment Rate in Ashton?
Unemployment Rate in Ashton is 8.8%.