Arco, ID Map & Demographics
Arco Map
Arco Overview
$28,309
PER CAPITA INCOME
$37,317
AVG FAMILY INCOME
$35,585
AVG HOUSEHOLD INCOME
52.8%
WAGE / INCOME GAP [ % ]
47.2¢/ $1
WAGE / INCOME GAP [ $ ]
0.61
INEQUALITY / GINI INDEX
749
TOTAL POPULATION
252
MALE POPULATION
497
FEMALE POPULATION
50.70
MALES / 100 FEMALES
197.22
FEMALES / 100 MALES
37.8
MEDIAN AGE
3.2
AVG FAMILY SIZE
2.4
AVG HOUSEHOLD SIZE
253
LABOR FORCE [ PEOPLE ]
45.2%
PERCENT IN LABOR FORCE
Arco Zip Codes
Arco Area Codes
Income in Arco
Income Overview in Arco
Per Capita Income in Arco is $28,309, while median incomes of families and households are $37,317 and $35,585 respectively.
| Characteristic | Number | Measure |
| Per Capita Income | 749 | $28,309 |
| Median Family Income | 176 | $37,317 |
| Mean Family Income | 176 | $94,140 |
| Median Household Income | 300 | $35,585 |
| Mean Household Income | 300 | $68,361 |
| Income Deficit | 176 | $0 |
| Wage / Income Gap (%) | 749 | 52.76% |
| Wage / Income Gap ($) | 749 | 47.24¢ per $1 |
| Gini / Inequality Index | 749 | 0.61 |
Earnings by Sex in Arco
Average Earnings in Arco are $29,732, $41,458 for men and $19,583 for women, a difference of 52.8%.

| Sex | Number | Average Earnings |
| Male | 114 (41.8%) | $41,458 |
| Female | 159 (58.2%) | $19,583 |
| Total | 273 (100.0%) | $29,732 |
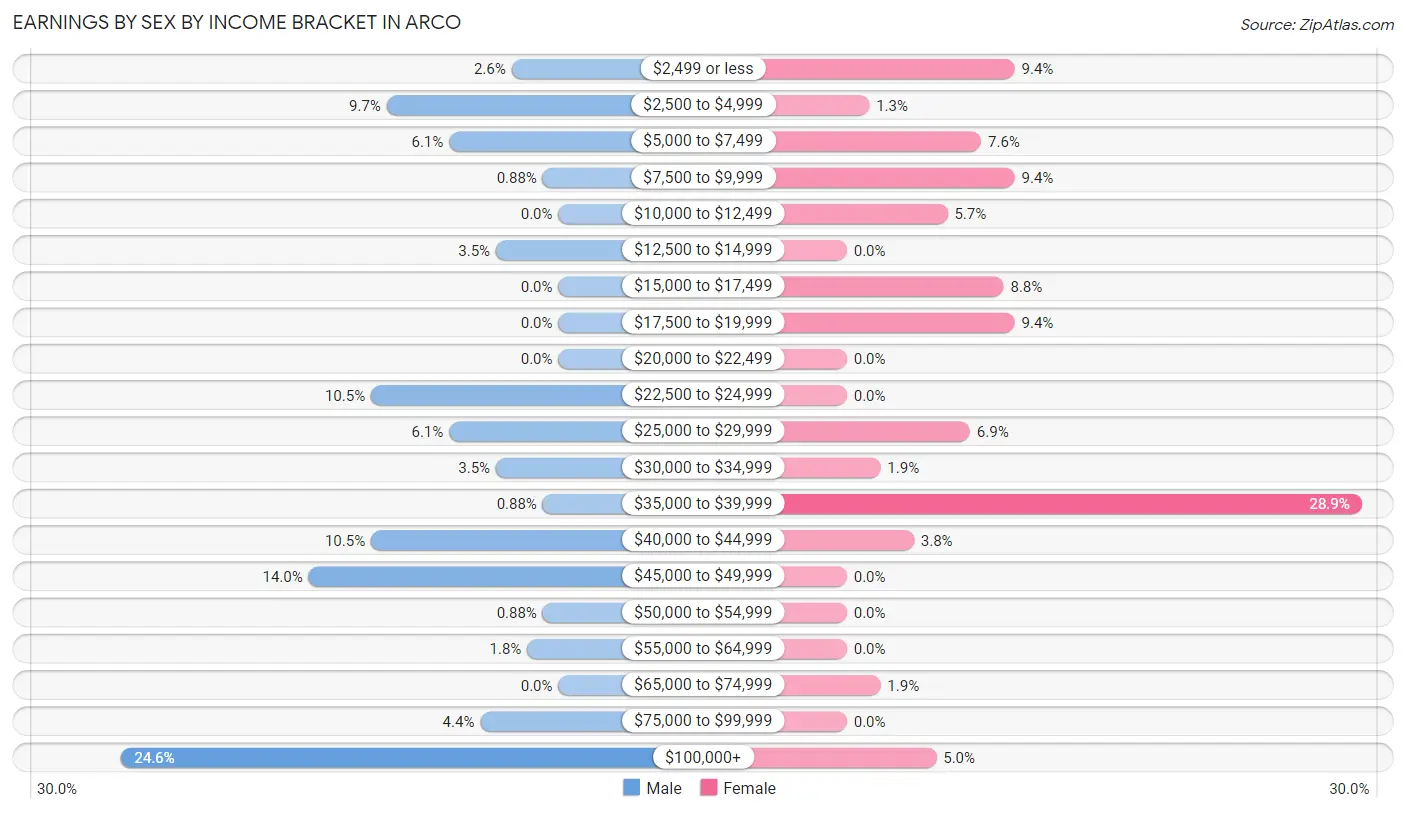
Earnings by Sex by Income Bracket in Arco
The most common earnings brackets in Arco are $100,000+ for men (28 | 24.6%) and $35,000 to $39,999 for women (46 | 28.9%).
| Income | Male | Female |
| $2,499 or less | 3 (2.6%) | 15 (9.4%) |
| $2,500 to $4,999 | 11 (9.7%) | 2 (1.3%) |
| $5,000 to $7,499 | 7 (6.1%) | 12 (7.5%) |
| $7,500 to $9,999 | 1 (0.9%) | 15 (9.4%) |
| $10,000 to $12,499 | 0 (0.0%) | 9 (5.7%) |
| $12,500 to $14,999 | 4 (3.5%) | 0 (0.0%) |
| $15,000 to $17,499 | 0 (0.0%) | 14 (8.8%) |
| $17,500 to $19,999 | 0 (0.0%) | 15 (9.4%) |
| $20,000 to $22,499 | 0 (0.0%) | 0 (0.0%) |
| $22,500 to $24,999 | 12 (10.5%) | 0 (0.0%) |
| $25,000 to $29,999 | 7 (6.1%) | 11 (6.9%) |
| $30,000 to $34,999 | 4 (3.5%) | 3 (1.9%) |
| $35,000 to $39,999 | 1 (0.9%) | 46 (28.9%) |
| $40,000 to $44,999 | 12 (10.5%) | 6 (3.8%) |
| $45,000 to $49,999 | 16 (14.0%) | 0 (0.0%) |
| $50,000 to $54,999 | 1 (0.9%) | 0 (0.0%) |
| $55,000 to $64,999 | 2 (1.8%) | 0 (0.0%) |
| $65,000 to $74,999 | 0 (0.0%) | 3 (1.9%) |
| $75,000 to $99,999 | 5 (4.4%) | 0 (0.0%) |
| $100,000+ | 28 (24.6%) | 8 (5.0%) |
| Total | 114 (100.0%) | 159 (100.0%) |
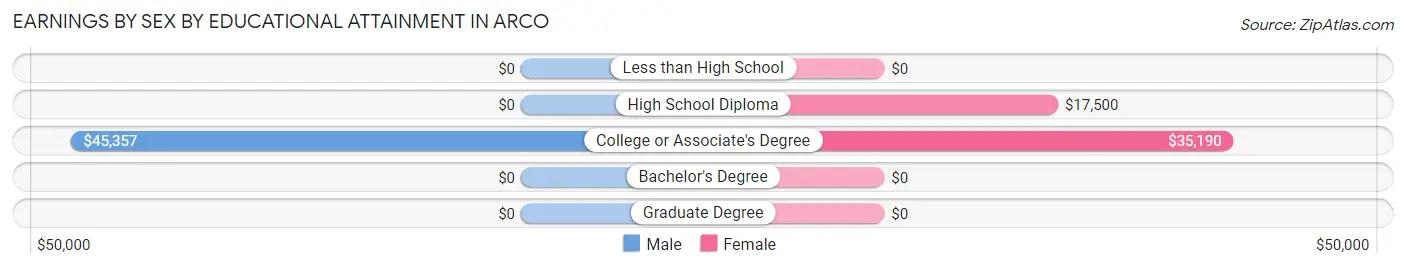
Earnings by Sex by Educational Attainment in Arco
Average earnings in Arco are $41,458 for men and $26,250 for women, a difference of 36.7%. Men with an educational attainment of college or associate's degree enjoy the highest average annual earnings of $45,357, while those with college or associate's degree education earn the least with $45,357. Women with an educational attainment of college or associate's degree earn the most with the average annual earnings of $35,190, while those with high school diploma education have the smallest earnings of $17,500.
| Educational Attainment | Male Income | Female Income |
| Less than High School | - | - |
| High School Diploma | - | - |
| College or Associate's Degree | $45,357 | $35,190 |
| Bachelor's Degree | - | - |
| Graduate Degree | - | - |
| Total | $41,458 | $26,250 |
Family Income in Arco
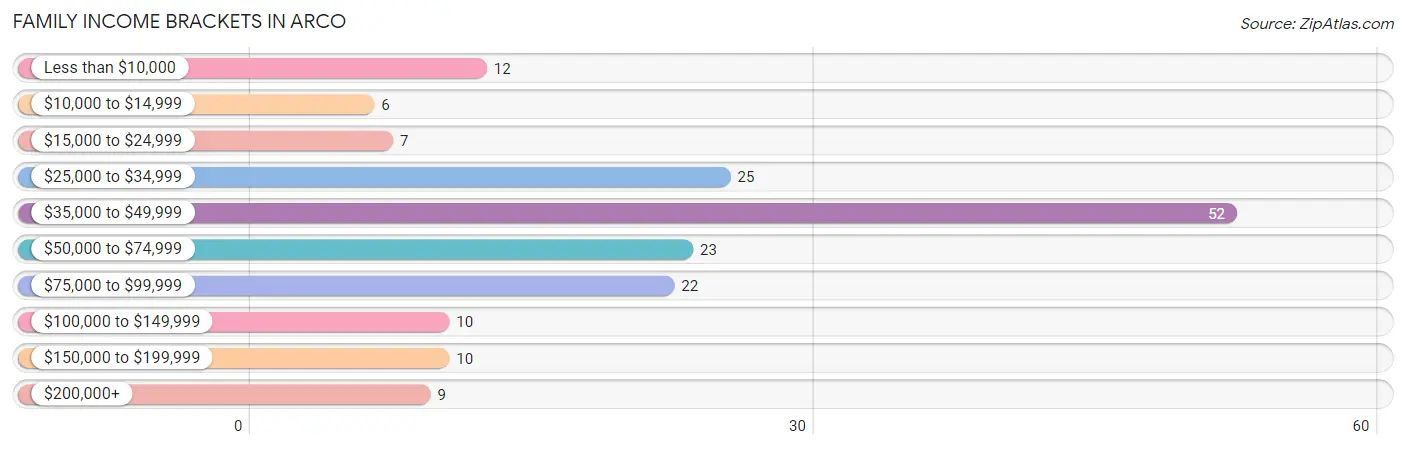
Family Income Brackets in Arco
According to the Arco family income data, there are 52 families falling into the $35,000 to $49,999 income range, which is the most common income bracket and makes up 29.5% of all families. Conversely, the $10,000 to $14,999 income bracket is the least frequent group with only 6 families (3.4%) belonging to this category.
| Income Bracket | # Families | % Families |
| Less than $10,000 | 12 | 6.8% |
| $10,000 to $14,999 | 6 | 3.4% |
| $15,000 to $24,999 | 7 | 4.0% |
| $25,000 to $34,999 | 25 | 14.2% |
| $35,000 to $49,999 | 52 | 29.5% |
| $50,000 to $74,999 | 23 | 13.1% |
| $75,000 to $99,999 | 22 | 12.5% |
| $100,000 to $149,999 | 10 | 5.7% |
| $150,000 to $199,999 | 10 | 5.7% |
| $200,000+ | 9 | 5.1% |
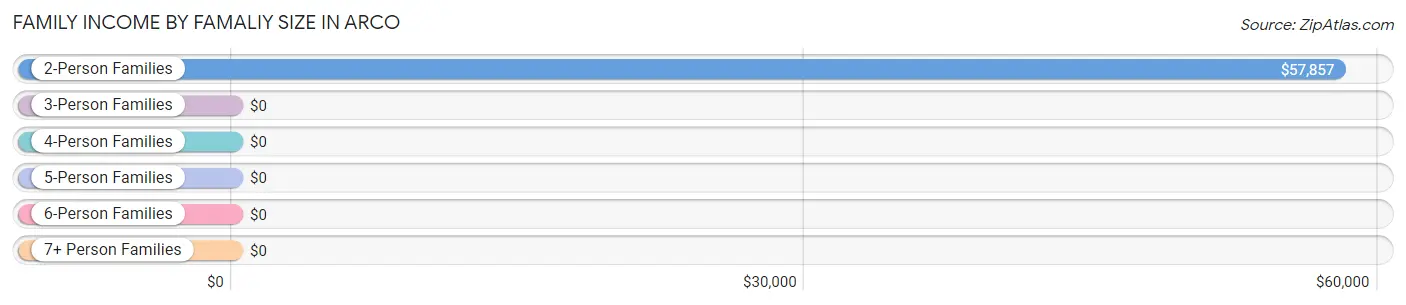
Family Income by Famaliy Size in Arco
2-person families (94 | 53.4%) account for the highest median family income in Arco with $57,857 per family, while 2-person families (94 | 53.4%) have the highest median income of $28,928 per family member.
| Income Bracket | # Families | Median Income |
| 2-Person Families | 94 (53.4%) | $57,857 |
| 3-Person Families | 4 (2.3%) | $0 |
| 4-Person Families | 19 (10.8%) | $0 |
| 5-Person Families | 16 (9.1%) | $0 |
| 6-Person Families | 40 (22.7%) | $0 |
| 7+ Person Families | 3 (1.7%) | $0 |
| Total | 176 (100.0%) | $37,317 |
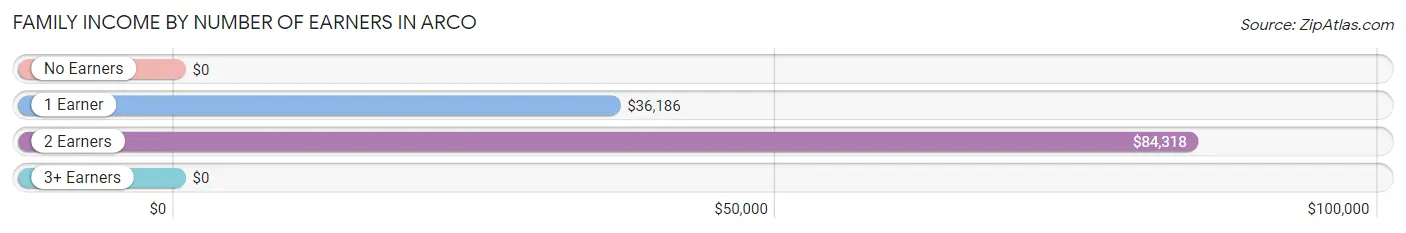
Family Income by Number of Earners in Arco
| Number of Earners | # Families | Median Income |
| No Earners | 38 (21.6%) | $0 |
| 1 Earner | 87 (49.4%) | $36,186 |
| 2 Earners | 48 (27.3%) | $84,318 |
| 3+ Earners | 3 (1.7%) | $0 |
| Total | 176 (100.0%) | $37,317 |
Household Income in Arco
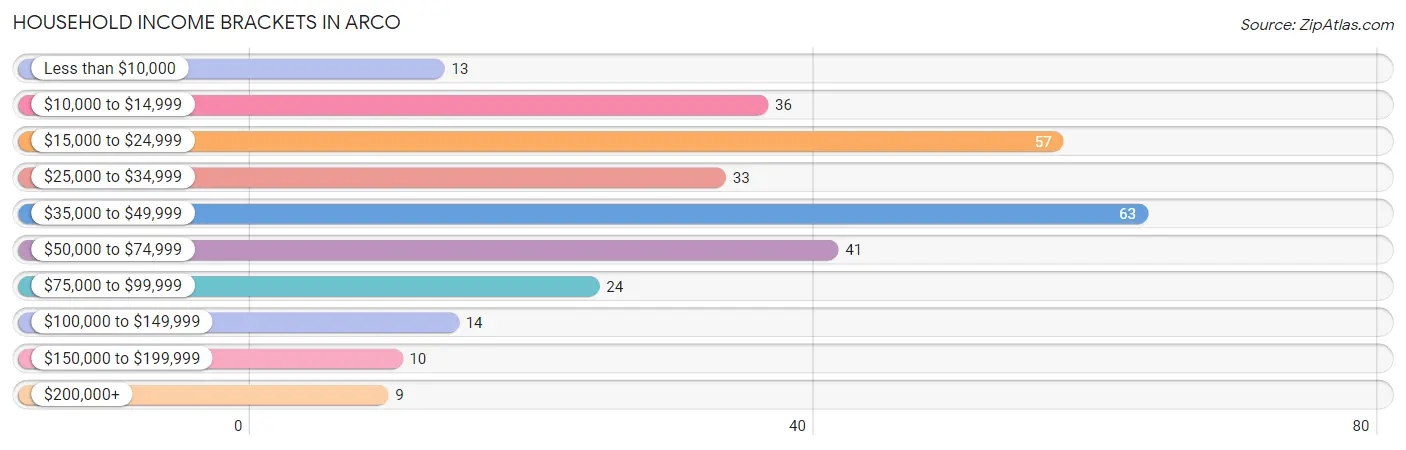
Household Income Brackets in Arco
With 63 households falling in the category, the $35,000 to $49,999 income range is the most frequent in Arco, accounting for 21.0% of all households. In contrast, only 9 households (3.0%) fall into the $200,000+ income bracket, making it the least populous group.
| Income Bracket | # Households | % Households |
| Less than $10,000 | 13 | 4.3% |
| $10,000 to $14,999 | 36 | 12.0% |
| $15,000 to $24,999 | 57 | 19.0% |
| $25,000 to $34,999 | 33 | 11.0% |
| $35,000 to $49,999 | 63 | 21.0% |
| $50,000 to $74,999 | 41 | 13.7% |
| $75,000 to $99,999 | 24 | 8.0% |
| $100,000 to $149,999 | 14 | 4.7% |
| $150,000 to $199,999 | 10 | 3.3% |
| $200,000+ | 9 | 3.0% |
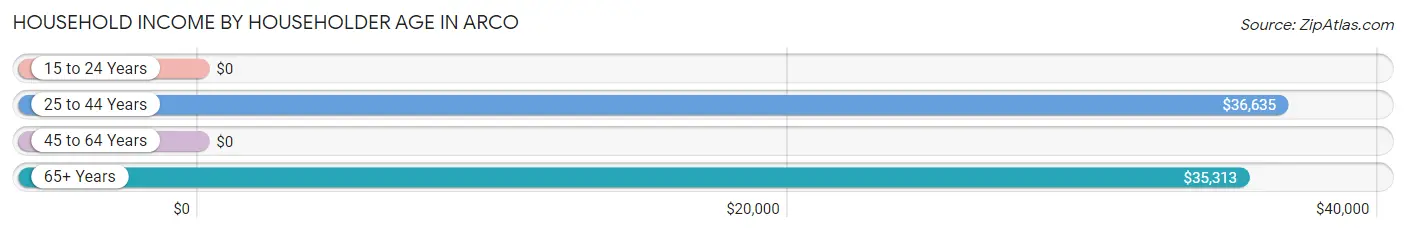
Household Income by Householder Age in Arco
The median household income in Arco is $35,585, with the highest median household income of $36,635 found in the 25 to 44 years age bracket for the primary householder. A total of 115 households (38.3%) fall into this category. Meanwhile, the 15 to 24 years age bracket for the primary householder has the lowest median household income of $0, with 5 households (1.7%) in this group.
| Income Bracket | # Households | Median Income |
| 15 to 24 Years | 5 (1.7%) | $0 |
| 25 to 44 Years | 115 (38.3%) | $36,635 |
| 45 to 64 Years | 102 (34.0%) | $0 |
| 65+ Years | 78 (26.0%) | $35,313 |
| Total | 300 (100.0%) | $35,585 |
Poverty in Arco
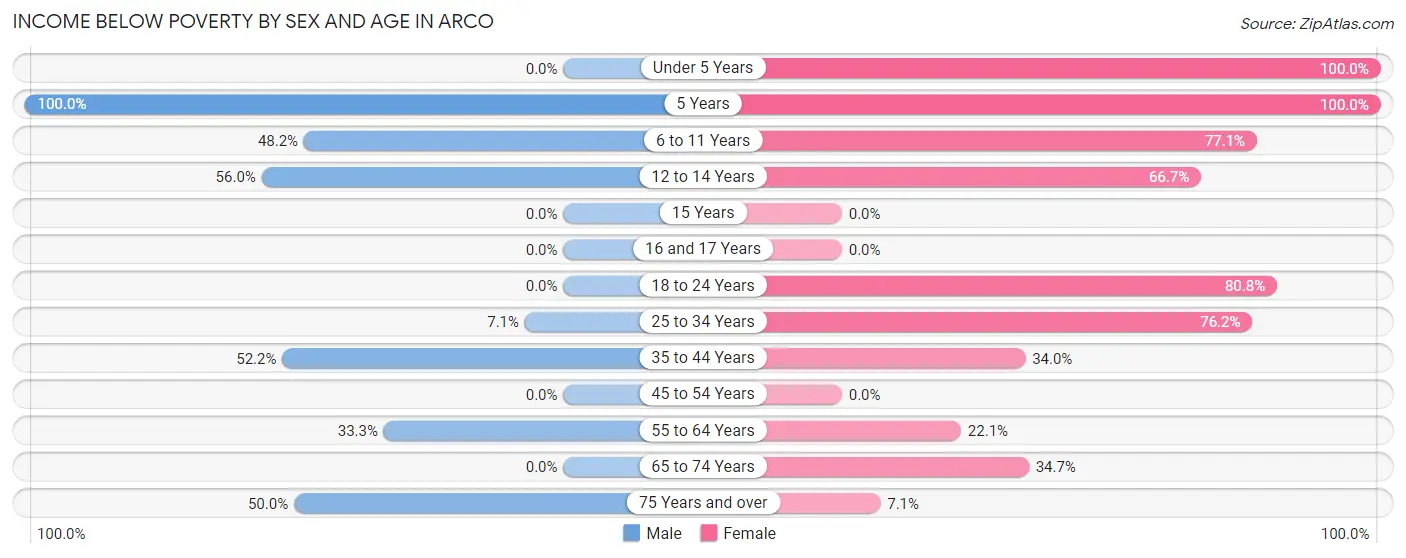
Income Below Poverty by Sex and Age in Arco
With 29.3% poverty level for males and 49.7% for females among the residents of Arco, 5 year old males and under 5 year old females are the most vulnerable to poverty, with 3 males (100.0%) and 34 females (100.0%) in their respective age groups living below the poverty level.
| Age Bracket | Male | Female |
| Under 5 Years | 0 (0.0%) | 34 (100.0%) |
| 5 Years | 3 (100.0%) | 14 (100.0%) |
| 6 to 11 Years | 13 (48.1%) | 47 (77.0%) |
| 12 to 14 Years | 14 (56.0%) | 14 (66.7%) |
| 15 Years | 0 (0.0%) | 0 (0.0%) |
| 16 and 17 Years | 0 (0.0%) | 0 (0.0%) |
| 18 to 24 Years | 0 (0.0%) | 21 (80.8%) |
| 25 to 34 Years | 2 (7.1%) | 48 (76.2%) |
| 35 to 44 Years | 12 (52.2%) | 16 (34.0%) |
| 45 to 54 Years | 0 (0.0%) | 0 (0.0%) |
| 55 to 64 Years | 20 (33.3%) | 21 (22.1%) |
| 65 to 74 Years | 0 (0.0%) | 17 (34.7%) |
| 75 Years and over | 6 (50.0%) | 2 (7.1%) |
| Total | 70 (29.3%) | 234 (49.7%) |
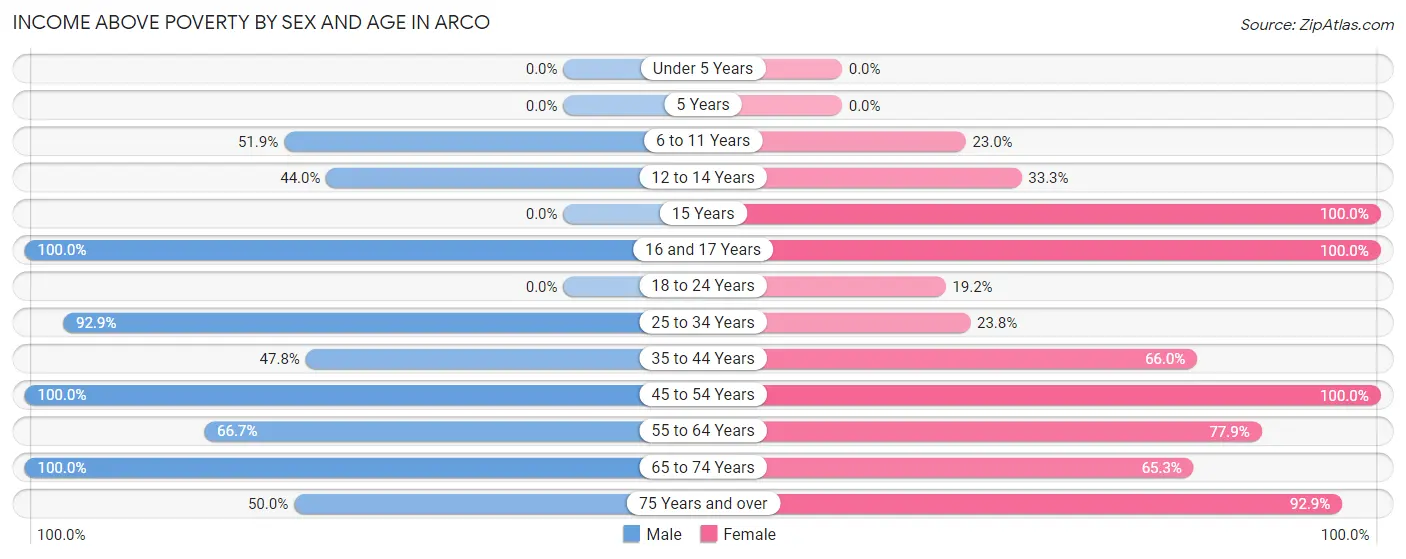
Income Above Poverty by Sex and Age in Arco
According to the poverty statistics in Arco, males aged 16 and 17 years and females aged 15 years are the age groups that are most secure financially, with 100.0% of males and 100.0% of females in these age groups living above the poverty line.
| Age Bracket | Male | Female |
| Under 5 Years | 0 (0.0%) | 0 (0.0%) |
| 5 Years | 0 (0.0%) | 0 (0.0%) |
| 6 to 11 Years | 14 (51.8%) | 14 (23.0%) |
| 12 to 14 Years | 11 (44.0%) | 7 (33.3%) |
| 15 Years | 0 (0.0%) | 4 (100.0%) |
| 16 and 17 Years | 9 (100.0%) | 12 (100.0%) |
| 18 to 24 Years | 0 (0.0%) | 5 (19.2%) |
| 25 to 34 Years | 26 (92.9%) | 15 (23.8%) |
| 35 to 44 Years | 11 (47.8%) | 31 (66.0%) |
| 45 to 54 Years | 16 (100.0%) | 17 (100.0%) |
| 55 to 64 Years | 40 (66.7%) | 74 (77.9%) |
| 65 to 74 Years | 36 (100.0%) | 32 (65.3%) |
| 75 Years and over | 6 (50.0%) | 26 (92.9%) |
| Total | 169 (70.7%) | 237 (50.3%) |
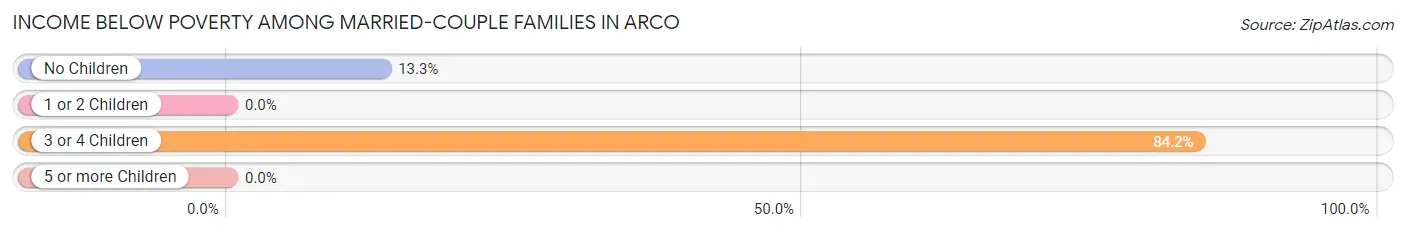
Income Below Poverty Among Married-Couple Families in Arco
The poverty statistics for married-couple families in Arco show that 24.1% or 26 of the total 108 families live below the poverty line. Families with 3 or 4 children have the highest poverty rate of 84.2%, comprising of 16 families. On the other hand, families with 1 or 2 children have the lowest poverty rate of 0.0%, which includes 0 families.
| Children | Above Poverty | Below Poverty |
| No Children | 65 (86.7%) | 10 (13.3%) |
| 1 or 2 Children | 11 (100.0%) | 0 (0.0%) |
| 3 or 4 Children | 3 (15.8%) | 16 (84.2%) |
| 5 or more Children | 3 (100.0%) | 0 (0.0%) |
| Total | 82 (75.9%) | 26 (24.1%) |
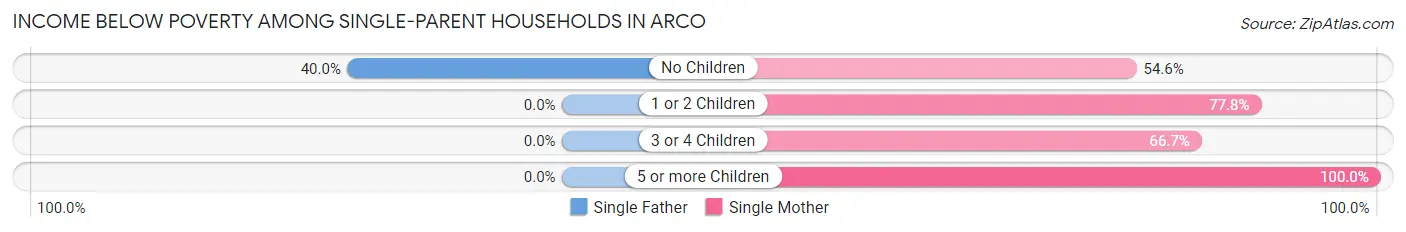
Income Below Poverty Among Single-Parent Households in Arco
According to the poverty data in Arco, 40.0% or 2 single-father households and 85.7% or 54 single-mother households are living below the poverty line. Among single-father households, those with no children have the highest poverty rate, with 2 households (40.0%) experiencing poverty. Likewise, among single-mother households, those with 5 or more children have the highest poverty rate, with 37 households (100.0%) falling below the poverty line.
| Children | Single Father | Single Mother |
| No Children | 2 (40.0%) | 6 (54.5%) |
| 1 or 2 Children | 0 (0.0%) | 7 (77.8%) |
| 3 or 4 Children | 0 (0.0%) | 4 (66.7%) |
| 5 or more Children | 0 (0.0%) | 37 (100.0%) |
| Total | 2 (40.0%) | 54 (85.7%) |
Income Below Poverty Among Married-Couple vs Single-Parent Households in Arco
The poverty data for Arco shows that 26 of the married-couple family households (24.1%) and 56 of the single-parent households (82.4%) are living below the poverty level. Within the married-couple family households, those with 3 or 4 children have the highest poverty rate, with 16 households (84.2%) falling below the poverty line. Among the single-parent households, those with 5 or more children have the highest poverty rate, with 37 household (100.0%) living below poverty.
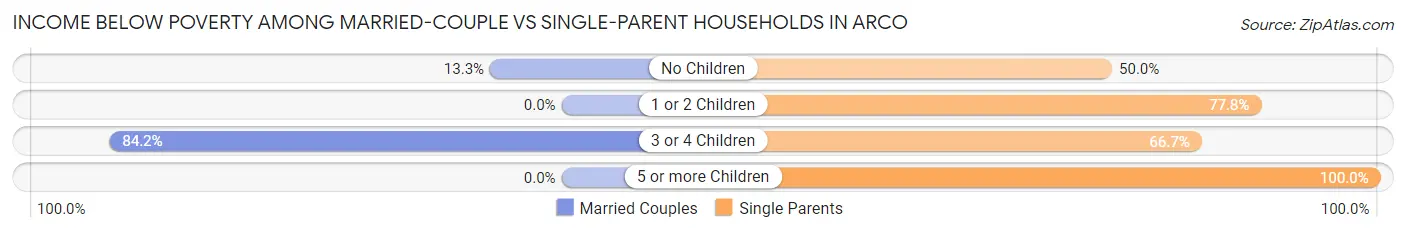
| Children | Married-Couple Families | Single-Parent Households |
| No Children | 10 (13.3%) | 8 (50.0%) |
| 1 or 2 Children | 0 (0.0%) | 7 (77.8%) |
| 3 or 4 Children | 16 (84.2%) | 4 (66.7%) |
| 5 or more Children | 0 (0.0%) | 37 (100.0%) |
| Total | 26 (24.1%) | 56 (82.4%) |
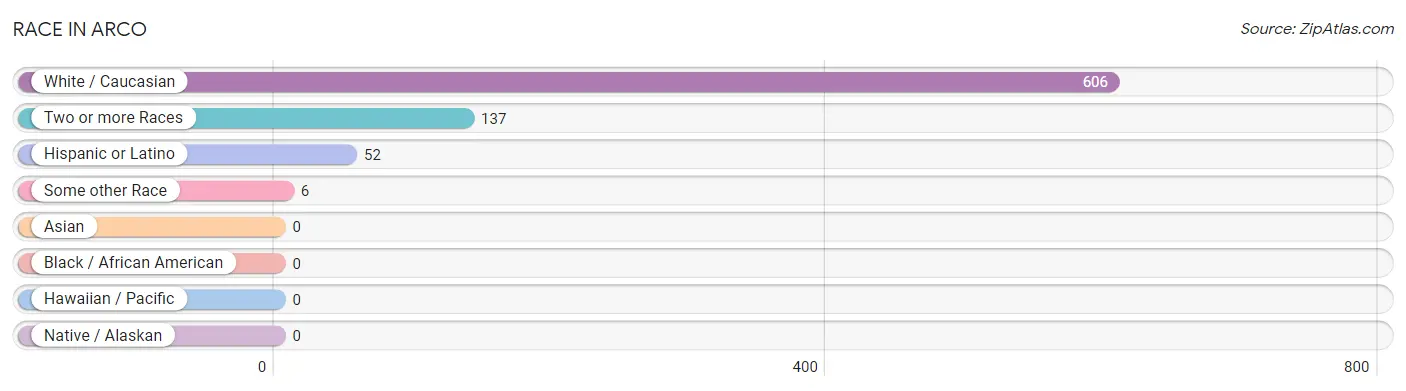
Race in Arco
The most populous races in Arco are White / Caucasian (606 | 80.9%), Two or more Races (137 | 18.3%), and Hispanic or Latino (52 | 6.9%).
| Race | # Population | % Population |
| Asian | 0 | 0.0% |
| Black / African American | 0 | 0.0% |
| Hawaiian / Pacific | 0 | 0.0% |
| Hispanic or Latino | 52 | 6.9% |
| Native / Alaskan | 0 | 0.0% |
| White / Caucasian | 606 | 80.9% |
| Two or more Races | 137 | 18.3% |
| Some other Race | 6 | 0.8% |
| Total | 749 | 100.0% |
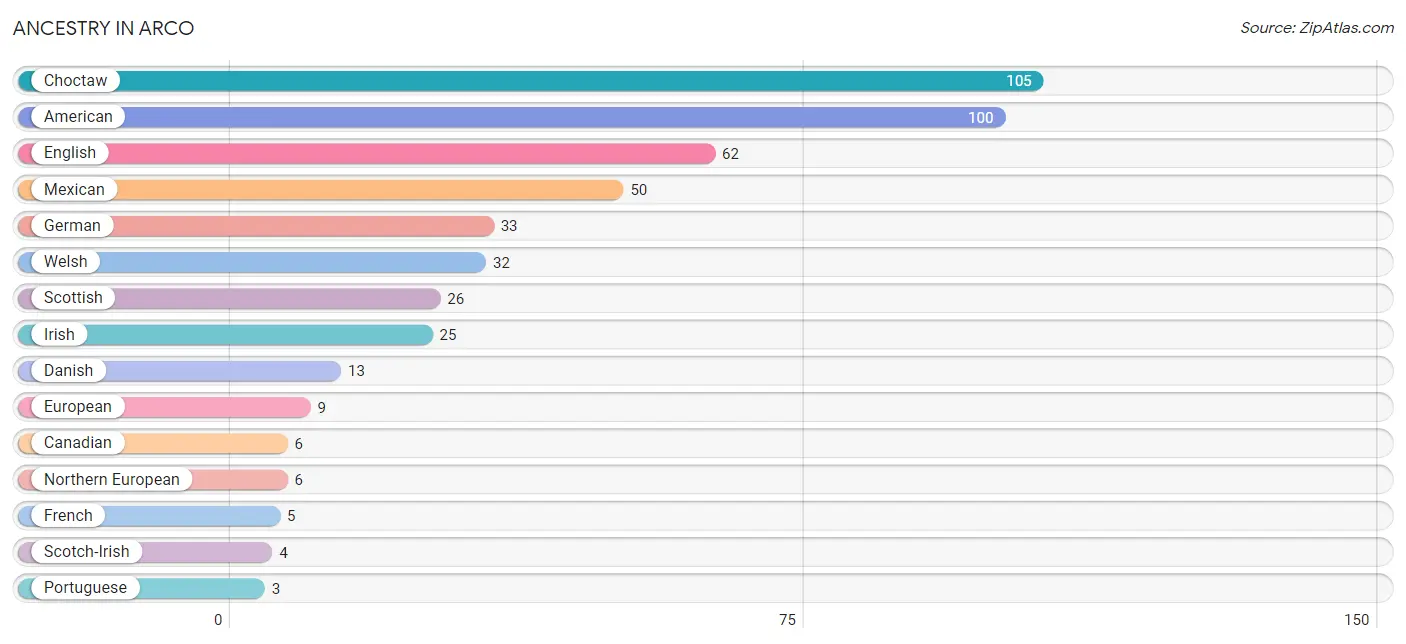
Ancestry in Arco
The most populous ancestries reported in Arco are Choctaw (105 | 14.0%), American (100 | 13.4%), English (62 | 8.3%), Mexican (50 | 6.7%), and German (33 | 4.4%), together accounting for 46.7% of all Arco residents.
| Ancestry | # Population | % Population |
| American | 100 | 13.4% |
| Canadian | 6 | 0.8% |
| Choctaw | 105 | 14.0% |
| Cuban | 2 | 0.3% |
| Danish | 13 | 1.7% |
| English | 62 | 8.3% |
| European | 9 | 1.2% |
| Finnish | 2 | 0.3% |
| French | 5 | 0.7% |
| French Canadian | 1 | 0.1% |
| German | 33 | 4.4% |
| Irish | 25 | 3.3% |
| Italian | 2 | 0.3% |
| Mexican | 50 | 6.7% |
| Northern European | 6 | 0.8% |
| Portuguese | 3 | 0.4% |
| Scandinavian | 1 | 0.1% |
| Scotch-Irish | 4 | 0.5% |
| Scottish | 26 | 3.5% |
| Welsh | 32 | 4.3% | View All 20 Rows |
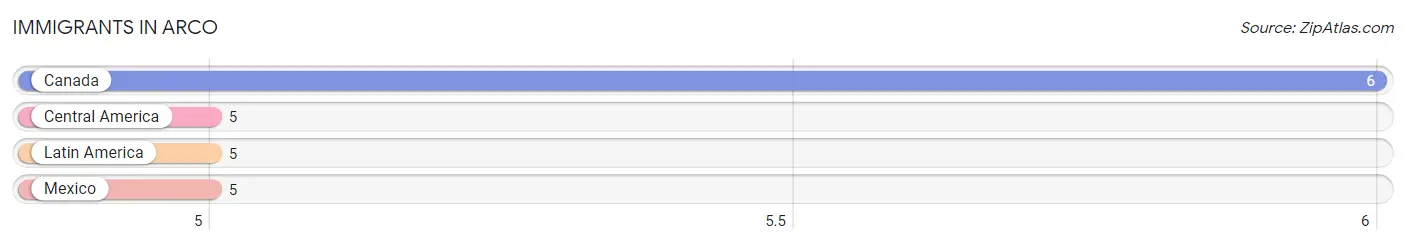
Immigrants in Arco
The most numerous immigrant groups reported in Arco came from Canada (6 | 0.8%), Central America (5 | 0.7%), Latin America (5 | 0.7%), and Mexico (5 | 0.7%), together accounting for 2.8% of all Arco residents.
| Immigration Origin | # Population | % Population |
| Canada | 6 | 0.8% |
| Central America | 5 | 0.7% |
| Latin America | 5 | 0.7% |
| Mexico | 5 | 0.7% | View All 4 Rows |
Sex and Age in Arco
Sex and Age in Arco
The most populous age groups in Arco are 60 to 64 Years (50 | 19.8%) for men and 5 to 9 Years (72 | 14.5%) for women.
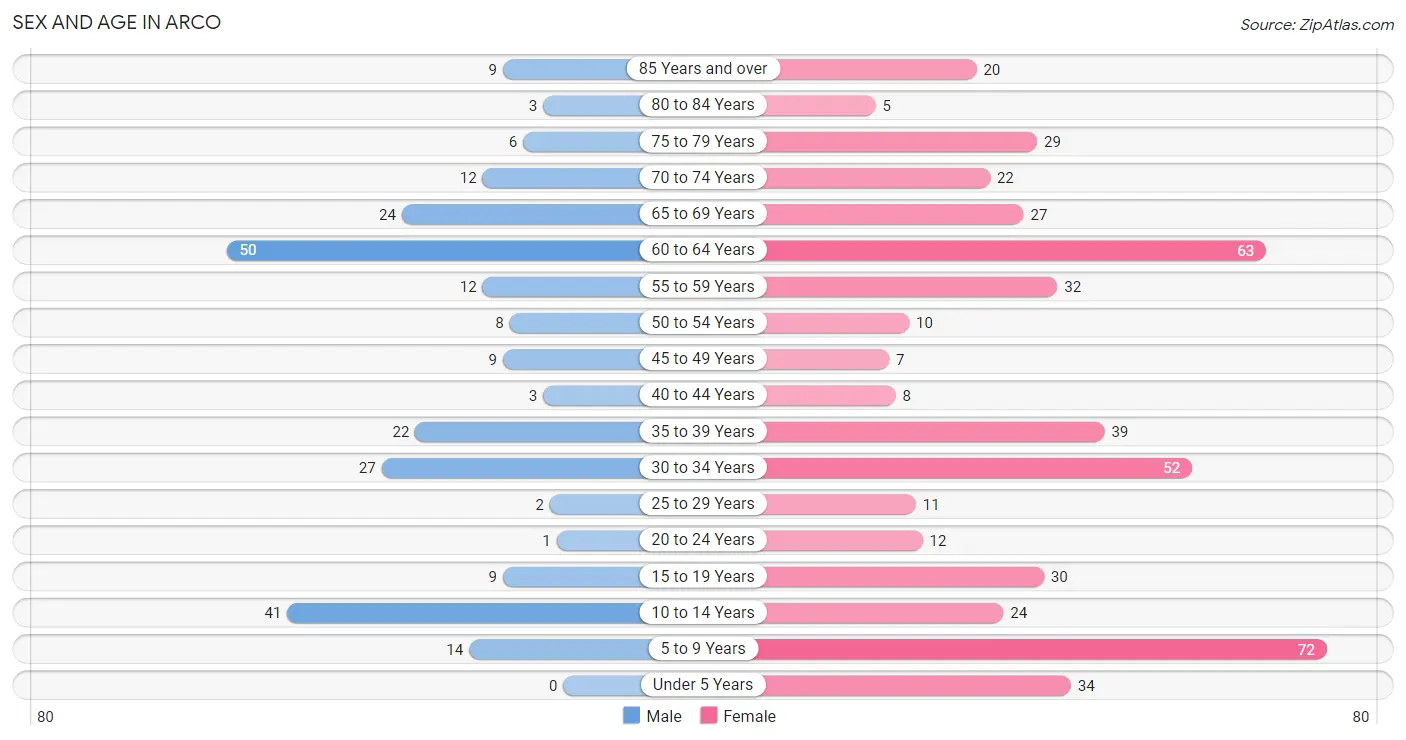
| Age Bracket | Male | Female |
| Under 5 Years | 0 (0.0%) | 34 (6.8%) |
| 5 to 9 Years | 14 (5.6%) | 72 (14.5%) |
| 10 to 14 Years | 41 (16.3%) | 24 (4.8%) |
| 15 to 19 Years | 9 (3.6%) | 30 (6.0%) |
| 20 to 24 Years | 1 (0.4%) | 12 (2.4%) |
| 25 to 29 Years | 2 (0.8%) | 11 (2.2%) |
| 30 to 34 Years | 27 (10.7%) | 52 (10.5%) |
| 35 to 39 Years | 22 (8.7%) | 39 (7.9%) |
| 40 to 44 Years | 3 (1.2%) | 8 (1.6%) |
| 45 to 49 Years | 9 (3.6%) | 7 (1.4%) |
| 50 to 54 Years | 8 (3.2%) | 10 (2.0%) |
| 55 to 59 Years | 12 (4.8%) | 32 (6.4%) |
| 60 to 64 Years | 50 (19.8%) | 63 (12.7%) |
| 65 to 69 Years | 24 (9.5%) | 27 (5.4%) |
| 70 to 74 Years | 12 (4.8%) | 22 (4.4%) |
| 75 to 79 Years | 6 (2.4%) | 29 (5.8%) |
| 80 to 84 Years | 3 (1.2%) | 5 (1.0%) |
| 85 Years and over | 9 (3.6%) | 20 (4.0%) |
| Total | 252 (100.0%) | 497 (100.0%) |
Families and Households in Arco
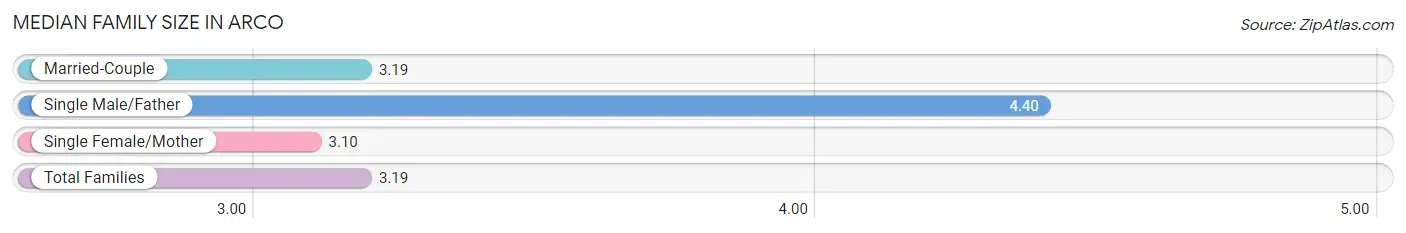
Median Family Size in Arco
The median family size in Arco is 3.19 persons per family, with single male/father families (5 | 2.8%) accounting for the largest median family size of 4.4 persons per family. On the other hand, single female/mother families (63 | 35.8%) represent the smallest median family size with 3.10 persons per family.
| Family Type | # Families | Family Size |
| Married-Couple | 108 (61.4%) | 3.19 |
| Single Male/Father | 5 (2.8%) | 4.40 |
| Single Female/Mother | 63 (35.8%) | 3.10 |
| Total Families | 176 (100.0%) | 3.19 |
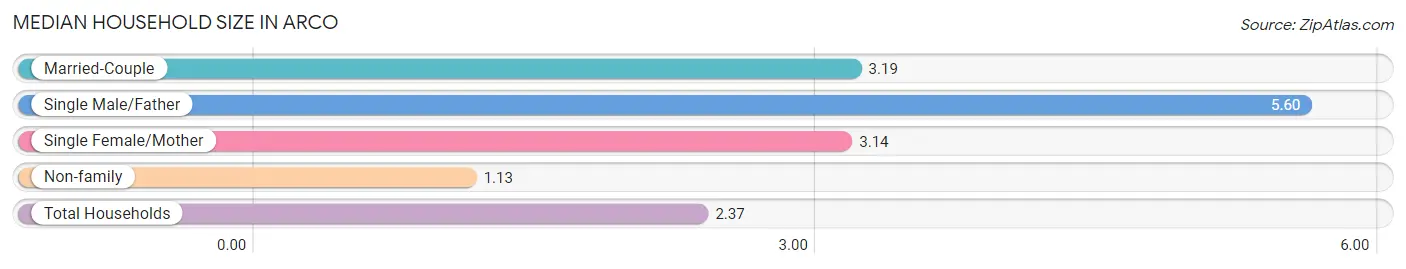
Median Household Size in Arco
The median household size in Arco is 2.37 persons per household, with single male/father households (5 | 1.7%) accounting for the largest median household size of 5.6 persons per household. non-family households (124 | 41.3%) represent the smallest median household size with 1.13 persons per household.
| Household Type | # Households | Household Size |
| Married-Couple | 108 (36.0%) | 3.19 |
| Single Male/Father | 5 (1.7%) | 5.60 |
| Single Female/Mother | 63 (21.0%) | 3.14 |
| Non-family | 124 (41.3%) | 1.13 |
| Total Households | 300 (100.0%) | 2.37 |
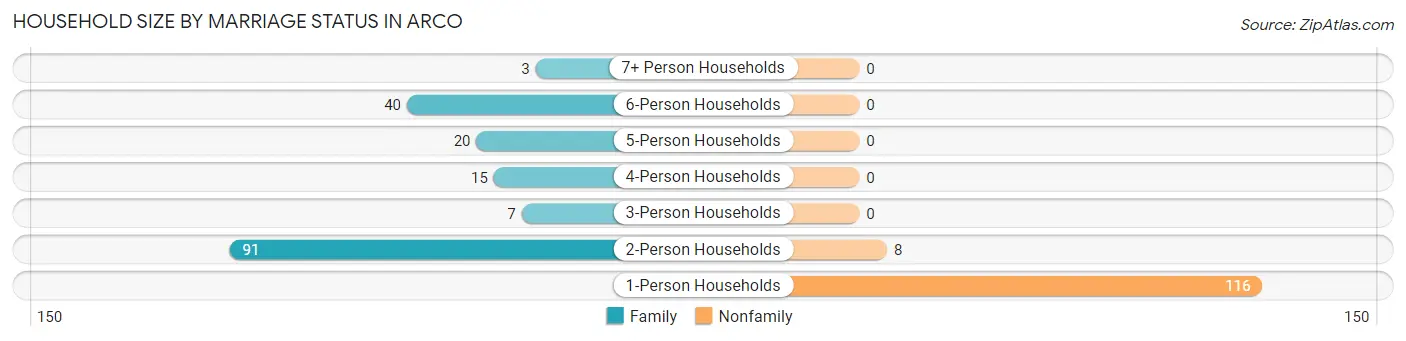
Household Size by Marriage Status in Arco
Out of a total of 300 households in Arco, 176 (58.7%) are family households, while 124 (41.3%) are nonfamily households. The most numerous type of family households are 2-person households, comprising 91, and the most common type of nonfamily households are 1-person households, comprising 116.
| Household Size | Family Households | Nonfamily Households |
| 1-Person Households | - | 116 (38.7%) |
| 2-Person Households | 91 (30.3%) | 8 (2.7%) |
| 3-Person Households | 7 (2.3%) | 0 (0.0%) |
| 4-Person Households | 15 (5.0%) | 0 (0.0%) |
| 5-Person Households | 20 (6.7%) | 0 (0.0%) |
| 6-Person Households | 40 (13.3%) | 0 (0.0%) |
| 7+ Person Households | 3 (1.0%) | 0 (0.0%) |
| Total | 176 (58.7%) | 124 (41.3%) |
Female Fertility in Arco
Fertility by Age in Arco
| Age Bracket | Women with Births | Births / 1,000 Women |
| 15 to 19 years | 0 (0.0%) | 0.0 |
| 20 to 34 years | 0 (0.0%) | 0.0 |
| 35 to 50 years | 0 (0.0%) | 0.0 |
| Total | 0 (0.0%) | 0.0 |
Fertility by Age by Marriage Status in Arco
| Age Bracket | Married | Unmarried |
| 15 to 19 years | 0 (0.0%) | 0 (0.0%) |
| 20 to 34 years | 0 (0.0%) | 0 (0.0%) |
| 35 to 50 years | 0 (0.0%) | 0 (0.0%) |
| Total | 0 (0.0%) | 0 (0.0%) |
Fertility by Education in Arco
| Educational Attainment | Women with Births | Births / 1,000 Women |
| Less than High School | 0 (0.0%) | 0.0 |
| High School Diploma | 0 (0.0%) | 0.0 |
| College or Associate's Degree | 0 (0.0%) | 0.0 |
| Bachelor's Degree | 0 (0.0%) | 0.0 |
| Graduate Degree | 0 (0.0%) | 0.0 |
| Total | 0 (0.0%) | 0.0 |
Fertility by Education by Marriage Status in Arco
| Educational Attainment | Married | Unmarried |
| Less than High School | 0 (0.0%) | 0 (0.0%) |
| High School Diploma | 0 (0.0%) | 0 (0.0%) |
| College or Associate's Degree | 0 (0.0%) | 0 (0.0%) |
| Bachelor's Degree | 0 (0.0%) | 0 (0.0%) |
| Graduate Degree | 0 (0.0%) | 0 (0.0%) |
| Total | 0 (0.0%) | 0 (0.0%) |
Employment Characteristics in Arco
Employment by Class of Employer in Arco
Among the 250 employed individuals in Arco, private company employees (162 | 64.8%), federal government employees (28 | 11.2%), and local government employees (20 | 8.0%) make up the most common classes of employment.
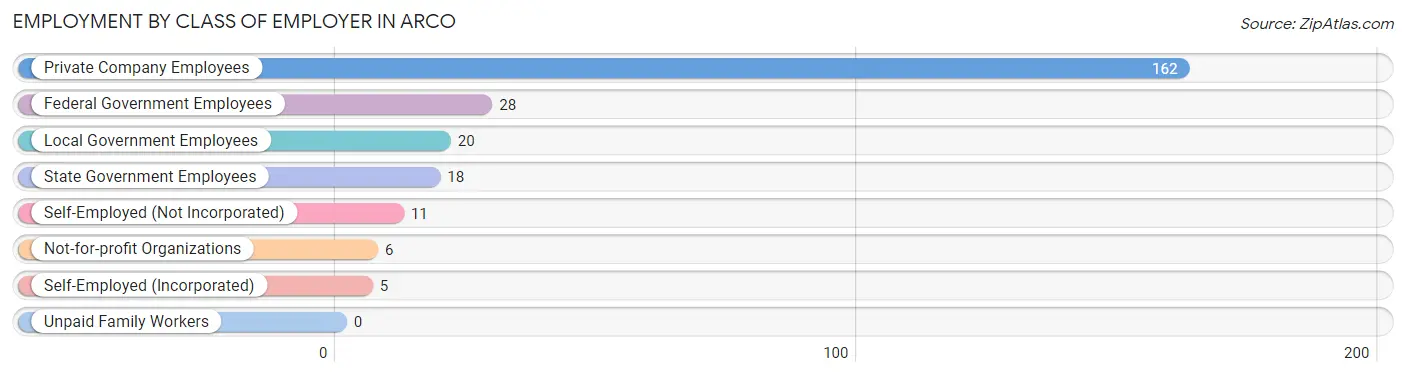
| Employer Class | # Employees | % Employees |
| Private Company Employees | 162 | 64.8% |
| Self-Employed (Incorporated) | 5 | 2.0% |
| Self-Employed (Not Incorporated) | 11 | 4.4% |
| Not-for-profit Organizations | 6 | 2.4% |
| Local Government Employees | 20 | 8.0% |
| State Government Employees | 18 | 7.2% |
| Federal Government Employees | 28 | 11.2% |
| Unpaid Family Workers | 0 | 0.0% |
| Total | 250 | 100.0% |
Employment Status by Age in Arco
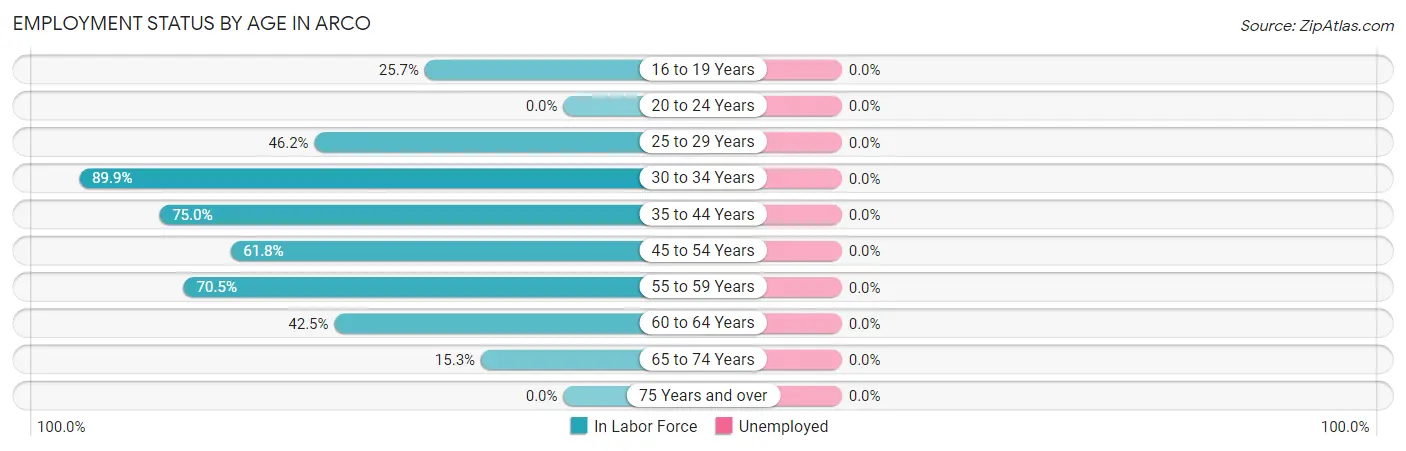
| Age Bracket | In Labor Force | Unemployed |
| 16 to 19 Years | 9 (25.7%) | 0 (0.0%) |
| 20 to 24 Years | 0 (0.0%) | 0 (0.0%) |
| 25 to 29 Years | 6 (46.2%) | 0 (0.0%) |
| 30 to 34 Years | 71 (89.9%) | 0 (0.0%) |
| 35 to 44 Years | 54 (75.0%) | 0 (0.0%) |
| 45 to 54 Years | 21 (61.8%) | 0 (0.0%) |
| 55 to 59 Years | 31 (70.5%) | 0 (0.0%) |
| 60 to 64 Years | 48 (42.5%) | 0 (0.0%) |
| 65 to 74 Years | 13 (15.3%) | 0 (0.0%) |
| 75 Years and over | 0 (0.0%) | 0 (0.0%) |
| Total | 253 (45.2%) | 0 (0.0%) |
Employment Status by Educational Attainment in Arco
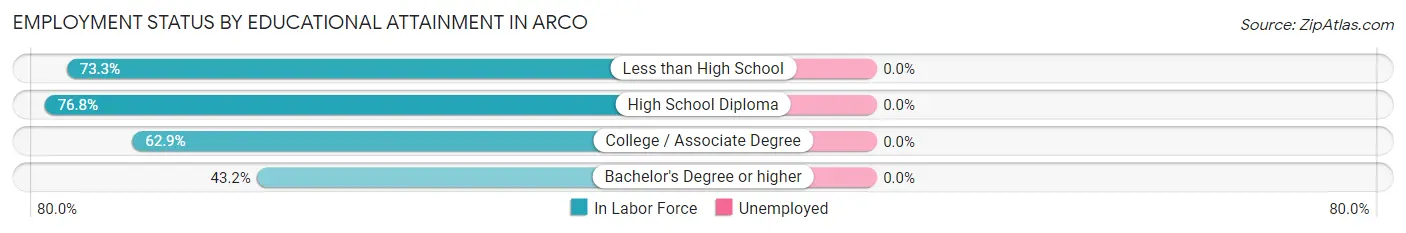
| Educational Attainment | In Labor Force | Unemployed |
| Less than High School | 22 (73.3%) | 0 (0.0%) |
| High School Diploma | 73 (76.8%) | 0 (0.0%) |
| College / Associate Degree | 117 (62.9%) | 0 (0.0%) |
| Bachelor's Degree or higher | 19 (43.2%) | 0 (0.0%) |
| Total | 231 (65.1%) | 0 (0.0%) |
Employment Occupations by Sex in Arco
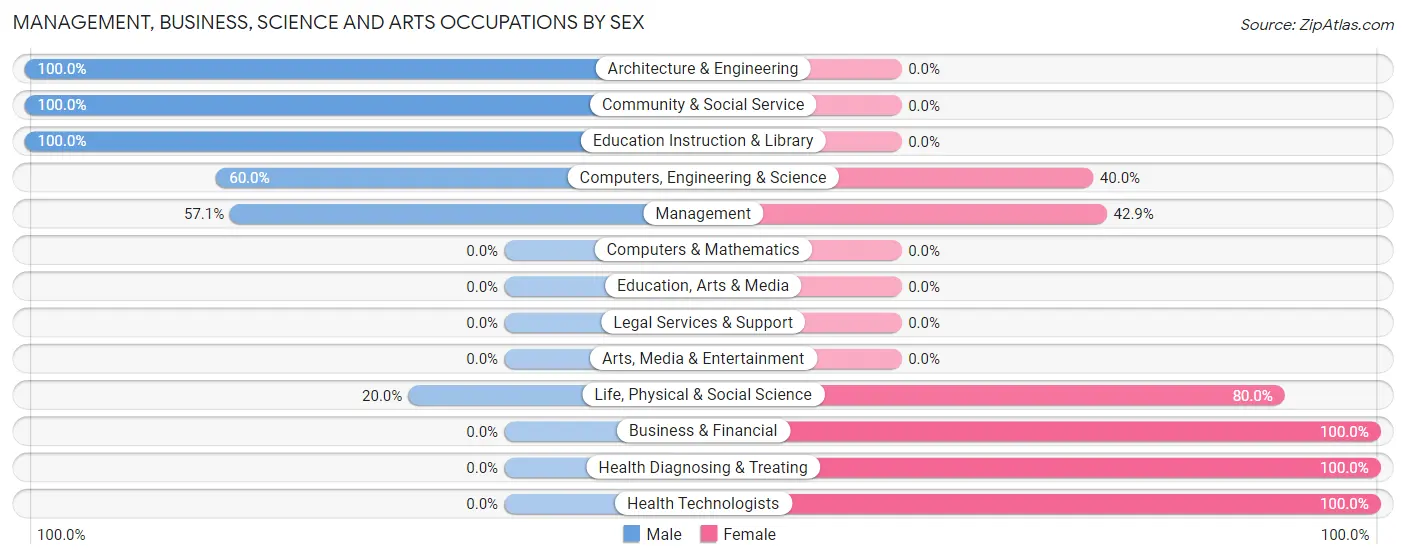
Management, Business, Science and Arts Occupations
The most common Management, Business, Science and Arts occupations in Arco are Computers, Engineering & Science (20 | 7.9%), Health Diagnosing & Treating (12 | 4.7%), Architecture & Engineering (10 | 4.0%), Life, Physical & Social Science (10 | 4.0%), and Management (7 | 2.8%).
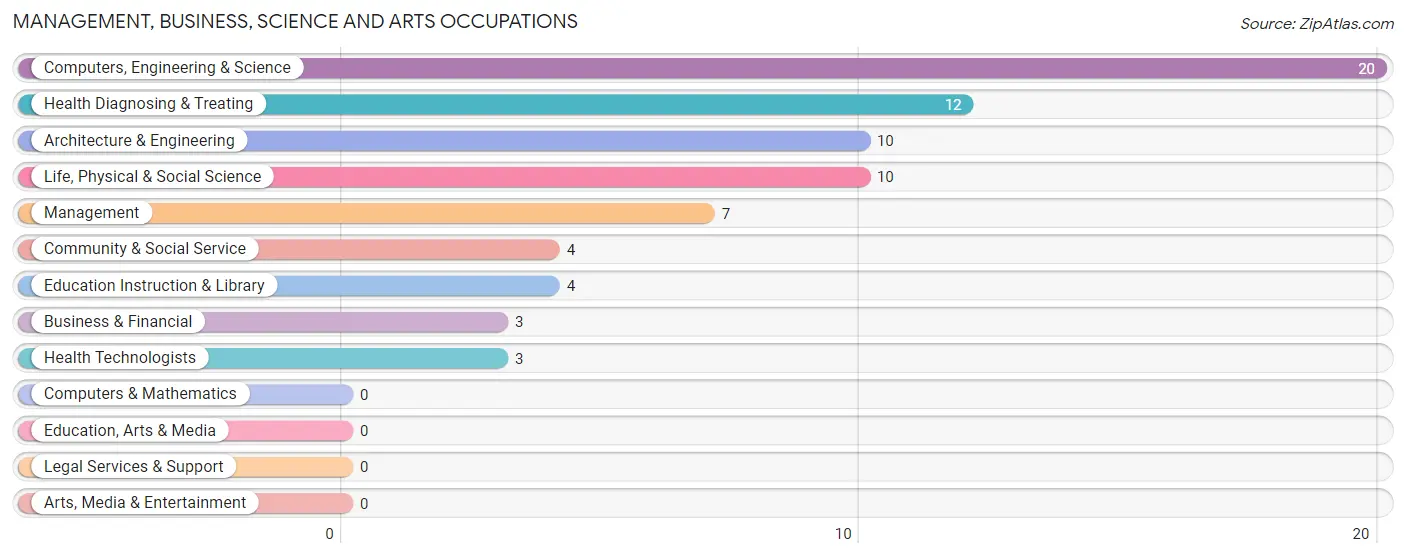
Management, Business, Science and Arts Occupations by Sex
Within the Management, Business, Science and Arts occupations in Arco, the most male-oriented occupations are Architecture & Engineering (100.0%), Community & Social Service (100.0%), and Education Instruction & Library (100.0%), while the most female-oriented occupations are Business & Financial (100.0%), Health Diagnosing & Treating (100.0%), and Health Technologists (100.0%).
| Occupation | Male | Female |
| Management | 4 (57.1%) | 3 (42.9%) |
| Business & Financial | 0 (0.0%) | 3 (100.0%) |
| Computers, Engineering & Science | 12 (60.0%) | 8 (40.0%) |
| Computers & Mathematics | 0 (0.0%) | 0 (0.0%) |
| Architecture & Engineering | 10 (100.0%) | 0 (0.0%) |
| Life, Physical & Social Science | 2 (20.0%) | 8 (80.0%) |
| Community & Social Service | 4 (100.0%) | 0 (0.0%) |
| Education, Arts & Media | 0 (0.0%) | 0 (0.0%) |
| Legal Services & Support | 0 (0.0%) | 0 (0.0%) |
| Education Instruction & Library | 4 (100.0%) | 0 (0.0%) |
| Arts, Media & Entertainment | 0 (0.0%) | 0 (0.0%) |
| Health Diagnosing & Treating | 0 (0.0%) | 12 (100.0%) |
| Health Technologists | 0 (0.0%) | 3 (100.0%) |
| Total (Category) | 20 (43.5%) | 26 (56.5%) |
| Total (Overall) | 105 (41.5%) | 148 (58.5%) |
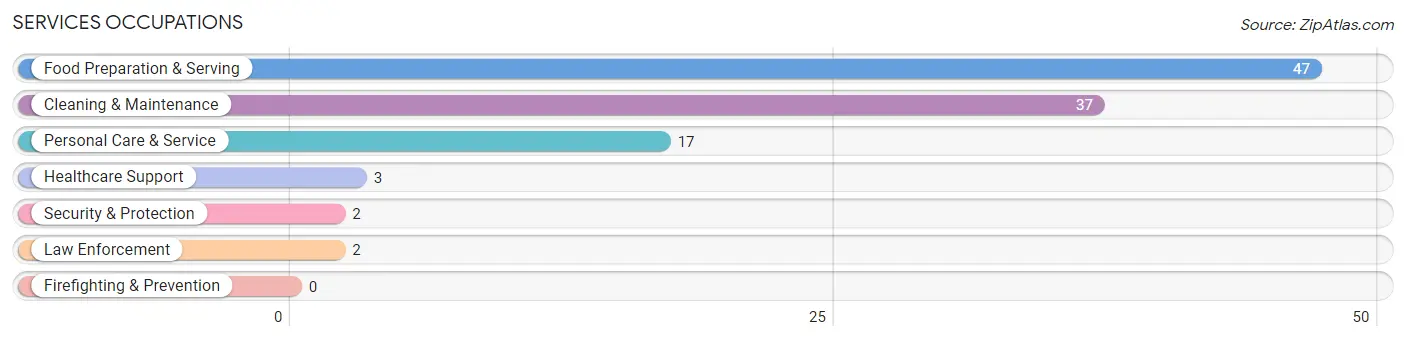
Services Occupations
The most common Services occupations in Arco are Food Preparation & Serving (47 | 18.6%), Cleaning & Maintenance (37 | 14.6%), Personal Care & Service (17 | 6.7%), Healthcare Support (3 | 1.2%), and Security & Protection (2 | 0.8%).
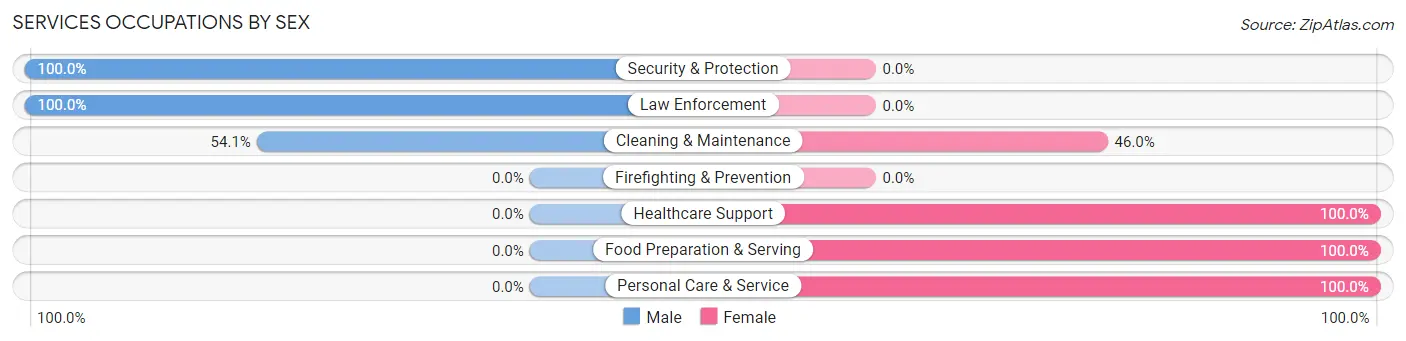
Services Occupations by Sex
Within the Services occupations in Arco, the most male-oriented occupations are Security & Protection (100.0%), Law Enforcement (100.0%), and Cleaning & Maintenance (54.0%), while the most female-oriented occupations are Healthcare Support (100.0%), Food Preparation & Serving (100.0%), and Personal Care & Service (100.0%).
| Occupation | Male | Female |
| Healthcare Support | 0 (0.0%) | 3 (100.0%) |
| Security & Protection | 2 (100.0%) | 0 (0.0%) |
| Firefighting & Prevention | 0 (0.0%) | 0 (0.0%) |
| Law Enforcement | 2 (100.0%) | 0 (0.0%) |
| Food Preparation & Serving | 0 (0.0%) | 47 (100.0%) |
| Cleaning & Maintenance | 20 (54.0%) | 17 (46.0%) |
| Personal Care & Service | 0 (0.0%) | 17 (100.0%) |
| Total (Category) | 22 (20.7%) | 84 (79.2%) |
| Total (Overall) | 105 (41.5%) | 148 (58.5%) |
Sales and Office Occupations
The most common Sales and Office occupations in Arco are Office & Administration (17 | 6.7%), and Sales & Related (2 | 0.8%).

Sales and Office Occupations by Sex

| Occupation | Male | Female |
| Sales & Related | 2 (100.0%) | 0 (0.0%) |
| Office & Administration | 0 (0.0%) | 17 (100.0%) |
| Total (Category) | 2 (10.5%) | 17 (89.5%) |
| Total (Overall) | 105 (41.5%) | 148 (58.5%) |
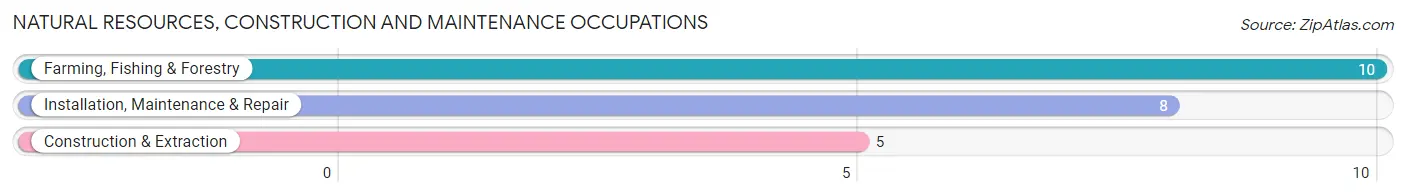
Natural Resources, Construction and Maintenance Occupations
The most common Natural Resources, Construction and Maintenance occupations in Arco are Farming, Fishing & Forestry (10 | 4.0%), Installation, Maintenance & Repair (8 | 3.2%), and Construction & Extraction (5 | 2.0%).
Natural Resources, Construction and Maintenance Occupations by Sex

| Occupation | Male | Female |
| Farming, Fishing & Forestry | 5 (50.0%) | 5 (50.0%) |
| Construction & Extraction | 5 (100.0%) | 0 (0.0%) |
| Installation, Maintenance & Repair | 8 (100.0%) | 0 (0.0%) |
| Total (Category) | 18 (78.3%) | 5 (21.7%) |
| Total (Overall) | 105 (41.5%) | 148 (58.5%) |
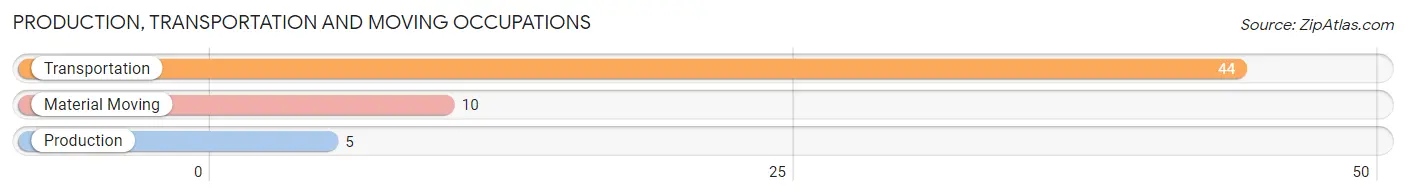
Production, Transportation and Moving Occupations
The most common Production, Transportation and Moving occupations in Arco are Transportation (44 | 17.4%), Material Moving (10 | 4.0%), and Production (5 | 2.0%).
Production, Transportation and Moving Occupations by Sex
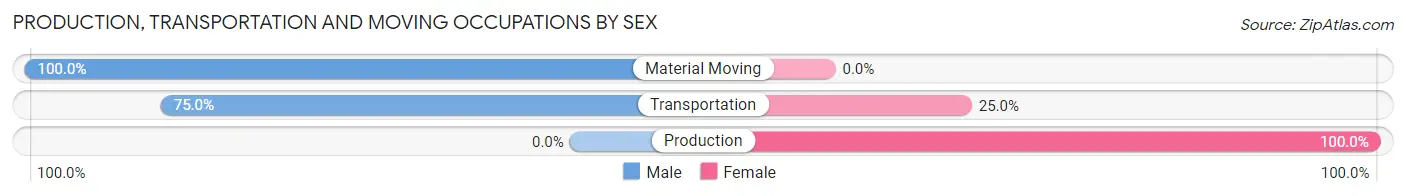
| Occupation | Male | Female |
| Production | 0 (0.0%) | 5 (100.0%) |
| Transportation | 33 (75.0%) | 11 (25.0%) |
| Material Moving | 10 (100.0%) | 0 (0.0%) |
| Total (Category) | 43 (72.9%) | 16 (27.1%) |
| Total (Overall) | 105 (41.5%) | 148 (58.5%) |
Employment Industries by Sex in Arco
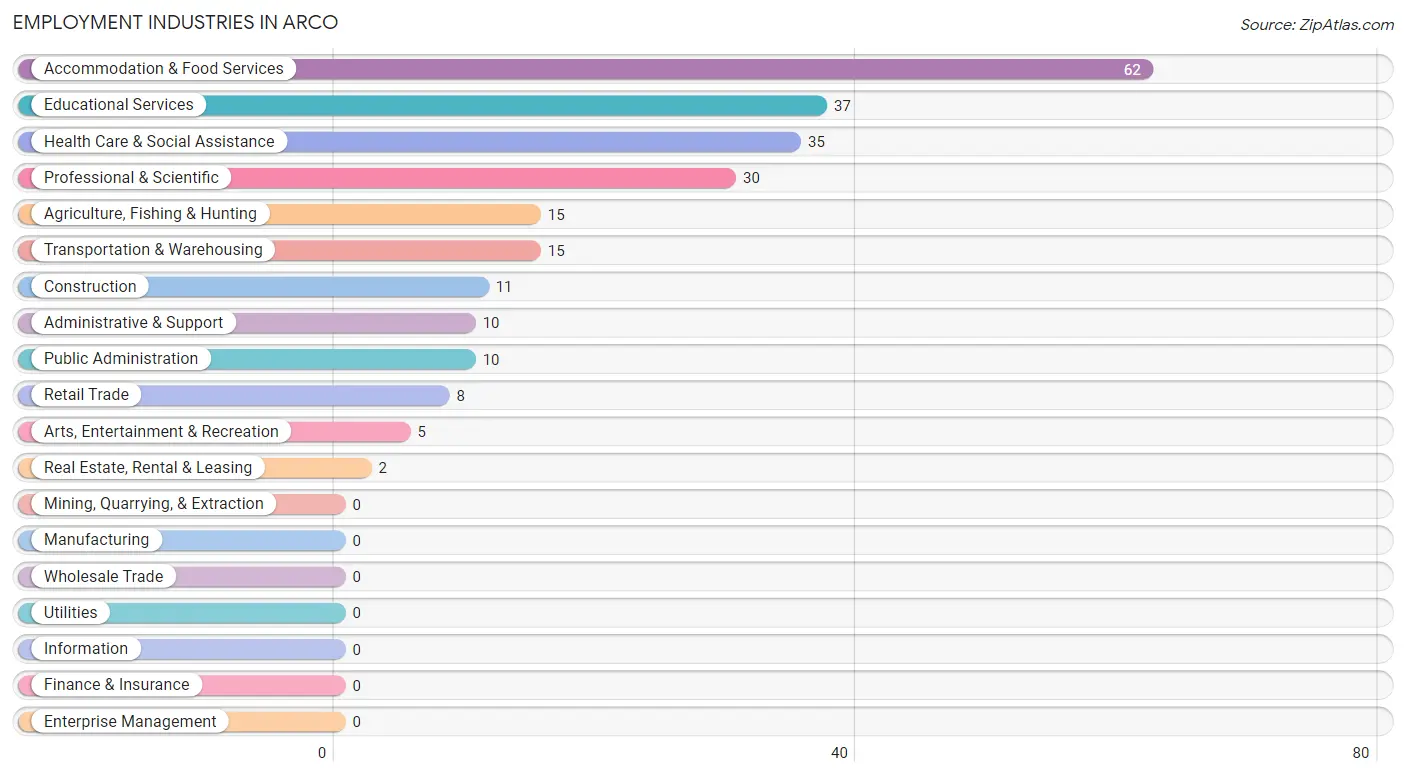
Employment Industries in Arco
The major employment industries in Arco include Accommodation & Food Services (62 | 24.5%), Educational Services (37 | 14.6%), Health Care & Social Assistance (35 | 13.8%), Professional & Scientific (30 | 11.9%), and Agriculture, Fishing & Hunting (15 | 5.9%).
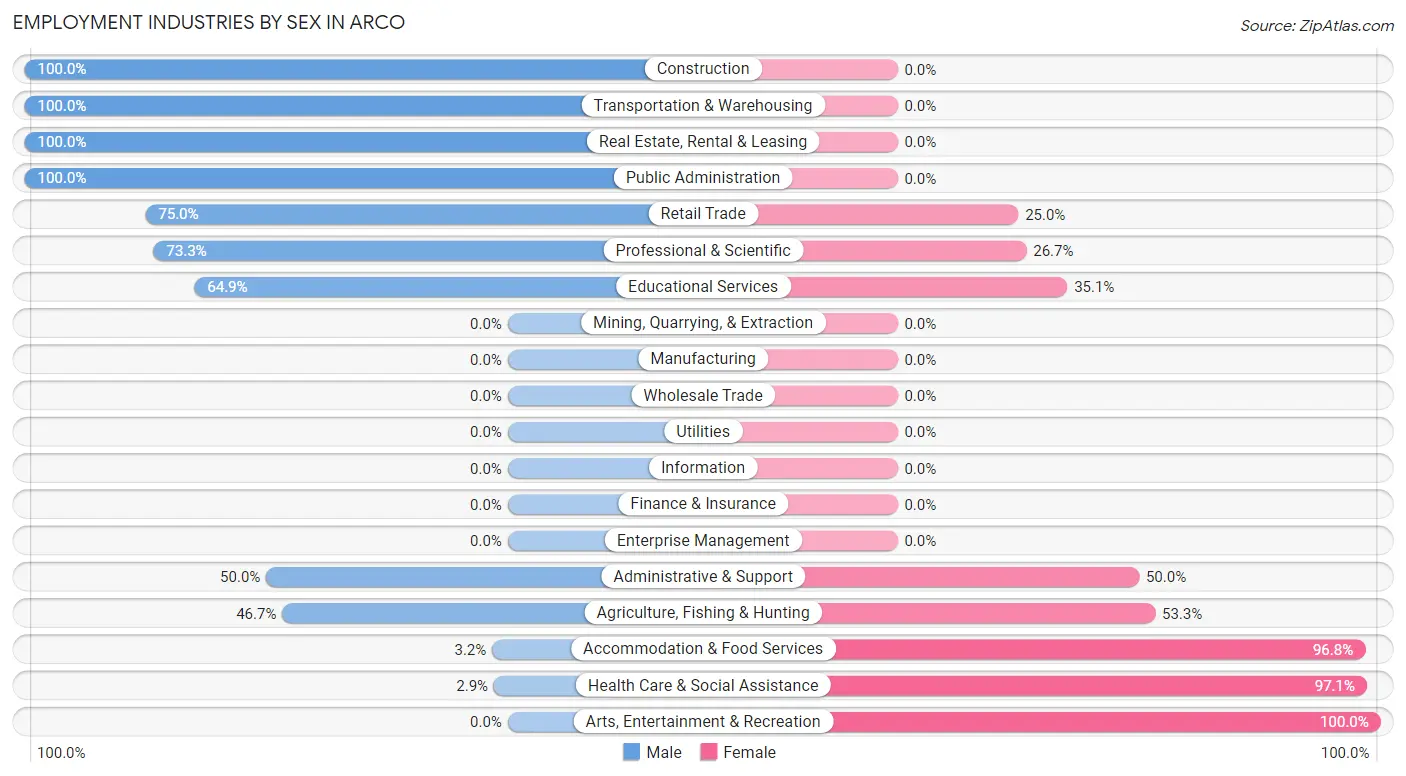
Employment Industries by Sex in Arco
The Arco industries that see more men than women are Construction (100.0%), Transportation & Warehousing (100.0%), and Real Estate, Rental & Leasing (100.0%), whereas the industries that tend to have a higher number of women are Arts, Entertainment & Recreation (100.0%), Health Care & Social Assistance (97.1%), and Accommodation & Food Services (96.8%).
| Industry | Male | Female |
| Agriculture, Fishing & Hunting | 7 (46.7%) | 8 (53.3%) |
| Mining, Quarrying, & Extraction | 0 (0.0%) | 0 (0.0%) |
| Construction | 11 (100.0%) | 0 (0.0%) |
| Manufacturing | 0 (0.0%) | 0 (0.0%) |
| Wholesale Trade | 0 (0.0%) | 0 (0.0%) |
| Retail Trade | 6 (75.0%) | 2 (25.0%) |
| Transportation & Warehousing | 15 (100.0%) | 0 (0.0%) |
| Utilities | 0 (0.0%) | 0 (0.0%) |
| Information | 0 (0.0%) | 0 (0.0%) |
| Finance & Insurance | 0 (0.0%) | 0 (0.0%) |
| Real Estate, Rental & Leasing | 2 (100.0%) | 0 (0.0%) |
| Professional & Scientific | 22 (73.3%) | 8 (26.7%) |
| Enterprise Management | 0 (0.0%) | 0 (0.0%) |
| Administrative & Support | 5 (50.0%) | 5 (50.0%) |
| Educational Services | 24 (64.9%) | 13 (35.1%) |
| Health Care & Social Assistance | 1 (2.9%) | 34 (97.1%) |
| Arts, Entertainment & Recreation | 0 (0.0%) | 5 (100.0%) |
| Accommodation & Food Services | 2 (3.2%) | 60 (96.8%) |
| Public Administration | 10 (100.0%) | 0 (0.0%) |
| Total | 105 (41.5%) | 148 (58.5%) |
Education in Arco
School Enrollment in Arco
The most common levels of schooling among the 209 students in Arco are elementary school (82 | 39.2%), middle school (52 | 24.9%), and high school (25 | 12.0%).
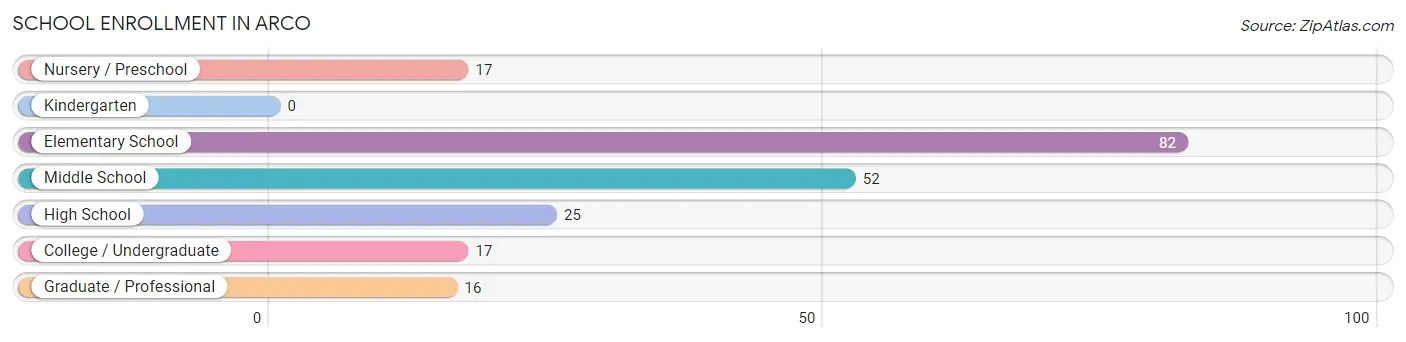
| School Level | # Students | % Students |
| Nursery / Preschool | 17 | 8.1% |
| Kindergarten | 0 | 0.0% |
| Elementary School | 82 | 39.2% |
| Middle School | 52 | 24.9% |
| High School | 25 | 12.0% |
| College / Undergraduate | 17 | 8.1% |
| Graduate / Professional | 16 | 7.7% |
| Total | 209 | 100.0% |
School Enrollment by Age by Funding Source in Arco
Out of a total of 209 students who are enrolled in schools in Arco, 21 (10.0%) attend a private institution, while the remaining 188 (90.0%) are enrolled in public schools. The age group of 20 to 24 year olds has the highest likelihood of being enrolled in private schools, with 7 (100.0% in the age bracket) enrolled. Conversely, the age group of 5 to 9 year old has the lowest likelihood of being enrolled in a private school, with 86 (100.0% in the age bracket) attending a public institution.
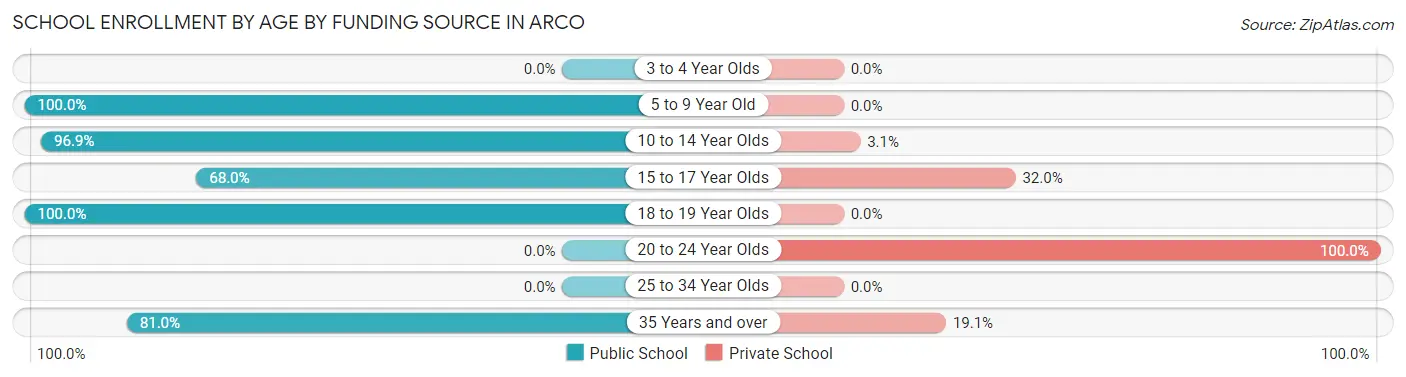
| Age Bracket | Public School | Private School |
| 3 to 4 Year Olds | 0 (0.0%) | 0 (0.0%) |
| 5 to 9 Year Old | 86 (100.0%) | 0 (0.0%) |
| 10 to 14 Year Olds | 63 (96.9%) | 2 (3.1%) |
| 15 to 17 Year Olds | 17 (68.0%) | 8 (32.0%) |
| 18 to 19 Year Olds | 5 (100.0%) | 0 (0.0%) |
| 20 to 24 Year Olds | 0 (0.0%) | 7 (100.0%) |
| 25 to 34 Year Olds | 0 (0.0%) | 0 (0.0%) |
| 35 Years and over | 17 (80.9%) | 4 (19.1%) |
| Total | 188 (90.0%) | 21 (10.0%) |
Educational Attainment by Field of Study in Arco
Education (46 | 56.8%), psychology (16 | 19.8%), business (6 | 7.4%), engineering (4 | 4.9%), and science & technology (4 | 4.9%) are the most common fields of study among 81 individuals in Arco who have obtained a bachelor's degree or higher.
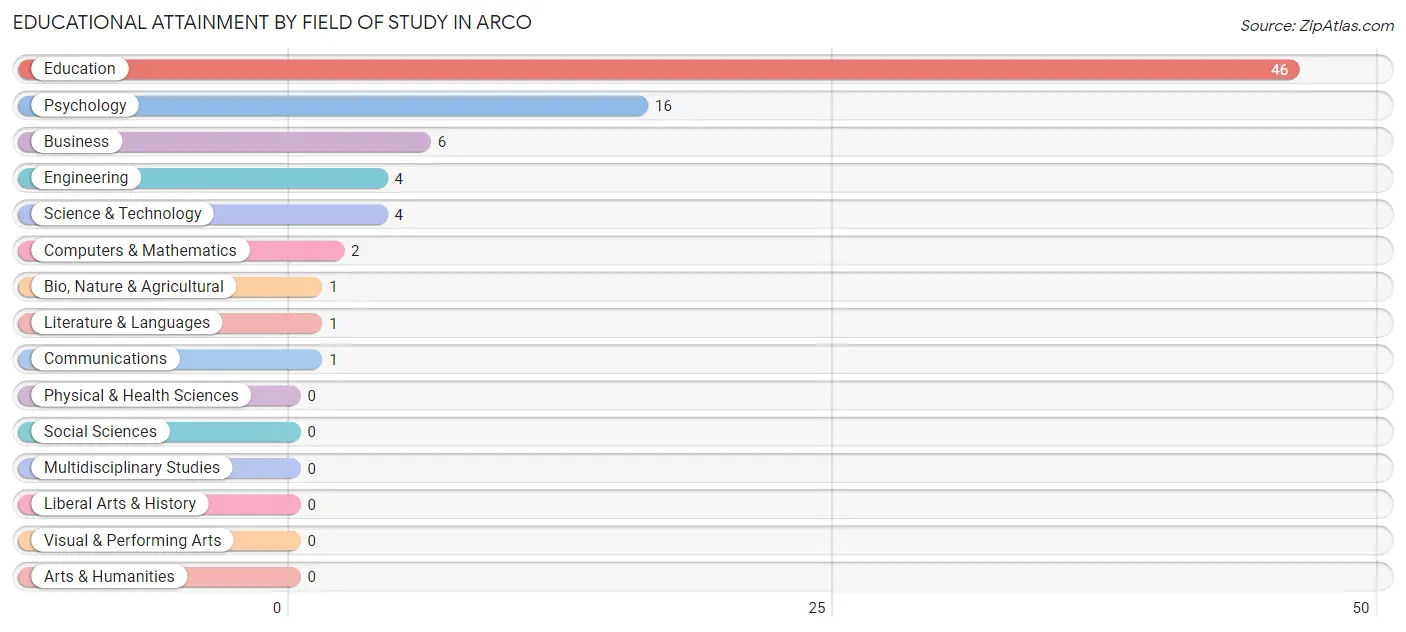
| Field of Study | # Graduates | % Graduates |
| Computers & Mathematics | 2 | 2.5% |
| Bio, Nature & Agricultural | 1 | 1.2% |
| Physical & Health Sciences | 0 | 0.0% |
| Psychology | 16 | 19.8% |
| Social Sciences | 0 | 0.0% |
| Engineering | 4 | 4.9% |
| Multidisciplinary Studies | 0 | 0.0% |
| Science & Technology | 4 | 4.9% |
| Business | 6 | 7.4% |
| Education | 46 | 56.8% |
| Literature & Languages | 1 | 1.2% |
| Liberal Arts & History | 0 | 0.0% |
| Visual & Performing Arts | 0 | 0.0% |
| Communications | 1 | 1.2% |
| Arts & Humanities | 0 | 0.0% |
| Total | 81 | 100.0% |
Transportation & Commute in Arco
Vehicle Availability by Sex in Arco
The most prevalent vehicle ownership categories in Arco are males with 3 vehicles (38, accounting for 36.2%) and females with 3 vehicles (52, making up 26.2%).
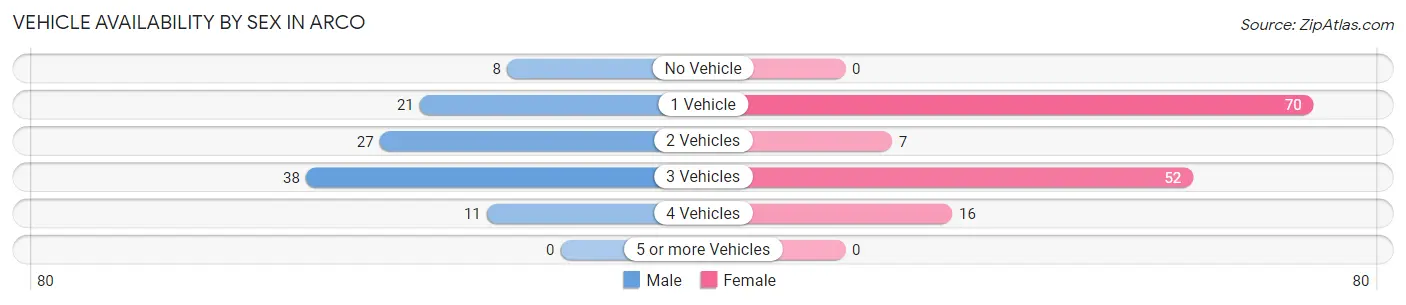
| Vehicles Available | Male | Female |
| No Vehicle | 8 (7.6%) | 0 (0.0%) |
| 1 Vehicle | 21 (20.0%) | 70 (48.3%) |
| 2 Vehicles | 27 (25.7%) | 7 (4.8%) |
| 3 Vehicles | 38 (36.2%) | 52 (35.9%) |
| 4 Vehicles | 11 (10.5%) | 16 (11.0%) |
| 5 or more Vehicles | 0 (0.0%) | 0 (0.0%) |
| Total | 105 (100.0%) | 145 (100.0%) |
Commute Time in Arco
The most frequently occuring commute durations in Arco are less than 5 minutes (44 commuters, 17.7%), 5 to 9 minutes (41 commuters, 16.5%), and 10 to 14 minutes (40 commuters, 16.1%).
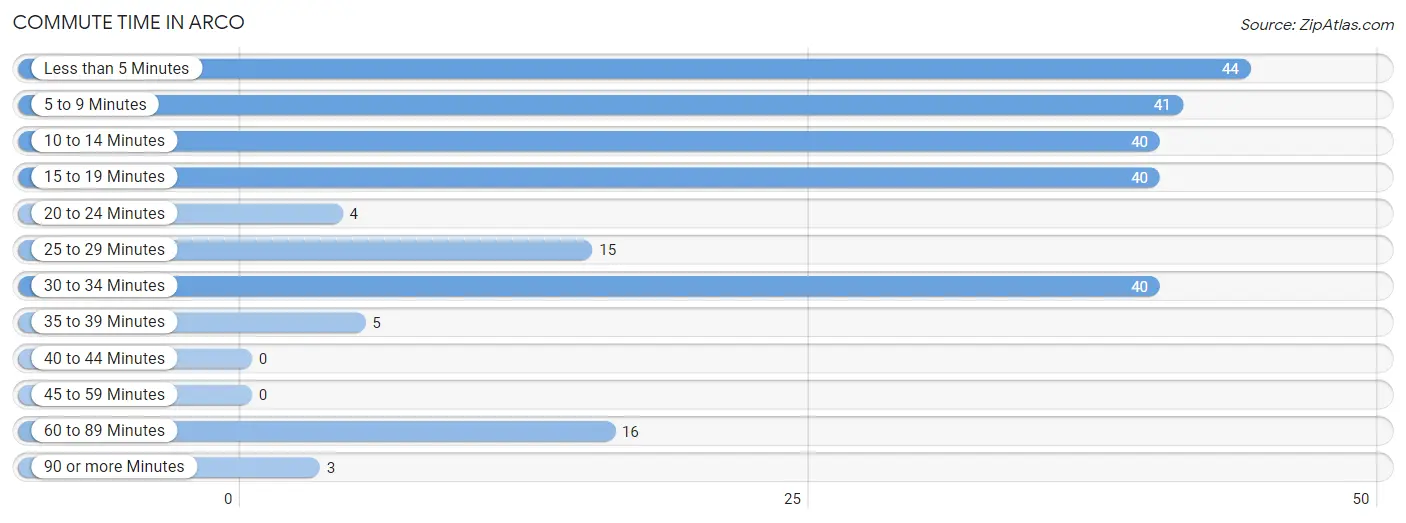
| Commute Time | # Commuters | % Commuters |
| Less than 5 Minutes | 44 | 17.7% |
| 5 to 9 Minutes | 41 | 16.5% |
| 10 to 14 Minutes | 40 | 16.1% |
| 15 to 19 Minutes | 40 | 16.1% |
| 20 to 24 Minutes | 4 | 1.6% |
| 25 to 29 Minutes | 15 | 6.0% |
| 30 to 34 Minutes | 40 | 16.1% |
| 35 to 39 Minutes | 5 | 2.0% |
| 40 to 44 Minutes | 0 | 0.0% |
| 45 to 59 Minutes | 0 | 0.0% |
| 60 to 89 Minutes | 16 | 6.5% |
| 90 or more Minutes | 3 | 1.2% |
Commute Time by Sex in Arco
The most common commute times in Arco are 30 to 34 minutes (32 commuters, 31.1%) for males and 15 to 19 minutes (40 commuters, 27.6%) for females.
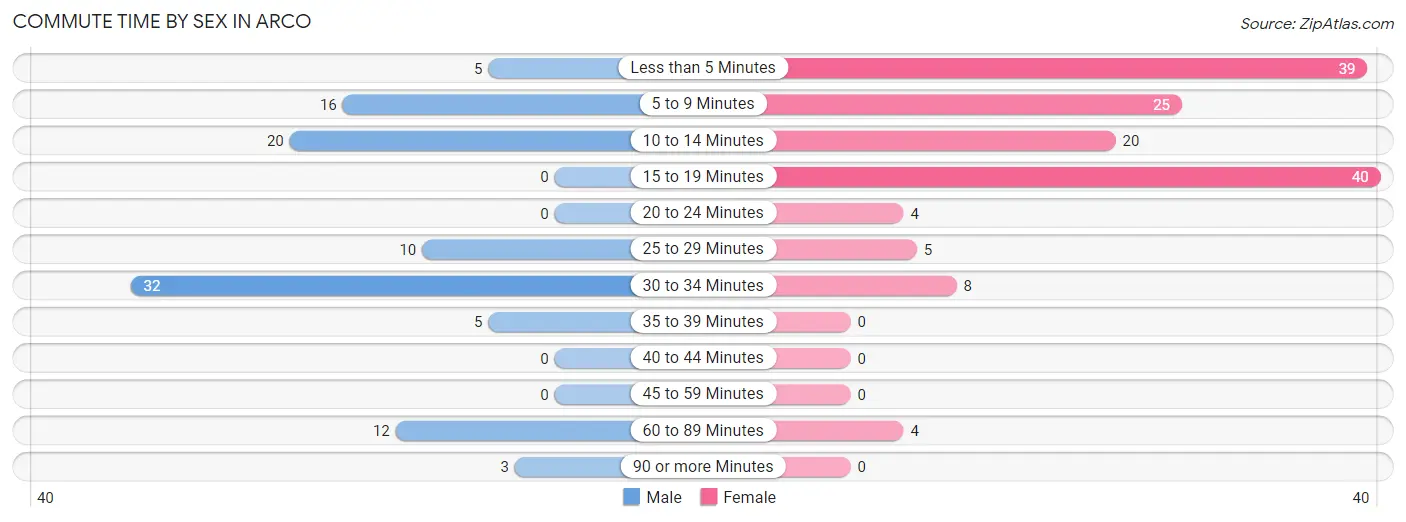
| Commute Time | Male | Female |
| Less than 5 Minutes | 5 (4.9%) | 39 (26.9%) |
| 5 to 9 Minutes | 16 (15.5%) | 25 (17.2%) |
| 10 to 14 Minutes | 20 (19.4%) | 20 (13.8%) |
| 15 to 19 Minutes | 0 (0.0%) | 40 (27.6%) |
| 20 to 24 Minutes | 0 (0.0%) | 4 (2.8%) |
| 25 to 29 Minutes | 10 (9.7%) | 5 (3.5%) |
| 30 to 34 Minutes | 32 (31.1%) | 8 (5.5%) |
| 35 to 39 Minutes | 5 (4.9%) | 0 (0.0%) |
| 40 to 44 Minutes | 0 (0.0%) | 0 (0.0%) |
| 45 to 59 Minutes | 0 (0.0%) | 0 (0.0%) |
| 60 to 89 Minutes | 12 (11.7%) | 4 (2.8%) |
| 90 or more Minutes | 3 (2.9%) | 0 (0.0%) |
Time of Departure to Work by Sex in Arco
The most frequent times of departure to work in Arco are 5:00 AM to 5:29 AM (34, 33.0%) for males and 6:30 AM to 6:59 AM (44, 30.3%) for females.
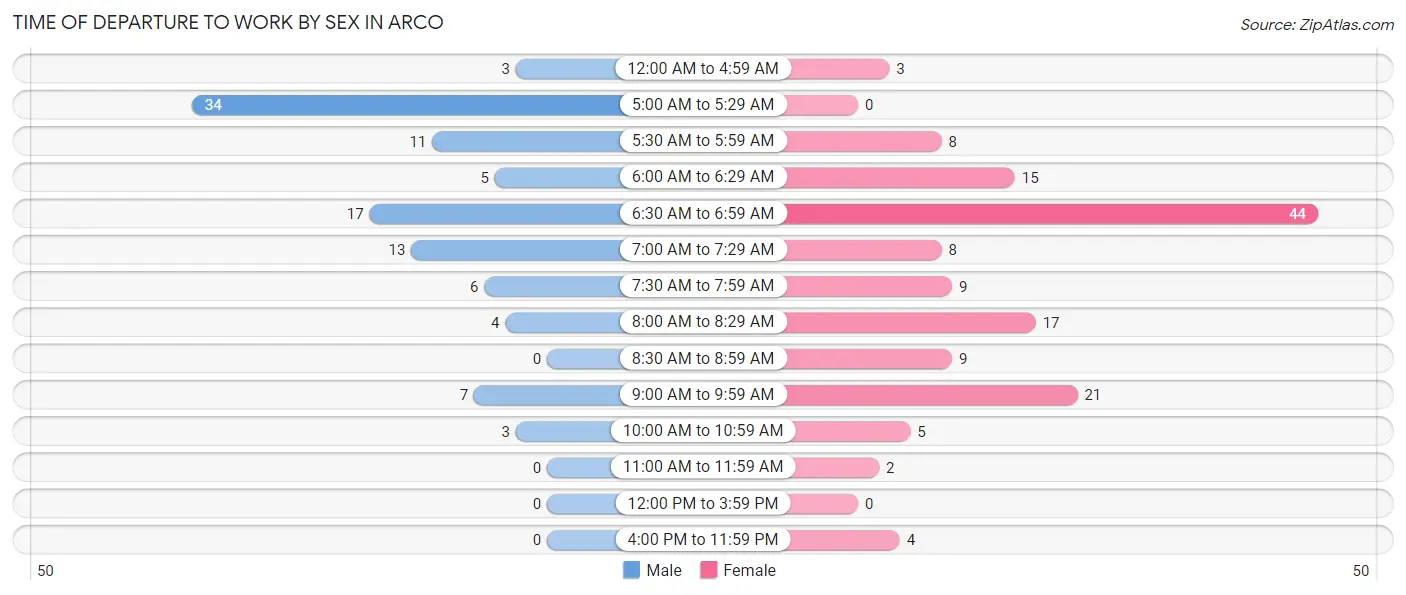
| Time of Departure | Male | Female |
| 12:00 AM to 4:59 AM | 3 (2.9%) | 3 (2.1%) |
| 5:00 AM to 5:29 AM | 34 (33.0%) | 0 (0.0%) |
| 5:30 AM to 5:59 AM | 11 (10.7%) | 8 (5.5%) |
| 6:00 AM to 6:29 AM | 5 (4.9%) | 15 (10.3%) |
| 6:30 AM to 6:59 AM | 17 (16.5%) | 44 (30.3%) |
| 7:00 AM to 7:29 AM | 13 (12.6%) | 8 (5.5%) |
| 7:30 AM to 7:59 AM | 6 (5.8%) | 9 (6.2%) |
| 8:00 AM to 8:29 AM | 4 (3.9%) | 17 (11.7%) |
| 8:30 AM to 8:59 AM | 0 (0.0%) | 9 (6.2%) |
| 9:00 AM to 9:59 AM | 7 (6.8%) | 21 (14.5%) |
| 10:00 AM to 10:59 AM | 3 (2.9%) | 5 (3.5%) |
| 11:00 AM to 11:59 AM | 0 (0.0%) | 2 (1.4%) |
| 12:00 PM to 3:59 PM | 0 (0.0%) | 0 (0.0%) |
| 4:00 PM to 11:59 PM | 0 (0.0%) | 4 (2.8%) |
| Total | 103 (100.0%) | 145 (100.0%) |
Housing Occupancy in Arco
Occupancy by Ownership in Arco
Of the total 300 dwellings in Arco, owner-occupied units account for 213 (71.0%), while renter-occupied units make up 87 (29.0%).
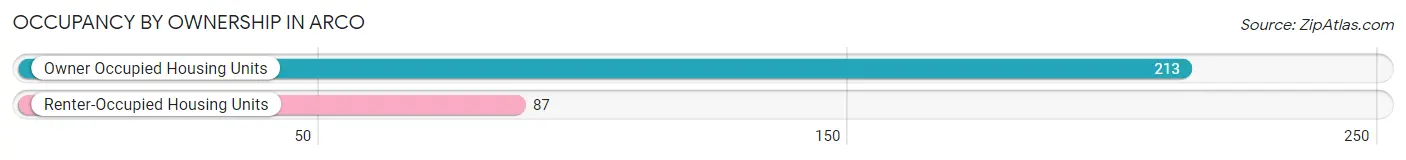
| Occupancy | # Housing Units | % Housing Units |
| Owner Occupied Housing Units | 213 | 71.0% |
| Renter-Occupied Housing Units | 87 | 29.0% |
| Total Occupied Housing Units | 300 | 100.0% |
Occupancy by Household Size in Arco
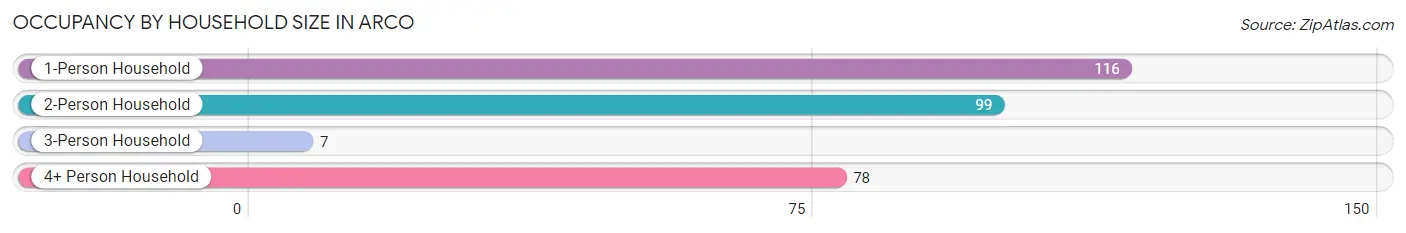
| Household Size | # Housing Units | % Housing Units |
| 1-Person Household | 116 | 38.7% |
| 2-Person Household | 99 | 33.0% |
| 3-Person Household | 7 | 2.3% |
| 4+ Person Household | 78 | 26.0% |
| Total Housing Units | 300 | 100.0% |
Occupancy by Ownership by Household Size in Arco
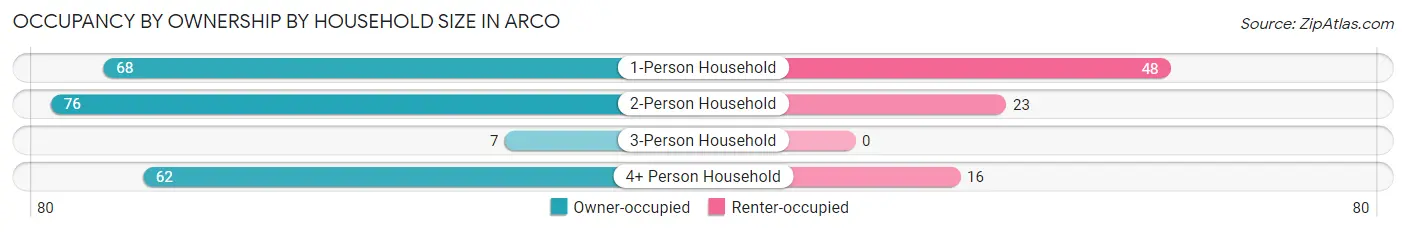
| Household Size | Owner-occupied | Renter-occupied |
| 1-Person Household | 68 (58.6%) | 48 (41.4%) |
| 2-Person Household | 76 (76.8%) | 23 (23.2%) |
| 3-Person Household | 7 (100.0%) | 0 (0.0%) |
| 4+ Person Household | 62 (79.5%) | 16 (20.5%) |
| Total Housing Units | 213 (71.0%) | 87 (29.0%) |
Occupancy by Educational Attainment in Arco
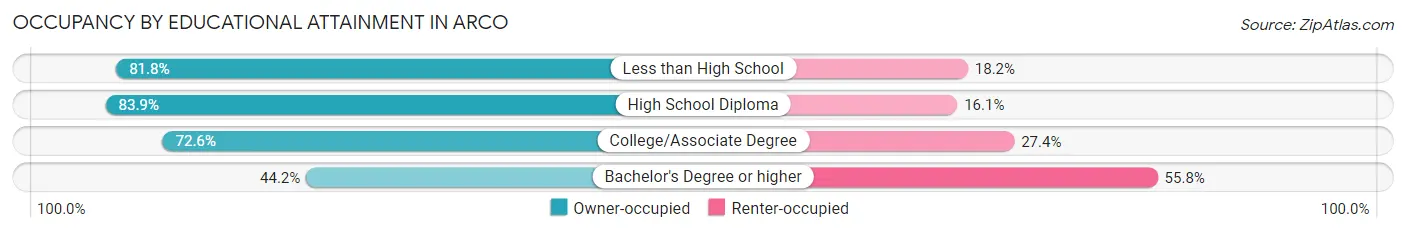
| Household Size | Owner-occupied | Renter-occupied |
| Less than High School | 9 (81.8%) | 2 (18.2%) |
| High School Diploma | 47 (83.9%) | 9 (16.1%) |
| College/Associate Degree | 138 (72.6%) | 52 (27.4%) |
| Bachelor's Degree or higher | 19 (44.2%) | 24 (55.8%) |
Occupancy by Age of Householder in Arco
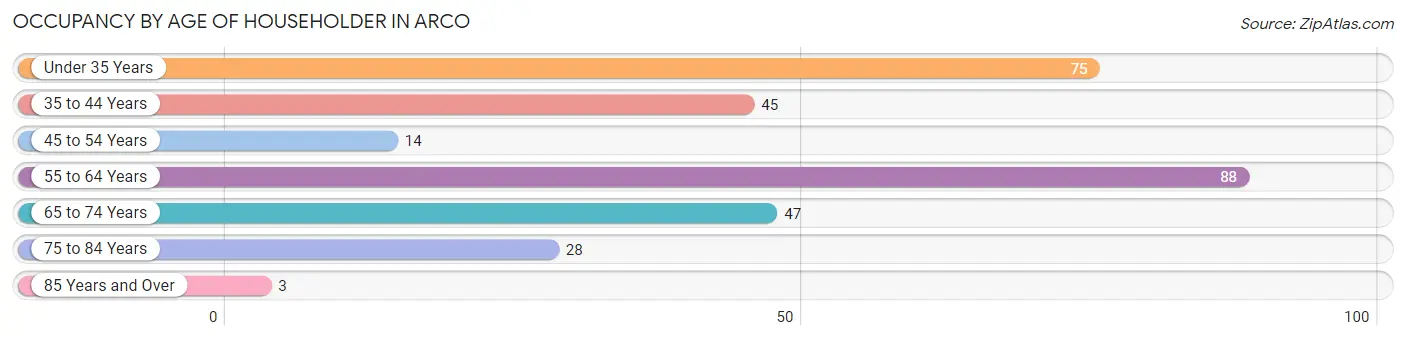
| Age Bracket | # Households | % Households |
| Under 35 Years | 75 | 25.0% |
| 35 to 44 Years | 45 | 15.0% |
| 45 to 54 Years | 14 | 4.7% |
| 55 to 64 Years | 88 | 29.3% |
| 65 to 74 Years | 47 | 15.7% |
| 75 to 84 Years | 28 | 9.3% |
| 85 Years and Over | 3 | 1.0% |
| Total | 300 | 100.0% |
Housing Finances in Arco
Median Income by Occupancy in Arco
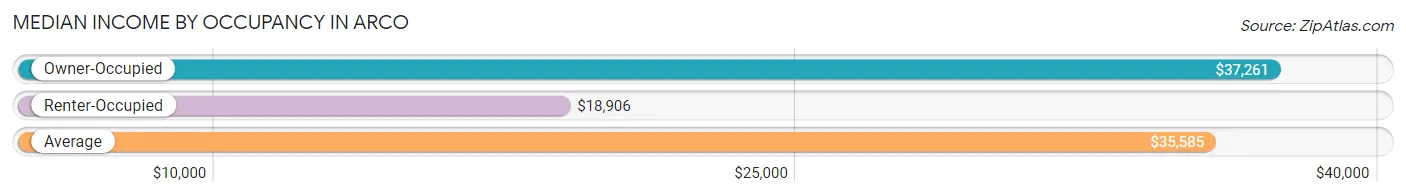
| Occupancy Type | # Households | Median Income |
| Owner-Occupied | 213 (71.0%) | $37,261 |
| Renter-Occupied | 87 (29.0%) | $18,906 |
| Average | 300 (100.0%) | $35,585 |
Occupancy by Householder Income Bracket in Arco
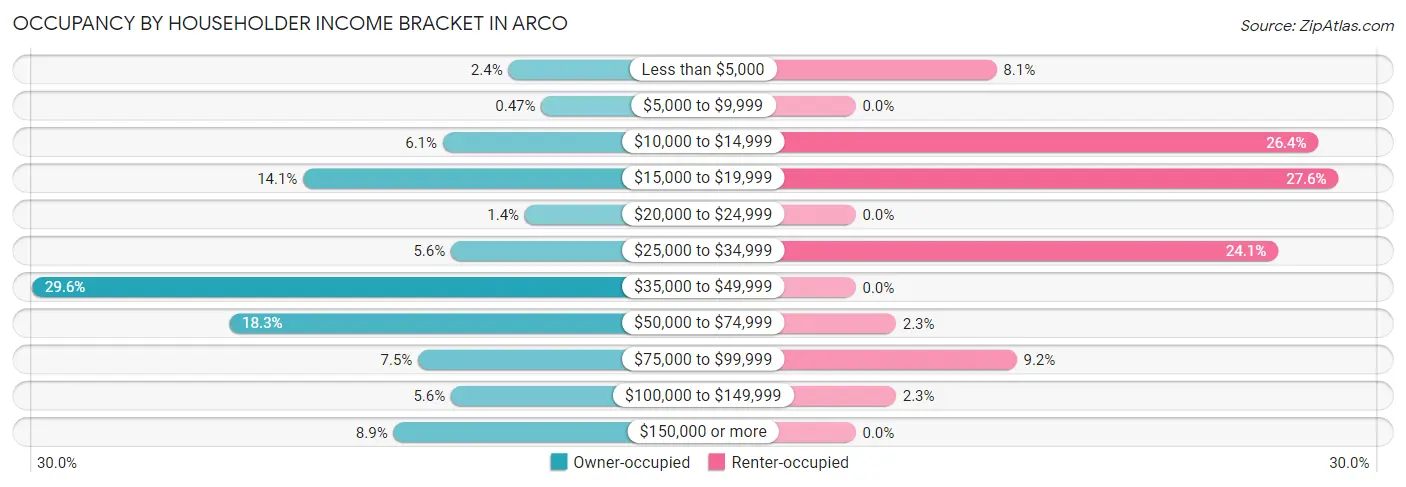
| Income Bracket | Owner-occupied | Renter-occupied |
| Less than $5,000 | 5 (2.4%) | 7 (8.1%) |
| $5,000 to $9,999 | 1 (0.5%) | 0 (0.0%) |
| $10,000 to $14,999 | 13 (6.1%) | 23 (26.4%) |
| $15,000 to $19,999 | 30 (14.1%) | 24 (27.6%) |
| $20,000 to $24,999 | 3 (1.4%) | 0 (0.0%) |
| $25,000 to $34,999 | 12 (5.6%) | 21 (24.1%) |
| $35,000 to $49,999 | 63 (29.6%) | 0 (0.0%) |
| $50,000 to $74,999 | 39 (18.3%) | 2 (2.3%) |
| $75,000 to $99,999 | 16 (7.5%) | 8 (9.2%) |
| $100,000 to $149,999 | 12 (5.6%) | 2 (2.3%) |
| $150,000 or more | 19 (8.9%) | 0 (0.0%) |
| Total | 213 (100.0%) | 87 (100.0%) |
Monthly Housing Cost Tiers in Arco
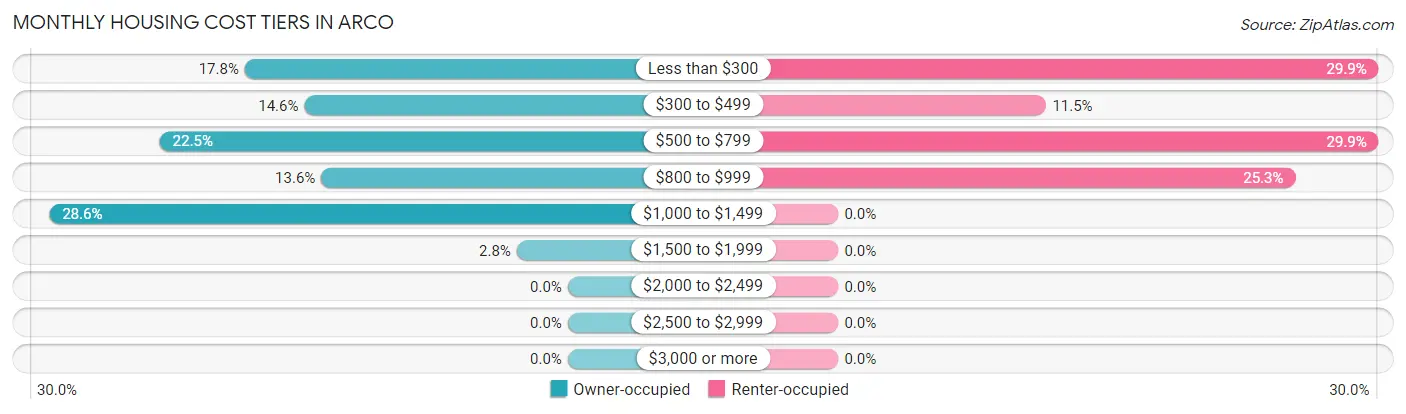
| Monthly Cost | Owner-occupied | Renter-occupied |
| Less than $300 | 38 (17.8%) | 26 (29.9%) |
| $300 to $499 | 31 (14.5%) | 10 (11.5%) |
| $500 to $799 | 48 (22.5%) | 26 (29.9%) |
| $800 to $999 | 29 (13.6%) | 22 (25.3%) |
| $1,000 to $1,499 | 61 (28.6%) | 0 (0.0%) |
| $1,500 to $1,999 | 6 (2.8%) | 0 (0.0%) |
| $2,000 to $2,499 | 0 (0.0%) | 0 (0.0%) |
| $2,500 to $2,999 | 0 (0.0%) | 0 (0.0%) |
| $3,000 or more | 0 (0.0%) | 0 (0.0%) |
| Total | 213 (100.0%) | 87 (100.0%) |
Physical Housing Characteristics in Arco
Housing Structures in Arco
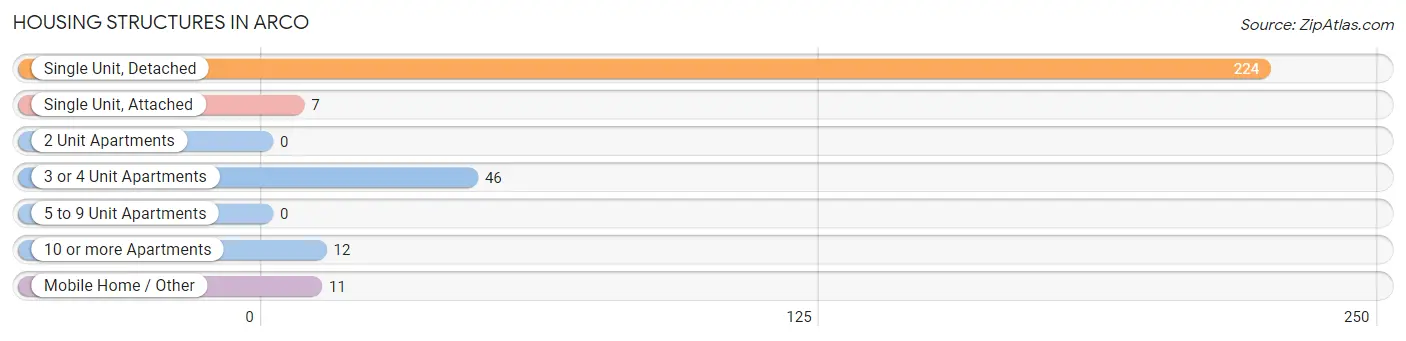
| Structure Type | # Housing Units | % Housing Units |
| Single Unit, Detached | 224 | 74.7% |
| Single Unit, Attached | 7 | 2.3% |
| 2 Unit Apartments | 0 | 0.0% |
| 3 or 4 Unit Apartments | 46 | 15.3% |
| 5 to 9 Unit Apartments | 0 | 0.0% |
| 10 or more Apartments | 12 | 4.0% |
| Mobile Home / Other | 11 | 3.7% |
| Total | 300 | 100.0% |
Housing Structures by Occupancy in Arco
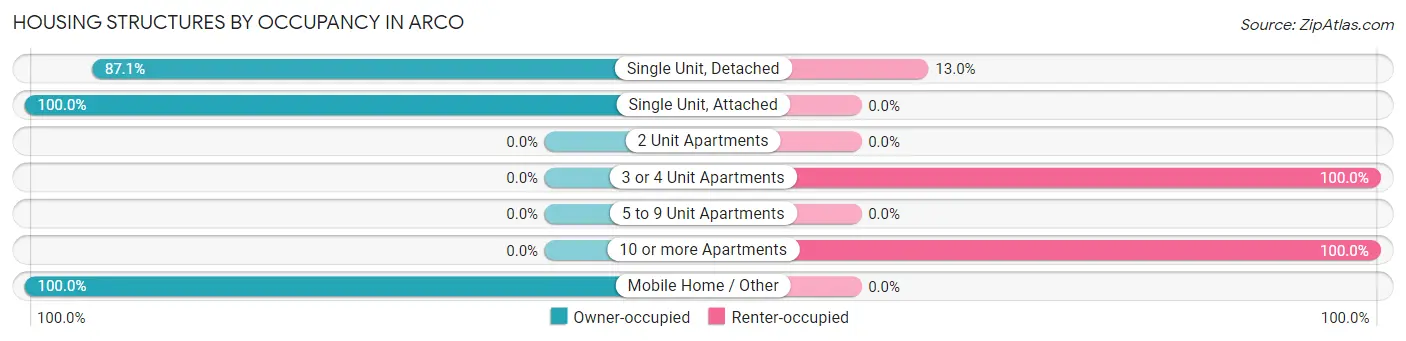
| Structure Type | Owner-occupied | Renter-occupied |
| Single Unit, Detached | 195 (87.1%) | 29 (13.0%) |
| Single Unit, Attached | 7 (100.0%) | 0 (0.0%) |
| 2 Unit Apartments | 0 (0.0%) | 0 (0.0%) |
| 3 or 4 Unit Apartments | 0 (0.0%) | 46 (100.0%) |
| 5 to 9 Unit Apartments | 0 (0.0%) | 0 (0.0%) |
| 10 or more Apartments | 0 (0.0%) | 12 (100.0%) |
| Mobile Home / Other | 11 (100.0%) | 0 (0.0%) |
| Total | 213 (71.0%) | 87 (29.0%) |
Housing Structures by Number of Rooms in Arco
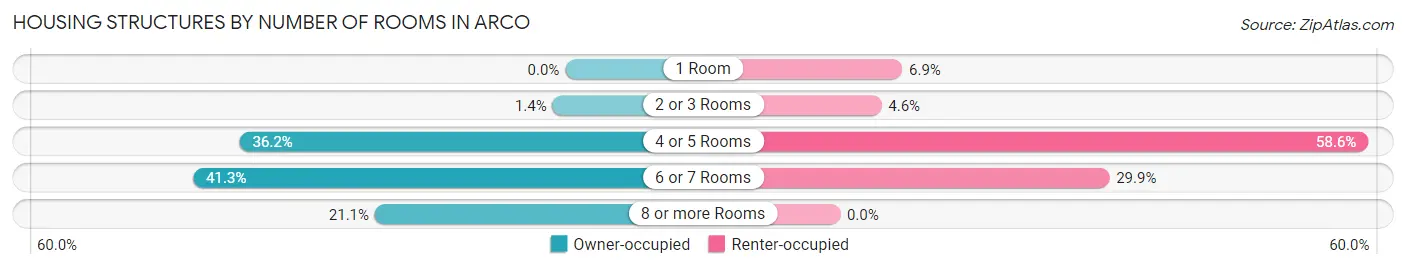
| Number of Rooms | Owner-occupied | Renter-occupied |
| 1 Room | 0 (0.0%) | 6 (6.9%) |
| 2 or 3 Rooms | 3 (1.4%) | 4 (4.6%) |
| 4 or 5 Rooms | 77 (36.1%) | 51 (58.6%) |
| 6 or 7 Rooms | 88 (41.3%) | 26 (29.9%) |
| 8 or more Rooms | 45 (21.1%) | 0 (0.0%) |
| Total | 213 (100.0%) | 87 (100.0%) |
Housing Structure by Heating Type in Arco
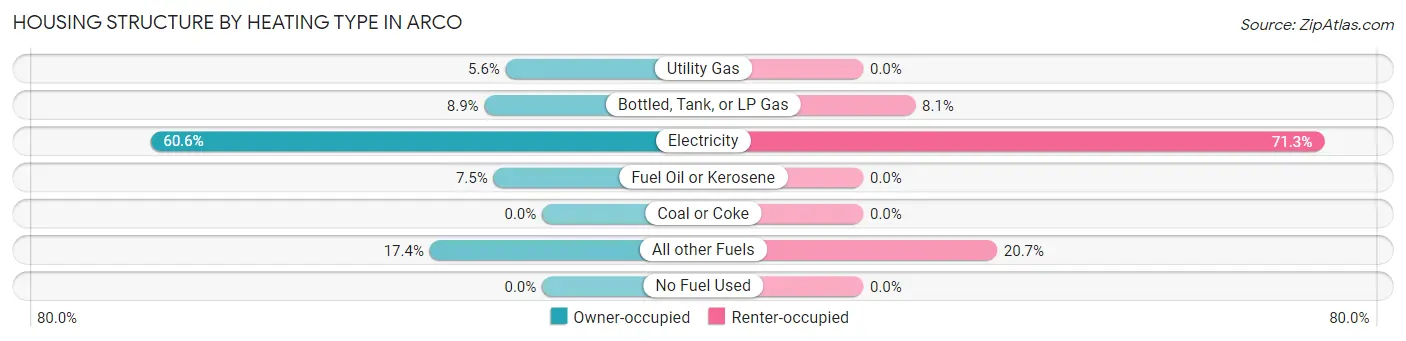
| Heating Type | Owner-occupied | Renter-occupied |
| Utility Gas | 12 (5.6%) | 0 (0.0%) |
| Bottled, Tank, or LP Gas | 19 (8.9%) | 7 (8.1%) |
| Electricity | 129 (60.6%) | 62 (71.3%) |
| Fuel Oil or Kerosene | 16 (7.5%) | 0 (0.0%) |
| Coal or Coke | 0 (0.0%) | 0 (0.0%) |
| All other Fuels | 37 (17.4%) | 18 (20.7%) |
| No Fuel Used | 0 (0.0%) | 0 (0.0%) |
| Total | 213 (100.0%) | 87 (100.0%) |
Household Vehicle Usage in Arco
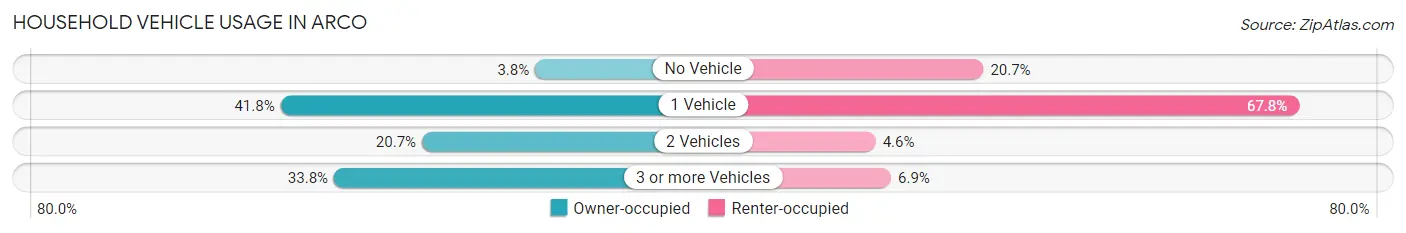
| Vehicles per Household | Owner-occupied | Renter-occupied |
| No Vehicle | 8 (3.8%) | 18 (20.7%) |
| 1 Vehicle | 89 (41.8%) | 59 (67.8%) |
| 2 Vehicles | 44 (20.7%) | 4 (4.6%) |
| 3 or more Vehicles | 72 (33.8%) | 6 (6.9%) |
| Total | 213 (100.0%) | 87 (100.0%) |
Real Estate & Mortgages in Arco
Real Estate and Mortgage Overview in Arco
| Characteristic | Without Mortgage | With Mortgage |
| Housing Units | 98 | 115 |
| Median Property Value | $130,800 | $202,200 |
| Median Household Income | $49,167 | $6 |
| Monthly Housing Costs | $350 | $0 |
| Real Estate Taxes | $833 | $2 |
Property Value by Mortgage Status in Arco
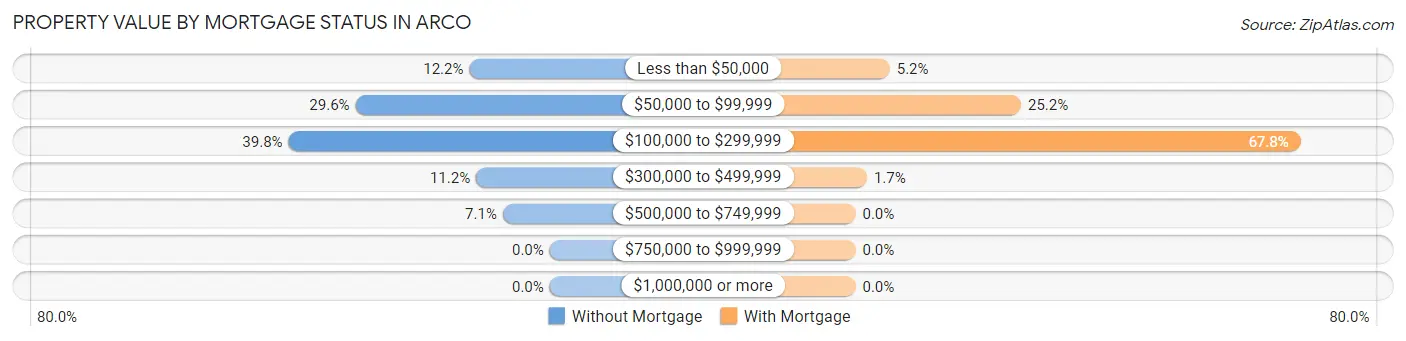
| Property Value | Without Mortgage | With Mortgage |
| Less than $50,000 | 12 (12.2%) | 6 (5.2%) |
| $50,000 to $99,999 | 29 (29.6%) | 29 (25.2%) |
| $100,000 to $299,999 | 39 (39.8%) | 78 (67.8%) |
| $300,000 to $499,999 | 11 (11.2%) | 2 (1.7%) |
| $500,000 to $749,999 | 7 (7.1%) | 0 (0.0%) |
| $750,000 to $999,999 | 0 (0.0%) | 0 (0.0%) |
| $1,000,000 or more | 0 (0.0%) | 0 (0.0%) |
| Total | 98 (100.0%) | 115 (100.0%) |
Household Income by Mortgage Status in Arco
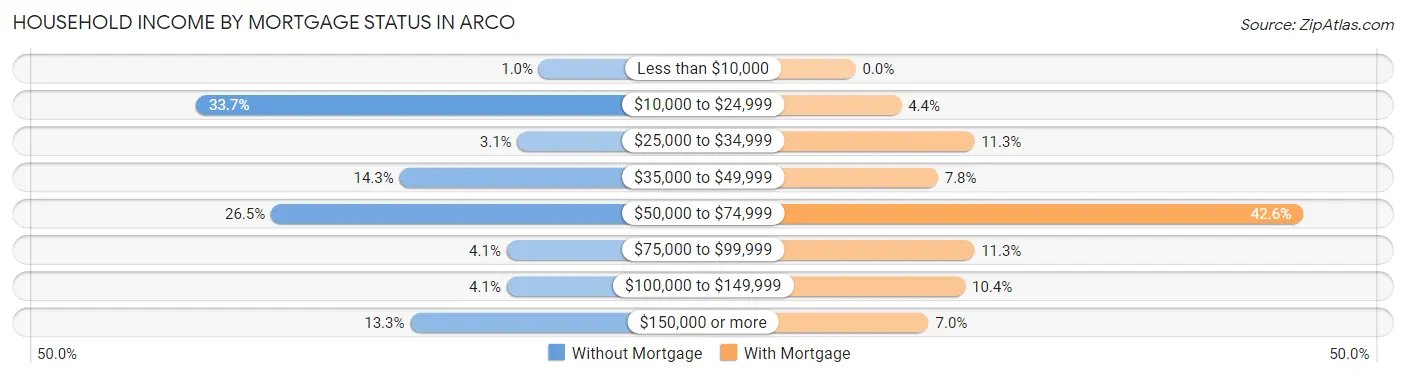
| Household Income | Without Mortgage | With Mortgage |
| Less than $10,000 | 1 (1.0%) | 0 (0.0%) |
| $10,000 to $24,999 | 33 (33.7%) | 5 (4.3%) |
| $25,000 to $34,999 | 3 (3.1%) | 13 (11.3%) |
| $35,000 to $49,999 | 14 (14.3%) | 9 (7.8%) |
| $50,000 to $74,999 | 26 (26.5%) | 49 (42.6%) |
| $75,000 to $99,999 | 4 (4.1%) | 13 (11.3%) |
| $100,000 to $149,999 | 4 (4.1%) | 12 (10.4%) |
| $150,000 or more | 13 (13.3%) | 8 (7.0%) |
| Total | 98 (100.0%) | 115 (100.0%) |
Property Value to Household Income Ratio in Arco
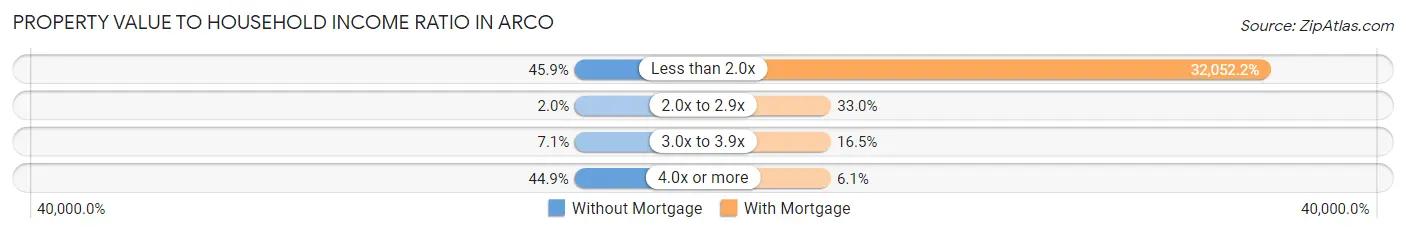
| Value-to-Income Ratio | Without Mortgage | With Mortgage |
| Less than 2.0x | 45 (45.9%) | 36,860 (32,052.2%) |
| 2.0x to 2.9x | 2 (2.0%) | 38 (33.0%) |
| 3.0x to 3.9x | 7 (7.1%) | 19 (16.5%) |
| 4.0x or more | 44 (44.9%) | 7 (6.1%) |
| Total | 98 (100.0%) | 115 (100.0%) |
Real Estate Taxes by Mortgage Status in Arco
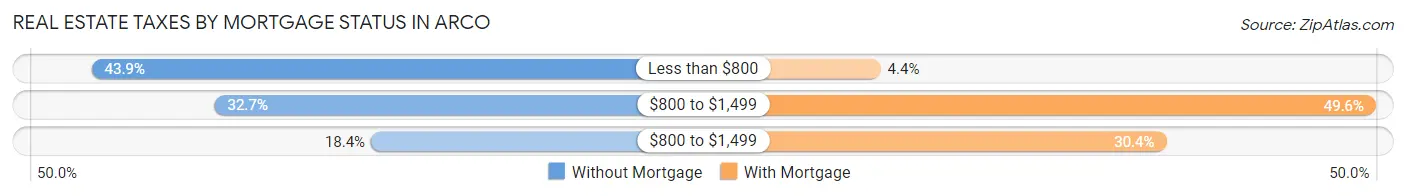
| Property Taxes | Without Mortgage | With Mortgage |
| Less than $800 | 43 (43.9%) | 5 (4.3%) |
| $800 to $1,499 | 32 (32.7%) | 57 (49.6%) |
| $800 to $1,499 | 18 (18.4%) | 35 (30.4%) |
| Total | 98 (100.0%) | 115 (100.0%) |
Health & Disability in Arco
Health Insurance Coverage by Age in Arco
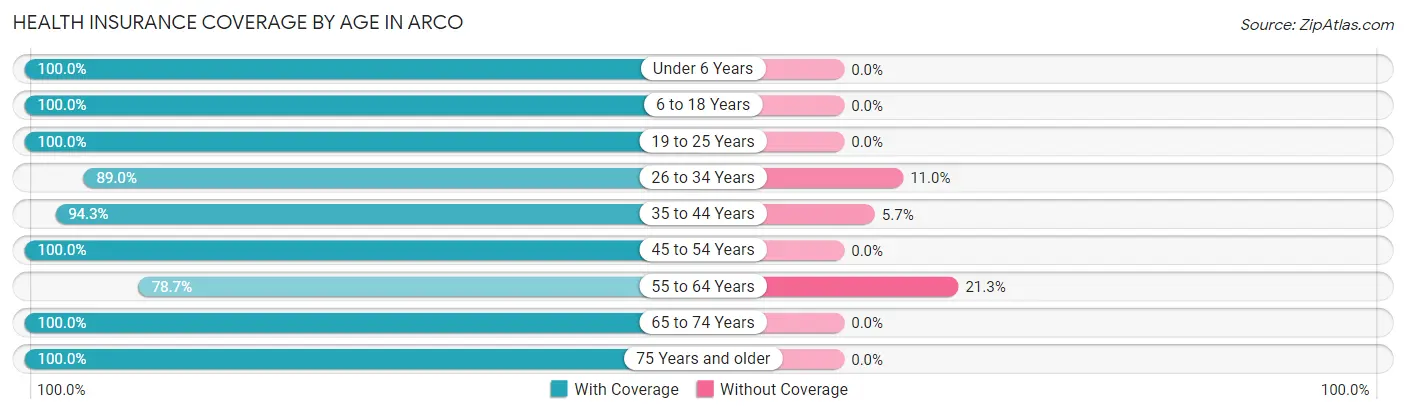
| Age Bracket | With Coverage | Without Coverage |
| Under 6 Years | 51 (100.0%) | 0 (0.0%) |
| 6 to 18 Years | 173 (100.0%) | 0 (0.0%) |
| 19 to 25 Years | 12 (100.0%) | 0 (0.0%) |
| 26 to 34 Years | 81 (89.0%) | 10 (11.0%) |
| 35 to 44 Years | 66 (94.3%) | 4 (5.7%) |
| 45 to 54 Years | 33 (100.0%) | 0 (0.0%) |
| 55 to 64 Years | 122 (78.7%) | 33 (21.3%) |
| 65 to 74 Years | 85 (100.0%) | 0 (0.0%) |
| 75 Years and older | 40 (100.0%) | 0 (0.0%) |
| Total | 663 (93.4%) | 47 (6.6%) |
Health Insurance Coverage by Citizenship Status in Arco

| Citizenship Status | With Coverage | Without Coverage |
| Native Born | 51 (100.0%) | 0 (0.0%) |
| Foreign Born, Citizen | 173 (100.0%) | 0 (0.0%) |
| Foreign Born, not a Citizen | 12 (100.0%) | 0 (0.0%) |
Health Insurance Coverage by Household Income in Arco
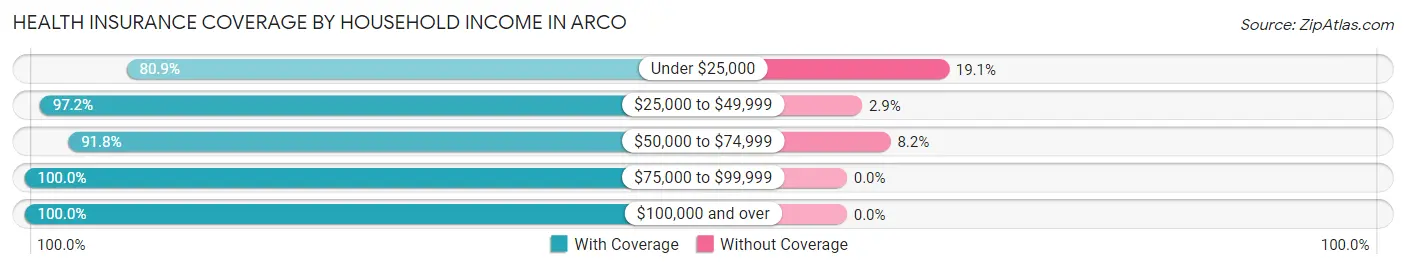
| Household Income | With Coverage | Without Coverage |
| Under $25,000 | 127 (80.9%) | 30 (19.1%) |
| $25,000 to $49,999 | 273 (97.2%) | 8 (2.9%) |
| $50,000 to $74,999 | 101 (91.8%) | 9 (8.2%) |
| $75,000 to $99,999 | 57 (100.0%) | 0 (0.0%) |
| $100,000 and over | 105 (100.0%) | 0 (0.0%) |
Public vs Private Health Insurance Coverage by Age in Arco
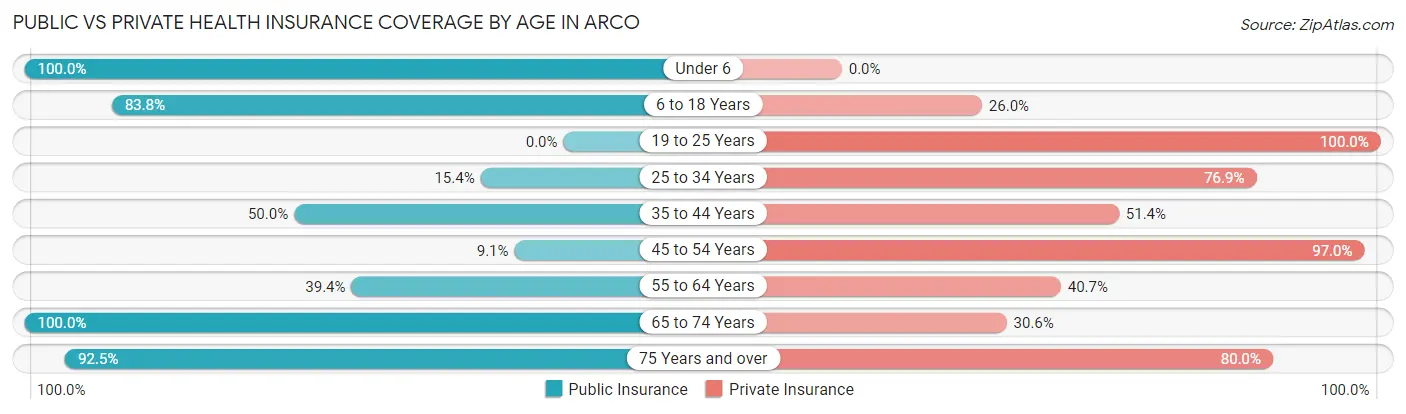
| Age Bracket | Public Insurance | Private Insurance |
| Under 6 | 51 (100.0%) | 0 (0.0%) |
| 6 to 18 Years | 145 (83.8%) | 45 (26.0%) |
| 19 to 25 Years | 0 (0.0%) | 12 (100.0%) |
| 25 to 34 Years | 14 (15.4%) | 70 (76.9%) |
| 35 to 44 Years | 35 (50.0%) | 36 (51.4%) |
| 45 to 54 Years | 3 (9.1%) | 32 (97.0%) |
| 55 to 64 Years | 61 (39.4%) | 63 (40.6%) |
| 65 to 74 Years | 85 (100.0%) | 26 (30.6%) |
| 75 Years and over | 37 (92.5%) | 32 (80.0%) |
| Total | 431 (60.7%) | 316 (44.5%) |
Disability Status by Sex by Age in Arco
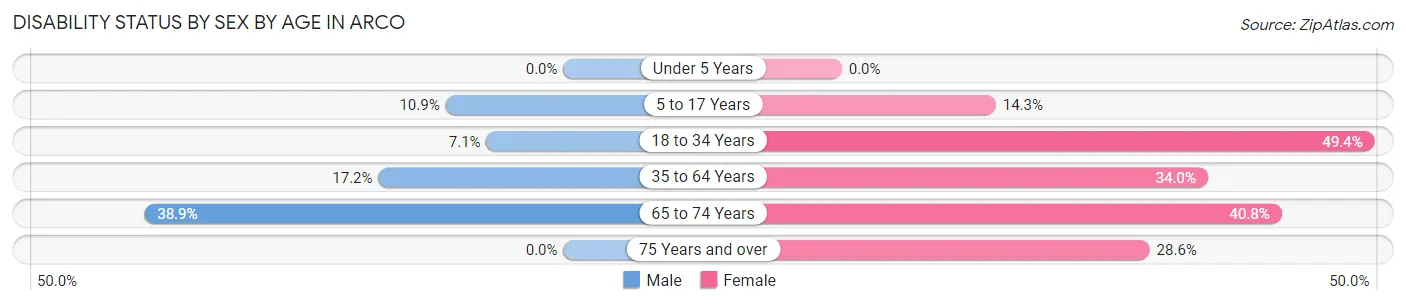
| Age Bracket | Male | Female |
| Under 5 Years | 0 (0.0%) | 0 (0.0%) |
| 5 to 17 Years | 7 (10.9%) | 16 (14.3%) |
| 18 to 34 Years | 2 (7.1%) | 44 (49.4%) |
| 35 to 64 Years | 17 (17.2%) | 54 (34.0%) |
| 65 to 74 Years | 14 (38.9%) | 20 (40.8%) |
| 75 Years and over | 0 (0.0%) | 8 (28.6%) |
Disability Class by Sex by Age in Arco
Disability Class: Hearing Difficulty
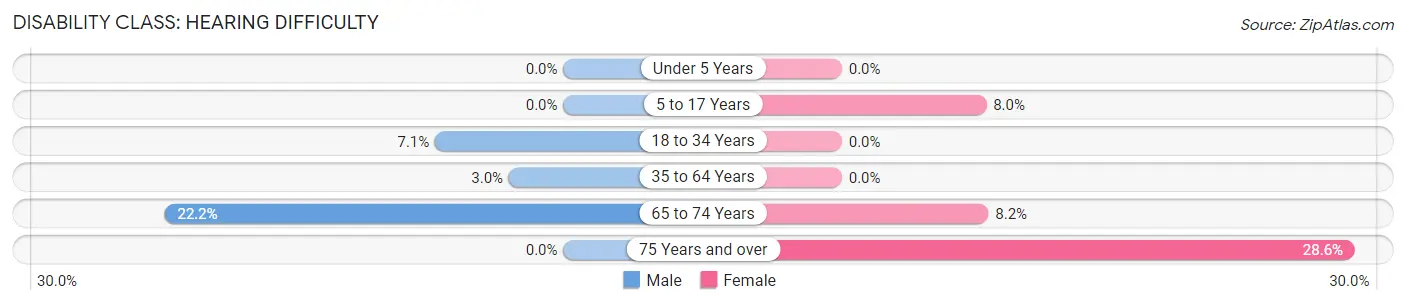
| Age Bracket | Male | Female |
| Under 5 Years | 0 (0.0%) | 0 (0.0%) |
| 5 to 17 Years | 0 (0.0%) | 9 (8.0%) |
| 18 to 34 Years | 2 (7.1%) | 0 (0.0%) |
| 35 to 64 Years | 3 (3.0%) | 0 (0.0%) |
| 65 to 74 Years | 8 (22.2%) | 4 (8.2%) |
| 75 Years and over | 0 (0.0%) | 8 (28.6%) |
Disability Class: Vision Difficulty
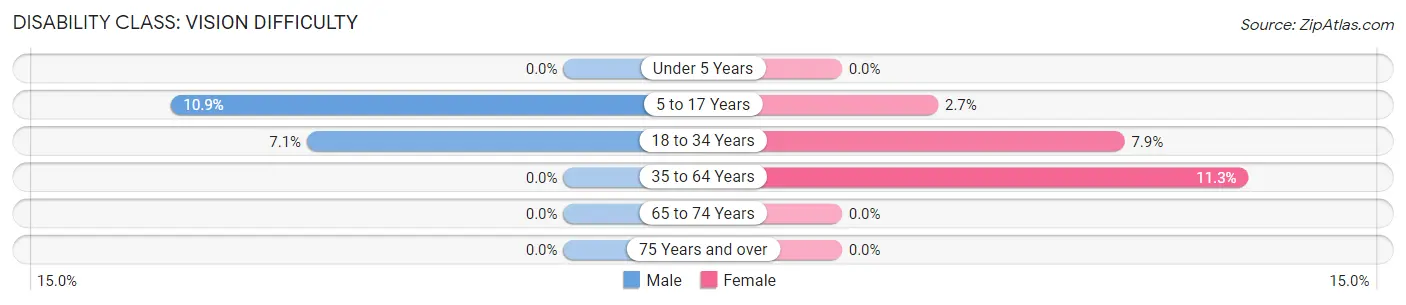
| Age Bracket | Male | Female |
| Under 5 Years | 0 (0.0%) | 0 (0.0%) |
| 5 to 17 Years | 7 (10.9%) | 3 (2.7%) |
| 18 to 34 Years | 2 (7.1%) | 7 (7.9%) |
| 35 to 64 Years | 0 (0.0%) | 18 (11.3%) |
| 65 to 74 Years | 0 (0.0%) | 0 (0.0%) |
| 75 Years and over | 0 (0.0%) | 0 (0.0%) |
Disability Class: Cognitive Difficulty
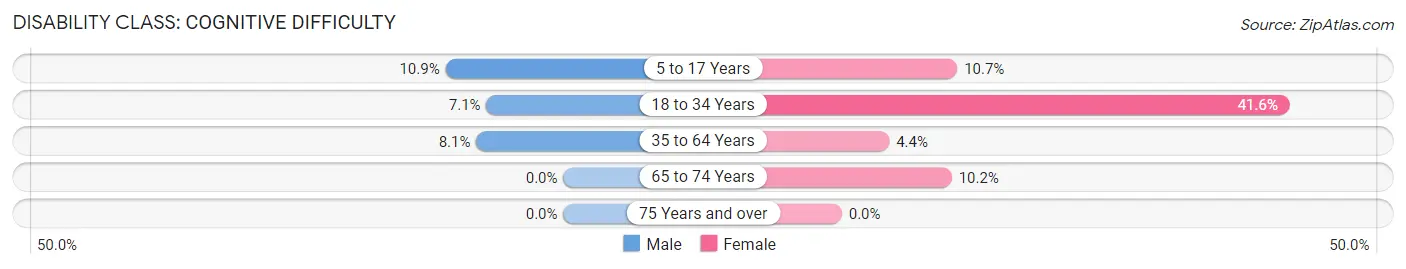
| Age Bracket | Male | Female |
| 5 to 17 Years | 7 (10.9%) | 12 (10.7%) |
| 18 to 34 Years | 2 (7.1%) | 37 (41.6%) |
| 35 to 64 Years | 8 (8.1%) | 7 (4.4%) |
| 65 to 74 Years | 0 (0.0%) | 5 (10.2%) |
| 75 Years and over | 0 (0.0%) | 0 (0.0%) |
Disability Class: Ambulatory Difficulty
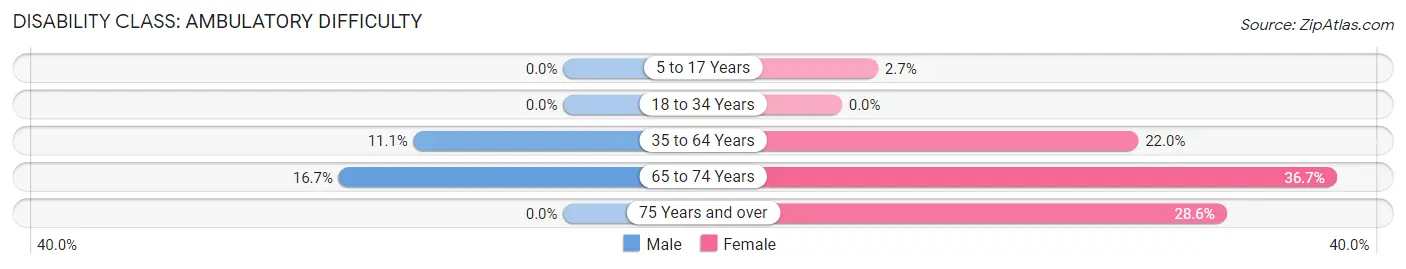
| Age Bracket | Male | Female |
| 5 to 17 Years | 0 (0.0%) | 3 (2.7%) |
| 18 to 34 Years | 0 (0.0%) | 0 (0.0%) |
| 35 to 64 Years | 11 (11.1%) | 35 (22.0%) |
| 65 to 74 Years | 6 (16.7%) | 18 (36.7%) |
| 75 Years and over | 0 (0.0%) | 8 (28.6%) |
Disability Class: Self-Care Difficulty
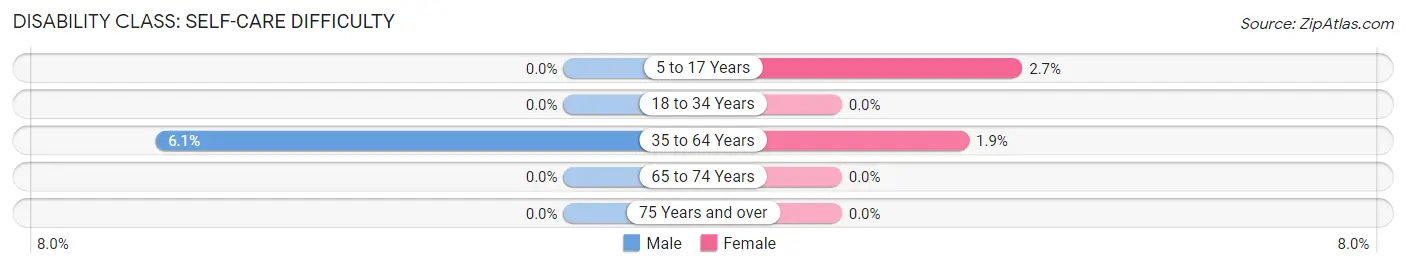
| Age Bracket | Male | Female |
| 5 to 17 Years | 0 (0.0%) | 3 (2.7%) |
| 18 to 34 Years | 0 (0.0%) | 0 (0.0%) |
| 35 to 64 Years | 6 (6.1%) | 3 (1.9%) |
| 65 to 74 Years | 0 (0.0%) | 0 (0.0%) |
| 75 Years and over | 0 (0.0%) | 0 (0.0%) |
Technology Access in Arco
Computing Device Access in Arco
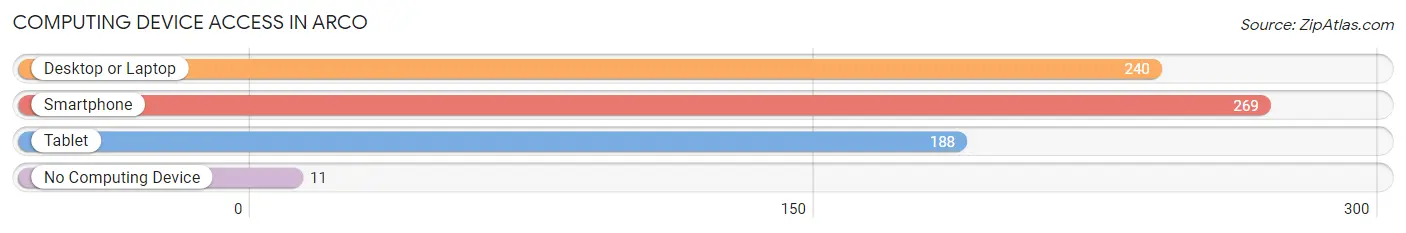
| Device Type | # Households | % Households |
| Desktop or Laptop | 240 | 80.0% |
| Smartphone | 269 | 89.7% |
| Tablet | 188 | 62.7% |
| No Computing Device | 11 | 3.7% |
| Total | 300 | 100.0% |
Internet Access in Arco
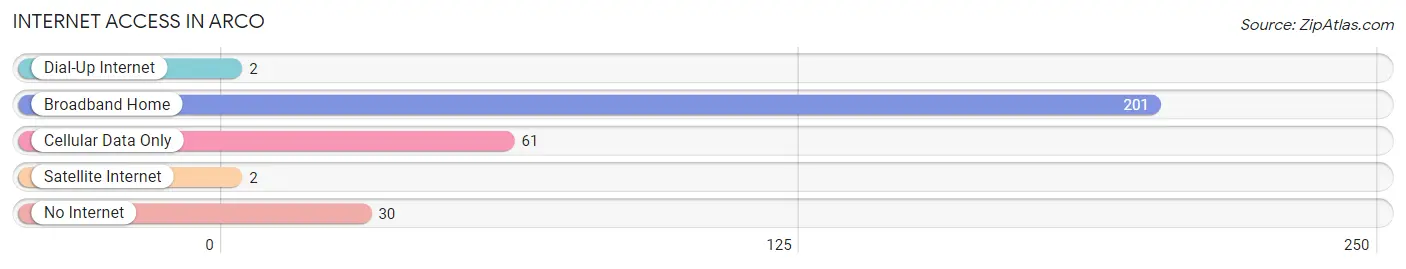
| Internet Type | # Households | % Households |
| Dial-Up Internet | 2 | 0.7% |
| Broadband Home | 201 | 67.0% |
| Cellular Data Only | 61 | 20.3% |
| Satellite Internet | 2 | 0.7% |
| No Internet | 30 | 10.0% |
| Total | 300 | 100.0% |
Arco Summary
Arco is a city located in the southeastern corner of Idaho, in the county of Butte. It is the county seat of Butte County and is the largest city in the county. The city is located in the Snake River Valley, near the border of Wyoming and Utah. The population of Arco was 1,890 at the 2010 census.
History
Arco was founded in 1879 by a group of settlers from the nearby town of Paris, Idaho. The settlers were looking for a place to settle and farm, and they chose the area around Arco because of its fertile soil and abundant water supply. The town was originally called Root Hog, but the name was changed to Arco in 1882. The name Arco is derived from the Spanish word for “arch”, and was chosen to reflect the town’s location at the entrance to the Snake River Valley.
The town grew quickly, and by the early 1900s it had become a major agricultural center. The town was also home to a number of businesses, including a flour mill, a creamery, a sawmill, and a brickyard. In the 1920s, the town was connected to the rest of the state by the Idaho Northern and Pacific Railroad.
In the 1950s, the town began to experience a decline in population as people moved away to larger cities. However, in the 1970s, the town began to experience a resurgence as people began to move back to the area. The town was also home to the first nuclear power plant in the United States, which was built in the 1950s and operated until the 1990s.
Geography
Arco is located in the Snake River Valley, near the border of Wyoming and Utah. The city is situated at an elevation of 4,945 feet above sea level. The city is surrounded by the Snake River Mountains to the east and the Big Lost River to the west. The city is located approximately 50 miles south of Idaho Falls and 100 miles north of Salt Lake City, Utah.
The climate in Arco is semi-arid, with hot summers and cold winters. The average high temperature in the summer is around 90 degrees Fahrenheit, and the average low temperature in the winter is around 20 degrees Fahrenheit. The city receives an average of 12 inches of precipitation per year.
Economy
The economy of Arco is largely based on agriculture and tourism. The city is home to a number of farms, which produce a variety of crops, including potatoes, wheat, barley, and alfalfa. The city is also home to a number of tourist attractions, including the Arco Nuclear Power Plant, the Big Lost River, and the Snake River Valley.
The city is also home to a number of businesses, including a grocery store, a hardware store, a bank, and a number of restaurants. The city is also home to a number of manufacturing companies, including a furniture factory and a plastics factory.
Demographics
As of the 2010 census, the population of Arco was 1,890. The racial makeup of the city was 95.3% White, 0.3% African American, 0.7% Native American, 0.2% Asian, 0.1% Pacific Islander, 1.2% from other races, and 2.4% from two or more races. Hispanic or Latino of any race were 3.2% of the population.
The median income for a household in the city was $35,938, and the median income for a family was $41,250. The per capita income for the city was $17,845. About 11.2% of families and 14.2% of the population were below the poverty line, including 18.2% of those under age 18 and 8.3% of those age 65 or over.
Common Questions
What is Per Capita Income in Arco?
Per Capita income in Arco is $28,309.
What is the Median Family Income in Arco?
Median Family Income in Arco is $37,317.
What is the Median Household income in Arco?
Median Household Income in Arco is $35,585.
What is Income or Wage Gap in Arco?
Income or Wage Gap in Arco is 52.8%.
Women in Arco earn 47.2 cents for every dollar earned by a man.
What is Inequality or Gini Index in Arco?
Inequality or Gini Index in Arco is 0.61.
What is the Total Population of Arco?
Total Population of Arco is 749.
What is the Total Male Population of Arco?
Total Male Population of Arco is 252.
What is the Total Female Population of Arco?
Total Female Population of Arco is 497.
What is the Ratio of Males per 100 Females in Arco?
There are 50.70 Males per 100 Females in Arco.
What is the Ratio of Females per 100 Males in Arco?
There are 197.22 Females per 100 Males in Arco.
What is the Median Population Age in Arco?
Median Population Age in Arco is 37.8 Years.
What is the Average Family Size in Arco
Average Family Size in Arco is 3.2 People.
What is the Average Household Size in Arco
Average Household Size in Arco is 2.4 People.
How Large is the Labor Force in Arco?
There are 253 People in the Labor Forcein in Arco.
What is the Percentage of People in the Labor Force in Arco?
45.2% of People are in the Labor Force in Arco.