Albion, ID Map & Demographics
Albion Map
Albion Overview
$27,281
PER CAPITA INCOME
$64,922
AVG FAMILY INCOME
$64,922
AVG HOUSEHOLD INCOME
59.4%
WAGE / INCOME GAP [ % ]
40.6¢/ $1
WAGE / INCOME GAP [ $ ]
0.32
INEQUALITY / GINI INDEX
375
TOTAL POPULATION
192
MALE POPULATION
183
FEMALE POPULATION
104.92
MALES / 100 FEMALES
95.31
FEMALES / 100 MALES
37.2
MEDIAN AGE
3.0
AVG FAMILY SIZE
2.6
AVG HOUSEHOLD SIZE
163
LABOR FORCE [ PEOPLE ]
58.4%
PERCENT IN LABOR FORCE
9.8%
UNEMPLOYMENT RATE
Albion Zip Codes
Albion Area Codes
Income in Albion
Income Overview in Albion
Per Capita Income in Albion is $27,281, while median incomes of families and households are $64,922 and $64,922 respectively.
| Characteristic | Number | Measure |
| Per Capita Income | 375 | $27,281 |
| Median Family Income | 103 | $64,922 |
| Mean Family Income | 103 | $70,943 |
| Median Household Income | 145 | $64,922 |
| Mean Household Income | 145 | $69,674 |
| Income Deficit | 103 | $0 |
| Wage / Income Gap (%) | 375 | 59.41% |
| Wage / Income Gap ($) | 375 | 40.59¢ per $1 |
| Gini / Inequality Index | 375 | 0.32 |
Earnings by Sex in Albion
Average Earnings in Albion are $33,393, $55,938 for men and $22,708 for women, a difference of 59.4%.
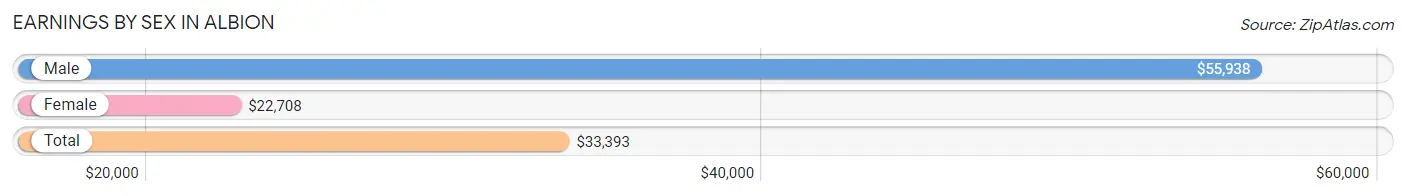
| Sex | Number | Average Earnings |
| Male | 80 (49.1%) | $55,938 |
| Female | 83 (50.9%) | $22,708 |
| Total | 163 (100.0%) | $33,393 |
Earnings by Sex by Income Bracket in Albion
The most common earnings brackets in Albion are $55,000 to $64,999 for men (17 | 21.2%) and $2,499 or less for women (11 | 13.3%).
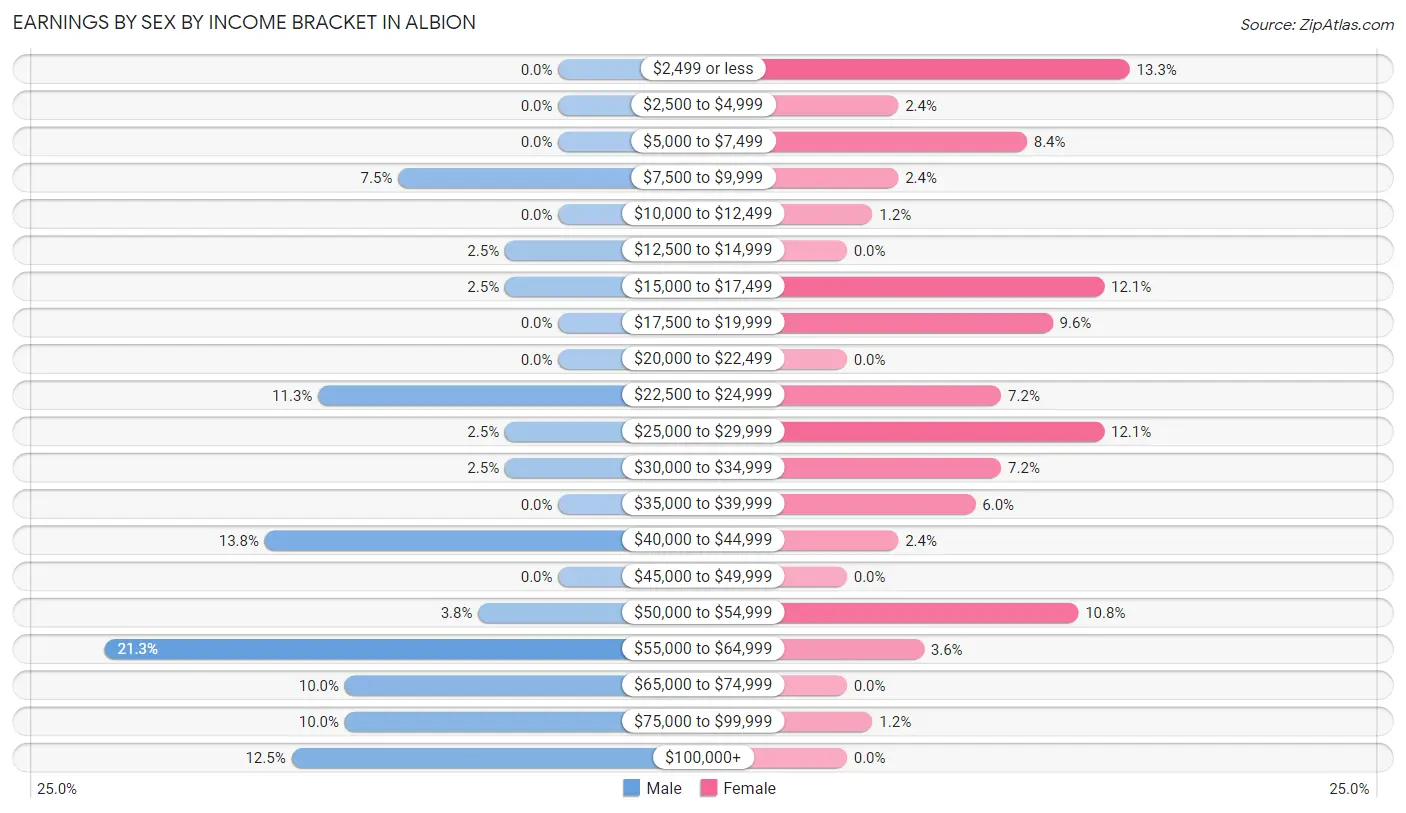
| Income | Male | Female |
| $2,499 or less | 0 (0.0%) | 11 (13.3%) |
| $2,500 to $4,999 | 0 (0.0%) | 2 (2.4%) |
| $5,000 to $7,499 | 0 (0.0%) | 7 (8.4%) |
| $7,500 to $9,999 | 6 (7.5%) | 2 (2.4%) |
| $10,000 to $12,499 | 0 (0.0%) | 1 (1.2%) |
| $12,500 to $14,999 | 2 (2.5%) | 0 (0.0%) |
| $15,000 to $17,499 | 2 (2.5%) | 10 (12.0%) |
| $17,500 to $19,999 | 0 (0.0%) | 8 (9.6%) |
| $20,000 to $22,499 | 0 (0.0%) | 0 (0.0%) |
| $22,500 to $24,999 | 9 (11.3%) | 6 (7.2%) |
| $25,000 to $29,999 | 2 (2.5%) | 10 (12.0%) |
| $30,000 to $34,999 | 2 (2.5%) | 6 (7.2%) |
| $35,000 to $39,999 | 0 (0.0%) | 5 (6.0%) |
| $40,000 to $44,999 | 11 (13.8%) | 2 (2.4%) |
| $45,000 to $49,999 | 0 (0.0%) | 0 (0.0%) |
| $50,000 to $54,999 | 3 (3.7%) | 9 (10.8%) |
| $55,000 to $64,999 | 17 (21.2%) | 3 (3.6%) |
| $65,000 to $74,999 | 8 (10.0%) | 0 (0.0%) |
| $75,000 to $99,999 | 8 (10.0%) | 1 (1.2%) |
| $100,000+ | 10 (12.5%) | 0 (0.0%) |
| Total | 80 (100.0%) | 83 (100.0%) |
Earnings by Sex by Educational Attainment in Albion
Average earnings in Albion are $57,344 for men and $19,063 for women, a difference of 66.8%. Men with an educational attainment of high school diploma enjoy the highest average annual earnings of $71,250, while those with college or associate's degree education earn the least with $55,156. Women with an educational attainment of bachelor's degree earn the most with the average annual earnings of $34,000, while those with bachelor's degree education have the smallest earnings of $34,000.
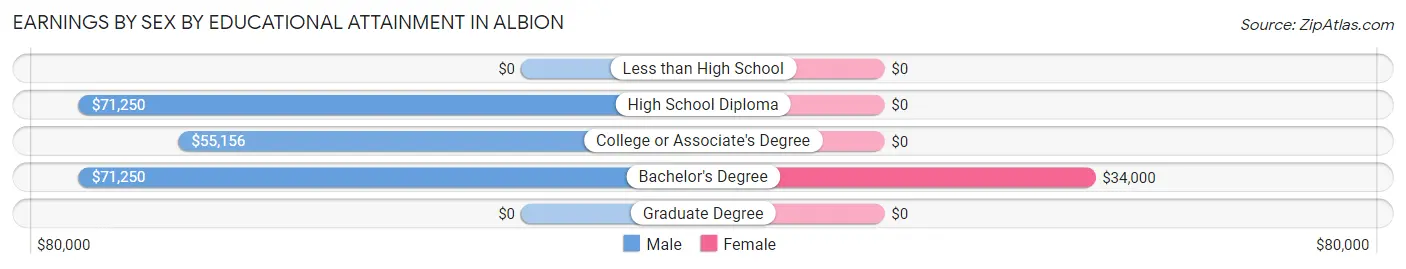
| Educational Attainment | Male Income | Female Income |
| Less than High School | - | - |
| High School Diploma | $71,250 | $0 |
| College or Associate's Degree | $55,156 | $0 |
| Bachelor's Degree | $71,250 | $34,000 |
| Graduate Degree | - | - |
| Total | $57,344 | $19,063 |
Family Income in Albion
Family Income Brackets in Albion
According to the Albion family income data, there are 38 families falling into the $75,000 to $99,999 income range, which is the most common income bracket and makes up 36.9% of all families.
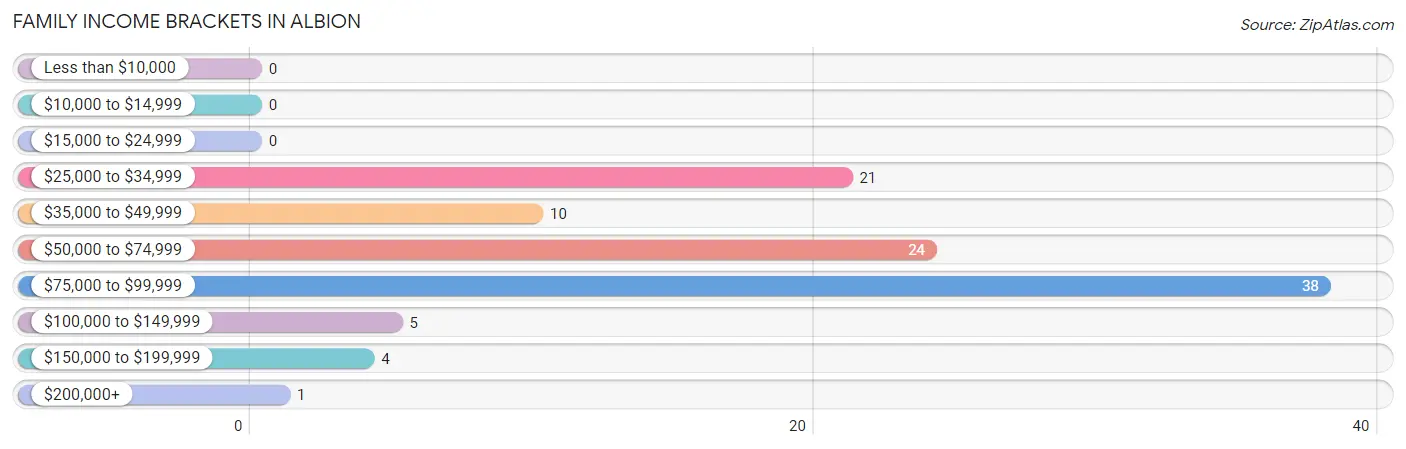
| Income Bracket | # Families | % Families |
| Less than $10,000 | 0 | 0.0% |
| $10,000 to $14,999 | 0 | 0.0% |
| $15,000 to $24,999 | 0 | 0.0% |
| $25,000 to $34,999 | 21 | 20.4% |
| $35,000 to $49,999 | 10 | 9.7% |
| $50,000 to $74,999 | 24 | 23.3% |
| $75,000 to $99,999 | 38 | 36.9% |
| $100,000 to $149,999 | 5 | 4.9% |
| $150,000 to $199,999 | 4 | 3.9% |
| $200,000+ | 1 | 1.0% |
Family Income by Famaliy Size in Albion
3-person families (24 | 23.3%) account for the highest median family income in Albion with $83,333 per family, while 3-person families (24 | 23.3%) have the highest median income of $27,778 per family member.
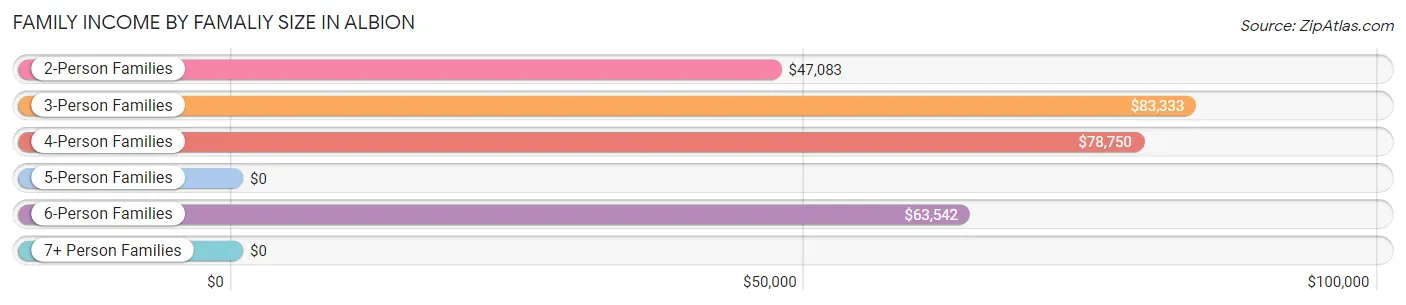
| Income Bracket | # Families | Median Income |
| 2-Person Families | 57 (55.3%) | $47,083 |
| 3-Person Families | 24 (23.3%) | $83,333 |
| 4-Person Families | 7 (6.8%) | $78,750 |
| 5-Person Families | 2 (1.9%) | $0 |
| 6-Person Families | 9 (8.7%) | $63,542 |
| 7+ Person Families | 4 (3.9%) | $0 |
| Total | 103 (100.0%) | $64,922 |
Family Income by Number of Earners in Albion
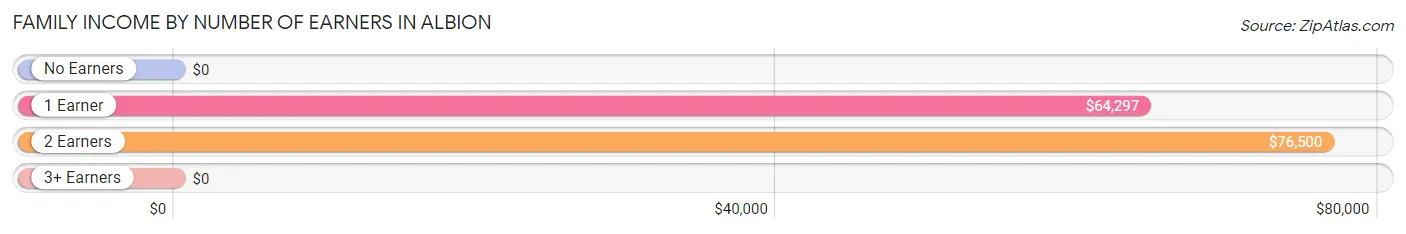
| Number of Earners | # Families | Median Income |
| No Earners | 25 (24.3%) | $0 |
| 1 Earner | 47 (45.6%) | $64,297 |
| 2 Earners | 24 (23.3%) | $76,500 |
| 3+ Earners | 7 (6.8%) | $0 |
| Total | 103 (100.0%) | $64,922 |
Household Income in Albion
Household Income Brackets in Albion
With 39 households falling in the category, the $75,000 to $99,999 income range is the most frequent in Albion, accounting for 26.9% of all households. In contrast, only 1 households (0.7%) fall into the $200,000+ income bracket, making it the least populous group.
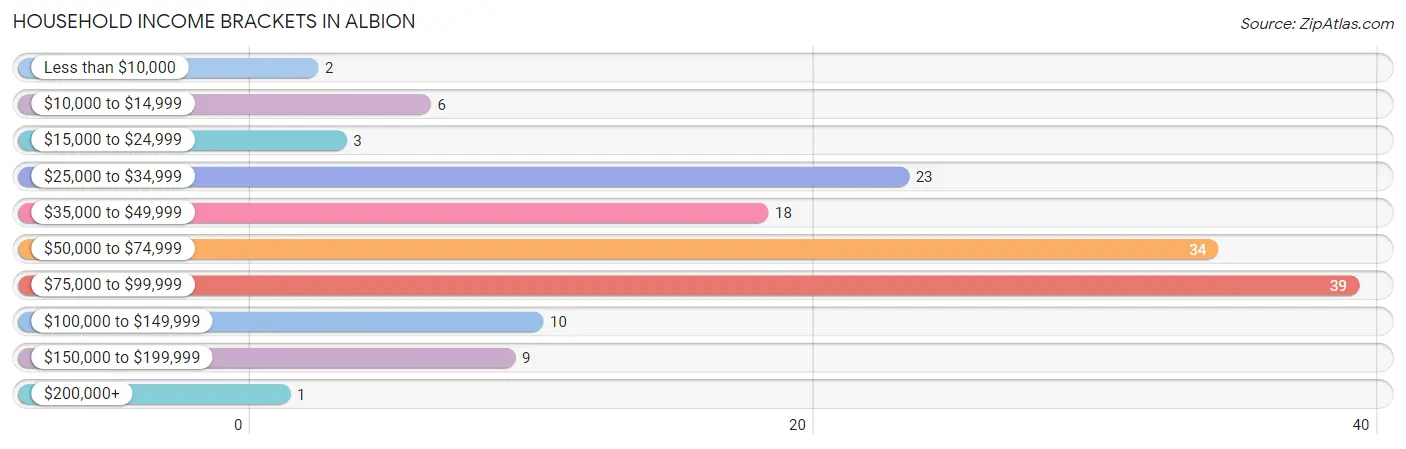
| Income Bracket | # Households | % Households |
| Less than $10,000 | 2 | 1.4% |
| $10,000 to $14,999 | 6 | 4.1% |
| $15,000 to $24,999 | 3 | 2.1% |
| $25,000 to $34,999 | 23 | 15.9% |
| $35,000 to $49,999 | 18 | 12.4% |
| $50,000 to $74,999 | 34 | 23.4% |
| $75,000 to $99,999 | 39 | 26.9% |
| $100,000 to $149,999 | 10 | 6.9% |
| $150,000 to $199,999 | 9 | 6.2% |
| $200,000+ | 1 | 0.7% |
Household Income by Householder Age in Albion
The median household income in Albion is $64,922, with the highest median household income of $77,750 found in the 25 to 44 years age bracket for the primary householder. A total of 47 households (32.4%) fall into this category. Meanwhile, the 15 to 24 years age bracket for the primary householder has the lowest median household income of $0, with 5 households (3.5%) in this group.
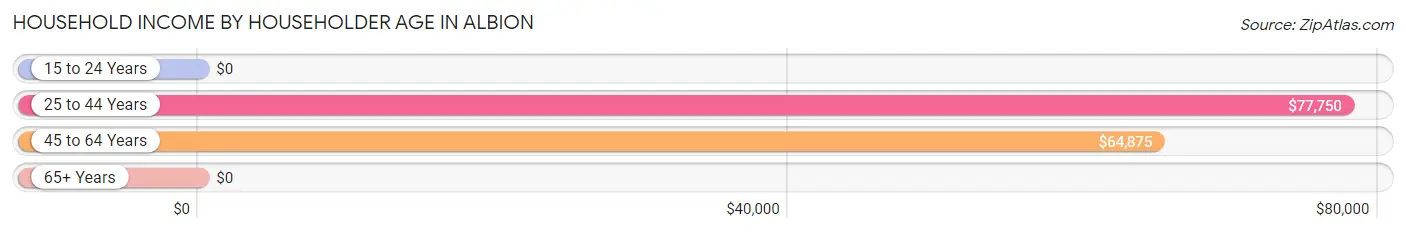
| Income Bracket | # Households | Median Income |
| 15 to 24 Years | 5 (3.5%) | $0 |
| 25 to 44 Years | 47 (32.4%) | $77,750 |
| 45 to 64 Years | 37 (25.5%) | $64,875 |
| 65+ Years | 56 (38.6%) | $0 |
| Total | 145 (100.0%) | $64,922 |
Poverty in Albion
Income Below Poverty by Sex and Age in Albion
With 7.8% poverty level for males and 11.5% for females among the residents of Albion, 25 to 34 year old males and 45 to 54 year old females are the most vulnerable to poverty, with 9 males (27.3%) and 6 females (60.0%) in their respective age groups living below the poverty level.
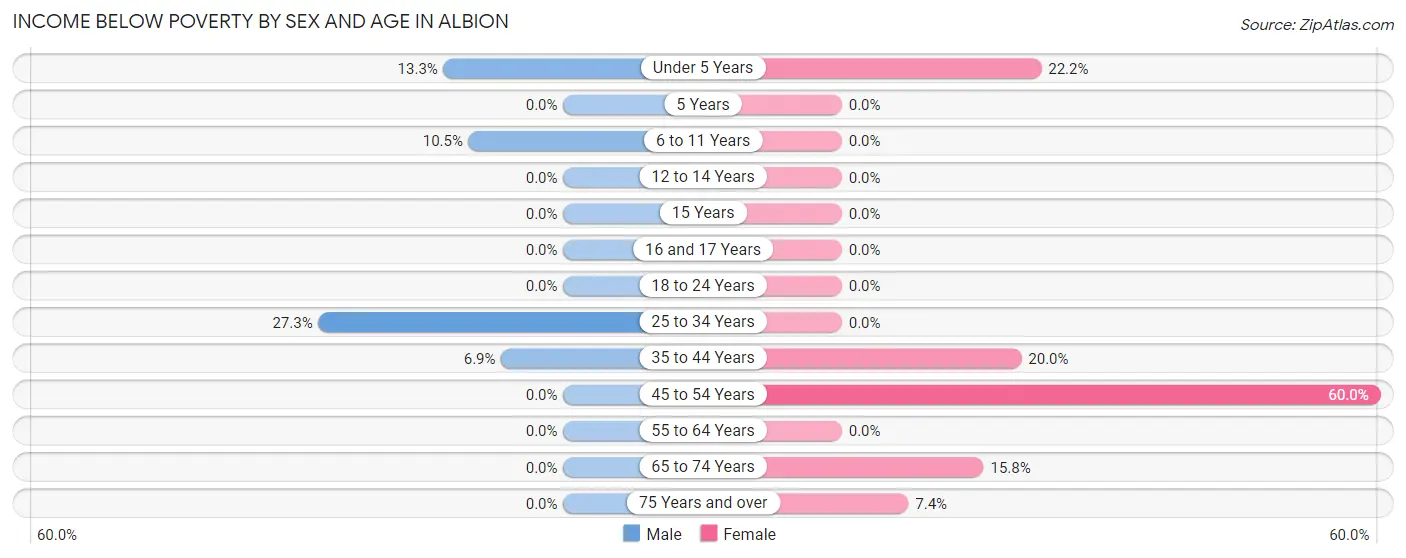
| Age Bracket | Male | Female |
| Under 5 Years | 2 (13.3%) | 4 (22.2%) |
| 5 Years | 0 (0.0%) | 0 (0.0%) |
| 6 to 11 Years | 2 (10.5%) | 0 (0.0%) |
| 12 to 14 Years | 0 (0.0%) | 0 (0.0%) |
| 15 Years | 0 (0.0%) | 0 (0.0%) |
| 16 and 17 Years | 0 (0.0%) | 0 (0.0%) |
| 18 to 24 Years | 0 (0.0%) | 0 (0.0%) |
| 25 to 34 Years | 9 (27.3%) | 0 (0.0%) |
| 35 to 44 Years | 2 (6.9%) | 3 (20.0%) |
| 45 to 54 Years | 0 (0.0%) | 6 (60.0%) |
| 55 to 64 Years | 0 (0.0%) | 0 (0.0%) |
| 65 to 74 Years | 0 (0.0%) | 6 (15.8%) |
| 75 Years and over | 0 (0.0%) | 2 (7.4%) |
| Total | 15 (7.8%) | 21 (11.5%) |
Income Above Poverty by Sex and Age in Albion
According to the poverty statistics in Albion, males aged 5 years and females aged 5 years are the age groups that are most secure financially, with 100.0% of males and 100.0% of females in these age groups living above the poverty line.
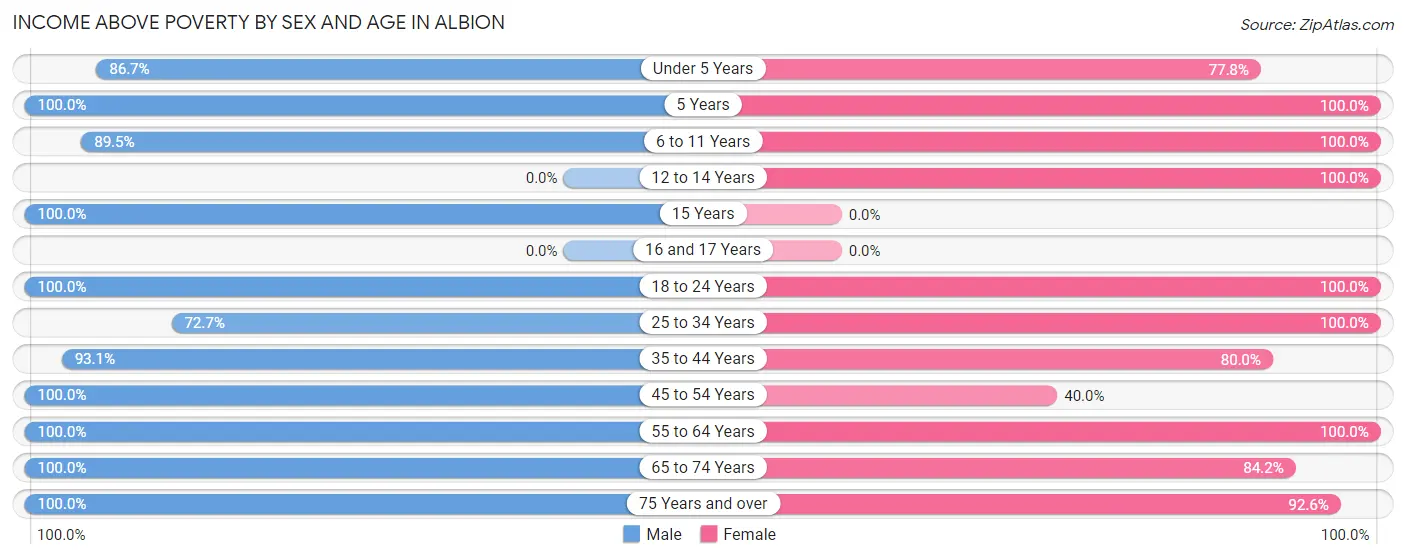
| Age Bracket | Male | Female |
| Under 5 Years | 13 (86.7%) | 14 (77.8%) |
| 5 Years | 10 (100.0%) | 3 (100.0%) |
| 6 to 11 Years | 17 (89.5%) | 25 (100.0%) |
| 12 to 14 Years | 0 (0.0%) | 3 (100.0%) |
| 15 Years | 3 (100.0%) | 0 (0.0%) |
| 16 and 17 Years | 0 (0.0%) | 0 (0.0%) |
| 18 to 24 Years | 9 (100.0%) | 7 (100.0%) |
| 25 to 34 Years | 24 (72.7%) | 27 (100.0%) |
| 35 to 44 Years | 27 (93.1%) | 12 (80.0%) |
| 45 to 54 Years | 10 (100.0%) | 4 (40.0%) |
| 55 to 64 Years | 25 (100.0%) | 10 (100.0%) |
| 65 to 74 Years | 11 (100.0%) | 32 (84.2%) |
| 75 Years and over | 28 (100.0%) | 25 (92.6%) |
| Total | 177 (92.2%) | 162 (88.5%) |
Income Below Poverty Among Married-Couple Families in Albion
The poverty statistics for married-couple families in Albion show that 2.0% or 2 of the total 98 families live below the poverty line. Families with 3 or 4 children have the highest poverty rate of 20.0%, comprising of 2 families. On the other hand, families with no children have the lowest poverty rate of 0.0%, which includes 0 families.
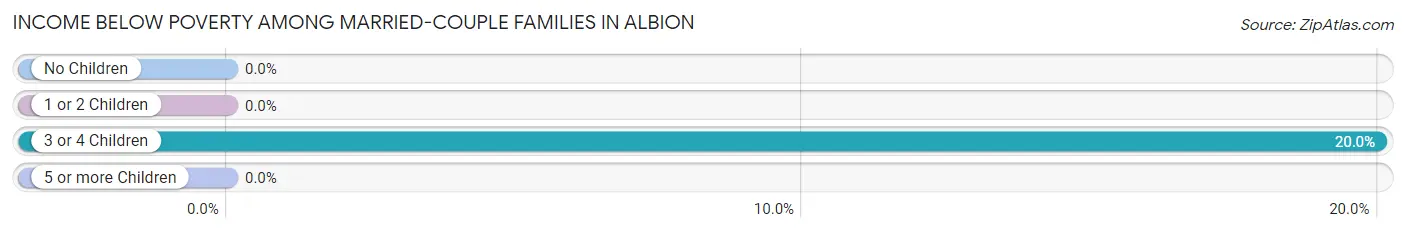
| Children | Above Poverty | Below Poverty |
| No Children | 62 (100.0%) | 0 (0.0%) |
| 1 or 2 Children | 22 (100.0%) | 0 (0.0%) |
| 3 or 4 Children | 8 (80.0%) | 2 (20.0%) |
| 5 or more Children | 4 (100.0%) | 0 (0.0%) |
| Total | 96 (98.0%) | 2 (2.0%) |
Income Below Poverty Among Single-Parent Households in Albion
| Children | Single Father | Single Mother |
| No Children | 0 (0.0%) | 0 (0.0%) |
| 1 or 2 Children | 0 (0.0%) | 0 (0.0%) |
| 3 or 4 Children | 0 (0.0%) | 0 (0.0%) |
| 5 or more Children | 0 (0.0%) | 0 (0.0%) |
| Total | 0 (0.0%) | 0 (0.0%) |
Income Below Poverty Among Married-Couple vs Single-Parent Households in Albion
| Children | Married-Couple Families | Single-Parent Households |
| No Children | 0 (0.0%) | 0 (0.0%) |
| 1 or 2 Children | 0 (0.0%) | 0 (0.0%) |
| 3 or 4 Children | 2 (20.0%) | 0 (0.0%) |
| 5 or more Children | 0 (0.0%) | 0 (0.0%) |
| Total | 2 (2.0%) | 0 (0.0%) |
Race in Albion
The most populous races in Albion are White / Caucasian (336 | 89.6%), Hispanic or Latino (41 | 10.9%), and Two or more Races (33 | 8.8%).
| Race | # Population | % Population |
| Asian | 0 | 0.0% |
| Black / African American | 0 | 0.0% |
| Hawaiian / Pacific | 0 | 0.0% |
| Hispanic or Latino | 41 | 10.9% |
| Native / Alaskan | 6 | 1.6% |
| White / Caucasian | 336 | 89.6% |
| Two or more Races | 33 | 8.8% |
| Some other Race | 0 | 0.0% |
| Total | 375 | 100.0% |
Ancestry in Albion
The most populous ancestries reported in Albion are American (84 | 22.4%), English (69 | 18.4%), Mexican (39 | 10.4%), German (33 | 8.8%), and Scottish (31 | 8.3%), together accounting for 68.3% of all Albion residents.
| Ancestry | # Population | % Population |
| American | 84 | 22.4% |
| Apache | 2 | 0.5% |
| Blackfeet | 1 | 0.3% |
| British | 1 | 0.3% |
| Burmese | 4 | 1.1% |
| Czech | 2 | 0.5% |
| Danish | 1 | 0.3% |
| Dutch | 1 | 0.3% |
| English | 69 | 18.4% |
| European | 3 | 0.8% |
| French | 3 | 0.8% |
| French Canadian | 2 | 0.5% |
| German | 33 | 8.8% |
| Irish | 20 | 5.3% |
| Mexican | 39 | 10.4% |
| Norwegian | 2 | 0.5% |
| Portuguese | 6 | 1.6% |
| Scotch-Irish | 3 | 0.8% |
| Scottish | 31 | 8.3% |
| Spaniard | 2 | 0.5% |
| Swedish | 9 | 2.4% |
| Welsh | 2 | 0.5% |
| Yaqui | 2 | 0.5% | View All 23 Rows |
Immigrants in Albion
The most numerous immigrant groups reported in Albion came from Latin America (4 | 1.1%), Central America (2 | 0.5%), Mexico (2 | 0.5%), South America (2 | 0.5%), and Uruguay (2 | 0.5%), together accounting for 3.2% of all Albion residents.
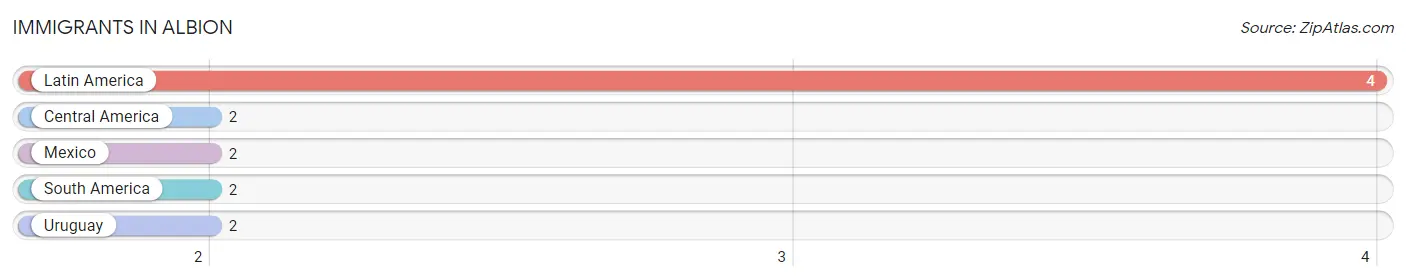
| Immigration Origin | # Population | % Population |
| Central America | 2 | 0.5% |
| Latin America | 4 | 1.1% |
| Mexico | 2 | 0.5% |
| South America | 2 | 0.5% |
| Uruguay | 2 | 0.5% | View All 5 Rows |
Sex and Age in Albion
Sex and Age in Albion
The most populous age groups in Albion are 25 to 29 Years (26 | 13.5%) for men and 5 to 9 Years (23 | 12.6%) for women.
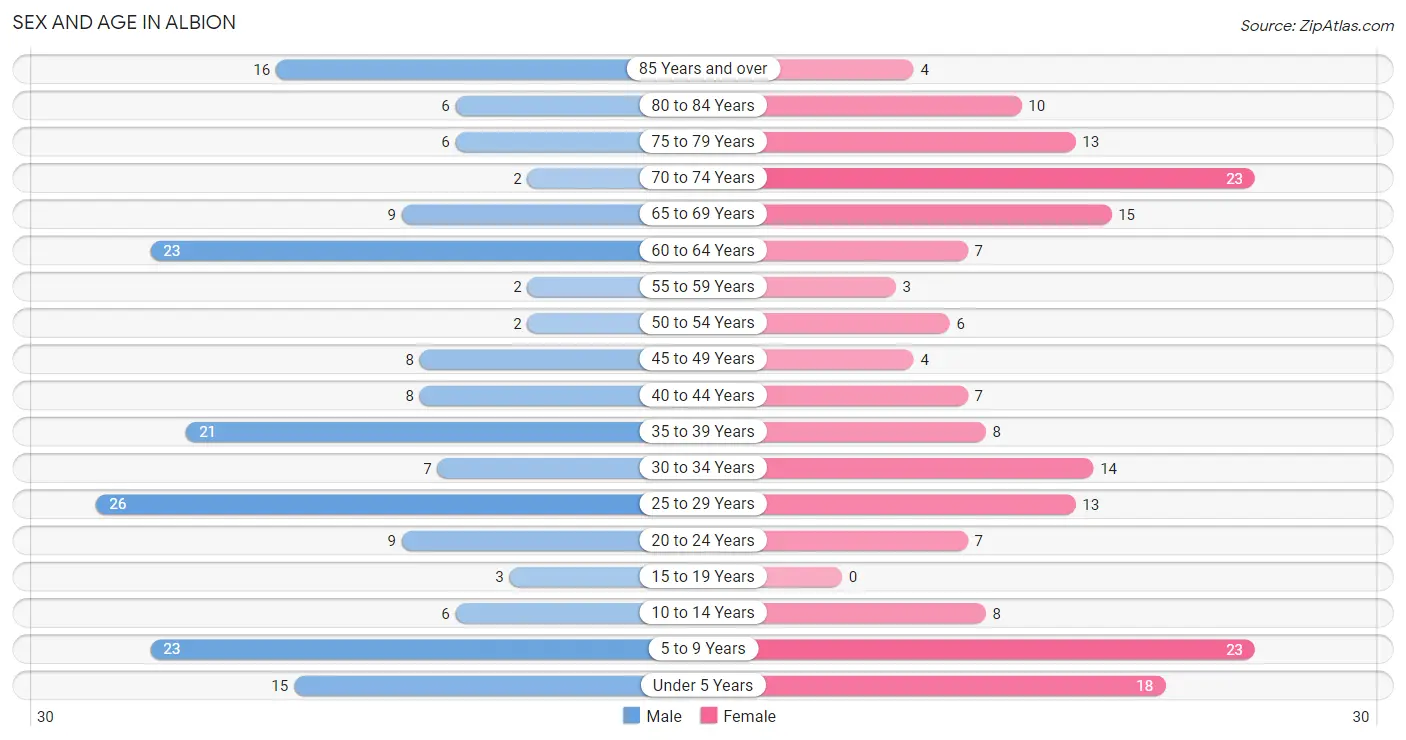
| Age Bracket | Male | Female |
| Under 5 Years | 15 (7.8%) | 18 (9.8%) |
| 5 to 9 Years | 23 (12.0%) | 23 (12.6%) |
| 10 to 14 Years | 6 (3.1%) | 8 (4.4%) |
| 15 to 19 Years | 3 (1.6%) | 0 (0.0%) |
| 20 to 24 Years | 9 (4.7%) | 7 (3.8%) |
| 25 to 29 Years | 26 (13.5%) | 13 (7.1%) |
| 30 to 34 Years | 7 (3.6%) | 14 (7.6%) |
| 35 to 39 Years | 21 (10.9%) | 8 (4.4%) |
| 40 to 44 Years | 8 (4.2%) | 7 (3.8%) |
| 45 to 49 Years | 8 (4.2%) | 4 (2.2%) |
| 50 to 54 Years | 2 (1.0%) | 6 (3.3%) |
| 55 to 59 Years | 2 (1.0%) | 3 (1.6%) |
| 60 to 64 Years | 23 (12.0%) | 7 (3.8%) |
| 65 to 69 Years | 9 (4.7%) | 15 (8.2%) |
| 70 to 74 Years | 2 (1.0%) | 23 (12.6%) |
| 75 to 79 Years | 6 (3.1%) | 13 (7.1%) |
| 80 to 84 Years | 6 (3.1%) | 10 (5.5%) |
| 85 Years and over | 16 (8.3%) | 4 (2.2%) |
| Total | 192 (100.0%) | 183 (100.0%) |
Families and Households in Albion
Median Family Size in Albion
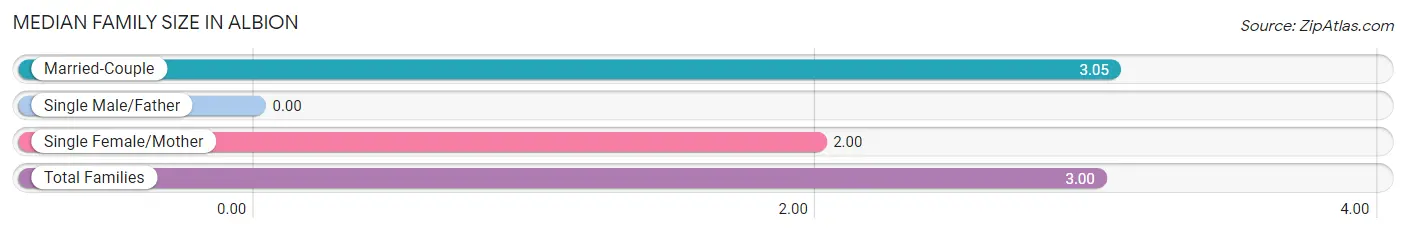
| Family Type | # Families | Family Size |
| Married-Couple | 98 (95.2%) | 3.05 |
| Single Male/Father | 0 (0.0%) | - |
| Single Female/Mother | 5 (4.9%) | 2.00 |
| Total Families | 103 (100.0%) | 3.00 |
Median Household Size in Albion
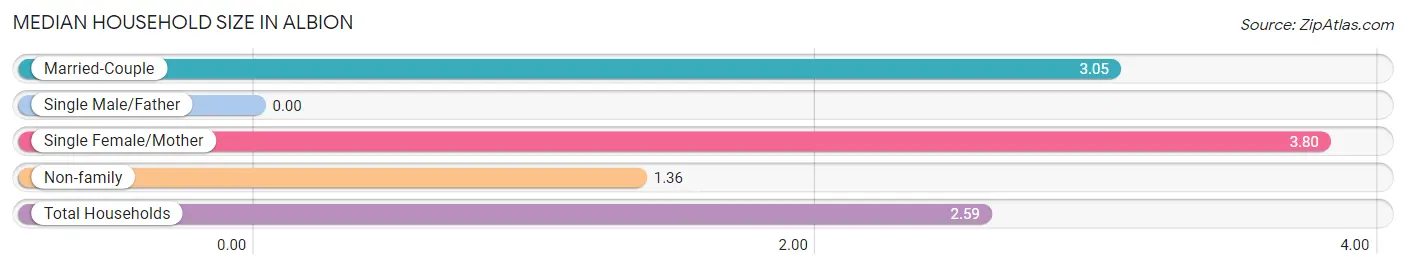
| Household Type | # Households | Household Size |
| Married-Couple | 98 (67.6%) | 3.05 |
| Single Male/Father | 0 (0.0%) | - |
| Single Female/Mother | 5 (3.5%) | 3.80 |
| Non-family | 42 (29.0%) | 1.36 |
| Total Households | 145 (100.0%) | 2.59 |
Household Size by Marriage Status in Albion
Out of a total of 145 households in Albion, 103 (71.0%) are family households, while 42 (29.0%) are nonfamily households. The most numerous type of family households are 2-person households, comprising 52, and the most common type of nonfamily households are 2-person households, comprising 22.
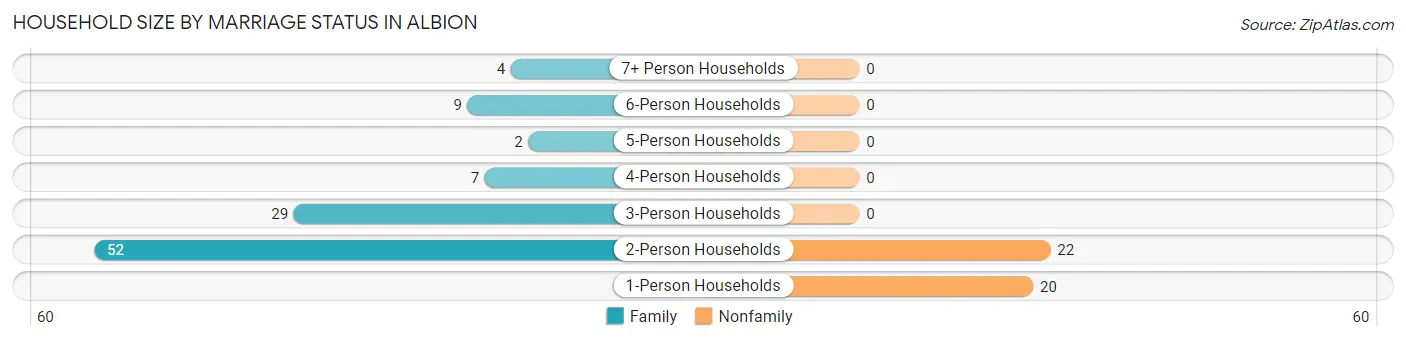
| Household Size | Family Households | Nonfamily Households |
| 1-Person Households | - | 20 (13.8%) |
| 2-Person Households | 52 (35.9%) | 22 (15.2%) |
| 3-Person Households | 29 (20.0%) | 0 (0.0%) |
| 4-Person Households | 7 (4.8%) | 0 (0.0%) |
| 5-Person Households | 2 (1.4%) | 0 (0.0%) |
| 6-Person Households | 9 (6.2%) | 0 (0.0%) |
| 7+ Person Households | 4 (2.8%) | 0 (0.0%) |
| Total | 103 (71.0%) | 42 (29.0%) |
Female Fertility in Albion
Fertility by Age in Albion
Average fertility rate in Albion is 189.0 births per 1,000 women. Women in the age bracket of 20 to 34 years have the highest fertility rate with 206.0 births per 1,000 women. Women in the age bracket of 20 to 34 years acount for 70.0% of all women with births.
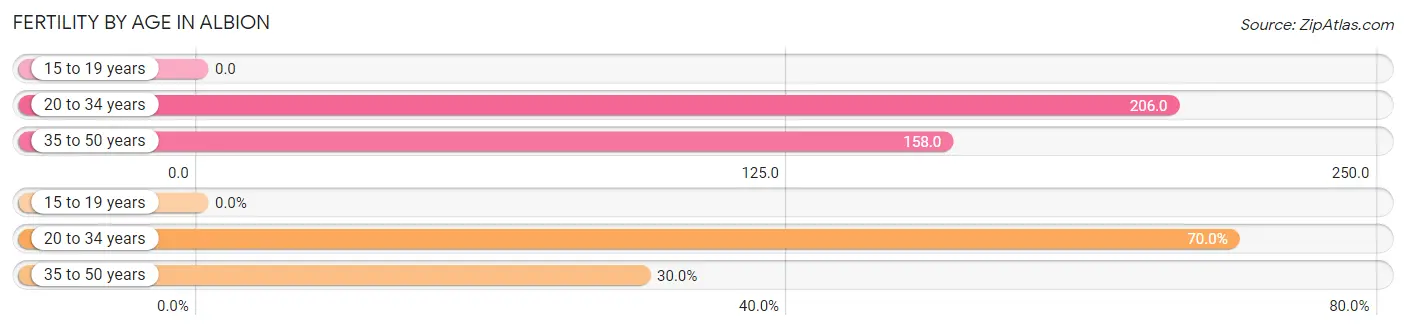
| Age Bracket | Women with Births | Births / 1,000 Women |
| 15 to 19 years | 0 (0.0%) | 0.0 |
| 20 to 34 years | 7 (70.0%) | 206.0 |
| 35 to 50 years | 3 (30.0%) | 158.0 |
| Total | 10 (100.0%) | 189.0 |
Fertility by Age by Marriage Status in Albion
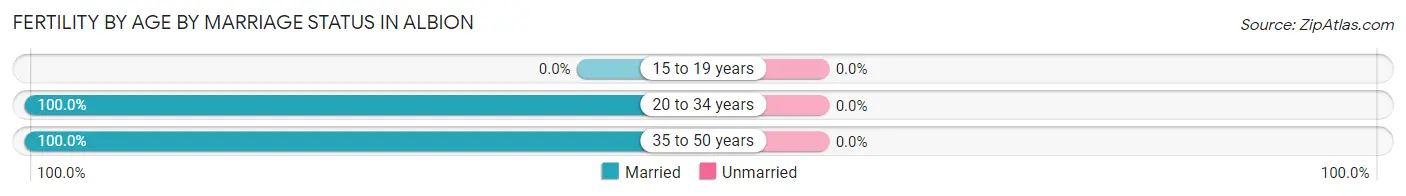
| Age Bracket | Married | Unmarried |
| 15 to 19 years | 0 (0.0%) | 0 (0.0%) |
| 20 to 34 years | 7 (100.0%) | 0 (0.0%) |
| 35 to 50 years | 3 (100.0%) | 0 (0.0%) |
| Total | 10 (100.0%) | 0 (0.0%) |
Fertility by Education in Albion
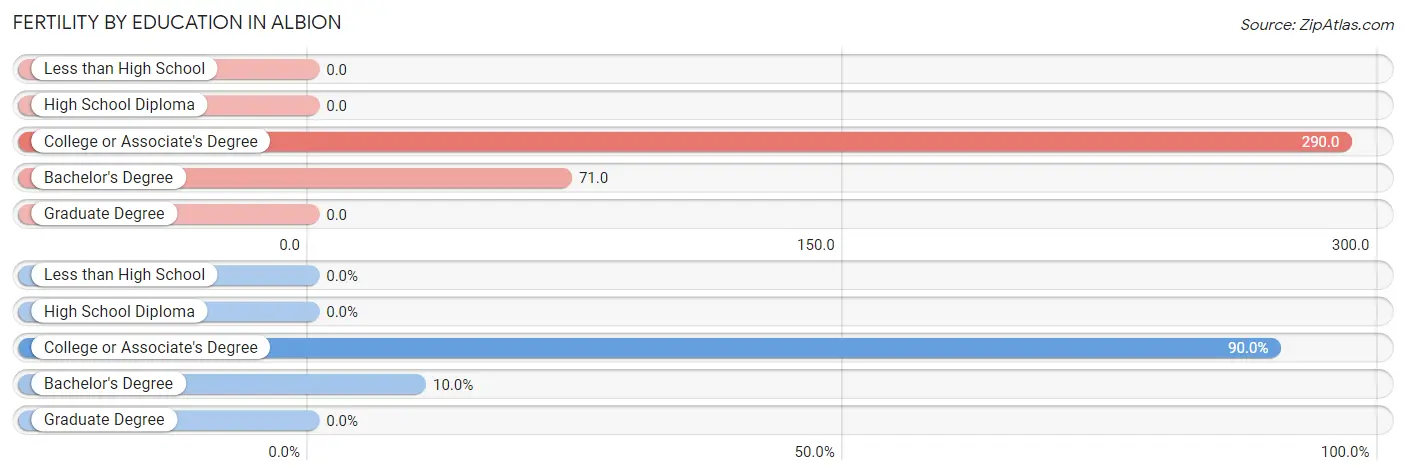
| Educational Attainment | Women with Births | Births / 1,000 Women |
| Less than High School | 0 (0.0%) | 0.0 |
| High School Diploma | 0 (0.0%) | 0.0 |
| College or Associate's Degree | 9 (90.0%) | 290.0 |
| Bachelor's Degree | 1 (10.0%) | 71.0 |
| Graduate Degree | 0 (0.0%) | 0.0 |
| Total | 10 (100.0%) | 189.0 |
Fertility by Education by Marriage Status in Albion
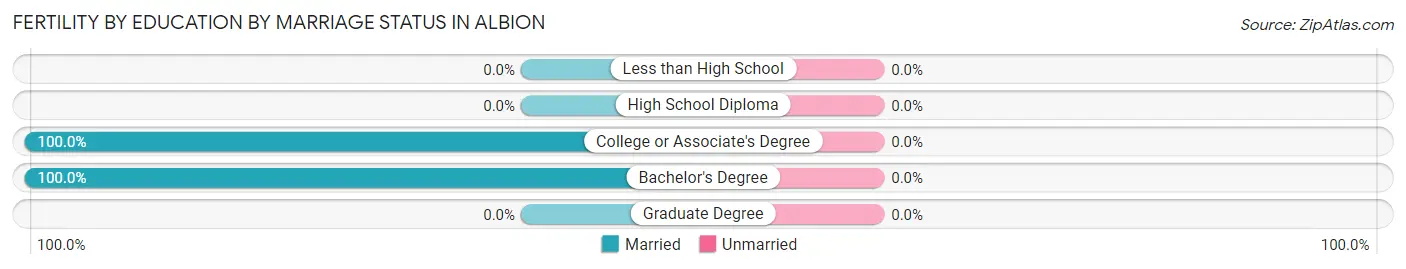
| Educational Attainment | Married | Unmarried |
| Less than High School | 0 (0.0%) | 0 (0.0%) |
| High School Diploma | 0 (0.0%) | 0 (0.0%) |
| College or Associate's Degree | 9 (100.0%) | 0 (0.0%) |
| Bachelor's Degree | 1 (100.0%) | 0 (0.0%) |
| Graduate Degree | 0 (0.0%) | 0 (0.0%) |
| Total | 10 (100.0%) | 0 (0.0%) |
Employment Characteristics in Albion
Employment by Class of Employer in Albion
Among the 147 employed individuals in Albion, private company employees (90 | 61.2%), state government employees (30 | 20.4%), and not-for-profit organizations (9 | 6.1%) make up the most common classes of employment.
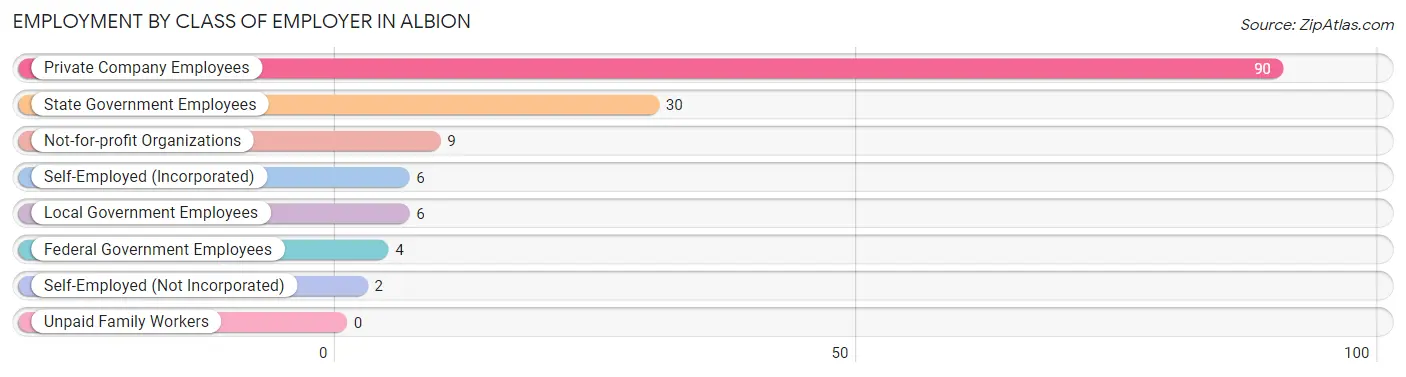
| Employer Class | # Employees | % Employees |
| Private Company Employees | 90 | 61.2% |
| Self-Employed (Incorporated) | 6 | 4.1% |
| Self-Employed (Not Incorporated) | 2 | 1.4% |
| Not-for-profit Organizations | 9 | 6.1% |
| Local Government Employees | 6 | 4.1% |
| State Government Employees | 30 | 20.4% |
| Federal Government Employees | 4 | 2.7% |
| Unpaid Family Workers | 0 | 0.0% |
| Total | 147 | 100.0% |
Employment Status by Age in Albion
According to the labor force statistics for Albion, out of the total population over 16 years of age (279), 58.4% or 163 individuals are in the labor force, with 9.8% or 16 of them unemployed. The age group with the highest labor force participation rate is 20 to 24 years, with 100.0% or 16 individuals in the labor force. Within the labor force, the 55 to 59 years age range has the highest percentage of unemployed individuals, with 66.7% or 2 of them being unemployed.
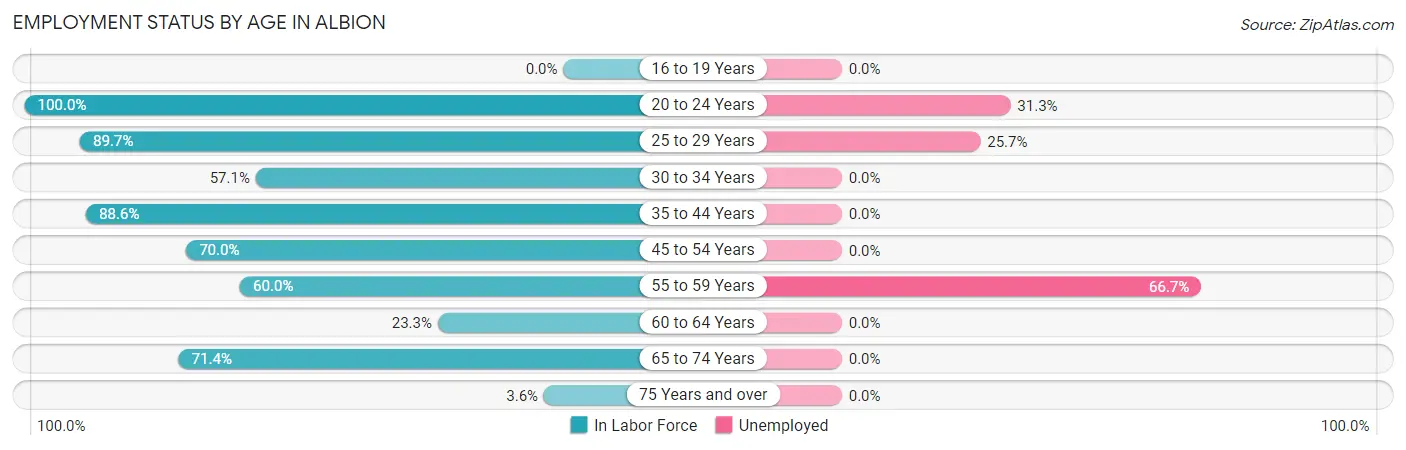
| Age Bracket | In Labor Force | Unemployed |
| 16 to 19 Years | 0 (0.0%) | 0 (0.0%) |
| 20 to 24 Years | 16 (100.0%) | 5 (31.3%) |
| 25 to 29 Years | 35 (89.7%) | 9 (25.7%) |
| 30 to 34 Years | 12 (57.1%) | 0 (0.0%) |
| 35 to 44 Years | 39 (88.6%) | 0 (0.0%) |
| 45 to 54 Years | 14 (70.0%) | 0 (0.0%) |
| 55 to 59 Years | 3 (60.0%) | 2 (66.7%) |
| 60 to 64 Years | 7 (23.3%) | 0 (0.0%) |
| 65 to 74 Years | 35 (71.4%) | 0 (0.0%) |
| 75 Years and over | 2 (3.6%) | 0 (0.0%) |
| Total | 163 (58.4%) | 16 (9.8%) |
Employment Status by Educational Attainment in Albion
According to labor force statistics for Albion, 69.2% of individuals (110) out of the total population between 25 and 64 years of age (159) are in the labor force, with 10.0% or 11 of them being unemployed. The group with the highest labor force participation rate are those with the educational attainment of high school diploma, with 88.5% or 23 individuals in the labor force. Within the labor force, individuals with high school diploma education have the highest percentage of unemployment, with 39.1% or 9 of them being unemployed.
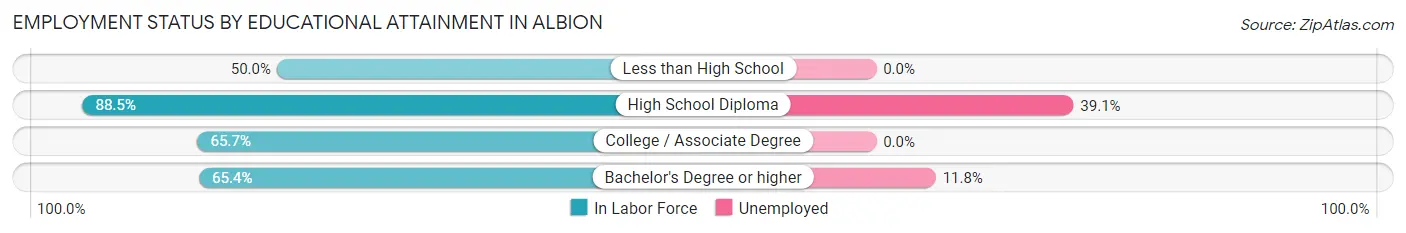
| Educational Attainment | In Labor Force | Unemployed |
| Less than High School | 1 (50.0%) | 0 (0.0%) |
| High School Diploma | 23 (88.5%) | 10 (39.1%) |
| College / Associate Degree | 69 (65.7%) | 0 (0.0%) |
| Bachelor's Degree or higher | 17 (65.4%) | 3 (11.8%) |
| Total | 110 (69.2%) | 16 (10.0%) |
Employment Occupations by Sex in Albion
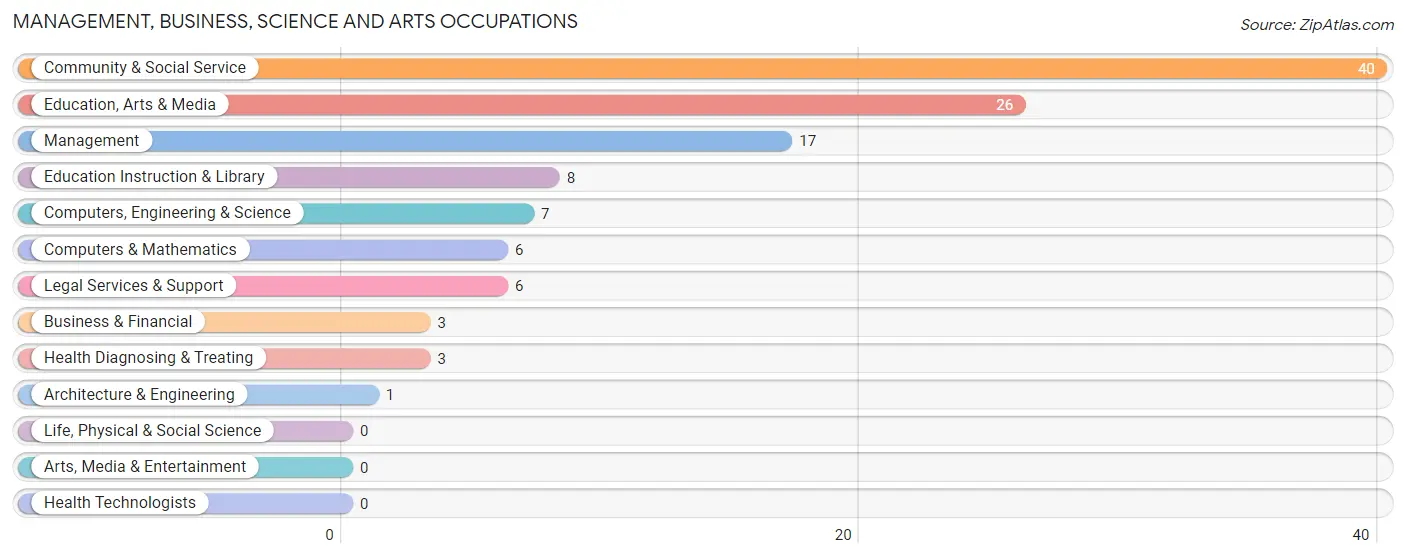
Management, Business, Science and Arts Occupations
The most common Management, Business, Science and Arts occupations in Albion are Community & Social Service (40 | 27.2%), Education, Arts & Media (26 | 17.7%), Management (17 | 11.6%), Education Instruction & Library (8 | 5.4%), and Computers, Engineering & Science (7 | 4.8%).
Management, Business, Science and Arts Occupations by Sex
Within the Management, Business, Science and Arts occupations in Albion, the most male-oriented occupations are Computers, Engineering & Science (100.0%), Computers & Mathematics (100.0%), and Architecture & Engineering (100.0%), while the most female-oriented occupations are Business & Financial (100.0%), Legal Services & Support (100.0%), and Education Instruction & Library (100.0%).
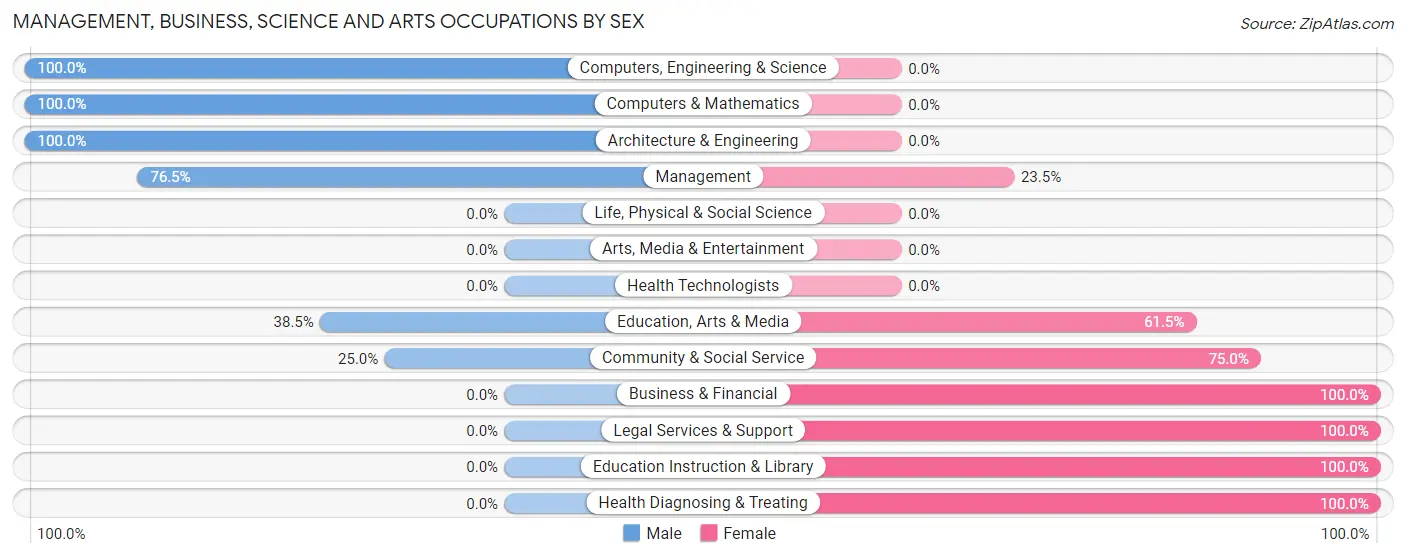
| Occupation | Male | Female |
| Management | 13 (76.5%) | 4 (23.5%) |
| Business & Financial | 0 (0.0%) | 3 (100.0%) |
| Computers, Engineering & Science | 7 (100.0%) | 0 (0.0%) |
| Computers & Mathematics | 6 (100.0%) | 0 (0.0%) |
| Architecture & Engineering | 1 (100.0%) | 0 (0.0%) |
| Life, Physical & Social Science | 0 (0.0%) | 0 (0.0%) |
| Community & Social Service | 10 (25.0%) | 30 (75.0%) |
| Education, Arts & Media | 10 (38.5%) | 16 (61.5%) |
| Legal Services & Support | 0 (0.0%) | 6 (100.0%) |
| Education Instruction & Library | 0 (0.0%) | 8 (100.0%) |
| Arts, Media & Entertainment | 0 (0.0%) | 0 (0.0%) |
| Health Diagnosing & Treating | 0 (0.0%) | 3 (100.0%) |
| Health Technologists | 0 (0.0%) | 0 (0.0%) |
| Total (Category) | 30 (42.9%) | 40 (57.1%) |
| Total (Overall) | 77 (52.4%) | 70 (47.6%) |
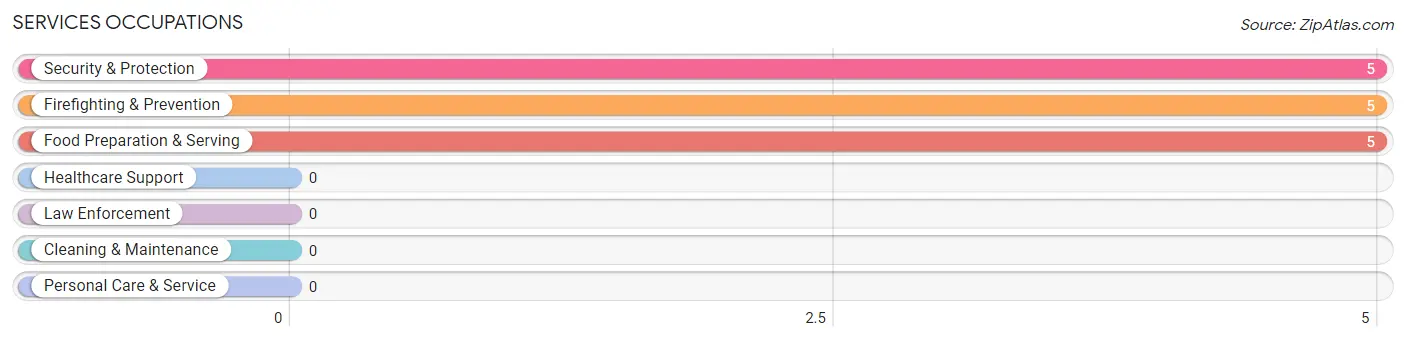
Services Occupations
The most common Services occupations in Albion are Security & Protection (5 | 3.4%), Firefighting & Prevention (5 | 3.4%), and Food Preparation & Serving (5 | 3.4%).
Services Occupations by Sex
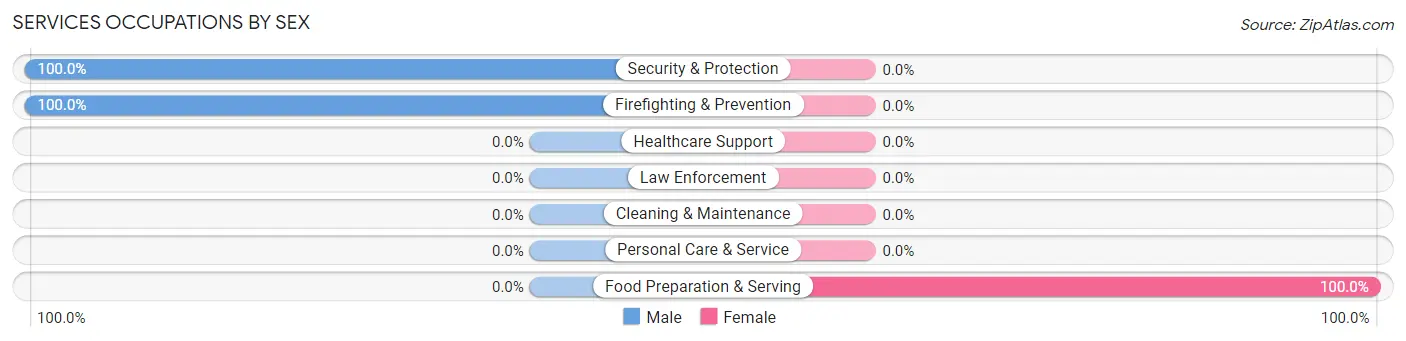
| Occupation | Male | Female |
| Healthcare Support | 0 (0.0%) | 0 (0.0%) |
| Security & Protection | 5 (100.0%) | 0 (0.0%) |
| Firefighting & Prevention | 5 (100.0%) | 0 (0.0%) |
| Law Enforcement | 0 (0.0%) | 0 (0.0%) |
| Food Preparation & Serving | 0 (0.0%) | 5 (100.0%) |
| Cleaning & Maintenance | 0 (0.0%) | 0 (0.0%) |
| Personal Care & Service | 0 (0.0%) | 0 (0.0%) |
| Total (Category) | 5 (50.0%) | 5 (50.0%) |
| Total (Overall) | 77 (52.4%) | 70 (47.6%) |
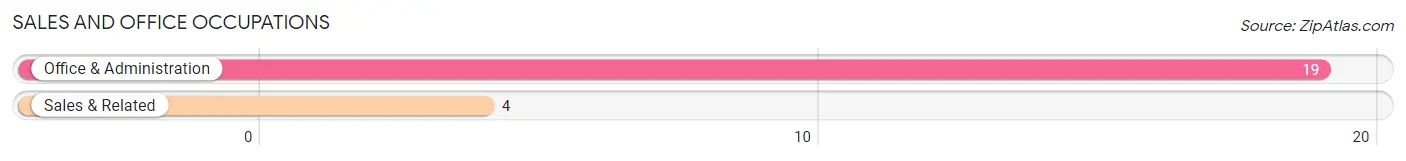
Sales and Office Occupations
The most common Sales and Office occupations in Albion are Office & Administration (19 | 12.9%), and Sales & Related (4 | 2.7%).
Sales and Office Occupations by Sex
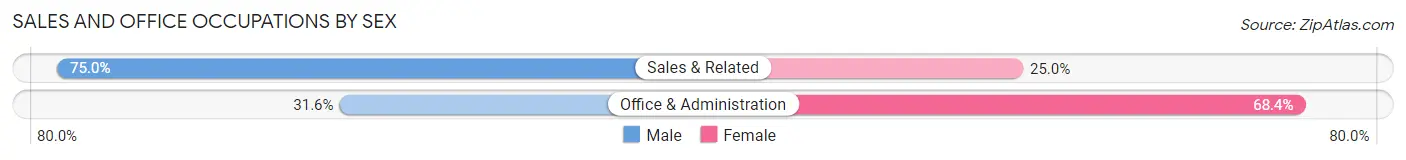
| Occupation | Male | Female |
| Sales & Related | 3 (75.0%) | 1 (25.0%) |
| Office & Administration | 6 (31.6%) | 13 (68.4%) |
| Total (Category) | 9 (39.1%) | 14 (60.9%) |
| Total (Overall) | 77 (52.4%) | 70 (47.6%) |
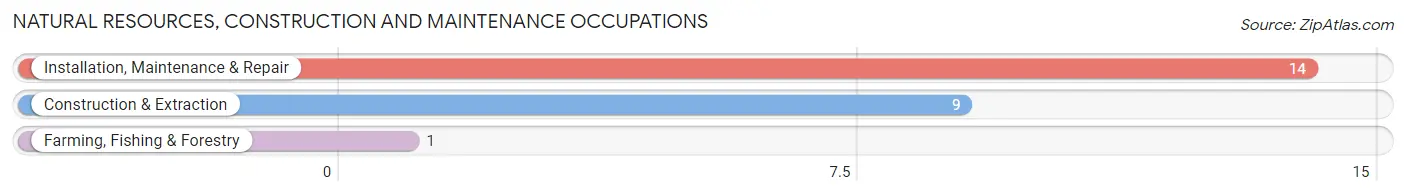
Natural Resources, Construction and Maintenance Occupations
The most common Natural Resources, Construction and Maintenance occupations in Albion are Installation, Maintenance & Repair (14 | 9.5%), Construction & Extraction (9 | 6.1%), and Farming, Fishing & Forestry (1 | 0.7%).
Natural Resources, Construction and Maintenance Occupations by Sex
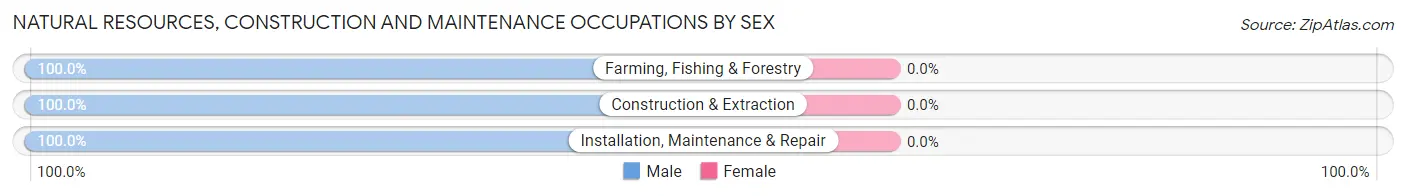
| Occupation | Male | Female |
| Farming, Fishing & Forestry | 1 (100.0%) | 0 (0.0%) |
| Construction & Extraction | 9 (100.0%) | 0 (0.0%) |
| Installation, Maintenance & Repair | 14 (100.0%) | 0 (0.0%) |
| Total (Category) | 24 (100.0%) | 0 (0.0%) |
| Total (Overall) | 77 (52.4%) | 70 (47.6%) |
Production, Transportation and Moving Occupations
The most common Production, Transportation and Moving occupations in Albion are Material Moving (19 | 12.9%), and Production (1 | 0.7%).
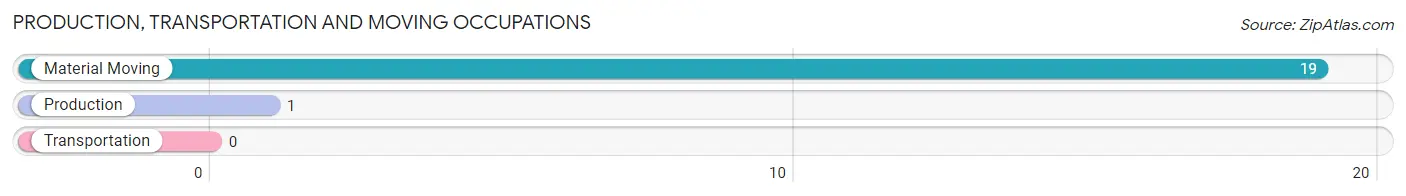
Production, Transportation and Moving Occupations by Sex
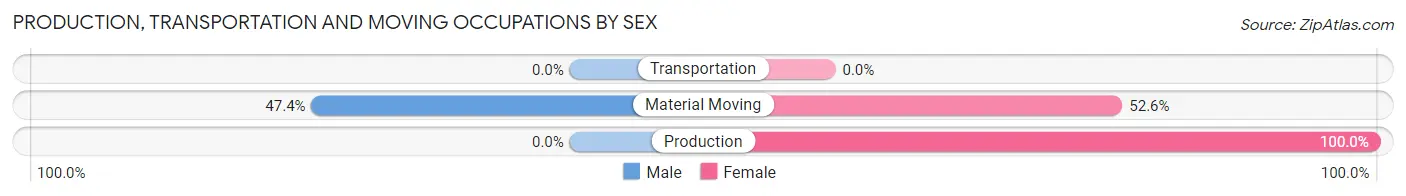
| Occupation | Male | Female |
| Production | 0 (0.0%) | 1 (100.0%) |
| Transportation | 0 (0.0%) | 0 (0.0%) |
| Material Moving | 9 (47.4%) | 10 (52.6%) |
| Total (Category) | 9 (45.0%) | 11 (55.0%) |
| Total (Overall) | 77 (52.4%) | 70 (47.6%) |
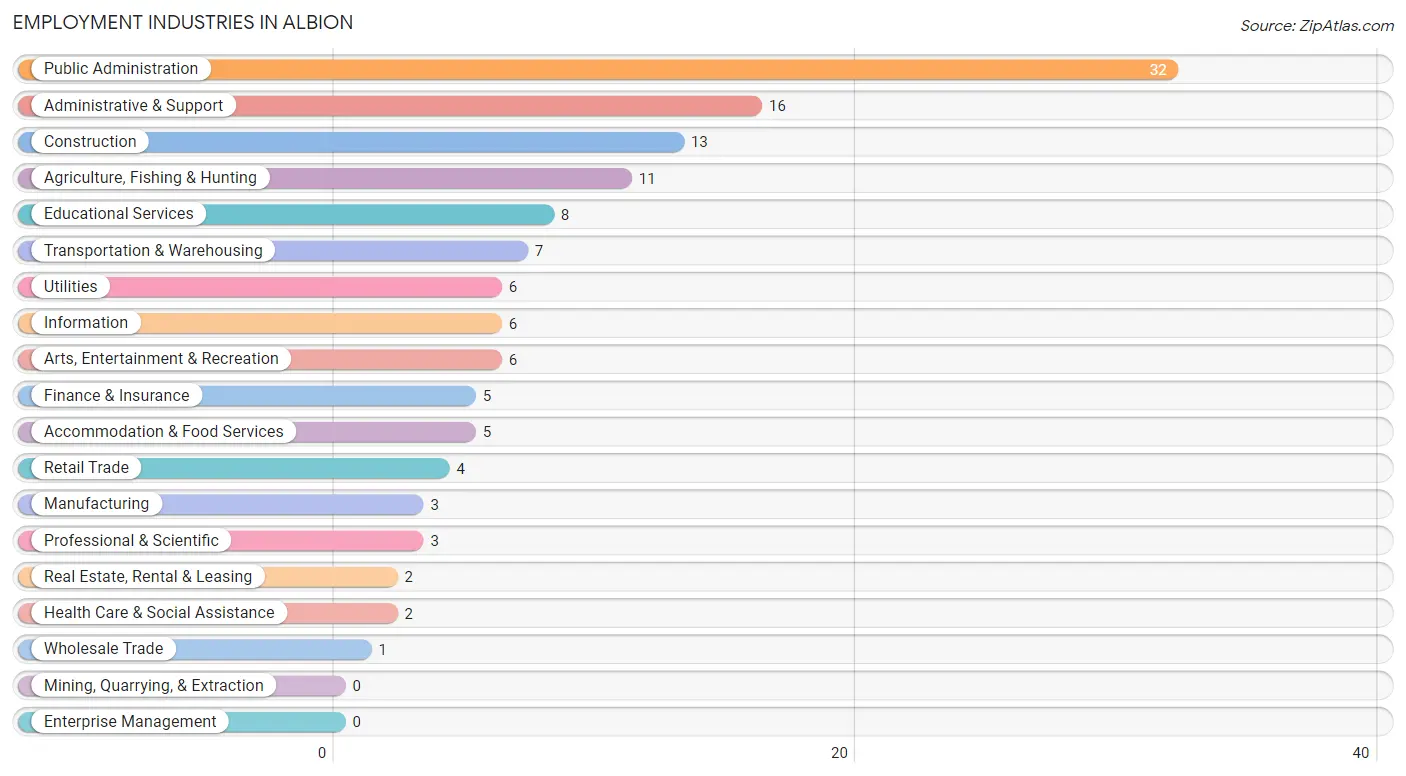
Employment Industries by Sex in Albion
Employment Industries in Albion
The major employment industries in Albion include Public Administration (32 | 21.8%), Administrative & Support (16 | 10.9%), Construction (13 | 8.8%), Agriculture, Fishing & Hunting (11 | 7.5%), and Educational Services (8 | 5.4%).
Employment Industries by Sex in Albion
The Albion industries that see more men than women are Agriculture, Fishing & Hunting (100.0%), Construction (100.0%), and Manufacturing (100.0%), whereas the industries that tend to have a higher number of women are Retail Trade (100.0%), Finance & Insurance (100.0%), and Administrative & Support (100.0%).
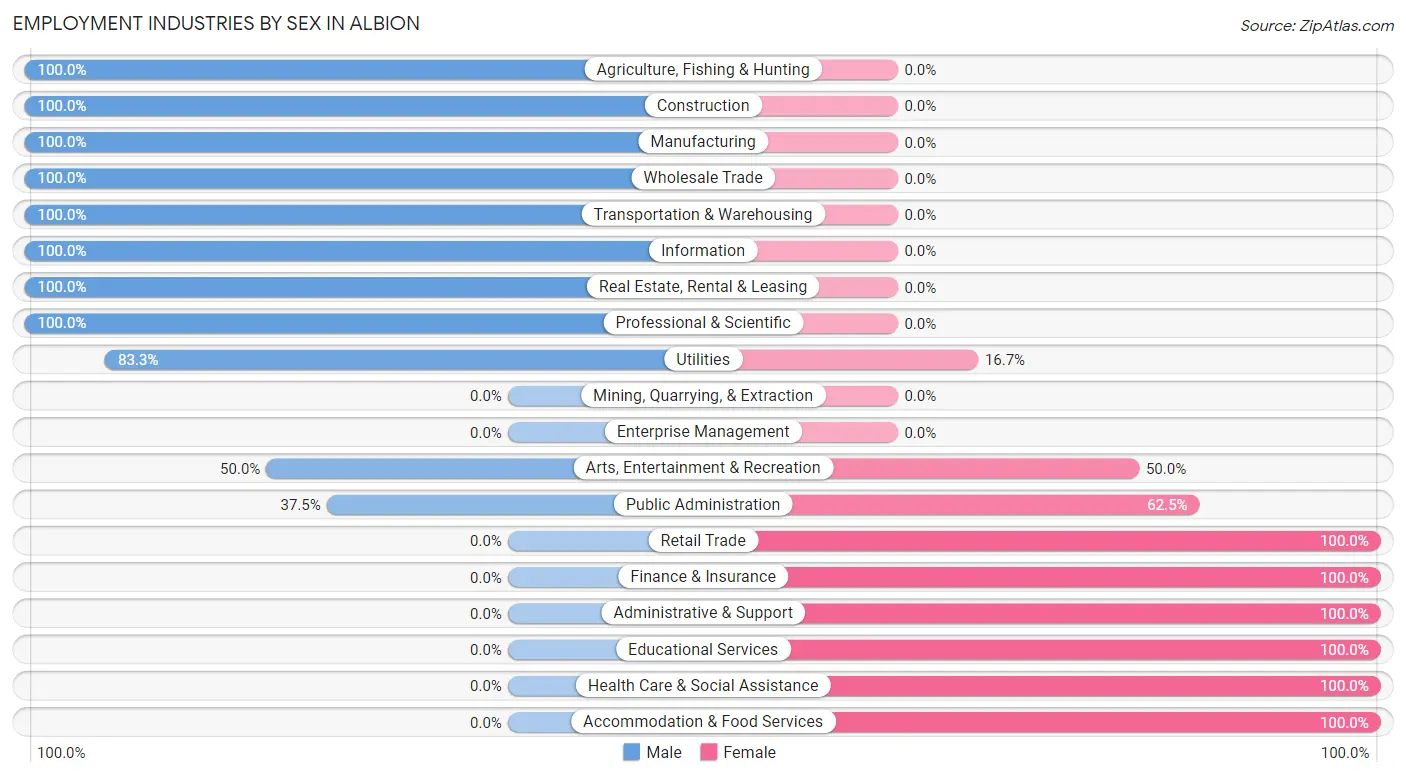
| Industry | Male | Female |
| Agriculture, Fishing & Hunting | 11 (100.0%) | 0 (0.0%) |
| Mining, Quarrying, & Extraction | 0 (0.0%) | 0 (0.0%) |
| Construction | 13 (100.0%) | 0 (0.0%) |
| Manufacturing | 3 (100.0%) | 0 (0.0%) |
| Wholesale Trade | 1 (100.0%) | 0 (0.0%) |
| Retail Trade | 0 (0.0%) | 4 (100.0%) |
| Transportation & Warehousing | 7 (100.0%) | 0 (0.0%) |
| Utilities | 5 (83.3%) | 1 (16.7%) |
| Information | 6 (100.0%) | 0 (0.0%) |
| Finance & Insurance | 0 (0.0%) | 5 (100.0%) |
| Real Estate, Rental & Leasing | 2 (100.0%) | 0 (0.0%) |
| Professional & Scientific | 3 (100.0%) | 0 (0.0%) |
| Enterprise Management | 0 (0.0%) | 0 (0.0%) |
| Administrative & Support | 0 (0.0%) | 16 (100.0%) |
| Educational Services | 0 (0.0%) | 8 (100.0%) |
| Health Care & Social Assistance | 0 (0.0%) | 2 (100.0%) |
| Arts, Entertainment & Recreation | 3 (50.0%) | 3 (50.0%) |
| Accommodation & Food Services | 0 (0.0%) | 5 (100.0%) |
| Public Administration | 12 (37.5%) | 20 (62.5%) |
| Total | 77 (52.4%) | 70 (47.6%) |
Education in Albion
School Enrollment in Albion
The most common levels of schooling among the 79 students in Albion are elementary school (38 | 48.1%), nursery / preschool (10 | 12.7%), and college / undergraduate (10 | 12.7%).
| School Level | # Students | % Students |
| Nursery / Preschool | 10 | 12.7% |
| Kindergarten | 9 | 11.4% |
| Elementary School | 38 | 48.1% |
| Middle School | 9 | 11.4% |
| High School | 3 | 3.8% |
| College / Undergraduate | 10 | 12.7% |
| Graduate / Professional | 0 | 0.0% |
| Total | 79 | 100.0% |
School Enrollment by Age by Funding Source in Albion
Out of a total of 79 students who are enrolled in schools in Albion, 36 (45.6%) attend a private institution, while the remaining 43 (54.4%) are enrolled in public schools. The age group of 15 to 17 year olds has the highest likelihood of being enrolled in private schools, with 3 (100.0% in the age bracket) enrolled. Conversely, the age group of 25 to 34 year olds has the lowest likelihood of being enrolled in a private school, with 4 (100.0% in the age bracket) attending a public institution.
| Age Bracket | Public School | Private School |
| 3 to 4 Year Olds | 1 (14.3%) | 6 (85.7%) |
| 5 to 9 Year Old | 25 (55.6%) | 20 (44.4%) |
| 10 to 14 Year Olds | 9 (64.3%) | 5 (35.7%) |
| 15 to 17 Year Olds | 0 (0.0%) | 3 (100.0%) |
| 18 to 19 Year Olds | 0 (0.0%) | 0 (0.0%) |
| 20 to 24 Year Olds | 0 (0.0%) | 0 (0.0%) |
| 25 to 34 Year Olds | 4 (100.0%) | 0 (0.0%) |
| 35 Years and over | 4 (66.7%) | 2 (33.3%) |
| Total | 43 (54.4%) | 36 (45.6%) |
Educational Attainment by Field of Study in Albion
Education (27 | 41.5%), business (7 | 10.8%), arts & humanities (7 | 10.8%), liberal arts & history (6 | 9.2%), and bio, nature & agricultural (5 | 7.7%) are the most common fields of study among 65 individuals in Albion who have obtained a bachelor's degree or higher.
| Field of Study | # Graduates | % Graduates |
| Computers & Mathematics | 1 | 1.5% |
| Bio, Nature & Agricultural | 5 | 7.7% |
| Physical & Health Sciences | 0 | 0.0% |
| Psychology | 4 | 6.1% |
| Social Sciences | 0 | 0.0% |
| Engineering | 0 | 0.0% |
| Multidisciplinary Studies | 2 | 3.1% |
| Science & Technology | 5 | 7.7% |
| Business | 7 | 10.8% |
| Education | 27 | 41.5% |
| Literature & Languages | 0 | 0.0% |
| Liberal Arts & History | 6 | 9.2% |
| Visual & Performing Arts | 0 | 0.0% |
| Communications | 1 | 1.5% |
| Arts & Humanities | 7 | 10.8% |
| Total | 65 | 100.0% |
Transportation & Commute in Albion
Vehicle Availability by Sex in Albion
The most prevalent vehicle ownership categories in Albion are males with 3 vehicles (35, accounting for 45.5%) and females with 3 vehicles (30, making up 50.0%).
| Vehicles Available | Male | Female |
| No Vehicle | 0 (0.0%) | 0 (0.0%) |
| 1 Vehicle | 5 (6.5%) | 7 (10.0%) |
| 2 Vehicles | 34 (44.2%) | 33 (47.1%) |
| 3 Vehicles | 35 (45.5%) | 30 (42.9%) |
| 4 Vehicles | 0 (0.0%) | 0 (0.0%) |
| 5 or more Vehicles | 3 (3.9%) | 0 (0.0%) |
| Total | 77 (100.0%) | 70 (100.0%) |
Commute Time in Albion
The most frequently occuring commute durations in Albion are 25 to 29 minutes (38 commuters, 29.2%), 30 to 34 minutes (38 commuters, 29.2%), and 10 to 14 minutes (16 commuters, 12.3%).
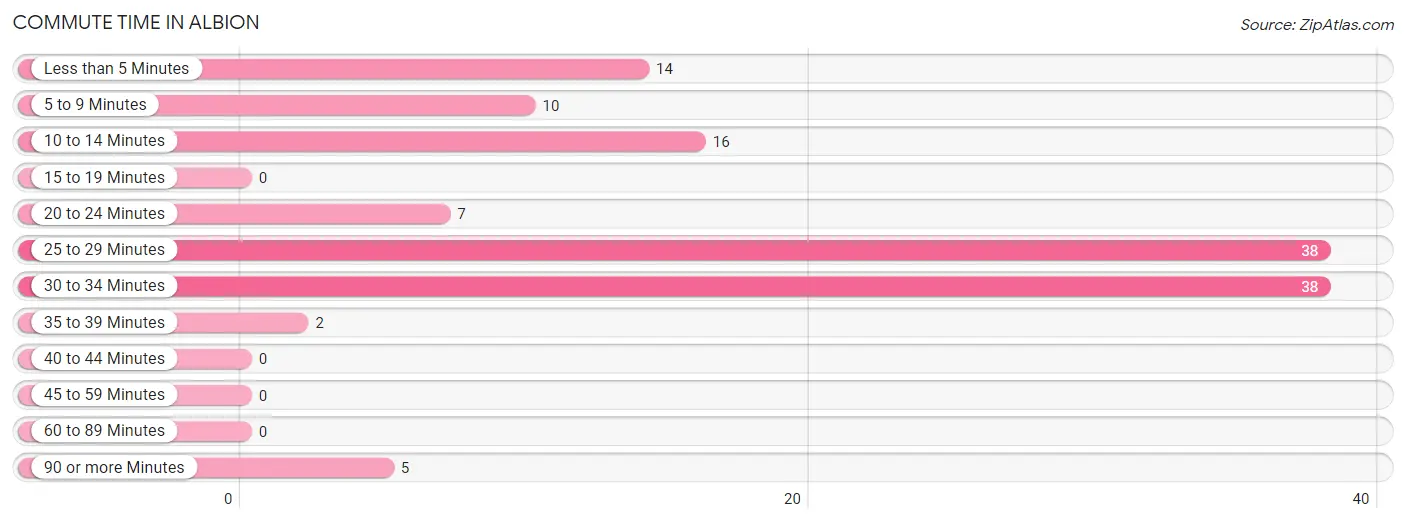
| Commute Time | # Commuters | % Commuters |
| Less than 5 Minutes | 14 | 10.8% |
| 5 to 9 Minutes | 10 | 7.7% |
| 10 to 14 Minutes | 16 | 12.3% |
| 15 to 19 Minutes | 0 | 0.0% |
| 20 to 24 Minutes | 7 | 5.4% |
| 25 to 29 Minutes | 38 | 29.2% |
| 30 to 34 Minutes | 38 | 29.2% |
| 35 to 39 Minutes | 2 | 1.5% |
| 40 to 44 Minutes | 0 | 0.0% |
| 45 to 59 Minutes | 0 | 0.0% |
| 60 to 89 Minutes | 0 | 0.0% |
| 90 or more Minutes | 5 | 3.8% |
Commute Time by Sex in Albion
The most common commute times in Albion are 30 to 34 minutes (36 commuters, 50.7%) for males and 25 to 29 minutes (25 commuters, 42.4%) for females.
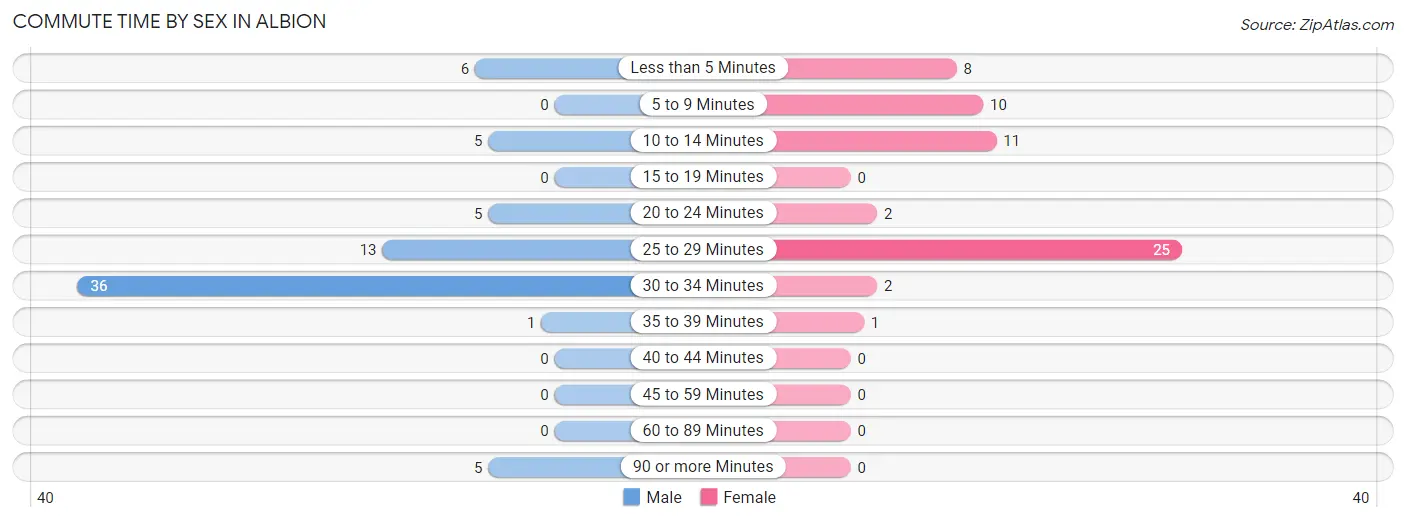
| Commute Time | Male | Female |
| Less than 5 Minutes | 6 (8.5%) | 8 (13.6%) |
| 5 to 9 Minutes | 0 (0.0%) | 10 (17.0%) |
| 10 to 14 Minutes | 5 (7.0%) | 11 (18.6%) |
| 15 to 19 Minutes | 0 (0.0%) | 0 (0.0%) |
| 20 to 24 Minutes | 5 (7.0%) | 2 (3.4%) |
| 25 to 29 Minutes | 13 (18.3%) | 25 (42.4%) |
| 30 to 34 Minutes | 36 (50.7%) | 2 (3.4%) |
| 35 to 39 Minutes | 1 (1.4%) | 1 (1.7%) |
| 40 to 44 Minutes | 0 (0.0%) | 0 (0.0%) |
| 45 to 59 Minutes | 0 (0.0%) | 0 (0.0%) |
| 60 to 89 Minutes | 0 (0.0%) | 0 (0.0%) |
| 90 or more Minutes | 5 (7.0%) | 0 (0.0%) |
Time of Departure to Work by Sex in Albion
The most frequent times of departure to work in Albion are 7:00 AM to 7:29 AM (23, 32.4%) for males and 5:00 AM to 5:29 AM (13, 22.0%) for females.
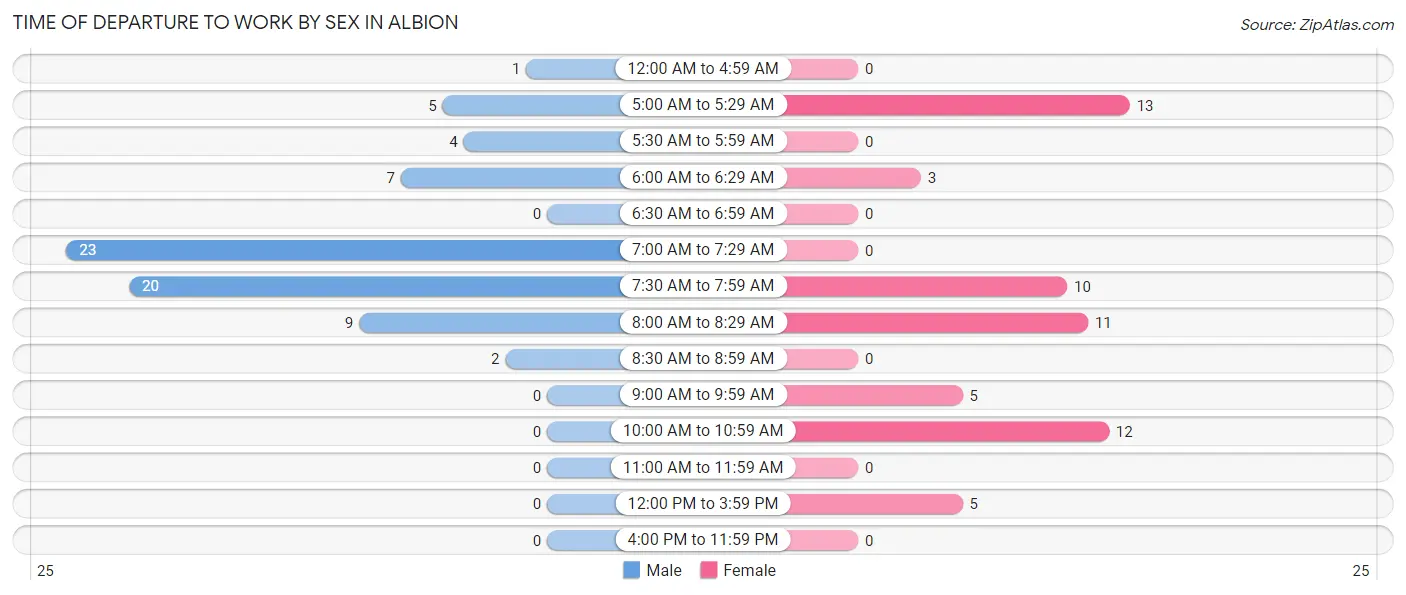
| Time of Departure | Male | Female |
| 12:00 AM to 4:59 AM | 1 (1.4%) | 0 (0.0%) |
| 5:00 AM to 5:29 AM | 5 (7.0%) | 13 (22.0%) |
| 5:30 AM to 5:59 AM | 4 (5.6%) | 0 (0.0%) |
| 6:00 AM to 6:29 AM | 7 (9.9%) | 3 (5.1%) |
| 6:30 AM to 6:59 AM | 0 (0.0%) | 0 (0.0%) |
| 7:00 AM to 7:29 AM | 23 (32.4%) | 0 (0.0%) |
| 7:30 AM to 7:59 AM | 20 (28.2%) | 10 (17.0%) |
| 8:00 AM to 8:29 AM | 9 (12.7%) | 11 (18.6%) |
| 8:30 AM to 8:59 AM | 2 (2.8%) | 0 (0.0%) |
| 9:00 AM to 9:59 AM | 0 (0.0%) | 5 (8.5%) |
| 10:00 AM to 10:59 AM | 0 (0.0%) | 12 (20.3%) |
| 11:00 AM to 11:59 AM | 0 (0.0%) | 0 (0.0%) |
| 12:00 PM to 3:59 PM | 0 (0.0%) | 5 (8.5%) |
| 4:00 PM to 11:59 PM | 0 (0.0%) | 0 (0.0%) |
| Total | 71 (100.0%) | 59 (100.0%) |
Housing Occupancy in Albion
Occupancy by Ownership in Albion
Of the total 145 dwellings in Albion, owner-occupied units account for 120 (82.8%), while renter-occupied units make up 25 (17.2%).
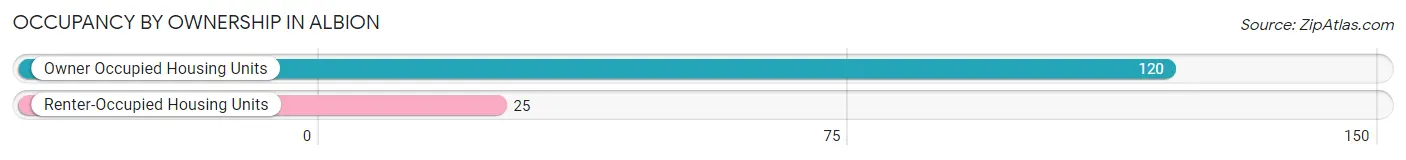
| Occupancy | # Housing Units | % Housing Units |
| Owner Occupied Housing Units | 120 | 82.8% |
| Renter-Occupied Housing Units | 25 | 17.2% |
| Total Occupied Housing Units | 145 | 100.0% |
Occupancy by Household Size in Albion
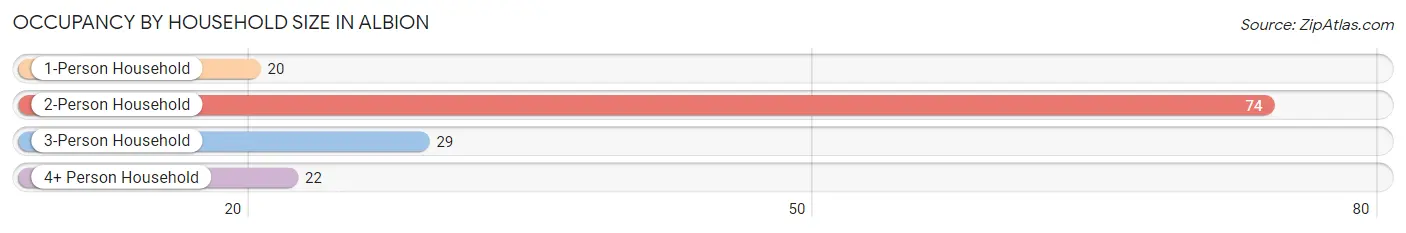
| Household Size | # Housing Units | % Housing Units |
| 1-Person Household | 20 | 13.8% |
| 2-Person Household | 74 | 51.0% |
| 3-Person Household | 29 | 20.0% |
| 4+ Person Household | 22 | 15.2% |
| Total Housing Units | 145 | 100.0% |
Occupancy by Ownership by Household Size in Albion
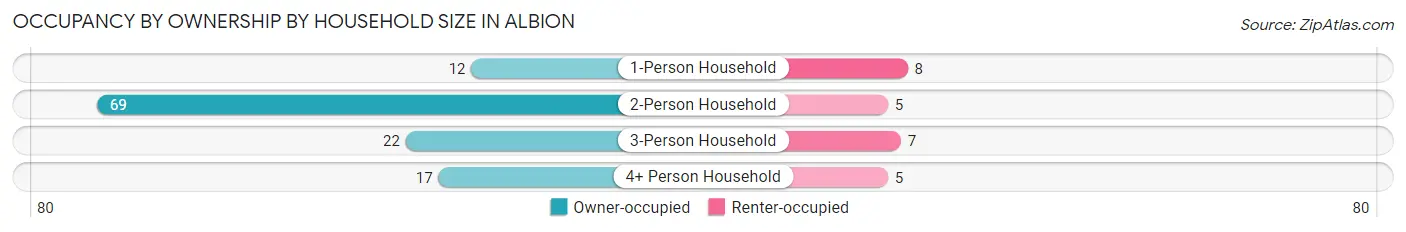
| Household Size | Owner-occupied | Renter-occupied |
| 1-Person Household | 12 (60.0%) | 8 (40.0%) |
| 2-Person Household | 69 (93.2%) | 5 (6.8%) |
| 3-Person Household | 22 (75.9%) | 7 (24.1%) |
| 4+ Person Household | 17 (77.3%) | 5 (22.7%) |
| Total Housing Units | 120 (82.8%) | 25 (17.2%) |
Occupancy by Educational Attainment in Albion
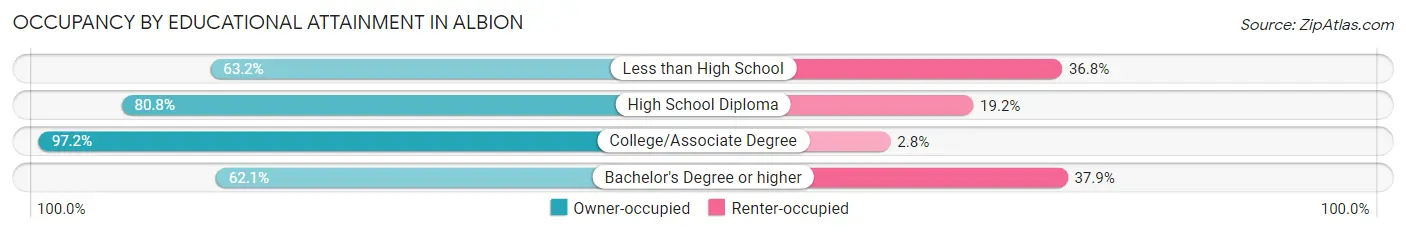
| Household Size | Owner-occupied | Renter-occupied |
| Less than High School | 12 (63.2%) | 7 (36.8%) |
| High School Diploma | 21 (80.8%) | 5 (19.2%) |
| College/Associate Degree | 69 (97.2%) | 2 (2.8%) |
| Bachelor's Degree or higher | 18 (62.1%) | 11 (37.9%) |
Occupancy by Age of Householder in Albion
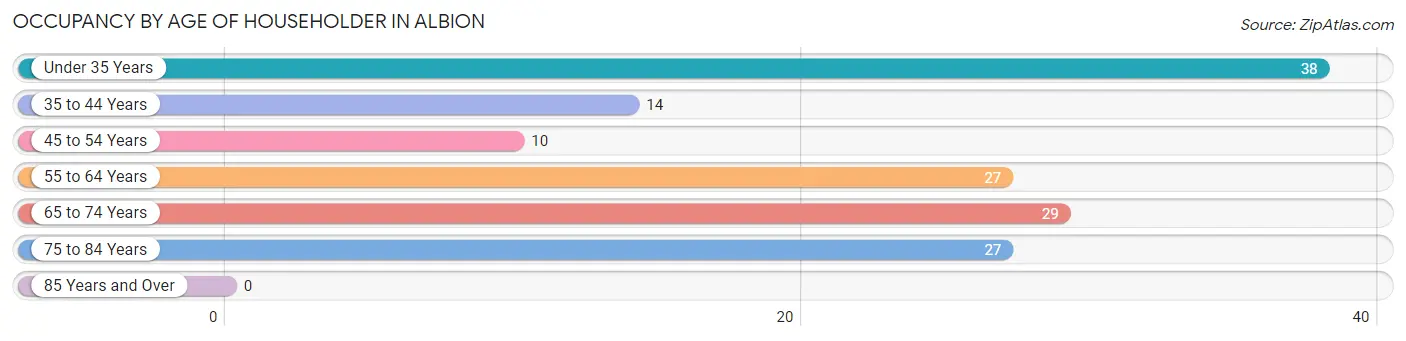
| Age Bracket | # Households | % Households |
| Under 35 Years | 38 | 26.2% |
| 35 to 44 Years | 14 | 9.7% |
| 45 to 54 Years | 10 | 6.9% |
| 55 to 64 Years | 27 | 18.6% |
| 65 to 74 Years | 29 | 20.0% |
| 75 to 84 Years | 27 | 18.6% |
| 85 Years and Over | 0 | 0.0% |
| Total | 145 | 100.0% |
Housing Finances in Albion
Median Income by Occupancy in Albion
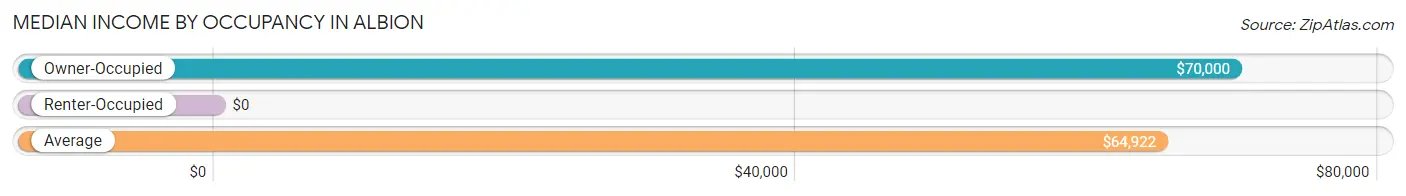
| Occupancy Type | # Households | Median Income |
| Owner-Occupied | 120 (82.8%) | $70,000 |
| Renter-Occupied | 25 (17.2%) | $0 |
| Average | 145 (100.0%) | $64,922 |
Occupancy by Householder Income Bracket in Albion
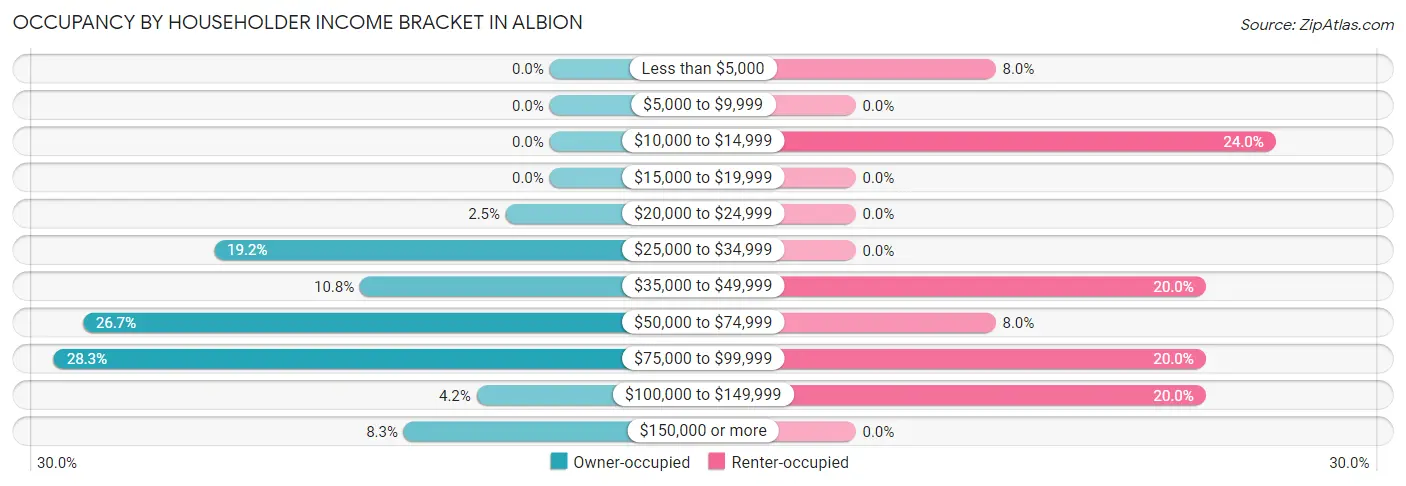
| Income Bracket | Owner-occupied | Renter-occupied |
| Less than $5,000 | 0 (0.0%) | 2 (8.0%) |
| $5,000 to $9,999 | 0 (0.0%) | 0 (0.0%) |
| $10,000 to $14,999 | 0 (0.0%) | 6 (24.0%) |
| $15,000 to $19,999 | 0 (0.0%) | 0 (0.0%) |
| $20,000 to $24,999 | 3 (2.5%) | 0 (0.0%) |
| $25,000 to $34,999 | 23 (19.2%) | 0 (0.0%) |
| $35,000 to $49,999 | 13 (10.8%) | 5 (20.0%) |
| $50,000 to $74,999 | 32 (26.7%) | 2 (8.0%) |
| $75,000 to $99,999 | 34 (28.3%) | 5 (20.0%) |
| $100,000 to $149,999 | 5 (4.2%) | 5 (20.0%) |
| $150,000 or more | 10 (8.3%) | 0 (0.0%) |
| Total | 120 (100.0%) | 25 (100.0%) |
Monthly Housing Cost Tiers in Albion
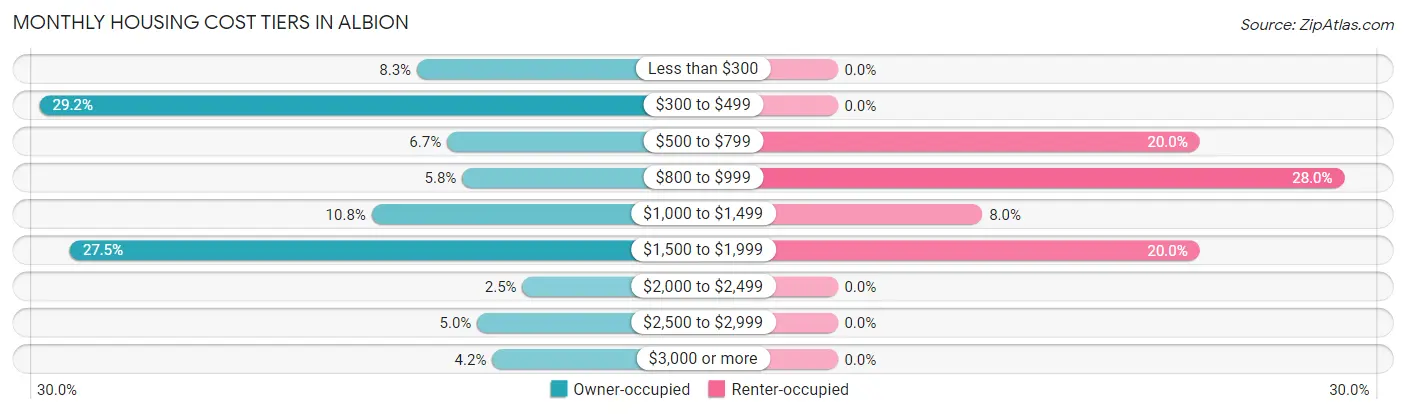
| Monthly Cost | Owner-occupied | Renter-occupied |
| Less than $300 | 10 (8.3%) | 0 (0.0%) |
| $300 to $499 | 35 (29.2%) | 0 (0.0%) |
| $500 to $799 | 8 (6.7%) | 5 (20.0%) |
| $800 to $999 | 7 (5.8%) | 7 (28.0%) |
| $1,000 to $1,499 | 13 (10.8%) | 2 (8.0%) |
| $1,500 to $1,999 | 33 (27.5%) | 5 (20.0%) |
| $2,000 to $2,499 | 3 (2.5%) | 0 (0.0%) |
| $2,500 to $2,999 | 6 (5.0%) | 0 (0.0%) |
| $3,000 or more | 5 (4.2%) | 0 (0.0%) |
| Total | 120 (100.0%) | 25 (100.0%) |
Physical Housing Characteristics in Albion
Housing Structures in Albion
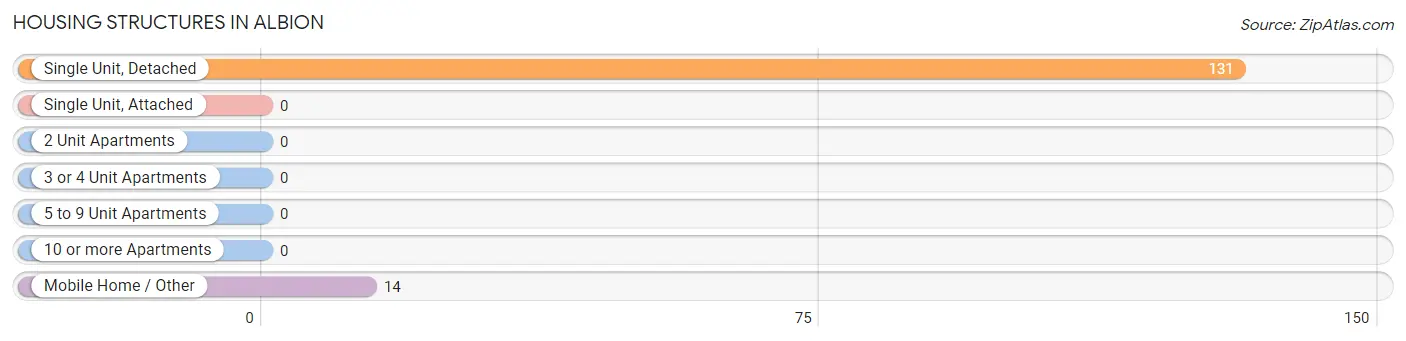
| Structure Type | # Housing Units | % Housing Units |
| Single Unit, Detached | 131 | 90.3% |
| Single Unit, Attached | 0 | 0.0% |
| 2 Unit Apartments | 0 | 0.0% |
| 3 or 4 Unit Apartments | 0 | 0.0% |
| 5 to 9 Unit Apartments | 0 | 0.0% |
| 10 or more Apartments | 0 | 0.0% |
| Mobile Home / Other | 14 | 9.7% |
| Total | 145 | 100.0% |
Housing Structures by Occupancy in Albion
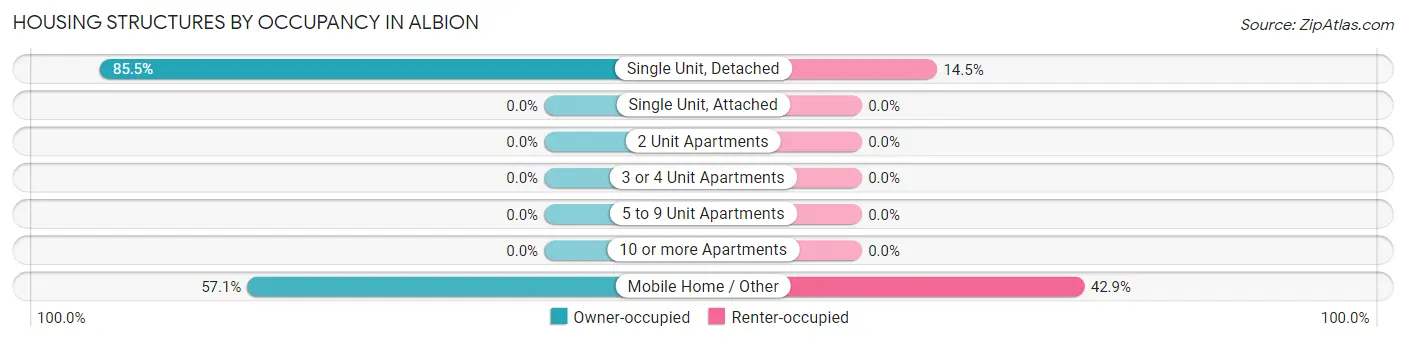
| Structure Type | Owner-occupied | Renter-occupied |
| Single Unit, Detached | 112 (85.5%) | 19 (14.5%) |
| Single Unit, Attached | 0 (0.0%) | 0 (0.0%) |
| 2 Unit Apartments | 0 (0.0%) | 0 (0.0%) |
| 3 or 4 Unit Apartments | 0 (0.0%) | 0 (0.0%) |
| 5 to 9 Unit Apartments | 0 (0.0%) | 0 (0.0%) |
| 10 or more Apartments | 0 (0.0%) | 0 (0.0%) |
| Mobile Home / Other | 8 (57.1%) | 6 (42.9%) |
| Total | 120 (82.8%) | 25 (17.2%) |
Housing Structures by Number of Rooms in Albion
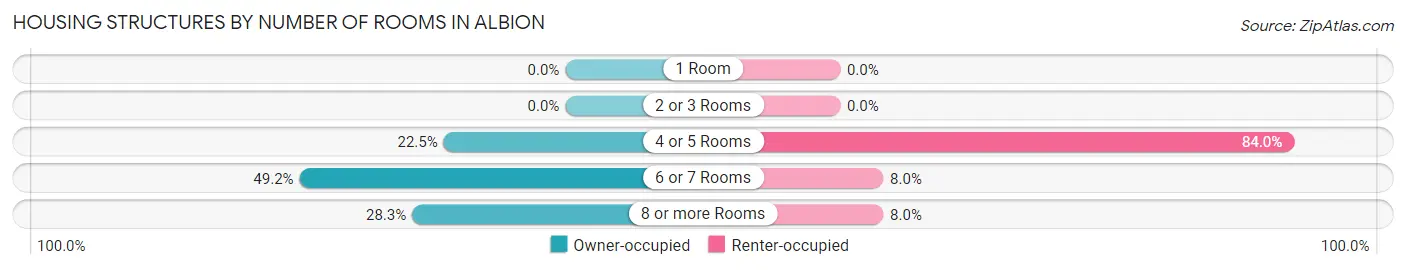
| Number of Rooms | Owner-occupied | Renter-occupied |
| 1 Room | 0 (0.0%) | 0 (0.0%) |
| 2 or 3 Rooms | 0 (0.0%) | 0 (0.0%) |
| 4 or 5 Rooms | 27 (22.5%) | 21 (84.0%) |
| 6 or 7 Rooms | 59 (49.2%) | 2 (8.0%) |
| 8 or more Rooms | 34 (28.3%) | 2 (8.0%) |
| Total | 120 (100.0%) | 25 (100.0%) |
Housing Structure by Heating Type in Albion
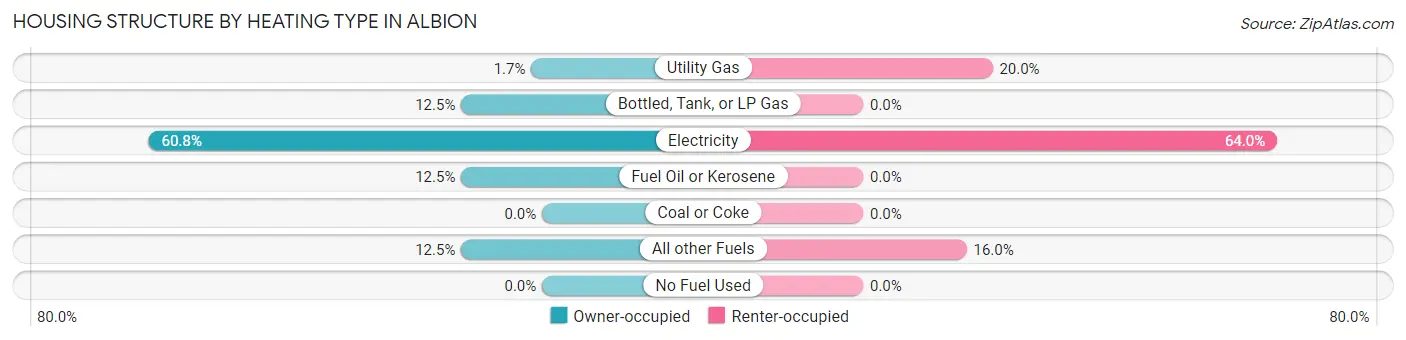
| Heating Type | Owner-occupied | Renter-occupied |
| Utility Gas | 2 (1.7%) | 5 (20.0%) |
| Bottled, Tank, or LP Gas | 15 (12.5%) | 0 (0.0%) |
| Electricity | 73 (60.8%) | 16 (64.0%) |
| Fuel Oil or Kerosene | 15 (12.5%) | 0 (0.0%) |
| Coal or Coke | 0 (0.0%) | 0 (0.0%) |
| All other Fuels | 15 (12.5%) | 4 (16.0%) |
| No Fuel Used | 0 (0.0%) | 0 (0.0%) |
| Total | 120 (100.0%) | 25 (100.0%) |
Household Vehicle Usage in Albion
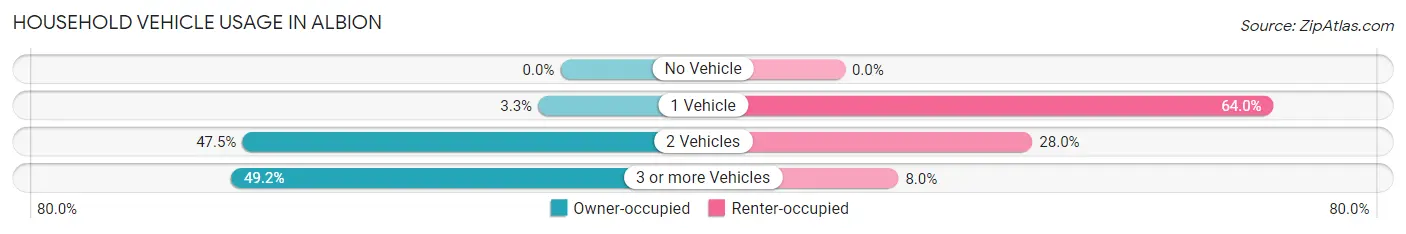
| Vehicles per Household | Owner-occupied | Renter-occupied |
| No Vehicle | 0 (0.0%) | 0 (0.0%) |
| 1 Vehicle | 4 (3.3%) | 16 (64.0%) |
| 2 Vehicles | 57 (47.5%) | 7 (28.0%) |
| 3 or more Vehicles | 59 (49.2%) | 2 (8.0%) |
| Total | 120 (100.0%) | 25 (100.0%) |
Real Estate & Mortgages in Albion
Real Estate and Mortgage Overview in Albion
| Characteristic | Without Mortgage | With Mortgage |
| Housing Units | 53 | 67 |
| Median Property Value | $155,400 | $248,500 |
| Median Household Income | $36,528 | $6 |
| Monthly Housing Costs | $403 | $5 |
| Real Estate Taxes | $1,034 | $0 |
Property Value by Mortgage Status in Albion
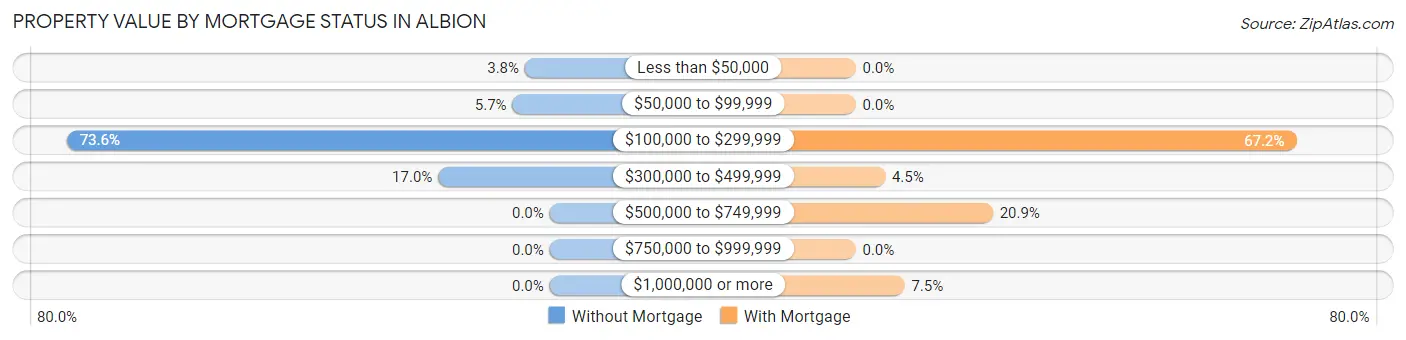
| Property Value | Without Mortgage | With Mortgage |
| Less than $50,000 | 2 (3.8%) | 0 (0.0%) |
| $50,000 to $99,999 | 3 (5.7%) | 0 (0.0%) |
| $100,000 to $299,999 | 39 (73.6%) | 45 (67.2%) |
| $300,000 to $499,999 | 9 (17.0%) | 3 (4.5%) |
| $500,000 to $749,999 | 0 (0.0%) | 14 (20.9%) |
| $750,000 to $999,999 | 0 (0.0%) | 0 (0.0%) |
| $1,000,000 or more | 0 (0.0%) | 5 (7.5%) |
| Total | 53 (100.0%) | 67 (100.0%) |
Household Income by Mortgage Status in Albion
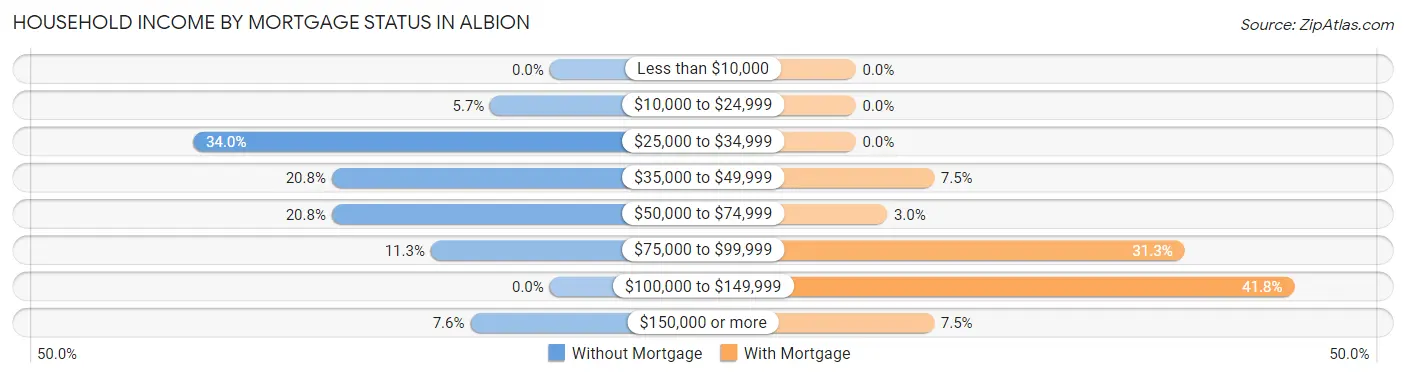
| Household Income | Without Mortgage | With Mortgage |
| Less than $10,000 | 0 (0.0%) | 0 (0.0%) |
| $10,000 to $24,999 | 3 (5.7%) | 0 (0.0%) |
| $25,000 to $34,999 | 18 (34.0%) | 0 (0.0%) |
| $35,000 to $49,999 | 11 (20.7%) | 5 (7.5%) |
| $50,000 to $74,999 | 11 (20.7%) | 2 (3.0%) |
| $75,000 to $99,999 | 6 (11.3%) | 21 (31.3%) |
| $100,000 to $149,999 | 0 (0.0%) | 28 (41.8%) |
| $150,000 or more | 4 (7.5%) | 5 (7.5%) |
| Total | 53 (100.0%) | 67 (100.0%) |
Property Value to Household Income Ratio in Albion
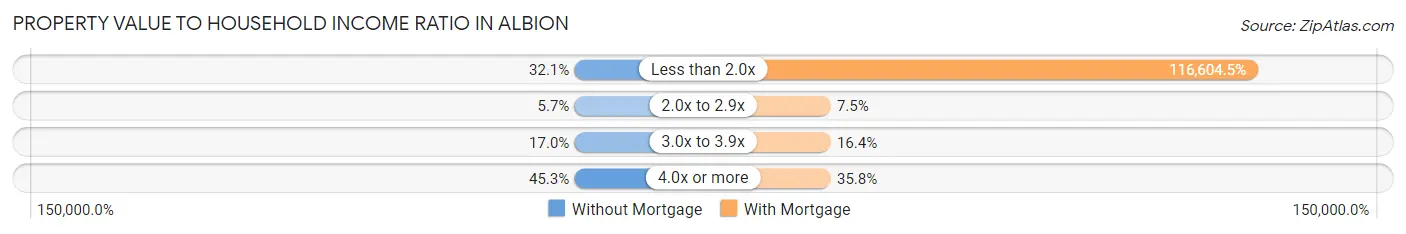
| Value-to-Income Ratio | Without Mortgage | With Mortgage |
| Less than 2.0x | 17 (32.1%) | 78,125 (116,604.5%) |
| 2.0x to 2.9x | 3 (5.7%) | 5 (7.5%) |
| 3.0x to 3.9x | 9 (17.0%) | 11 (16.4%) |
| 4.0x or more | 24 (45.3%) | 24 (35.8%) |
| Total | 53 (100.0%) | 67 (100.0%) |
Real Estate Taxes by Mortgage Status in Albion
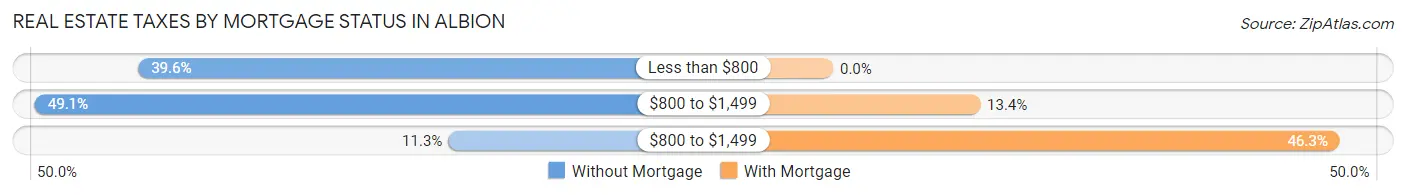
| Property Taxes | Without Mortgage | With Mortgage |
| Less than $800 | 21 (39.6%) | 0 (0.0%) |
| $800 to $1,499 | 26 (49.1%) | 9 (13.4%) |
| $800 to $1,499 | 6 (11.3%) | 31 (46.3%) |
| Total | 53 (100.0%) | 67 (100.0%) |
Health & Disability in Albion
Health Insurance Coverage by Age in Albion
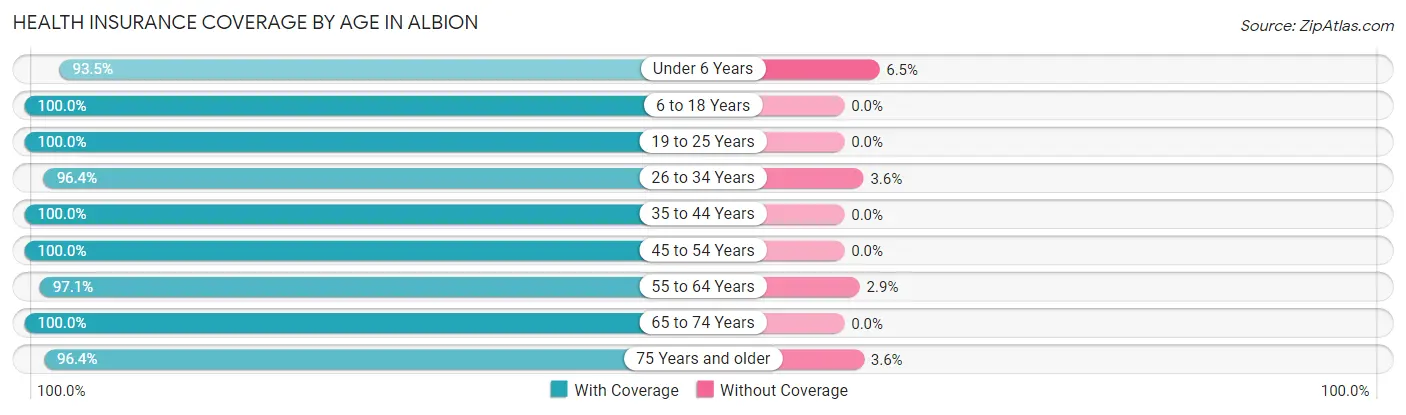
| Age Bracket | With Coverage | Without Coverage |
| Under 6 Years | 43 (93.5%) | 3 (6.5%) |
| 6 to 18 Years | 50 (100.0%) | 0 (0.0%) |
| 19 to 25 Years | 20 (100.0%) | 0 (0.0%) |
| 26 to 34 Years | 54 (96.4%) | 2 (3.6%) |
| 35 to 44 Years | 44 (100.0%) | 0 (0.0%) |
| 45 to 54 Years | 20 (100.0%) | 0 (0.0%) |
| 55 to 64 Years | 34 (97.1%) | 1 (2.9%) |
| 65 to 74 Years | 49 (100.0%) | 0 (0.0%) |
| 75 Years and older | 53 (96.4%) | 2 (3.6%) |
| Total | 367 (97.9%) | 8 (2.1%) |
Health Insurance Coverage by Citizenship Status in Albion
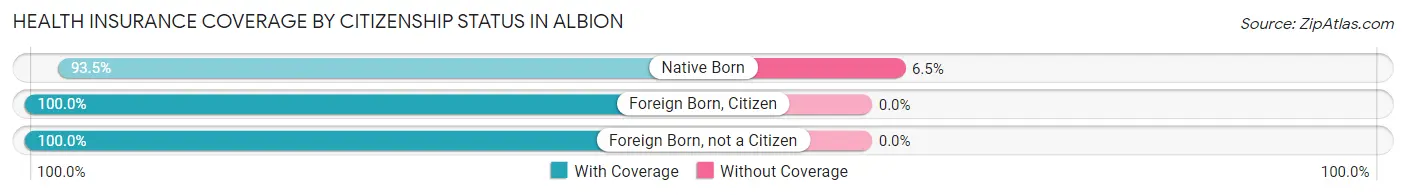
| Citizenship Status | With Coverage | Without Coverage |
| Native Born | 43 (93.5%) | 3 (6.5%) |
| Foreign Born, Citizen | 50 (100.0%) | 0 (0.0%) |
| Foreign Born, not a Citizen | 20 (100.0%) | 0 (0.0%) |
Health Insurance Coverage by Household Income in Albion
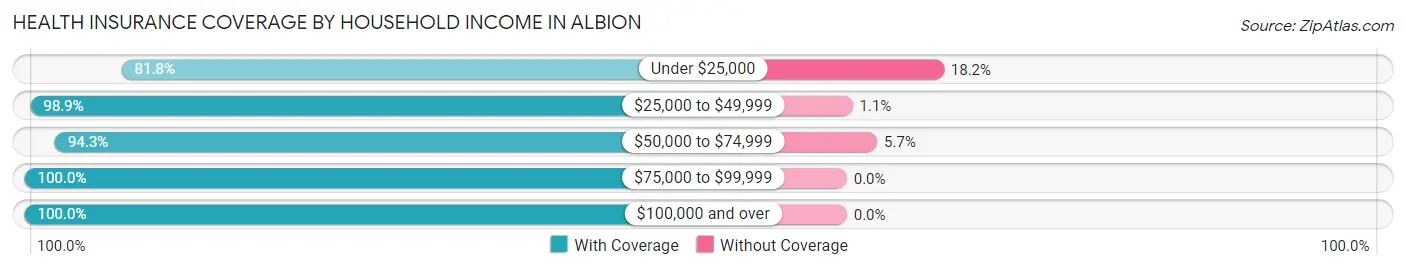
| Household Income | With Coverage | Without Coverage |
| Under $25,000 | 9 (81.8%) | 2 (18.2%) |
| $25,000 to $49,999 | 92 (98.9%) | 1 (1.1%) |
| $50,000 to $74,999 | 83 (94.3%) | 5 (5.7%) |
| $75,000 to $99,999 | 88 (100.0%) | 0 (0.0%) |
| $100,000 and over | 95 (100.0%) | 0 (0.0%) |
Public vs Private Health Insurance Coverage by Age in Albion
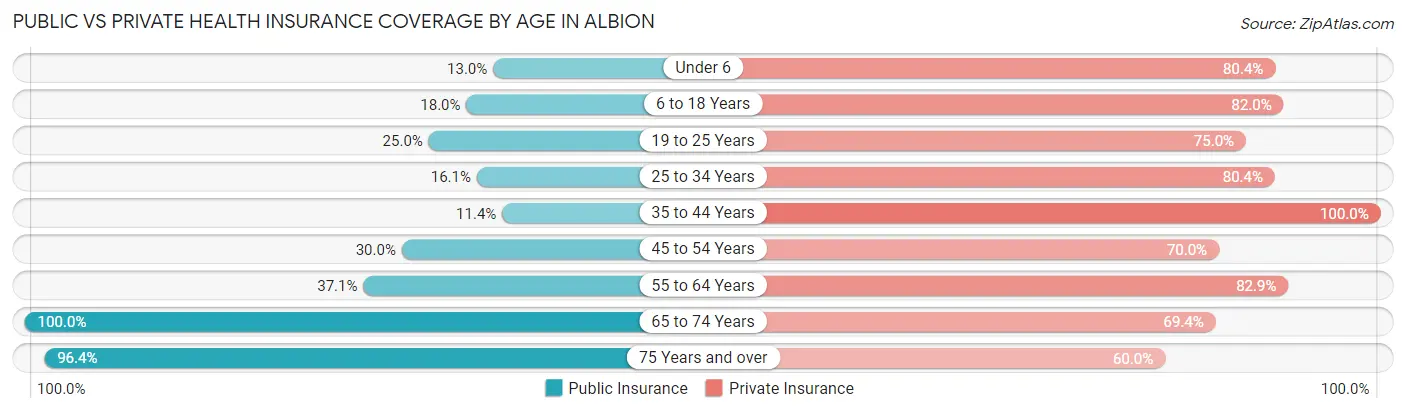
| Age Bracket | Public Insurance | Private Insurance |
| Under 6 | 6 (13.0%) | 37 (80.4%) |
| 6 to 18 Years | 9 (18.0%) | 41 (82.0%) |
| 19 to 25 Years | 5 (25.0%) | 15 (75.0%) |
| 25 to 34 Years | 9 (16.1%) | 45 (80.4%) |
| 35 to 44 Years | 5 (11.4%) | 44 (100.0%) |
| 45 to 54 Years | 6 (30.0%) | 14 (70.0%) |
| 55 to 64 Years | 13 (37.1%) | 29 (82.9%) |
| 65 to 74 Years | 49 (100.0%) | 34 (69.4%) |
| 75 Years and over | 53 (96.4%) | 33 (60.0%) |
| Total | 155 (41.3%) | 292 (77.9%) |
Disability Status by Sex by Age in Albion
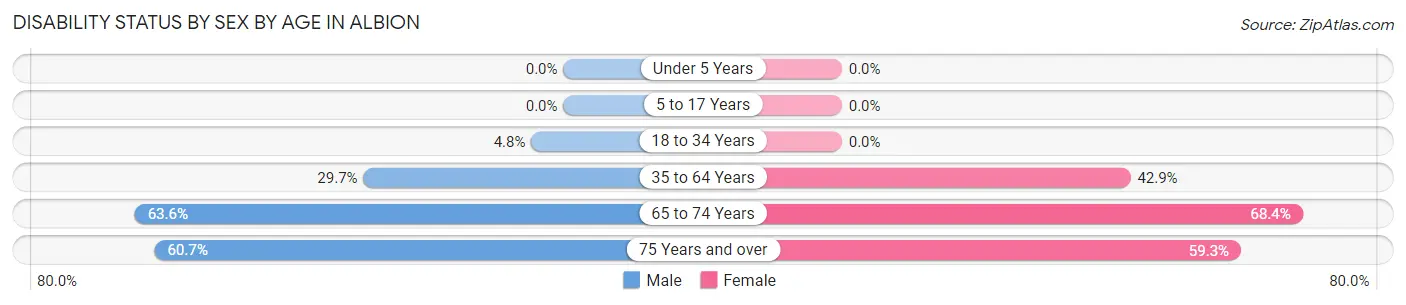
| Age Bracket | Male | Female |
| Under 5 Years | 0 (0.0%) | 0 (0.0%) |
| 5 to 17 Years | 0 (0.0%) | 0 (0.0%) |
| 18 to 34 Years | 2 (4.8%) | 0 (0.0%) |
| 35 to 64 Years | 19 (29.7%) | 15 (42.9%) |
| 65 to 74 Years | 7 (63.6%) | 26 (68.4%) |
| 75 Years and over | 17 (60.7%) | 16 (59.3%) |
Disability Class by Sex by Age in Albion
Disability Class: Hearing Difficulty
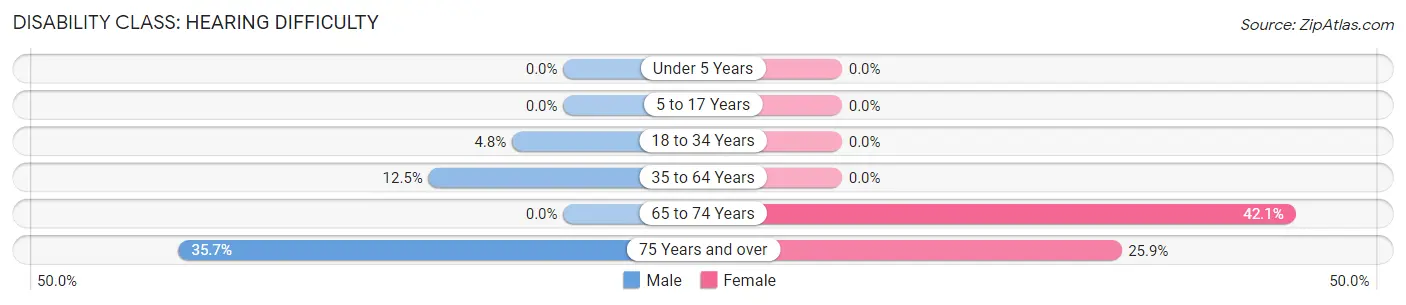
| Age Bracket | Male | Female |
| Under 5 Years | 0 (0.0%) | 0 (0.0%) |
| 5 to 17 Years | 0 (0.0%) | 0 (0.0%) |
| 18 to 34 Years | 2 (4.8%) | 0 (0.0%) |
| 35 to 64 Years | 8 (12.5%) | 0 (0.0%) |
| 65 to 74 Years | 0 (0.0%) | 16 (42.1%) |
| 75 Years and over | 10 (35.7%) | 7 (25.9%) |
Disability Class: Vision Difficulty
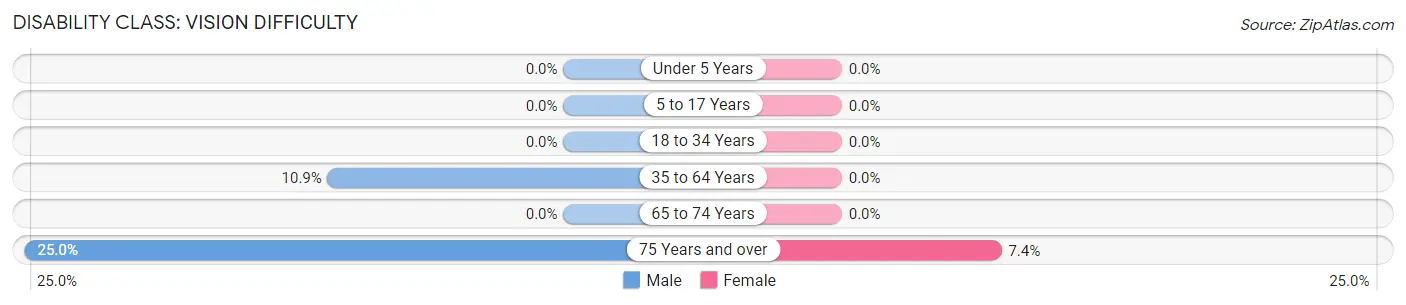
| Age Bracket | Male | Female |
| Under 5 Years | 0 (0.0%) | 0 (0.0%) |
| 5 to 17 Years | 0 (0.0%) | 0 (0.0%) |
| 18 to 34 Years | 0 (0.0%) | 0 (0.0%) |
| 35 to 64 Years | 7 (10.9%) | 0 (0.0%) |
| 65 to 74 Years | 0 (0.0%) | 0 (0.0%) |
| 75 Years and over | 7 (25.0%) | 2 (7.4%) |
Disability Class: Cognitive Difficulty
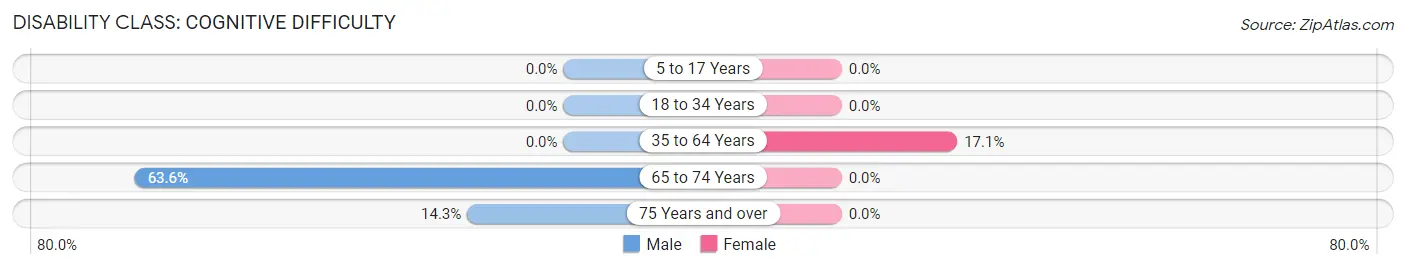
| Age Bracket | Male | Female |
| 5 to 17 Years | 0 (0.0%) | 0 (0.0%) |
| 18 to 34 Years | 0 (0.0%) | 0 (0.0%) |
| 35 to 64 Years | 0 (0.0%) | 6 (17.1%) |
| 65 to 74 Years | 7 (63.6%) | 0 (0.0%) |
| 75 Years and over | 4 (14.3%) | 0 (0.0%) |
Disability Class: Ambulatory Difficulty
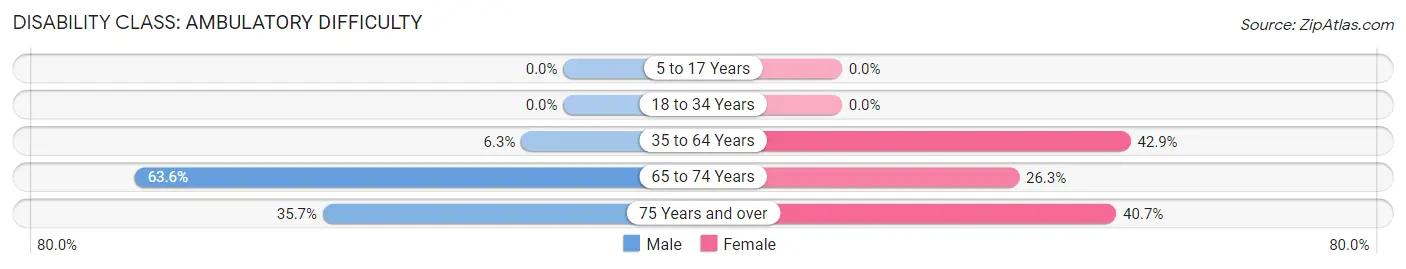
| Age Bracket | Male | Female |
| 5 to 17 Years | 0 (0.0%) | 0 (0.0%) |
| 18 to 34 Years | 0 (0.0%) | 0 (0.0%) |
| 35 to 64 Years | 4 (6.2%) | 15 (42.9%) |
| 65 to 74 Years | 7 (63.6%) | 10 (26.3%) |
| 75 Years and over | 10 (35.7%) | 11 (40.7%) |
Disability Class: Self-Care Difficulty
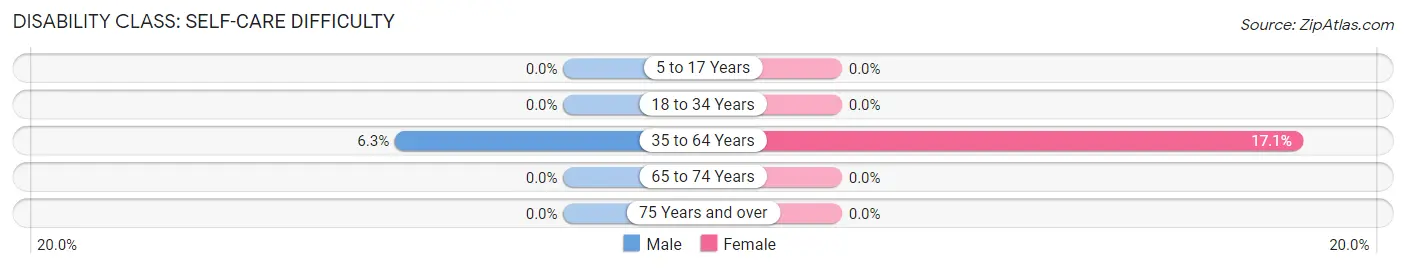
| Age Bracket | Male | Female |
| 5 to 17 Years | 0 (0.0%) | 0 (0.0%) |
| 18 to 34 Years | 0 (0.0%) | 0 (0.0%) |
| 35 to 64 Years | 4 (6.2%) | 6 (17.1%) |
| 65 to 74 Years | 0 (0.0%) | 0 (0.0%) |
| 75 Years and over | 0 (0.0%) | 0 (0.0%) |
Technology Access in Albion
Computing Device Access in Albion
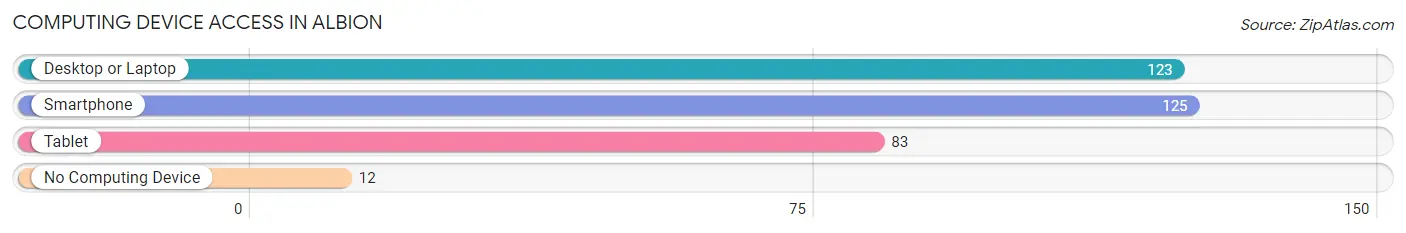
| Device Type | # Households | % Households |
| Desktop or Laptop | 123 | 84.8% |
| Smartphone | 125 | 86.2% |
| Tablet | 83 | 57.2% |
| No Computing Device | 12 | 8.3% |
| Total | 145 | 100.0% |
Internet Access in Albion
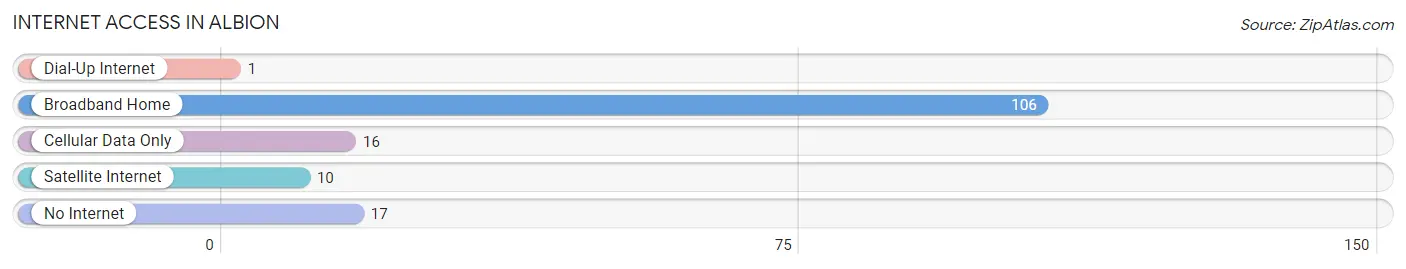
| Internet Type | # Households | % Households |
| Dial-Up Internet | 1 | 0.7% |
| Broadband Home | 106 | 73.1% |
| Cellular Data Only | 16 | 11.0% |
| Satellite Internet | 10 | 6.9% |
| No Internet | 17 | 11.7% |
| Total | 145 | 100.0% |
Albion Summary
Albion is a small city located in the southeastern corner of Idaho, in the United States. It is the county seat of Cassia County and is situated in the Snake River Plain, a region of the Great Basin. The city is located at the intersection of two major highways, Interstate 84 and U.S. Route 30. The population of Albion was 1,845 at the 2010 census.
Geography
Albion is located at an elevation of 4,717 feet (1,437 m) above sea level. The city is situated in the Snake River Plain, a region of the Great Basin. The city is located at the intersection of two major highways, Interstate 84 and U.S. Route 30. The city is surrounded by agricultural land, with the Albion Mountains to the east and the Raft River Mountains to the west.
Climate
Albion has a semi-arid climate, with hot summers and cold winters. The average annual temperature is 48.3°F (9.1°C). The average annual precipitation is 11.2 inches (284 mm).
Demographics
As of the 2010 census, there were 1,845 people, 690 households, and 463 families residing in the city. The population density was 1,092.3 people per square mile (422.2/km2). The racial makeup of the city was 91.2% White, 0.2% African American, 0.7% Native American, 0.2% Asian, 0.1% Pacific Islander, 5.7% from other races, and 1.7% from two or more races. Hispanic or Latino of any race were 11.2% of the population.
Economy
Albion's economy is largely based on agriculture. The city is home to several large farms and ranches, as well as a number of smaller farms and ranches. The city is also home to several food processing plants, including a potato processing plant and a sugar beet processing plant. The city is also home to a number of small businesses, including restaurants, retail stores, and service providers.
History
Albion was founded in 1883 by a group of Mormon settlers. The city was named after Albion, England, the hometown of one of the settlers. The city was incorporated in 1891.
In the early 20th century, Albion was a major center for the sugar beet industry. The city was home to several sugar beet processing plants, as well as a number of farms and ranches. The city was also home to a number of small businesses, including restaurants, retail stores, and service providers.
In the late 20th century, the city's economy shifted away from agriculture and towards tourism. The city is now home to several tourist attractions, including the Albion State Fish Hatchery, the Albion Valley Museum, and the Albion Valley Golf Course. The city is also home to a number of small businesses, including restaurants, retail stores, and service providers.
Common Questions
What is Per Capita Income in Albion?
Per Capita income in Albion is $27,281.
What is the Median Family Income in Albion?
Median Family Income in Albion is $64,922.
What is the Median Household income in Albion?
Median Household Income in Albion is $64,922.
What is Income or Wage Gap in Albion?
Income or Wage Gap in Albion is 59.4%.
Women in Albion earn 40.6 cents for every dollar earned by a man.
What is Inequality or Gini Index in Albion?
Inequality or Gini Index in Albion is 0.32.
What is the Total Population of Albion?
Total Population of Albion is 375.
What is the Total Male Population of Albion?
Total Male Population of Albion is 192.
What is the Total Female Population of Albion?
Total Female Population of Albion is 183.
What is the Ratio of Males per 100 Females in Albion?
There are 104.92 Males per 100 Females in Albion.
What is the Ratio of Females per 100 Males in Albion?
There are 95.31 Females per 100 Males in Albion.
What is the Median Population Age in Albion?
Median Population Age in Albion is 37.2 Years.
What is the Average Family Size in Albion
Average Family Size in Albion is 3.0 People.
What is the Average Household Size in Albion
Average Household Size in Albion is 2.6 People.
How Large is the Labor Force in Albion?
There are 163 People in the Labor Forcein in Albion.
What is the Percentage of People in the Labor Force in Albion?
58.4% of People are in the Labor Force in Albion.
What is the Unemployment Rate in Albion?
Unemployment Rate in Albion is 9.8%.