Zip Codes with the Highest Percentage of Owner-Occupied Units in Des Moines, IA

RELATED REPORTS & OPTIONS

Highest Owner-Occupied
Population
Families and Households
Female Fertility
Female Fertility (Unmarried)
Race (Community Size)
Race (Percentage)
Ancestry (Community Size)
AfghanAfricanAmericanApacheArabArgentineanAustralianAustrianBangladeshiBelgianBhutaneseBlackfeetBrazilianBritishBulgarianBurmeseCanadianCelticCentral AmericanCentral American IndianCherokeeChileanChippewaChoctawColombianCreekCroatianCubanCzechCzechoslovakianDanishDominicanDutchEastern EuropeanEcuadorianEgyptianEnglishEthiopianEuropeanFilipinoFinnishFrenchFrench American IndianFrench CanadianGermanGerman RussianGreekGuamanian / ChamorroGuatemalanHaitianHonduranHungarianIcelanderIndian (Asian)IndonesianIranianIraqiIrishItalianJamaicanJapaneseKenyanKoreanLatvianLebaneseLiberianLithuanianLuxembourgerMalaysianMexicanMexican American IndianNative HawaiianNavajoNew ZealanderNigerianNorthern EuropeanNorwegianPakistaniPanamanianPennsylvania GermanPeruvianPolishPortuguesePuerto RicanRomanianRussianSalvadoranScandinavianScotch-IrishScottishSerbianSiouxSlovakSloveneSomaliSouth AmericanSpaniardSpanishSri LankanSubsaharan AfricanSudaneseSwedishSwissSyrianThaiUkrainianVenezuelanWelshYaquiYugoslavian
Ancestry (Percentage)
AfghanAfricanAmericanApacheArabArgentineanAustralianAustrianBangladeshiBelgianBhutaneseBlackfeetBrazilianBritishBulgarianBurmeseCanadianCelticCentral AmericanCentral American IndianCherokeeChileanChippewaChoctawColombianCreekCroatianCubanCzechCzechoslovakianDanishDominicanDutchEastern EuropeanEcuadorianEgyptianEnglishEthiopianEuropeanFilipinoFinnishFrenchFrench American IndianFrench CanadianGermanGerman RussianGreekGuamanian / ChamorroGuatemalanHaitianHonduranHungarianIcelanderIndian (Asian)IndonesianIranianIraqiIrishItalianJamaicanJapaneseKenyanKoreanLatvianLebaneseLiberianLithuanianLuxembourgerMalaysianMexicanMexican American IndianNative HawaiianNavajoNew ZealanderNigerianNorthern EuropeanNorwegianPakistaniPanamanianPennsylvania GermanPeruvianPolishPortuguesePuerto RicanRomanianRussianSalvadoranScandinavianScotch-IrishScottishSerbianSiouxSlovakSloveneSomaliSouth AmericanSpaniardSpanishSri LankanSubsaharan AfricanSudaneseSwedishSwissSyrianThaiUkrainianVenezuelanWelshYaquiYugoslavian
Immigrant Origin (Total)
Immigrant Origin (Percentage)
Income
Income (Families)
Income (Households)
Poverty
Poverty (Families)
Unemployment
Employment Occupations
Employment Industries
Employer Class
Commute Time
Commute Means
School Enrollment
Education by Degree Field
Occupancy
Finances
Physical Characteristics
Des Moines
Compare Zip Codes
Comparison Subject

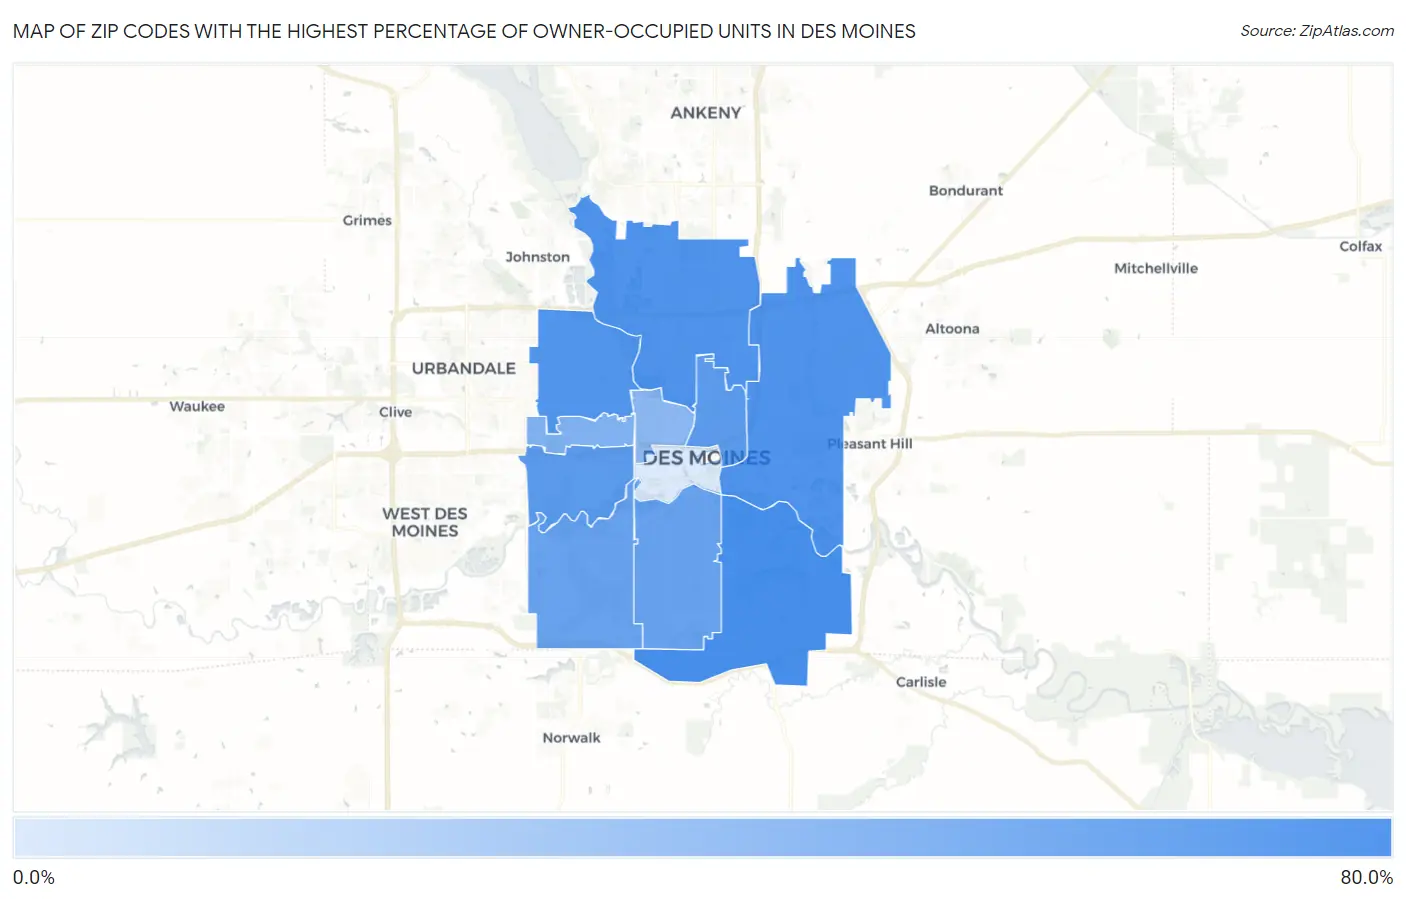
Map of Zip Codes with the Highest Percentage of Owner-Occupied Units in Des Moines

0.0%
80.0%
Zip Codes with the Highest Percentage of Owner-Occupied Units in Des Moines Map

Zip Codes with the Highest Percentage of Owner-Occupied Units in Des Moines, IA

Zip Code % Owner-Occupied vs State vs National
1.5032076.0%71.5%(+4.52)#68164.8%(+11.2)#18,277
2.5031372.4%71.5%(+0.833)#78064.8%(+7.53)#21,180
3.5031772.2%71.5%(+0.696)#78664.8%(+7.40)#21,279
4.5031069.6%71.5%(-1.97)#83464.8%(+4.74)#23,056
5.5031665.9%71.5%(-5.64)#88164.8%(+1.06)#25,028
6.5031265.0%71.5%(-6.52)#88764.8%(+0.181)#25,471
7.5032159.8%71.5%(-11.8)#92664.8%(-5.05)#27,480
8.5031559.5%71.5%(-12.1)#92764.8%(-5.36)#27,578
9.5031148.4%71.5%(-23.1)#94864.8%(-16.4)#29,994
10.5031442.8%71.5%(-28.7)#95464.8%(-22.0)#30,740
11.5030912.3%71.5%(-59.2)#96064.8%(-52.5)#32,305

Common Questions

What are the Top 10 Zip Codes with the Highest Percentage of Owner-Occupied Units in Des Moines, IA?
Top 10 Zip Codes with the Highest Percentage of Owner-Occupied Units in Des Moines, IA are:
#1
76.0%
#2
72.4%
#3
72.2%
#4
69.6%
#5
65.9%
#6
65.0%
#7
59.8%
#8
59.5%
#9
48.4%
#10
42.8%
What zip code has the Highest Percentage of Owner-Occupied Units in Des Moines, IA?
50320 has the Highest Percentage of Owner-Occupied Units in Des Moines, IA with 76.0%.
What is the Percentage of Owner-Occupied Units in Des Moines, IA?
Percentage of Owner-Occupied Units in Des Moines is 60.3%.
What is the Percentage of Owner-Occupied Units in Iowa?
Percentage of Owner-Occupied Units in Iowa is 71.5%.
What is the Percentage of Owner-Occupied Units in the United States?
Percentage of Owner-Occupied Units in the United States is 64.8%.