Zip Codes with the Most Births per 1,000 Women in Labor Force in Des Moines, IA

RELATED REPORTS & OPTIONS

Highest Birth Rate | In Labor Force
Population
Families and Households
Female Fertility
Female Fertility (Unmarried)
Race (Community Size)
Race (Percentage)
Ancestry (Community Size)
AfghanAfricanAmericanApacheArabArgentineanAustralianAustrianBangladeshiBelgianBhutaneseBlackfeetBrazilianBritishBulgarianBurmeseCanadianCelticCentral AmericanCentral American IndianCherokeeChileanChippewaChoctawColombianCreekCroatianCubanCzechCzechoslovakianDanishDominicanDutchEastern EuropeanEcuadorianEgyptianEnglishEthiopianEuropeanFilipinoFinnishFrenchFrench American IndianFrench CanadianGermanGerman RussianGreekGuamanian / ChamorroGuatemalanHaitianHonduranHungarianIcelanderIndian (Asian)IndonesianIranianIraqiIrishItalianJamaicanJapaneseKenyanKoreanLatvianLebaneseLiberianLithuanianLuxembourgerMalaysianMexicanMexican American IndianNative HawaiianNavajoNew ZealanderNigerianNorthern EuropeanNorwegianPakistaniPanamanianPennsylvania GermanPeruvianPolishPortuguesePuerto RicanRomanianRussianSalvadoranScandinavianScotch-IrishScottishSerbianSiouxSlovakSloveneSomaliSouth AmericanSpaniardSpanishSri LankanSubsaharan AfricanSudaneseSwedishSwissSyrianThaiUkrainianVenezuelanWelshYaquiYugoslavian
Ancestry (Percentage)
AfghanAfricanAmericanApacheArabArgentineanAustralianAustrianBangladeshiBelgianBhutaneseBlackfeetBrazilianBritishBulgarianBurmeseCanadianCelticCentral AmericanCentral American IndianCherokeeChileanChippewaChoctawColombianCreekCroatianCubanCzechCzechoslovakianDanishDominicanDutchEastern EuropeanEcuadorianEgyptianEnglishEthiopianEuropeanFilipinoFinnishFrenchFrench American IndianFrench CanadianGermanGerman RussianGreekGuamanian / ChamorroGuatemalanHaitianHonduranHungarianIcelanderIndian (Asian)IndonesianIranianIraqiIrishItalianJamaicanJapaneseKenyanKoreanLatvianLebaneseLiberianLithuanianLuxembourgerMalaysianMexicanMexican American IndianNative HawaiianNavajoNew ZealanderNigerianNorthern EuropeanNorwegianPakistaniPanamanianPennsylvania GermanPeruvianPolishPortuguesePuerto RicanRomanianRussianSalvadoranScandinavianScotch-IrishScottishSerbianSiouxSlovakSloveneSomaliSouth AmericanSpaniardSpanishSri LankanSubsaharan AfricanSudaneseSwedishSwissSyrianThaiUkrainianVenezuelanWelshYaquiYugoslavian
Immigrant Origin (Total)
Immigrant Origin (Percentage)
Income
Income (Families)
Income (Households)
Poverty
Poverty (Families)
Unemployment
Employment Occupations
Employment Industries
Employer Class
Commute Time
Commute Means
School Enrollment
Education by Degree Field
Occupancy
Finances
Physical Characteristics
Des Moines
Compare Zip Codes
Comparison Subject

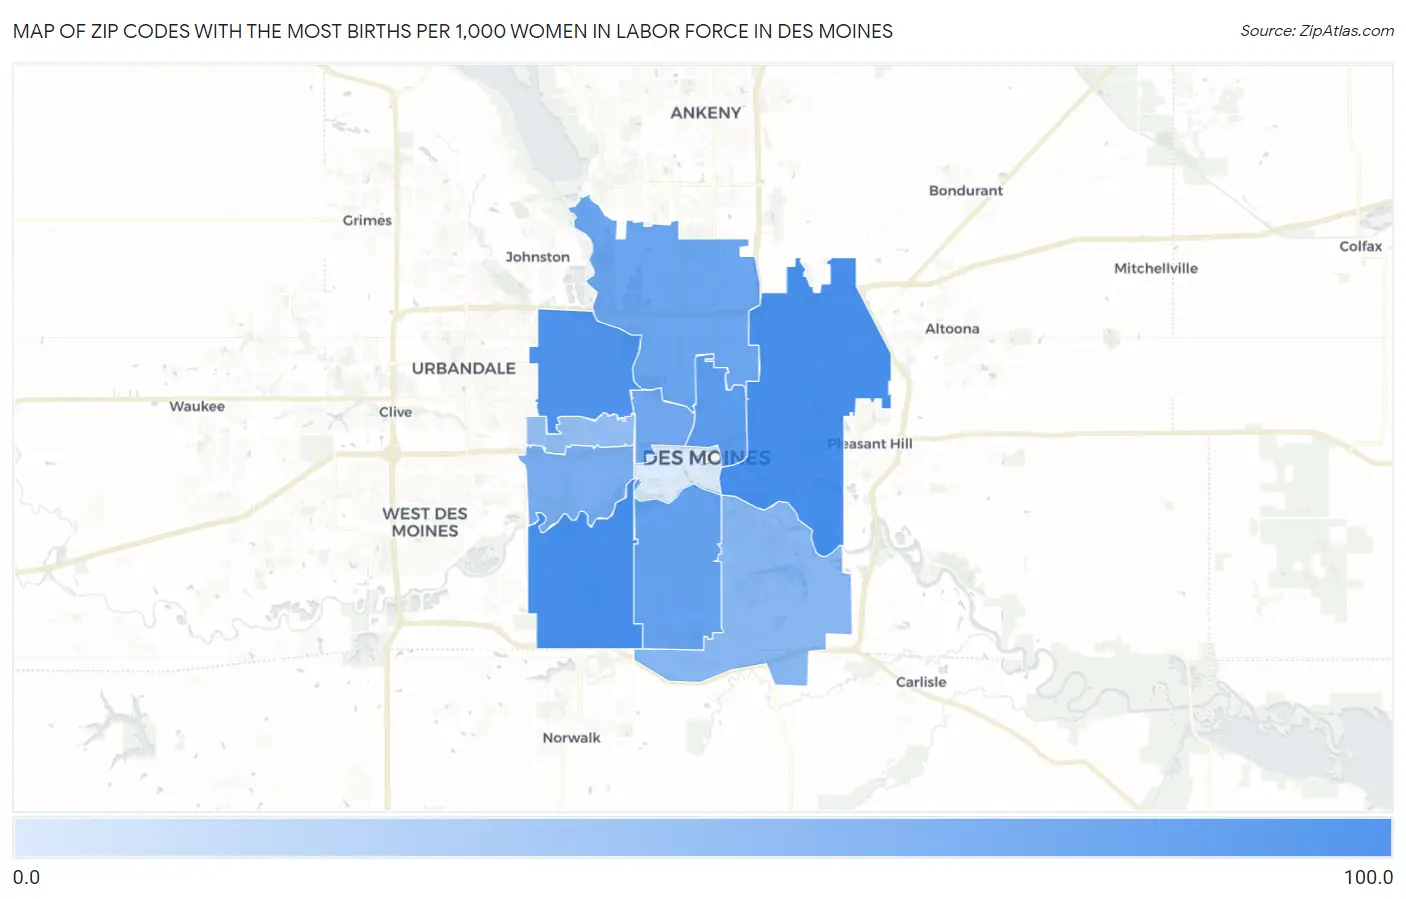
Map of Zip Codes with the Most Births per 1,000 Women in Labor Force in Des Moines

0.0
100.0
Zip Codes with the Most Births per 1,000 Women in Labor Force in Des Moines Map

Zip Codes with the Most Births per 1,000 Women in Labor Force in Des Moines, IA

Zip Code Births / 1,000 Women vs State vs National
1.5031781.055.0(+26.0)#23548.0(+33.0)#5,133
2.5032180.055.0(+25.0)#24548.0(+32.0)#5,287
3.5031069.055.0(+14.0)#29548.0(+21.0)#6,852
4.5031655.055.0(=0.000)#38048.0(+7.00)#10,025
5.5031546.055.0(-9.00)#45348.0(-2.00)#12,562
6.5031341.055.0(-14.0)#48748.0(-7.00)#14,269
7.5031437.055.0(-18.0)#53448.0(-11.0)#15,664
8.5031231.055.0(-24.0)#57348.0(-17.0)#17,492
9.5032024.055.0(-31.0)#62348.0(-24.0)#19,462
10.5031119.055.0(-36.0)#65448.0(-29.0)#20,773
11.503094.055.0(-51.0)#72448.0(-44.0)#23,105

Common Questions

What are the Top 10 Zip Codes with the Most Births per 1,000 Women in Labor Force in Des Moines, IA?
Top 10 Zip Codes with the Most Births per 1,000 Women in Labor Force in Des Moines, IA are:
#1
81.0
#2
80.0
#3
69.0
#4
55.0
#5
46.0
#6
41.0
#7
37.0
#8
31.0
#9
24.0
#10
19.0
What zip code has the Most Births per 1,000 Women in Labor Force in Des Moines, IA?
50317 has the Most Births per 1,000 Women in Labor Force in Des Moines, IA with 81.0.
What is the Number of Births per 1,000 Women in Labor Force in Des Moines, IA?
Number of Births per 1,000 Women in Labor Force in Des Moines is 44.0.
What is the Number of Births per 1,000 Women in Labor Force in Iowa?
Number of Births per 1,000 Women in Labor Force in Iowa is 55.0.
What is the Number of Births per 1,000 Women in Labor Force in the United States?
Number of Births per 1,000 Women in Labor Force in the United States is 48.0.