Zip Codes with the Highest Percentage of Population Employed in Arts, Entertainment & Recreation in Augusta, GA

RELATED REPORTS & OPTIONS

Arts, Entertainment & Recreation
Population
Families and Households
Female Fertility
Female Fertility (Unmarried)
Race (Community Size)
Race (Percentage)
Ancestry (Community Size)
AfghanAfricanAmericanArabArgentineanAustrianBarbadianBelizeanBhutaneseBlackfeetBrazilianBritishBritish West IndianBurmeseCajunCanadianCentral AmericanCentral American IndianCherokeeChippewaChoctawColombianCosta RicanCreekCroatianCubanCzechCzechoslovakianDanishDominicanDutchEastern EuropeanEgyptianEnglishEuropeanFinnishFrenchFrench CanadianGermanGhanaianGreekGuamanian / ChamorroGuatemalanGuyaneseHaitianHonduranHungarianIndian (Asian)IranianIrishIsraeliItalianJamaicanJapaneseKoreanLebaneseLithuanianMexicanMexican American IndianMoroccanNative HawaiianNicaraguanNigerianNorthern EuropeanNorwegianPakistaniPanamanianPennsylvania GermanPolishPortuguesePuerto RicanRomanianRussianSalvadoranSamoanScandinavianScotch-IrishScottishSeminoleSiouxSlovakSloveneSouth AmericanSpaniardSpanishSri LankanSubsaharan AfricanSwedishSwissSyrianThaiTrinidadian and TobagonianTurkishU.S. Virgin IslanderUkrainianUruguayanVenezuelanWelshWest IndianYugoslavian
Ancestry (Percentage)
AfghanAfricanAmericanArabArgentineanAustrianBarbadianBelizeanBhutaneseBlackfeetBrazilianBritishBritish West IndianBurmeseCajunCanadianCentral AmericanCentral American IndianCherokeeChippewaChoctawColombianCosta RicanCreekCroatianCubanCzechCzechoslovakianDanishDominicanDutchEastern EuropeanEgyptianEnglishEuropeanFinnishFrenchFrench CanadianGermanGhanaianGreekGuamanian / ChamorroGuatemalanGuyaneseHaitianHonduranHungarianIndian (Asian)IranianIrishIsraeliItalianJamaicanJapaneseKoreanLebaneseLithuanianMexicanMexican American IndianMoroccanNative HawaiianNicaraguanNigerianNorthern EuropeanNorwegianPakistaniPanamanianPennsylvania GermanPolishPortuguesePuerto RicanRomanianRussianSalvadoranSamoanScandinavianScotch-IrishScottishSeminoleSiouxSlovakSloveneSouth AmericanSpaniardSpanishSri LankanSubsaharan AfricanSwedishSwissSyrianThaiTrinidadian and TobagonianTurkishU.S. Virgin IslanderUkrainianUruguayanVenezuelanWelshWest IndianYugoslavian
Immigrant Origin (Total)
Immigrant Origin (Percentage)
Income
Income (Families)
Income (Households)
Poverty
Poverty (Families)
Unemployment
Employment Occupations
Employment Industries
Employer Class
Commute Time
Commute Means
School Enrollment
Education by Degree Field
Occupancy
Finances
Physical Characteristics
Augusta
Compare Zip Codes
Comparison Subject

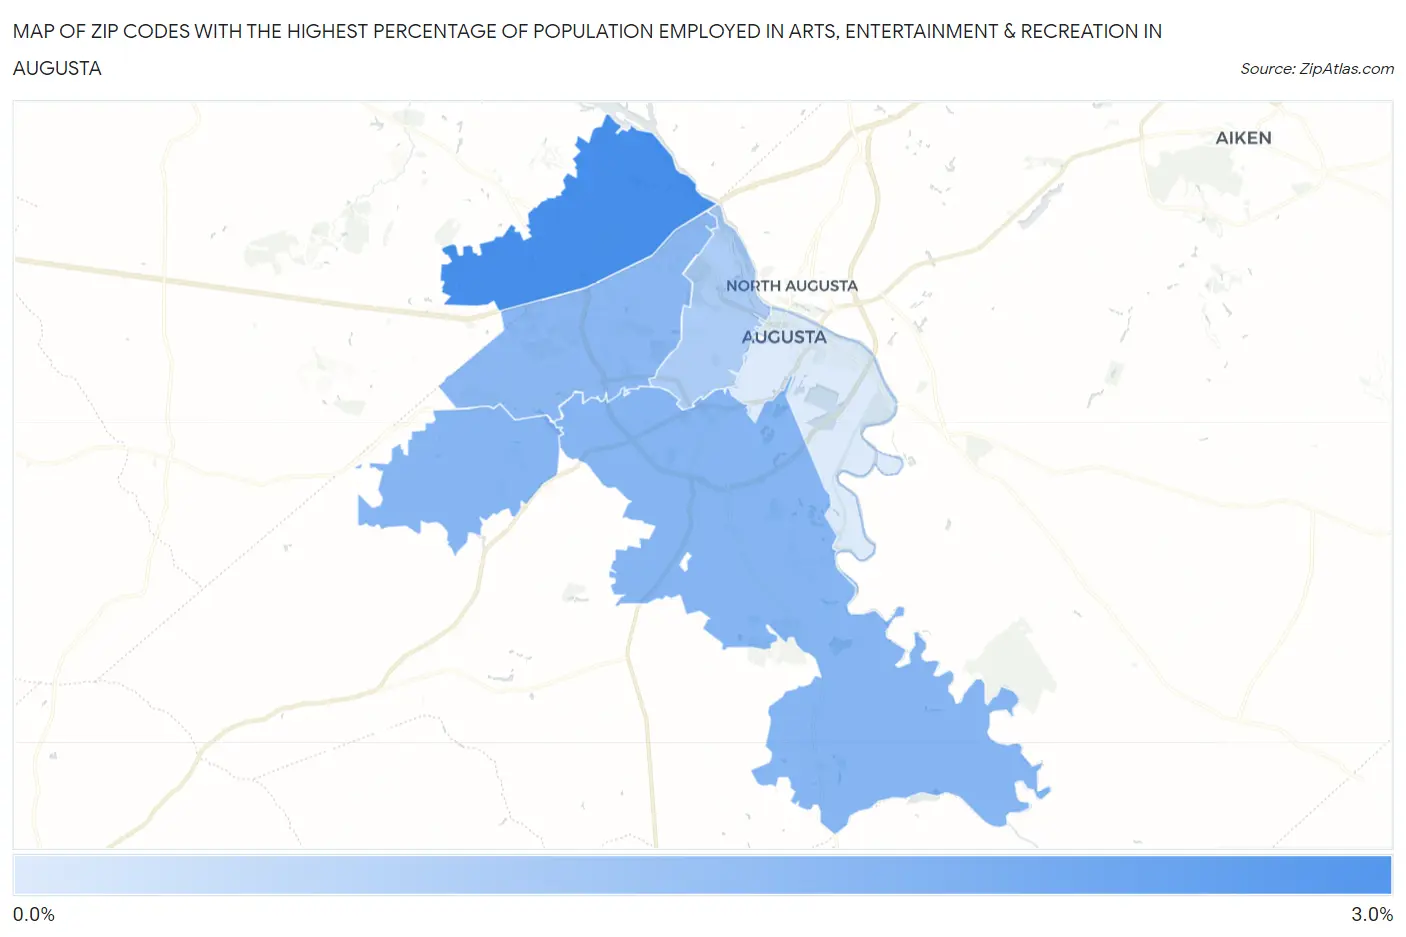
Map of Zip Codes with the Highest Percentage of Population Employed in Arts, Entertainment & Recreation in Augusta

0.0%
3.0%
Zip Codes with the Highest Percentage of Population Employed in Arts, Entertainment & Recreation in Augusta Map

Zip Codes with the Highest Percentage of Population Employed in Arts, Entertainment & Recreation in Augusta, GA

Zip Code % Employed vs State vs National
1.309072.6%1.6%(+0.935)#892.1%(+0.473)#6,932
2.309051.9%1.6%(+0.241)#1712.1%(-0.222)#10,612
3.309061.8%1.6%(+0.227)#1752.1%(-0.236)#10,709
4.309091.8%1.6%(+0.181)#1812.1%(-0.281)#11,005
5.309041.4%1.6%(-0.214)#2492.1%(-0.677)#13,940
6.309010.88%1.6%(-0.744)#3552.1%(-1.21)#17,873

Common Questions

What are the Top 5 Zip Codes with the Highest Percentage of Population Employed in Arts, Entertainment & Recreation in Augusta, GA?
Top 5 Zip Codes with the Highest Percentage of Population Employed in Arts, Entertainment & Recreation in Augusta, GA are:
#1
2.6%
#2
1.9%
#3
1.8%
#4
1.8%
#5
1.4%
What zip code has the Highest Percentage of Population Employed in Arts, Entertainment & Recreation in Augusta, GA?
30907 has the Highest Percentage of Population Employed in Arts, Entertainment & Recreation in Augusta, GA with 2.6%.
What is the Percentage of Population Employed in Arts, Entertainment & Recreation in Georgia?
Percentage of Population Employed in Arts, Entertainment & Recreation in Georgia is 1.6%.
What is the Percentage of Population Employed in Arts, Entertainment & Recreation in the United States?
Percentage of Population Employed in Arts, Entertainment & Recreation in the United States is 2.1%.