Zip Codes with the Highest Percentage of Population Employed in Arts, Entertainment & Recreation in Pompano Beach, FL

RELATED REPORTS & OPTIONS

Arts, Entertainment & Recreation
Population
Families and Households
Female Fertility
Female Fertility (Unmarried)
Race (Community Size)
Race (Percentage)
Ancestry (Community Size)
AfricanAlbanianAmericanApacheArabArgentineanArmenianAustralianAustrianBahamianBarbadianBelgianBelizeanBhutaneseBlackfeetBolivianBrazilianBritishBritish West IndianBulgarianBurmeseCanadianCelticCentral AmericanCentral American IndianCherokeeChileanColombianCosta RicanCreekCroatianCubanCzechCzechoslovakianDanishDominicanDutchEastern EuropeanEcuadorianEgyptianEnglishEuropeanFilipinoFinnishFrenchFrench CanadianGermanGhanaianGreekGuatemalanGuyaneseHaitianHonduranHungarianIndian (Asian)IranianIrishIroquoisIsraeliItalianJamaicanKoreanLatvianLebaneseLithuanianLuxembourgerMacedonianMexicanMexican American IndianMoroccanNative HawaiianNicaraguanNigerianNorthern EuropeanNorwegianPakistaniPalestinianPanamanianPennsylvania GermanPeruvianPolishPortuguesePuerto RicanRomanianRussianSalvadoranSamoanScandinavianScotch-IrishScottishSeminoleSerbianSlavicSlovakSloveneSouth AfricanSouth AmericanSouth American IndianSpaniardSpanishSri LankanSubsaharan AfricanSwedishSwissSyrianThaiTrinidadian and TobagonianTurkishU.S. Virgin IslanderUkrainianUruguayanVenezuelanVietnameseWelshWest IndianYugoslavian
Ancestry (Percentage)
AfricanAlbanianAmericanApacheArabArgentineanArmenianAustralianAustrianBahamianBarbadianBelgianBelizeanBhutaneseBlackfeetBolivianBrazilianBritishBritish West IndianBulgarianBurmeseCanadianCelticCentral AmericanCentral American IndianCherokeeChileanColombianCosta RicanCreekCroatianCubanCzechCzechoslovakianDanishDominicanDutchEastern EuropeanEcuadorianEgyptianEnglishEuropeanFilipinoFinnishFrenchFrench CanadianGermanGhanaianGreekGuatemalanGuyaneseHaitianHonduranHungarianIndian (Asian)IranianIrishIroquoisIsraeliItalianJamaicanKoreanLatvianLebaneseLithuanianLuxembourgerMacedonianMexicanMexican American IndianMoroccanNative HawaiianNicaraguanNigerianNorthern EuropeanNorwegianPakistaniPalestinianPanamanianPennsylvania GermanPeruvianPolishPortuguesePuerto RicanRomanianRussianSalvadoranSamoanScandinavianScotch-IrishScottishSeminoleSerbianSlavicSlovakSloveneSouth AfricanSouth AmericanSouth American IndianSpaniardSpanishSri LankanSubsaharan AfricanSwedishSwissSyrianThaiTrinidadian and TobagonianTurkishU.S. Virgin IslanderUkrainianUruguayanVenezuelanVietnameseWelshWest IndianYugoslavian
Immigrant Origin (Total)
AfricaAlbaniaArgentinaAsiaAustraliaAustriaBahamasBangladeshBarbadosBelgiumBelizeBoliviaBrazilBulgariaBurma / MyanmarCanadaCaribbeanCentral AmericaChileChinaColombiaCosta RicaCroatiaCubaCzechoslovakiaDenmarkDominicaDominican RepublicEastern AfricaEastern AsiaEastern EuropeEcuadorEgyptEl SalvadorEnglandEthiopiaEuropeFranceGermanyGreeceGrenadaGuatemalaGuyanaHaitiHondurasHong KongHungaryIndiaIranIraqIrelandIsraelItalyJamaicaJapanJordanKoreaKuwaitLatin AmericaLebanonLithuaniaMalaysiaMexicoMoroccoNetherlandsNicaraguaNigeriaNorth MacedoniaNorthern AfricaNorthern EuropeNorwayOceaniaPakistanPanamaPeruPhilippinesPolandPortugalRomaniaRussiaScotlandSenegalSerbiaSouth AfricaSouth AmericaSouth Central AsiaSouth Eastern AsiaSouthern EuropeSpainSri LankaSwedenSwitzerlandSyriaTaiwanThailandTrinidad and TobagoTurkeyUkraineUruguayUzbekistanVenezuelaVietnamWest IndiesWestern AfricaWestern AsiaWestern Europe
Immigrant Origin (Percentage)
AfricaAlbaniaArgentinaAsiaAustraliaAustriaBahamasBangladeshBarbadosBelgiumBelizeBoliviaBrazilBulgariaBurma / MyanmarCanadaCaribbeanCentral AmericaChileChinaColombiaCosta RicaCroatiaCubaCzechoslovakiaDenmarkDominicaDominican RepublicEastern AfricaEastern AsiaEastern EuropeEcuadorEgyptEl SalvadorEnglandEthiopiaEuropeFranceGermanyGreeceGrenadaGuatemalaGuyanaHaitiHondurasHong KongHungaryIndiaIranIraqIrelandIsraelItalyJamaicaJapanJordanKoreaKuwaitLatin AmericaLebanonLithuaniaMalaysiaMexicoMoroccoNetherlandsNicaraguaNigeriaNorth MacedoniaNorthern AfricaNorthern EuropeNorwayOceaniaPakistanPanamaPeruPhilippinesPolandPortugalRomaniaRussiaScotlandSenegalSerbiaSouth AfricaSouth AmericaSouth Central AsiaSouth Eastern AsiaSouthern EuropeSpainSri LankaSwedenSwitzerlandSyriaTaiwanThailandTrinidad and TobagoTurkeyUkraineUruguayUzbekistanVenezuelaVietnamWest IndiesWestern AfricaWestern AsiaWestern Europe
Income
Income (Families)
Income (Households)
Poverty
Poverty (Families)
Unemployment
Employment Occupations
Employment Industries
Employer Class
Commute Time
Commute Means
School Enrollment
Education by Degree Field
Occupancy
Finances
Physical Characteristics
Pompano Beach
States
Florida Cities
Altamonte SpringsApopkaArcadiaBoca RatonBonita SpringsBoynton BeachBradentonBrandonBrooksvilleCape CoralCasselberryClearwaterClermontCocoaCoral SpringsCrestviewCrystal RiverDade CityDavenportDaytona BeachDeerfield BeachDefuniak SpringsDelandDelray BeachDeltonaDunnellonEdgewaterEnglewoodEustisFort LauderdaleFort MyersFort PierceFort Walton BeachGainesvilleGulf BreezeHialeahHolidayHollywoodHomesteadHomosassaHudsonInvernessJacksonvilleJupiterKissimmeeLake CityLake WalesLake WorthLakelandLand O LakesLargoLeesburgLehigh AcresLongwoodLutzMelbourneMerritt IslandMiamiMiami BeachMiltonNaplesNew Port RicheyNew Smyrna BeachNorth Fort MyersNorth PortOcalaOkeechobeeOpa LockaOrange ParkOrlandoOrmond BeachOviedoPalm BayPalm Beach GardensPalm CoastPalm HarborPanama CityPanama City BeachPensacolaPerryPinellas ParkPlant CityPompano BeachPort CharlottePort OrangePort Saint LuciePunta GordaRiverviewSaint AugustineSaint CloudSaint PetersburgSanfordSarasotaSebastianSebringSeminoleSpring HillStuartTallahasseeTampaTarpon SpringsThe VillagesTitusvilleValricoVeniceVero BeachWesley ChapelWest Palm BeachWinter HavenWinter ParkZephyrhills
Compare Zip Codes
Comparison Subject

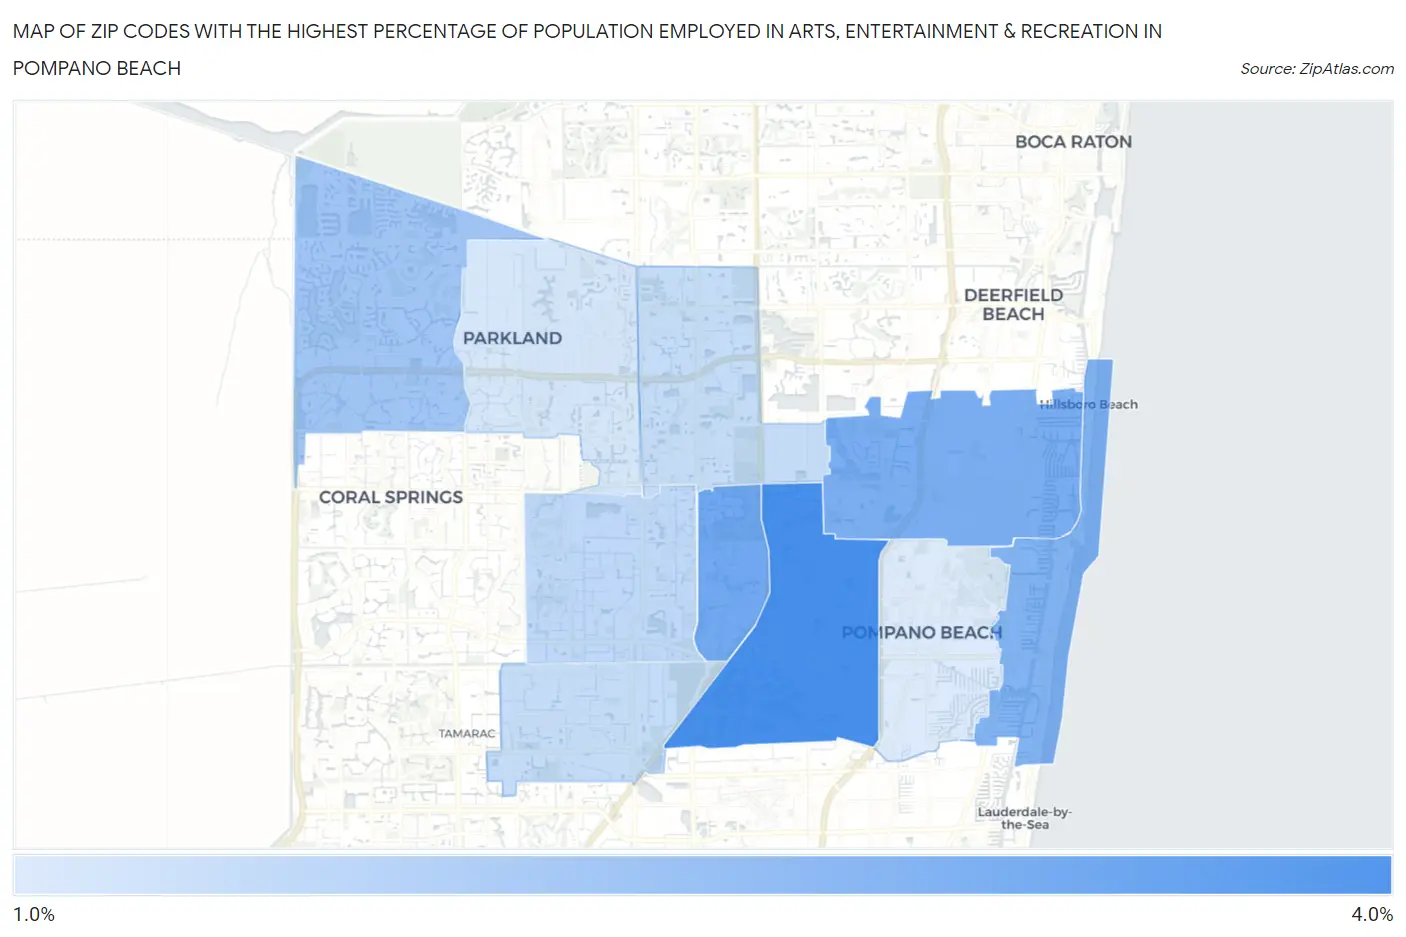
Map of Zip Codes with the Highest Percentage of Population Employed in Arts, Entertainment & Recreation in Pompano Beach

0.0%
4.0%
Zip Codes with the Highest Percentage of Population Employed in Arts, Entertainment & Recreation in Pompano Beach Map

Zip Codes with the Highest Percentage of Population Employed in Arts, Entertainment & Recreation in Pompano Beach, FL

Zip Code % Employed vs State vs National
1.330693.8%2.9%(+0.886)#1872.1%(+1.70)#3,653
2.330663.2%2.9%(+0.316)#2562.1%(+1.13)#4,757
3.330643.1%2.9%(+0.182)#2882.1%(+0.999)#5,119
4.330623.0%2.9%(+0.094)#3012.1%(+0.912)#5,371
5.330762.5%2.9%(-0.372)#3982.1%(+0.445)#7,059
6.330632.1%2.9%(-0.776)#4932.1%(+0.041)#9,075
7.330682.0%2.9%(-0.875)#5172.1%(-0.058)#9,627
8.330732.0%2.9%(-0.876)#5182.1%(-0.058)#9,631
9.330671.8%2.9%(-1.10)#5872.1%(-0.283)#11,020
10.330601.7%2.9%(-1.18)#6102.1%(-0.365)#11,612

Common Questions

What are the Top 5 Zip Codes with the Highest Percentage of Population Employed in Arts, Entertainment & Recreation in Pompano Beach, FL?
Top 5 Zip Codes with the Highest Percentage of Population Employed in Arts, Entertainment & Recreation in Pompano Beach, FL are:
#1
3.8%
#2
3.2%
#3
3.1%
#4
3.0%
#5
2.5%
What zip code has the Highest Percentage of Population Employed in Arts, Entertainment & Recreation in Pompano Beach, FL?
33069 has the Highest Percentage of Population Employed in Arts, Entertainment & Recreation in Pompano Beach, FL with 3.8%.
What is the Percentage of Population Employed in Arts, Entertainment & Recreation in Pompano Beach, FL?
Percentage of Population Employed in Arts, Entertainment & Recreation in Pompano Beach is 2.9%.
What is the Percentage of Population Employed in Arts, Entertainment & Recreation in Florida?
Percentage of Population Employed in Arts, Entertainment & Recreation in Florida is 2.9%.
What is the Percentage of Population Employed in Arts, Entertainment & Recreation in the United States?
Percentage of Population Employed in Arts, Entertainment & Recreation in the United States is 2.1%.