Zip Codes with the Highest Percentage of Population Employed in Agriculture, Fishing & Hunting in Palm Bay, FL

RELATED REPORTS & OPTIONS

Agriculture, Fishing & Hunting
Population
Families and Households
Female Fertility
Female Fertility (Unmarried)
Race (Community Size)
Race (Percentage)
Ancestry (Community Size)
AfricanAmericanArabArmenianAustrianBarbadianBelgianBhutaneseBlackfeetBrazilianBritishBritish West IndianBurmeseCajunCanadianCape VerdeanCentral AmericanCentral American IndianCherokeeChileanColombianCosta RicanCreekCroatianCubanCzechCzechoslovakianDanishDominicanDutchEastern EuropeanEcuadorianEgyptianEnglishEuropeanFinnishFrenchFrench CanadianGermanGreekGuatemalanGuyaneseHaitianHonduranHungarianIndian (Asian)InupiatIrishItalianJamaicanKoreanLebaneseLithuanianMexicanMoroccanNative HawaiianNorthern EuropeanNorwegianPakistaniPanamanianPeruvianPolishPortuguesePuerto RicanRomanianRussianSalvadoranScandinavianScotch-IrishScottishSeminoleSlovakSouth AfricanSouth AmericanSpaniardSpanishSri LankanSubsaharan AfricanSwedishSwissThaiTrinidadian and TobagonianUkrainianVenezuelanWelshWest IndianYugoslavian
Ancestry (Percentage)
AfricanAmericanArabArmenianAustrianBarbadianBelgianBhutaneseBlackfeetBrazilianBritishBritish West IndianBurmeseCajunCanadianCape VerdeanCentral AmericanCentral American IndianCherokeeChileanColombianCosta RicanCreekCroatianCubanCzechCzechoslovakianDanishDominicanDutchEastern EuropeanEcuadorianEgyptianEnglishEuropeanFinnishFrenchFrench CanadianGermanGreekGuatemalanGuyaneseHaitianHonduranHungarianIndian (Asian)InupiatIrishItalianJamaicanKoreanLebaneseLithuanianMexicanMoroccanNative HawaiianNorthern EuropeanNorwegianPakistaniPanamanianPeruvianPolishPortuguesePuerto RicanRomanianRussianSalvadoranScandinavianScotch-IrishScottishSeminoleSlovakSouth AfricanSouth AmericanSpaniardSpanishSri LankanSubsaharan AfricanSwedishSwissThaiTrinidadian and TobagonianUkrainianVenezuelanWelshWest IndianYugoslavian
Immigrant Origin (Total)
Immigrant Origin (Percentage)
Income
Income (Families)
Income (Households)
Poverty
Poverty (Families)
Unemployment
Employment Occupations
Employment Industries
Employer Class
Commute Time
Commute Means
School Enrollment
Education by Degree Field
Occupancy
Finances
Physical Characteristics
Palm Bay
Compare Zip Codes
Comparison Subject

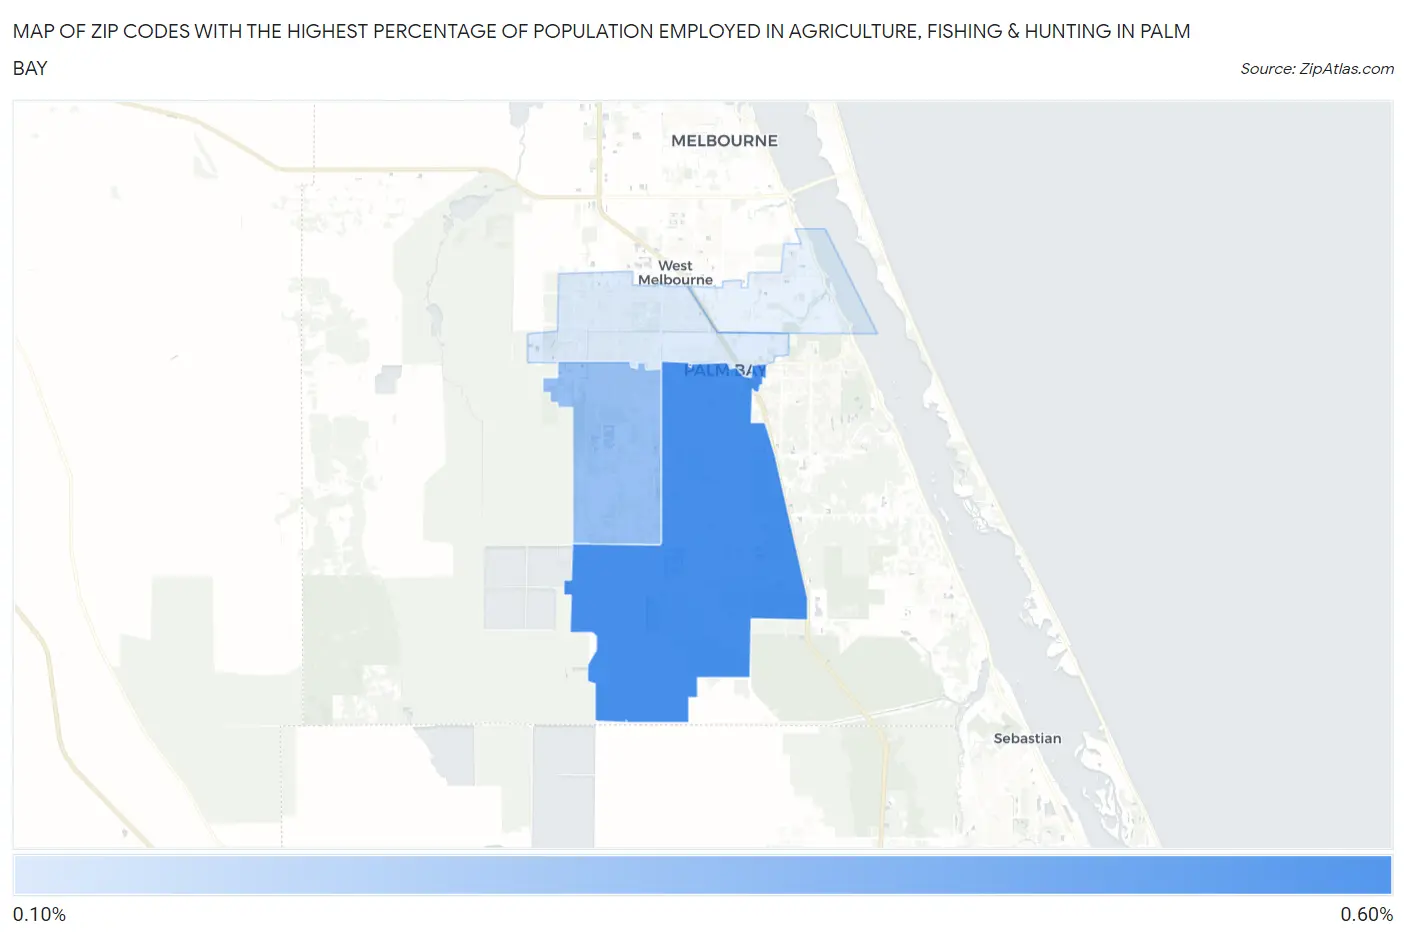
Map of Zip Codes with the Highest Percentage of Population Employed in Agriculture, Fishing & Hunting in Palm Bay

0.0%
0.60%
Zip Codes with the Highest Percentage of Population Employed in Agriculture, Fishing & Hunting in Palm Bay Map

Zip Codes with the Highest Percentage of Population Employed in Agriculture, Fishing & Hunting in Palm Bay, FL

Zip Code % Employed vs State vs National
1.329090.57%0.75%(-0.175)#3931.2%(-0.629)#18,701
2.329080.36%0.75%(-0.390)#5041.2%(-0.844)#20,602
3.329070.17%0.75%(-0.571)#6311.2%(-1.02)#22,657

Common Questions

What are the Top 3 Zip Codes with the Highest Percentage of Population Employed in Agriculture, Fishing & Hunting in Palm Bay, FL?
Top 3 Zip Codes with the Highest Percentage of Population Employed in Agriculture, Fishing & Hunting in Palm Bay, FL are:
#1
0.57%
#2
0.36%
#3
0.17%
What zip code has the Highest Percentage of Population Employed in Agriculture, Fishing & Hunting in Palm Bay, FL?
32909 has the Highest Percentage of Population Employed in Agriculture, Fishing & Hunting in Palm Bay, FL with 0.57%.
What is the Percentage of Population Employed in Agriculture, Fishing & Hunting in Palm Bay, FL?
Percentage of Population Employed in Agriculture, Fishing & Hunting in Palm Bay is 0.29%.
What is the Percentage of Population Employed in Agriculture, Fishing & Hunting in Florida?
Percentage of Population Employed in Agriculture, Fishing & Hunting in Florida is 0.75%.
What is the Percentage of Population Employed in Agriculture, Fishing & Hunting in the United States?
Percentage of Population Employed in Agriculture, Fishing & Hunting in the United States is 1.2%.