Zip Codes with the Highest Percentage of Population Employed in Farming, Fishing & Forestry in Ocala, FL

RELATED REPORTS & OPTIONS

Farming, Fishing & Forestry
Population
Families and Households
Female Fertility
Female Fertility (Unmarried)
Race (Community Size)
Race (Percentage)
Ancestry (Community Size)
AfricanAmericanApacheArabArgentineanArmenianAustralianAustrianBahamianBarbadianBelgianBhutaneseBlackfeetBolivianBrazilianBritishBritish West IndianBurmeseCanadianCentral AmericanCentral American IndianCherokeeChickasawChileanChippewaChoctawColombianCosta RicanCreekCroatianCrowCubanCzechCzechoslovakianDanishDominicanDutchEastern EuropeanEcuadorianEgyptianEnglishEstonianEuropeanFinnishFrenchFrench CanadianGermanGerman RussianGreekGuamanian / ChamorroGuatemalanGuyaneseHaitianHonduranHungarianIcelanderIndian (Asian)IrishIroquoisIsraeliItalianJamaicanJapaneseKoreanLaotianLatvianLebaneseLithuanianMalaysianMexicanMoroccanNicaraguanNigerianNorthern EuropeanNorwegianPakistaniPanamanianPennsylvania GermanPeruvianPolishPortuguesePuerto RicanRomanianRussianSalvadoranScandinavianScotch-IrishScottishSerbianSiouxSlavicSlovakSloveneSouth AfricanSouth AmericanSouth American IndianSpaniardSpanishSri LankanSubsaharan AfricanSwedishSwissSyrianThaiTrinidadian and TobagonianTurkishU.S. Virgin IslanderUkrainianUruguayanVenezuelanWelshWest IndianYugoslavian
Ancestry (Percentage)
AfricanAmericanApacheArabArgentineanArmenianAustralianAustrianBahamianBarbadianBelgianBhutaneseBlackfeetBolivianBrazilianBritishBritish West IndianBurmeseCanadianCentral AmericanCentral American IndianCherokeeChickasawChileanChippewaChoctawColombianCosta RicanCreekCroatianCrowCubanCzechCzechoslovakianDanishDominicanDutchEastern EuropeanEcuadorianEgyptianEnglishEstonianEuropeanFinnishFrenchFrench CanadianGermanGerman RussianGreekGuamanian / ChamorroGuatemalanGuyaneseHaitianHonduranHungarianIcelanderIndian (Asian)IrishIroquoisIsraeliItalianJamaicanJapaneseKoreanLaotianLatvianLebaneseLithuanianMalaysianMexicanMoroccanNicaraguanNigerianNorthern EuropeanNorwegianPakistaniPanamanianPennsylvania GermanPeruvianPolishPortuguesePuerto RicanRomanianRussianSalvadoranScandinavianScotch-IrishScottishSerbianSiouxSlavicSlovakSloveneSouth AfricanSouth AmericanSouth American IndianSpaniardSpanishSri LankanSubsaharan AfricanSwedishSwissSyrianThaiTrinidadian and TobagonianTurkishU.S. Virgin IslanderUkrainianUruguayanVenezuelanWelshWest IndianYugoslavian
Immigrant Origin (Total)
Immigrant Origin (Percentage)
Income
Income (Families)
Income (Households)
Poverty
Poverty (Families)
Unemployment
Employment Occupations
Employment Industries
Employer Class
Commute Time
Commute Means
School Enrollment
Education by Degree Field
Occupancy
Finances
Physical Characteristics
Ocala
Compare Zip Codes
Comparison Subject

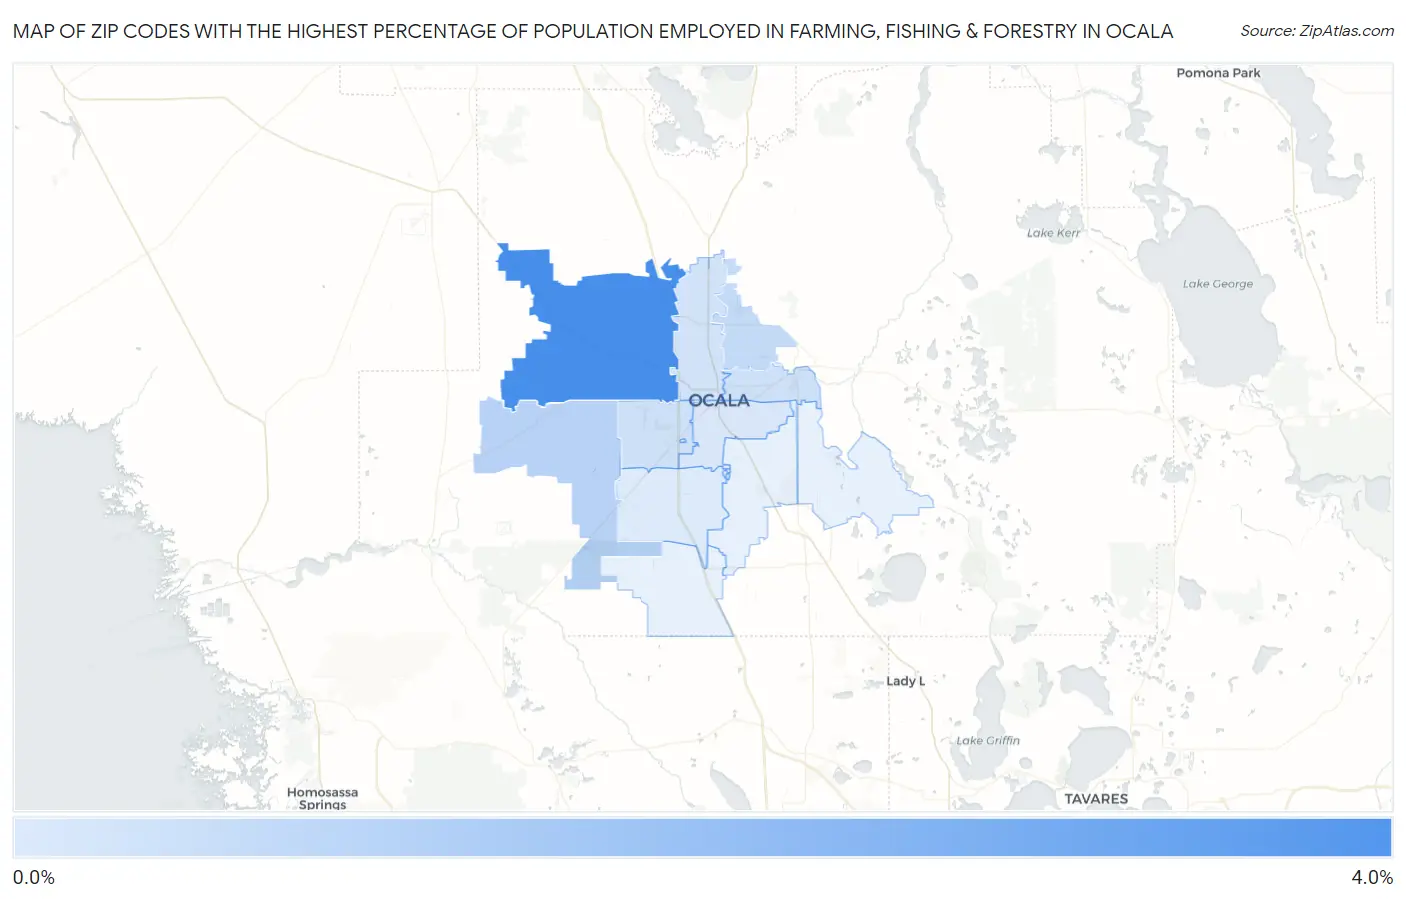
Map of Zip Codes with the Highest Percentage of Population Employed in Farming, Fishing & Forestry in Ocala

0.0%
4.0%
Zip Codes with the Highest Percentage of Population Employed in Farming, Fishing & Forestry in Ocala Map

Zip Codes with the Highest Percentage of Population Employed in Farming, Fishing & Forestry in Ocala, FL

Zip Code % Employed vs State vs National
1.344823.7%0.47%(+3.25)#670.61%(+3.11)#3,986
2.344811.0%0.47%(+0.547)#1760.61%(+0.411)#9,664
3.344790.77%0.47%(+0.300)#2170.61%(+0.163)#10,973
4.344700.52%0.47%(+0.050)#2850.61%(-0.087)#12,688
5.344740.51%0.47%(+0.044)#2870.61%(-0.093)#12,730
6.344750.45%0.47%(-0.016)#3020.61%(-0.153)#13,261
7.344710.29%0.47%(-0.174)#3890.61%(-0.311)#14,904
8.344760.18%0.47%(-0.286)#4540.61%(-0.423)#16,385

Common Questions

What are the Top 10 Zip Codes with the Highest Percentage of Population Employed in Farming, Fishing & Forestry in Ocala, FL?
Top 10 Zip Codes with the Highest Percentage of Population Employed in Farming, Fishing & Forestry in Ocala, FL are:
#1
3.7%
#2
1.0%
#3
0.77%
#4
0.52%
#5
0.51%
#6
0.45%
#7
0.29%
#8
0.18%
#9
0.0%
#10
0.0%
What zip code has the Highest Percentage of Population Employed in Farming, Fishing & Forestry in Ocala, FL?
34482 has the Highest Percentage of Population Employed in Farming, Fishing & Forestry in Ocala, FL with 3.7%.
What is the Percentage of Population Employed in Farming, Fishing & Forestry in Ocala, FL?
Percentage of Population Employed in Farming, Fishing & Forestry in Ocala is 0.50%.
What is the Percentage of Population Employed in Farming, Fishing & Forestry in Florida?
Percentage of Population Employed in Farming, Fishing & Forestry in Florida is 0.47%.
What is the Percentage of Population Employed in Farming, Fishing & Forestry in the United States?
Percentage of Population Employed in Farming, Fishing & Forestry in the United States is 0.61%.