Zip Codes with the Highest Percentage of Population Employed in Agriculture, Fishing & Hunting in Deland, FL
RELATED REPORTS & OPTIONS
Agriculture, Fishing & Hunting
Deland
Compare Zip Codes
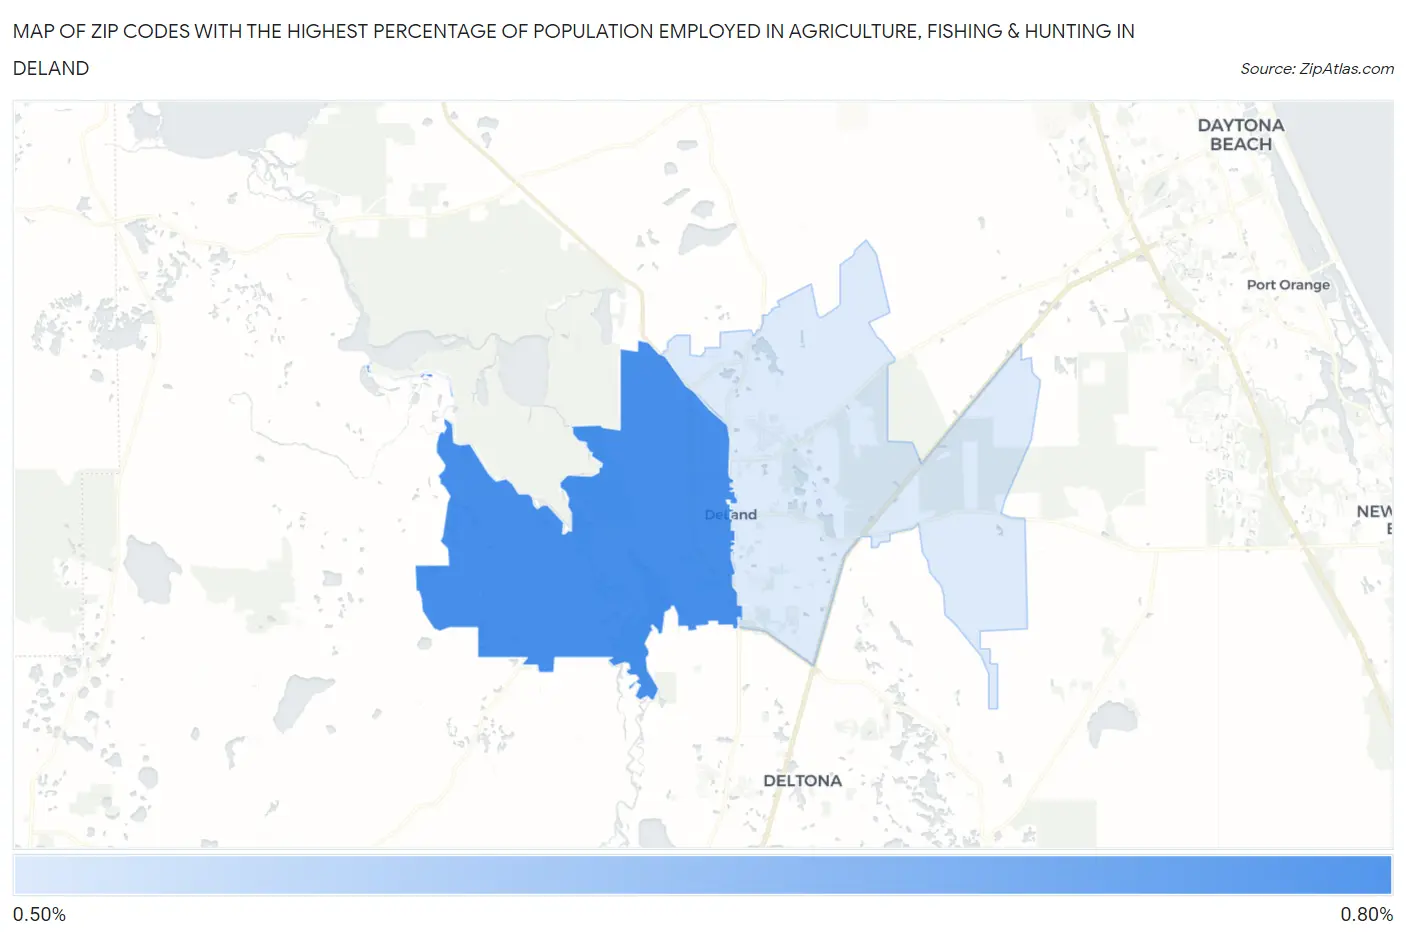
Map of Zip Codes with the Highest Percentage of Population Employed in Agriculture, Fishing & Hunting in Deland
0.0%
0.80%
Zip Codes with the Highest Percentage of Population Employed in Agriculture, Fishing & Hunting in Deland, FL
| Zip Code | % Employed | vs State | vs National | |
| 1. | 32720 | 0.76% | 0.75%(+0.010)#325 | 1.2%(-0.443)#17,502 |
| 2. | 32724 | 0.51% | 0.75%(-0.235)#417 | 1.2%(-0.688)#19,178 |
1
Common Questions
What are the Top Zip Codes with the Highest Percentage of Population Employed in Agriculture, Fishing & Hunting in Deland, FL?
Top Zip Codes with the Highest Percentage of Population Employed in Agriculture, Fishing & Hunting in Deland, FL are:
What zip code has the Highest Percentage of Population Employed in Agriculture, Fishing & Hunting in Deland, FL?
32720 has the Highest Percentage of Population Employed in Agriculture, Fishing & Hunting in Deland, FL with 0.76%.
What is the Percentage of Population Employed in Agriculture, Fishing & Hunting in Deland, FL?
Percentage of Population Employed in Agriculture, Fishing & Hunting in Deland is 0.61%.
What is the Percentage of Population Employed in Agriculture, Fishing & Hunting in Florida?
Percentage of Population Employed in Agriculture, Fishing & Hunting in Florida is 0.75%.
What is the Percentage of Population Employed in Agriculture, Fishing & Hunting in the United States?
Percentage of Population Employed in Agriculture, Fishing & Hunting in the United States is 1.2%.