Zip Codes with the Highest Percentage of Population Employed in Arts, Entertainment & Recreation in Connecticut
RELATED REPORTS & OPTIONS
Arts, Entertainment & Recreation
Connecticut
Compare Zip Codes
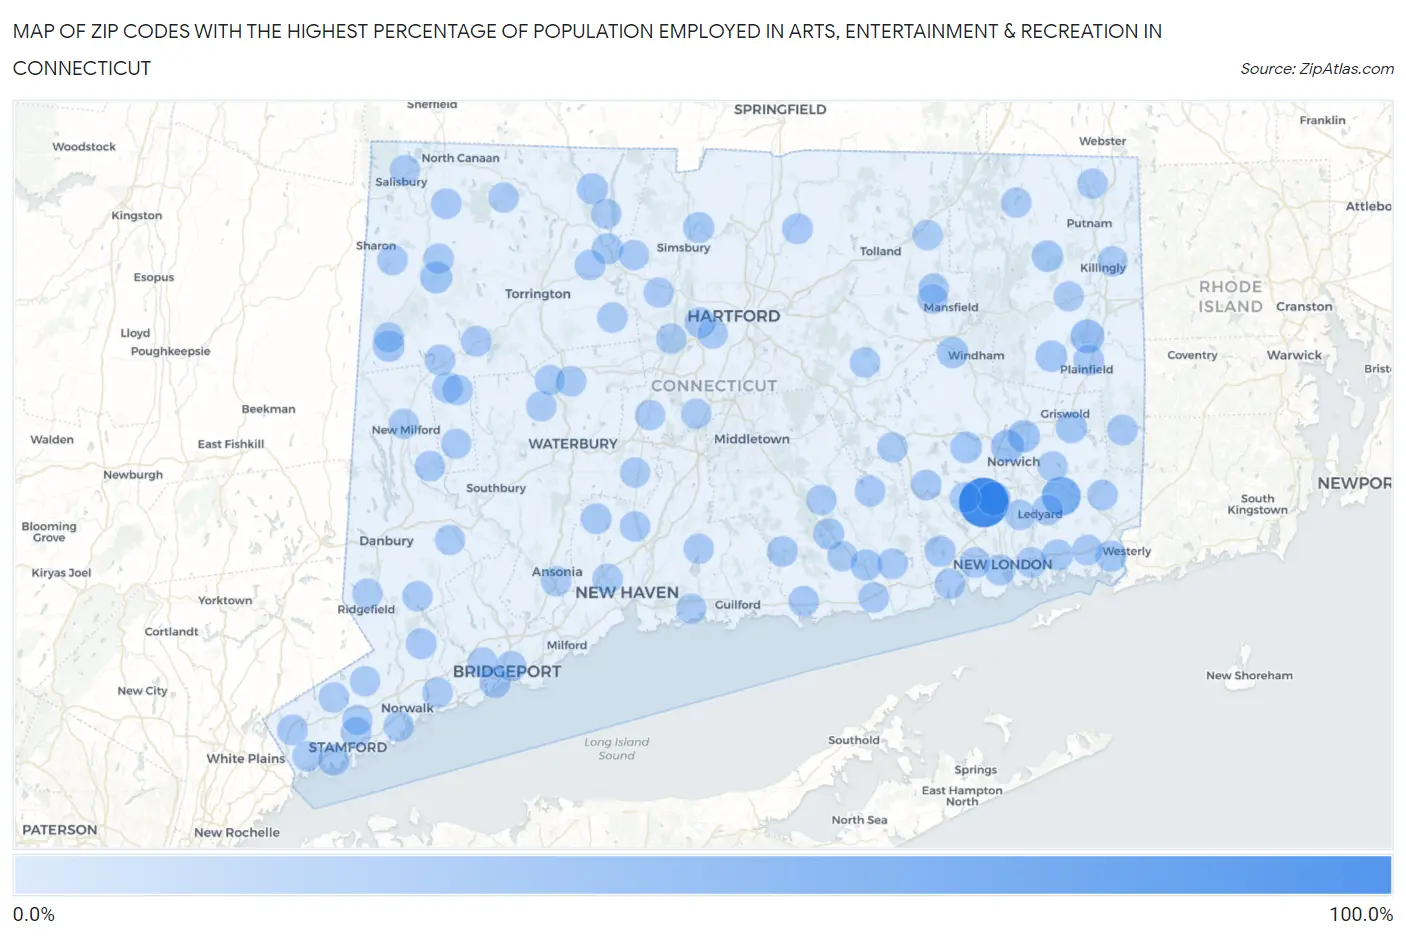
Map of Zip Codes with the Highest Percentage of Population Employed in Arts, Entertainment & Recreation in Connecticut
0.0%
100.0%
Zip Codes with the Highest Percentage of Population Employed in Arts, Entertainment & Recreation in Connecticut
| Zip Code | % Employed | vs State | vs National | |
| 1. | 06353 | 100.0% | 2.5%(+97.5)#1 | 2.1%(+97.9)#6 |
| 2. | 06338 | 45.8% | 2.5%(+43.4)#2 | 2.1%(+43.8)#41 |
| 3. | 06332 | 19.3% | 2.5%(+16.8)#3 | 2.1%(+17.2)#200 |
| 4. | 06382 | 19.0% | 2.5%(+16.6)#4 | 2.1%(+17.0)#207 |
| 5. | 06360 | 16.0% | 2.5%(+13.5)#5 | 2.1%(+13.9)#289 |
| 6. | 06380 | 13.1% | 2.5%(+10.6)#6 | 2.1%(+11.0)#446 |
| 7. | 06753 | 10.7% | 2.5%(+8.24)#7 | 2.1%(+8.63)#625 |
| 8. | 06334 | 8.8% | 2.5%(+6.33)#8 | 2.1%(+6.72)#888 |
| 9. | 06785 | 8.4% | 2.5%(+5.94)#9 | 2.1%(+6.33)#968 |
| 10. | 06351 | 8.3% | 2.5%(+5.86)#10 | 2.1%(+6.25)#981 |
| 11. | 06426 | 8.2% | 2.5%(+5.77)#11 | 2.1%(+6.17)#993 |
| 12. | 06331 | 8.1% | 2.5%(+5.64)#12 | 2.1%(+6.04)#1,025 |
| 13. | 06259 | 7.9% | 2.5%(+5.41)#13 | 2.1%(+5.81)#1,088 |
| 14. | 06226 | 7.7% | 2.5%(+5.22)#14 | 2.1%(+5.61)#1,132 |
| 15. | 06333 | 7.3% | 2.5%(+4.84)#15 | 2.1%(+5.24)#1,228 |
| 16. | 06061 | 7.0% | 2.5%(+4.49)#16 | 2.1%(+4.88)#1,345 |
| 17. | 06605 | 6.9% | 2.5%(+4.42)#17 | 2.1%(+4.81)#1,367 |
| 18. | 06081 | 6.7% | 2.5%(+4.26)#18 | 2.1%(+4.65)#1,407 |
| 19. | 06355 | 6.7% | 2.5%(+4.19)#19 | 2.1%(+4.58)#1,437 |
| 20. | 06065 | 6.5% | 2.5%(+4.06)#20 | 2.1%(+4.46)#1,477 |
| 21. | 06412 | 6.3% | 2.5%(+3.81)#21 | 2.1%(+4.20)#1,595 |
| 22. | 06870 | 5.8% | 2.5%(+3.35)#22 | 2.1%(+3.74)#1,788 |
| 23. | 06379 | 5.8% | 2.5%(+3.31)#23 | 2.1%(+3.71)#1,814 |
| 24. | 06320 | 5.6% | 2.5%(+3.13)#24 | 2.1%(+3.53)#1,903 |
| 25. | 06777 | 5.4% | 2.5%(+2.91)#25 | 2.1%(+3.30)#2,029 |
| 26. | 06883 | 5.4% | 2.5%(+2.87)#26 | 2.1%(+3.27)#2,054 |
| 27. | 06831 | 5.2% | 2.5%(+2.72)#27 | 2.1%(+3.11)#2,157 |
| 28. | 06016 | 5.1% | 2.5%(+2.62)#28 | 2.1%(+3.02)#2,215 |
| 29. | 06524 | 5.1% | 2.5%(+2.61)#29 | 2.1%(+3.01)#2,221 |
| 30. | 06371 | 5.0% | 2.5%(+2.55)#30 | 2.1%(+2.94)#2,272 |
| 31. | 06423 | 4.9% | 2.5%(+2.45)#31 | 2.1%(+2.84)#2,343 |
| 32. | 06378 | 4.9% | 2.5%(+2.41)#32 | 2.1%(+2.80)#2,371 |
| 33. | 06340 | 4.6% | 2.5%(+2.17)#33 | 2.1%(+2.56)#2,585 |
| 34. | 06419 | 4.6% | 2.5%(+2.16)#34 | 2.1%(+2.56)#2,591 |
| 35. | 06359 | 4.6% | 2.5%(+2.16)#35 | 2.1%(+2.56)#2,593 |
| 36. | 06794 | 4.6% | 2.5%(+2.16)#36 | 2.1%(+2.55)#2,595 |
| 37. | 06750 | 4.6% | 2.5%(+2.11)#37 | 2.1%(+2.50)#2,638 |
| 38. | 06374 | 4.6% | 2.5%(+2.10)#38 | 2.1%(+2.49)#2,660 |
| 39. | 06906 | 4.5% | 2.5%(+2.02)#39 | 2.1%(+2.41)#2,752 |
| 40. | 06269 | 4.5% | 2.5%(+2.00)#40 | 2.1%(+2.40)#2,769 |
| 41. | 06057 | 4.4% | 2.5%(+1.97)#41 | 2.1%(+2.36)#2,809 |
| 42. | 06793 | 4.4% | 2.5%(+1.92)#42 | 2.1%(+2.31)#2,849 |
| 43. | 06031 | 4.4% | 2.5%(+1.90)#43 | 2.1%(+2.29)#2,880 |
| 44. | 06384 | 4.3% | 2.5%(+1.80)#44 | 2.1%(+2.20)#2,988 |
| 45. | 06069 | 4.2% | 2.5%(+1.71)#45 | 2.1%(+2.10)#3,098 |
| 46. | 06752 | 4.2% | 2.5%(+1.71)#46 | 2.1%(+2.10)#3,105 |
| 47. | 06475 | 4.1% | 2.5%(+1.67)#47 | 2.1%(+2.06)#3,158 |
| 48. | 06339 | 4.1% | 2.5%(+1.65)#48 | 2.1%(+2.04)#3,173 |
| 49. | 06357 | 4.1% | 2.5%(+1.65)#49 | 2.1%(+2.04)#3,179 |
| 50. | 06013 | 4.0% | 2.5%(+1.55)#50 | 2.1%(+1.94)#3,297 |
| 51. | 06413 | 3.8% | 2.5%(+1.36)#51 | 2.1%(+1.75)#3,575 |
| 52. | 06782 | 3.8% | 2.5%(+1.35)#52 | 2.1%(+1.74)#3,596 |
| 53. | 06107 | 3.8% | 2.5%(+1.34)#53 | 2.1%(+1.74)#3,603 |
| 54. | 06854 | 3.8% | 2.5%(+1.34)#54 | 2.1%(+1.73)#3,614 |
| 55. | 06385 | 3.8% | 2.5%(+1.32)#55 | 2.1%(+1.71)#3,635 |
| 56. | 06420 | 3.7% | 2.5%(+1.23)#56 | 2.1%(+1.62)#3,765 |
| 57. | 06518 | 3.7% | 2.5%(+1.19)#57 | 2.1%(+1.59)#3,825 |
| 58. | 06796 | 3.7% | 2.5%(+1.19)#58 | 2.1%(+1.58)#3,828 |
| 59. | 06880 | 3.6% | 2.5%(+1.14)#59 | 2.1%(+1.54)#3,916 |
| 60. | 06608 | 3.6% | 2.5%(+1.14)#60 | 2.1%(+1.54)#3,919 |
| 61. | 06438 | 3.6% | 2.5%(+1.11)#61 | 2.1%(+1.51)#3,972 |
| 62. | 06001 | 3.5% | 2.5%(+1.04)#62 | 2.1%(+1.44)#4,090 |
| 63. | 06896 | 3.5% | 2.5%(+0.995)#63 | 2.1%(+1.39)#4,204 |
| 64. | 06032 | 3.5% | 2.5%(+0.988)#64 | 2.1%(+1.38)#4,215 |
| 65. | 06370 | 3.4% | 2.5%(+0.904)#65 | 2.1%(+1.30)#4,402 |
| 66. | 06840 | 3.4% | 2.5%(+0.878)#66 | 2.1%(+1.27)#4,457 |
| 67. | 06415 | 3.3% | 2.5%(+0.822)#67 | 2.1%(+1.21)#4,575 |
| 68. | 06365 | 3.3% | 2.5%(+0.809)#68 | 2.1%(+1.20)#4,604 |
| 69. | 06019 | 3.3% | 2.5%(+0.802)#69 | 2.1%(+1.19)#4,620 |
| 70. | 06063 | 3.3% | 2.5%(+0.791)#70 | 2.1%(+1.18)#4,645 |
| 71. | 06248 | 3.2% | 2.5%(+0.760)#71 | 2.1%(+1.15)#4,716 |
| 72. | 06795 | 3.2% | 2.5%(+0.739)#72 | 2.1%(+1.13)#4,767 |
| 73. | 06255 | 3.2% | 2.5%(+0.737)#73 | 2.1%(+1.13)#4,771 |
| 74. | 06335 | 3.2% | 2.5%(+0.726)#74 | 2.1%(+1.12)#4,799 |
| 75. | 06903 | 3.1% | 2.5%(+0.670)#75 | 2.1%(+1.06)#4,938 |
| 76. | 06472 | 3.1% | 2.5%(+0.668)#76 | 2.1%(+1.06)#4,947 |
| 77. | 06417 | 3.1% | 2.5%(+0.613)#77 | 2.1%(+1.01)#5,097 |
| 78. | 06279 | 3.1% | 2.5%(+0.609)#78 | 2.1%(+1.00)#5,111 |
| 79. | 06787 | 3.1% | 2.5%(+0.587)#79 | 2.1%(+0.979)#5,185 |
| 80. | 06110 | 3.0% | 2.5%(+0.573)#80 | 2.1%(+0.966)#5,221 |
| 81. | 06877 | 3.0% | 2.5%(+0.543)#81 | 2.1%(+0.936)#5,308 |
| 82. | 06234 | 3.0% | 2.5%(+0.503)#82 | 2.1%(+0.895)#5,427 |
| 83. | 06515 | 3.0% | 2.5%(+0.487)#83 | 2.1%(+0.880)#5,474 |
| 84. | 06783 | 2.9% | 2.5%(+0.461)#84 | 2.1%(+0.854)#5,550 |
| 85. | 06830 | 2.9% | 2.5%(+0.432)#85 | 2.1%(+0.825)#5,626 |
| 86. | 06757 | 2.9% | 2.5%(+0.428)#86 | 2.1%(+0.821)#5,637 |
| 87. | 06241 | 2.9% | 2.5%(+0.404)#87 | 2.1%(+0.797)#5,717 |
| 88. | 06282 | 2.9% | 2.5%(+0.401)#88 | 2.1%(+0.794)#5,725 |
| 89. | 06489 | 2.9% | 2.5%(+0.378)#89 | 2.1%(+0.771)#5,806 |
| 90. | 06268 | 2.8% | 2.5%(+0.363)#90 | 2.1%(+0.756)#5,861 |
| 91. | 06776 | 2.8% | 2.5%(+0.329)#91 | 2.1%(+0.722)#5,975 |
| 92. | 06418 | 2.8% | 2.5%(+0.315)#92 | 2.1%(+0.707)#6,041 |
| 93. | 06470 | 2.8% | 2.5%(+0.304)#93 | 2.1%(+0.697)#6,065 |
| 94. | 06825 | 2.8% | 2.5%(+0.293)#94 | 2.1%(+0.686)#6,105 |
| 95. | 06907 | 2.8% | 2.5%(+0.292)#95 | 2.1%(+0.685)#6,107 |
| 96. | 06068 | 2.7% | 2.5%(+0.264)#96 | 2.1%(+0.657)#6,222 |
| 97. | 06410 | 2.7% | 2.5%(+0.255)#97 | 2.1%(+0.648)#6,249 |
| 98. | 06058 | 2.7% | 2.5%(+0.250)#98 | 2.1%(+0.643)#6,270 |
| 99. | 06037 | 2.7% | 2.5%(+0.222)#99 | 2.1%(+0.615)#6,369 |
| 100. | 06405 | 2.7% | 2.5%(+0.176)#100 | 2.1%(+0.569)#6,553 |
Common Questions
What are the Top 10 Zip Codes with the Highest Percentage of Population Employed in Arts, Entertainment & Recreation in Connecticut?
Top 10 Zip Codes with the Highest Percentage of Population Employed in Arts, Entertainment & Recreation in Connecticut are:
What zip code has the Highest Percentage of Population Employed in Arts, Entertainment & Recreation in Connecticut?
06353 has the Highest Percentage of Population Employed in Arts, Entertainment & Recreation in Connecticut with 100.0%.
What is the Percentage of Population Employed in Arts, Entertainment & Recreation in the State of Connecticut?
Percentage of Population Employed in Arts, Entertainment & Recreation in Connecticut is 2.5%.
What is the Percentage of Population Employed in Arts, Entertainment & Recreation in the United States?
Percentage of Population Employed in Arts, Entertainment & Recreation in the United States is 2.1%.