Zip Codes with the Highest Percentage of Population Employed in Retail Trade in Greenwich, CT
RELATED REPORTS & OPTIONS
Retail Trade
Greenwich
Compare Zip Codes
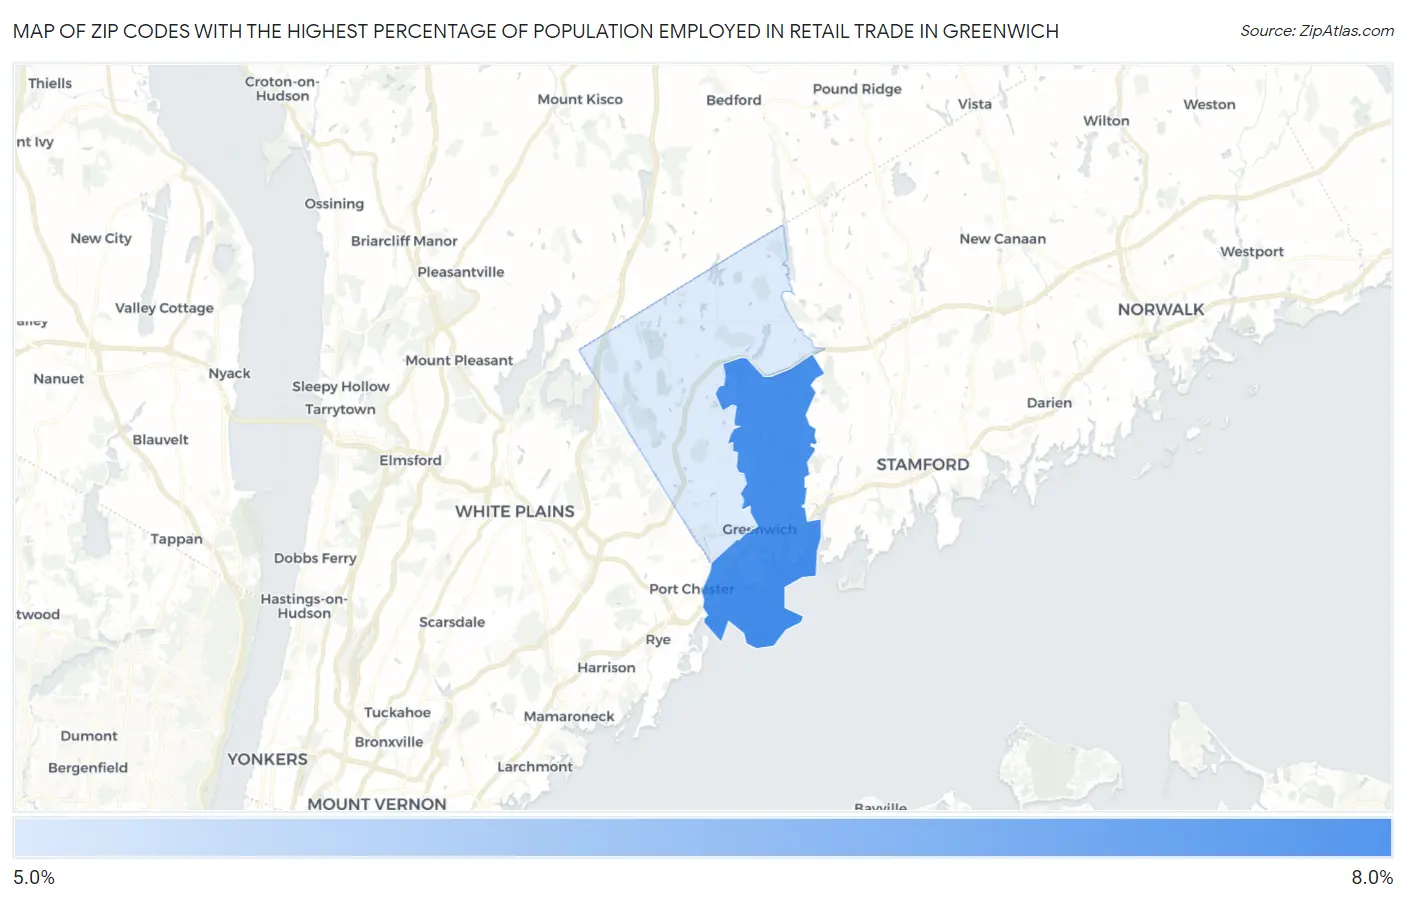
Map of Zip Codes with the Highest Percentage of Population Employed in Retail Trade in Greenwich
0.0%
8.0%
Zip Codes with the Highest Percentage of Population Employed in Retail Trade in Greenwich, CT
| Zip Code | % Employed | vs State | vs National | |
| 1. | 06830 | 6.3% | 10.7%(-4.38)#234 | 11.0%(-4.66)#25,947 |
| 2. | 06831 | 5.3% | 10.7%(-5.40)#253 | 11.0%(-5.68)#27,300 |
1
Common Questions
What are the Top Zip Codes with the Highest Percentage of Population Employed in Retail Trade in Greenwich, CT?
Top Zip Codes with the Highest Percentage of Population Employed in Retail Trade in Greenwich, CT are:
What zip code has the Highest Percentage of Population Employed in Retail Trade in Greenwich, CT?
06830 has the Highest Percentage of Population Employed in Retail Trade in Greenwich, CT with 6.3%.
What is the Percentage of Population Employed in Retail Trade in Greenwich, CT?
Percentage of Population Employed in Retail Trade in Greenwich is 6.6%.
What is the Percentage of Population Employed in Retail Trade in Connecticut?
Percentage of Population Employed in Retail Trade in Connecticut is 10.7%.
What is the Percentage of Population Employed in Retail Trade in the United States?
Percentage of Population Employed in Retail Trade in the United States is 11.0%.