Zip Codes with the Highest Percentage of Population Employed in Professional & Scientific Services in Englewood, CO
RELATED REPORTS & OPTIONS
Professional & Scientific Services
Englewood
Compare Zip Codes
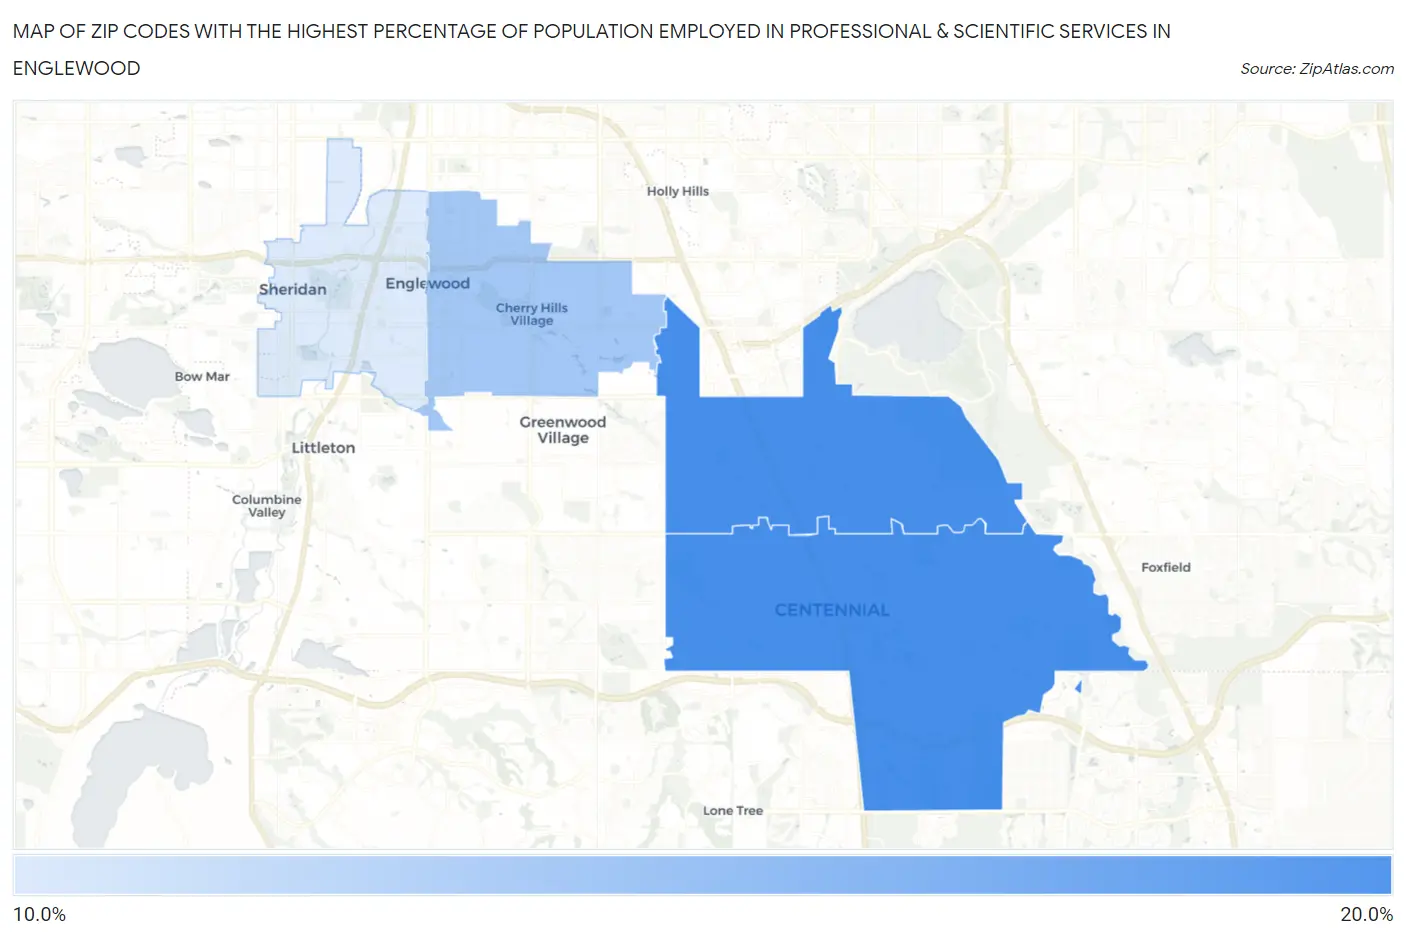
Map of Zip Codes with the Highest Percentage of Population Employed in Professional & Scientific Services in Englewood
10.5%
17.3%
Zip Codes with the Highest Percentage of Population Employed in Professional & Scientific Services in Englewood, CO
| Zip Code | % Employed | vs State | vs National | |
| 1. | 80112 | 17.3% | 10.6%(+6.64)#39 | 7.8%(+9.43)#1,304 |
| 2. | 80111 | 17.2% | 10.6%(+6.62)#40 | 7.8%(+9.40)#1,308 |
| 3. | 80113 | 13.1% | 10.6%(+2.46)#94 | 7.8%(+5.25)#2,669 |
| 4. | 80110 | 10.5% | 10.6%(-0.114)#142 | 7.8%(+2.67)#4,182 |
1
Common Questions
What are the Top 3 Zip Codes with the Highest Percentage of Population Employed in Professional & Scientific Services in Englewood, CO?
Top 3 Zip Codes with the Highest Percentage of Population Employed in Professional & Scientific Services in Englewood, CO are:
What zip code has the Highest Percentage of Population Employed in Professional & Scientific Services in Englewood, CO?
80112 has the Highest Percentage of Population Employed in Professional & Scientific Services in Englewood, CO with 17.3%.
What is the Percentage of Population Employed in Professional & Scientific Services in Englewood, CO?
Percentage of Population Employed in Professional & Scientific Services in Englewood is 11.5%.
What is the Percentage of Population Employed in Professional & Scientific Services in Colorado?
Percentage of Population Employed in Professional & Scientific Services in Colorado is 10.6%.
What is the Percentage of Population Employed in Professional & Scientific Services in the United States?
Percentage of Population Employed in Professional & Scientific Services in the United States is 7.8%.