Zip Codes with the Highest Percentage of Population Employed in Agriculture, Fishing & Hunting in Vacaville, CA
RELATED REPORTS & OPTIONS
Agriculture, Fishing & Hunting
Vacaville
Compare Zip Codes
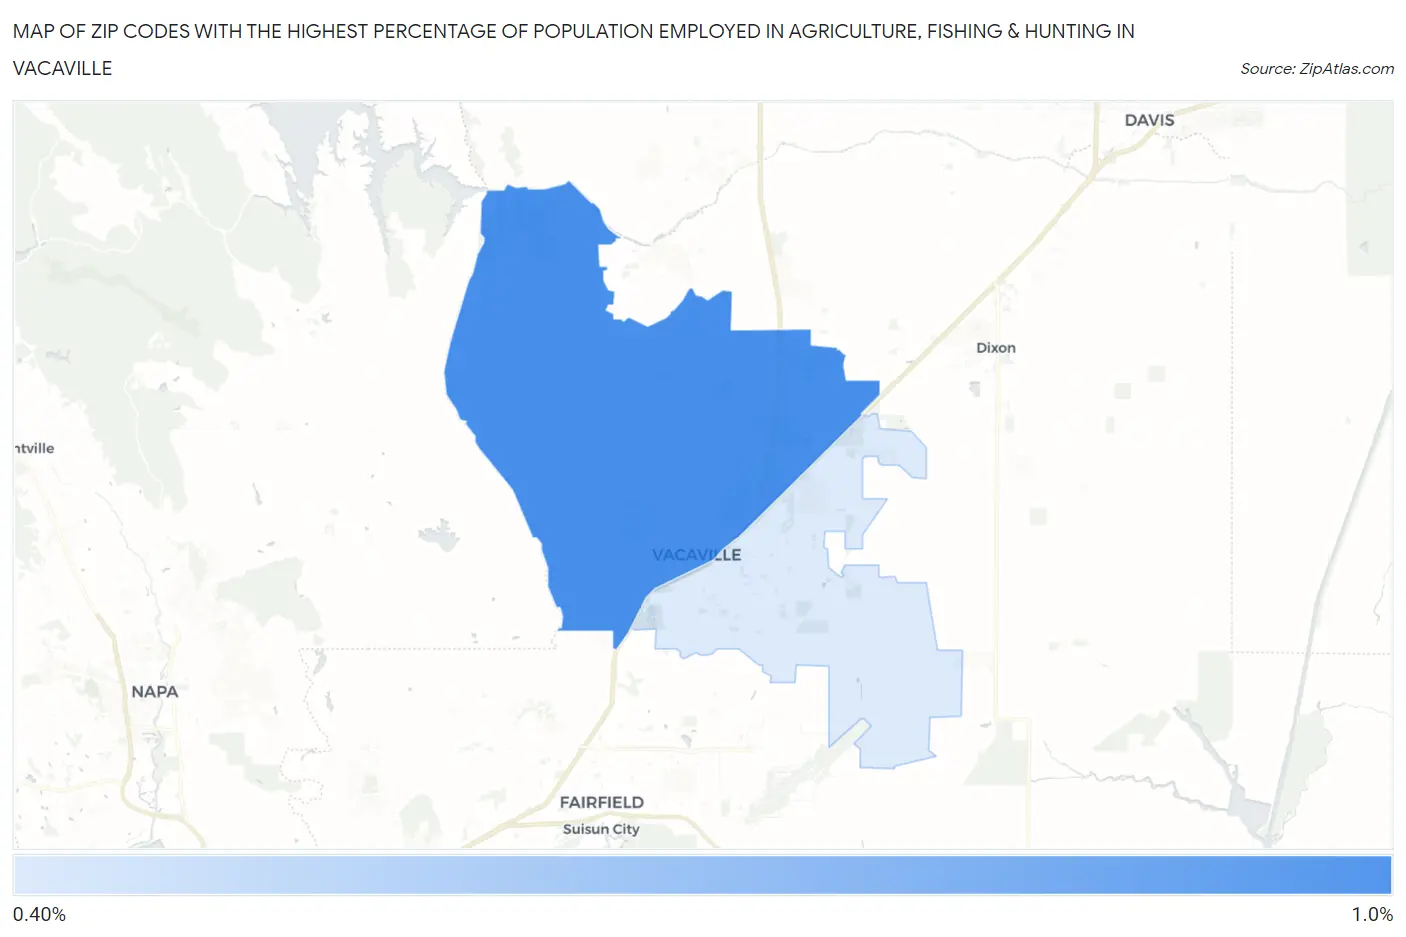
Map of Zip Codes with the Highest Percentage of Population Employed in Agriculture, Fishing & Hunting in Vacaville
0.0%
1.0%
Zip Codes with the Highest Percentage of Population Employed in Agriculture, Fishing & Hunting in Vacaville, CA
| Zip Code | % Employed | vs State | vs National | |
| 1. | 95688 | 0.91% | 2.0%(-1.07)#749 | 1.2%(-0.288)#16,648 |
| 2. | 95687 | 0.46% | 2.0%(-1.53)#994 | 1.2%(-0.741)#19,626 |
1
Common Questions
What are the Top Zip Codes with the Highest Percentage of Population Employed in Agriculture, Fishing & Hunting in Vacaville, CA?
Top Zip Codes with the Highest Percentage of Population Employed in Agriculture, Fishing & Hunting in Vacaville, CA are:
What zip code has the Highest Percentage of Population Employed in Agriculture, Fishing & Hunting in Vacaville, CA?
95688 has the Highest Percentage of Population Employed in Agriculture, Fishing & Hunting in Vacaville, CA with 0.91%.
What is the Percentage of Population Employed in Agriculture, Fishing & Hunting in Vacaville, CA?
Percentage of Population Employed in Agriculture, Fishing & Hunting in Vacaville is 0.31%.
What is the Percentage of Population Employed in Agriculture, Fishing & Hunting in California?
Percentage of Population Employed in Agriculture, Fishing & Hunting in California is 2.0%.
What is the Percentage of Population Employed in Agriculture, Fishing & Hunting in the United States?
Percentage of Population Employed in Agriculture, Fishing & Hunting in the United States is 1.2%.