Zip Codes with the Highest Percentage of Population Employed in Agriculture, Fishing & Hunting in San Luis Obispo, CA
RELATED REPORTS & OPTIONS
Agriculture, Fishing & Hunting
San Luis Obispo
Compare Zip Codes
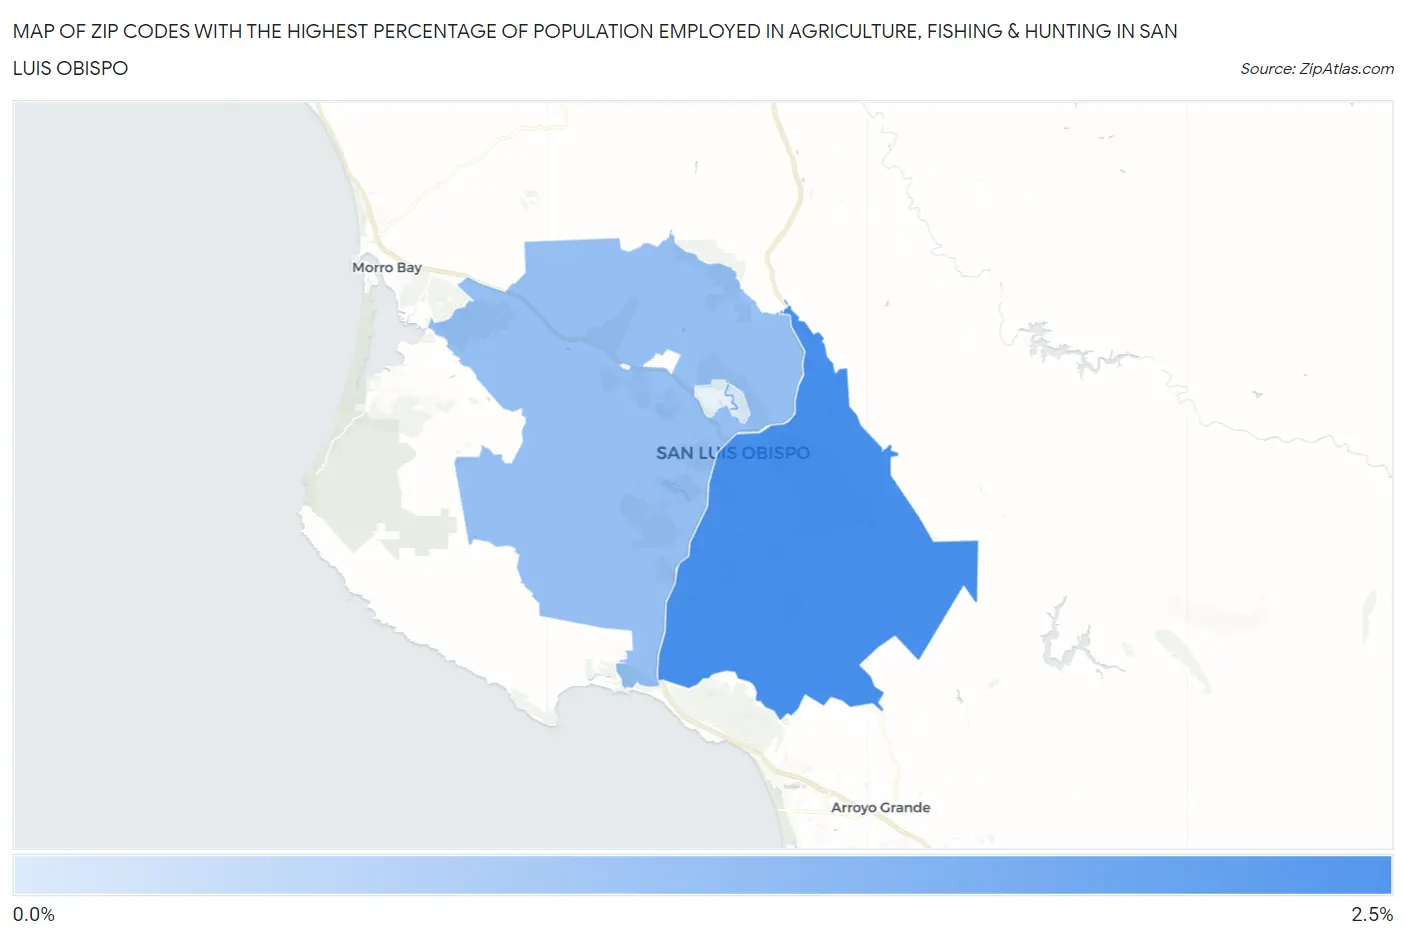
Map of Zip Codes with the Highest Percentage of Population Employed in Agriculture, Fishing & Hunting in San Luis Obispo
0.0%
2.5%
Zip Codes with the Highest Percentage of Population Employed in Agriculture, Fishing & Hunting in San Luis Obispo, CA
| Zip Code | % Employed | vs State | vs National | |
| 1. | 93401 | 2.3% | 2.0%(+0.312)#540 | 1.2%(+1.10)#12,033 |
| 2. | 93405 | 1.1% | 2.0%(-0.840)#699 | 1.2%(-0.054)#15,611 |
| 3. | 93410 | 0.11% | 2.0%(-1.87)#1,318 | 1.2%(-1.09)#23,534 |
1
Common Questions
What are the Top 3 Zip Codes with the Highest Percentage of Population Employed in Agriculture, Fishing & Hunting in San Luis Obispo, CA?
Top 3 Zip Codes with the Highest Percentage of Population Employed in Agriculture, Fishing & Hunting in San Luis Obispo, CA are:
What zip code has the Highest Percentage of Population Employed in Agriculture, Fishing & Hunting in San Luis Obispo, CA?
93401 has the Highest Percentage of Population Employed in Agriculture, Fishing & Hunting in San Luis Obispo, CA with 2.3%.
What is the Percentage of Population Employed in Agriculture, Fishing & Hunting in San Luis Obispo, CA?
Percentage of Population Employed in Agriculture, Fishing & Hunting in San Luis Obispo is 1.7%.
What is the Percentage of Population Employed in Agriculture, Fishing & Hunting in California?
Percentage of Population Employed in Agriculture, Fishing & Hunting in California is 2.0%.
What is the Percentage of Population Employed in Agriculture, Fishing & Hunting in the United States?
Percentage of Population Employed in Agriculture, Fishing & Hunting in the United States is 1.2%.