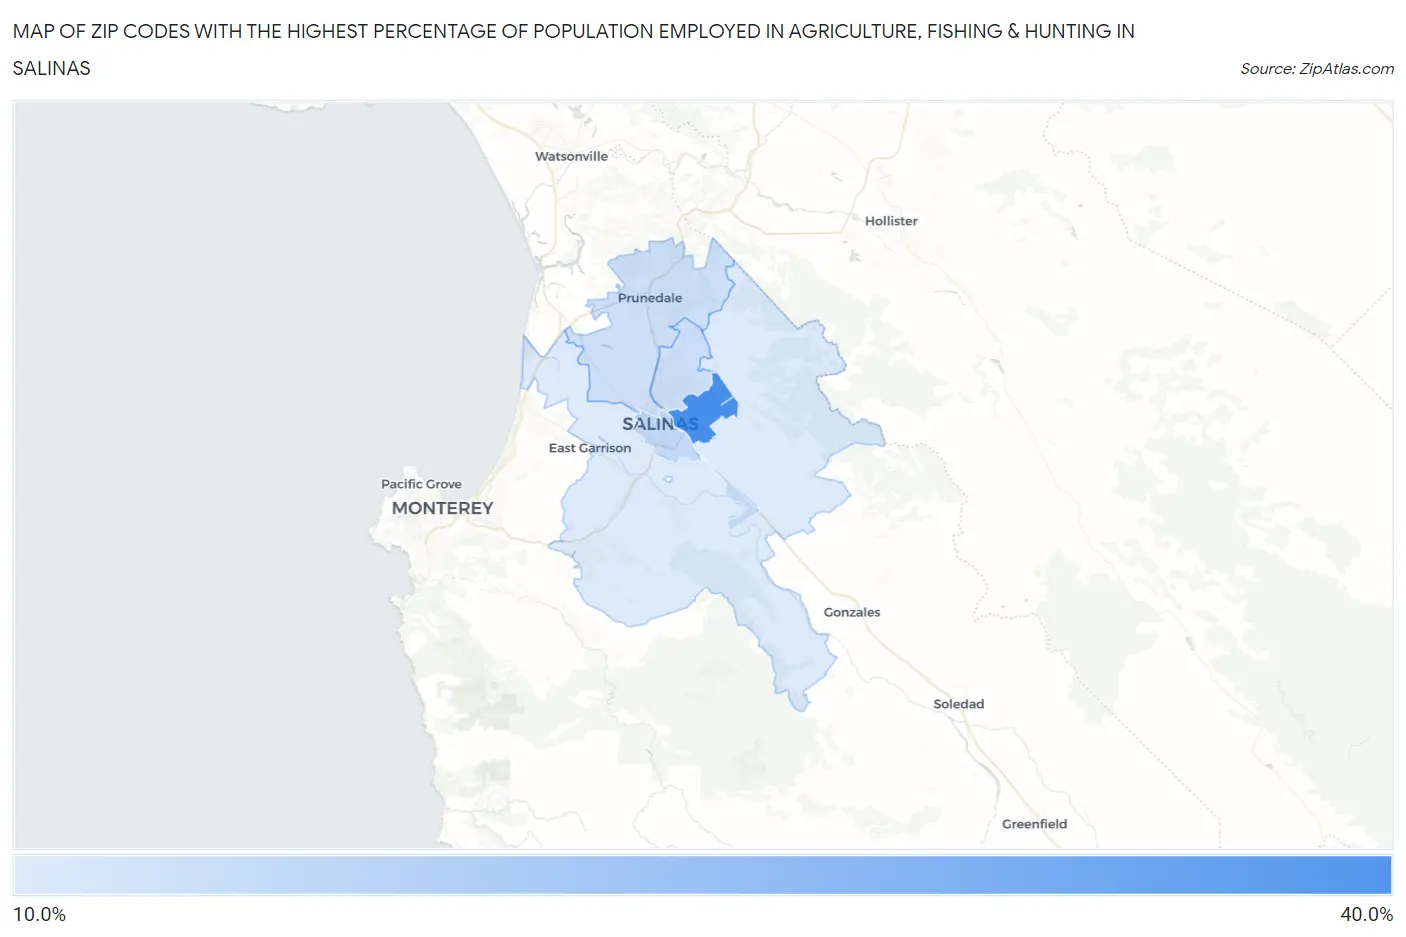
Zip Codes with the Highest Percentage of Population Employed in Agriculture, Fishing & Hunting in Salinas, CA
RELATED REPORTS & OPTIONS
Agriculture, Fishing & Hunting
Salinas
Compare Zip Codes
Map of Zip Codes with the Highest Percentage of Population Employed in Agriculture, Fishing & Hunting in Salinas
0.0%
40.0%
Zip Codes with the Highest Percentage of Population Employed in Agriculture, Fishing & Hunting in Salinas, CA
| Zip Code | % Employed | vs State | vs National | |
| 1. | 93905 | 30.9% | 2.0%(+29.0)#79 | 1.2%(+29.7)#862 |
| 2. | 93901 | 13.5% | 2.0%(+11.5)#207 | 1.2%(+12.3)#3,018 |
| 3. | 93906 | 12.5% | 2.0%(+10.5)#223 | 1.2%(+11.3)#3,343 |
| 4. | 93907 | 12.1% | 2.0%(+10.1)#228 | 1.2%(+10.9)#3,477 |
| 5. | 93908 | 10.1% | 2.0%(+8.09)#259 | 1.2%(+8.88)#4,273 |
1
Common Questions
What are the Top 3 Zip Codes with the Highest Percentage of Population Employed in Agriculture, Fishing & Hunting in Salinas, CA?
Top 3 Zip Codes with the Highest Percentage of Population Employed in Agriculture, Fishing & Hunting in Salinas, CA are:
What zip code has the Highest Percentage of Population Employed in Agriculture, Fishing & Hunting in Salinas, CA?
93905 has the Highest Percentage of Population Employed in Agriculture, Fishing & Hunting in Salinas, CA with 30.9%.
What is the Percentage of Population Employed in Agriculture, Fishing & Hunting in Salinas, CA?
Percentage of Population Employed in Agriculture, Fishing & Hunting in Salinas is 19.3%.
What is the Percentage of Population Employed in Agriculture, Fishing & Hunting in California?
Percentage of Population Employed in Agriculture, Fishing & Hunting in California is 2.0%.
What is the Percentage of Population Employed in Agriculture, Fishing & Hunting in the United States?
Percentage of Population Employed in Agriculture, Fishing & Hunting in the United States is 1.2%.