Zip Codes with the Highest Percentage of Population Employed in Agriculture, Fishing & Hunting in Oroville, CA
RELATED REPORTS & OPTIONS
Agriculture, Fishing & Hunting
Oroville
Compare Zip Codes
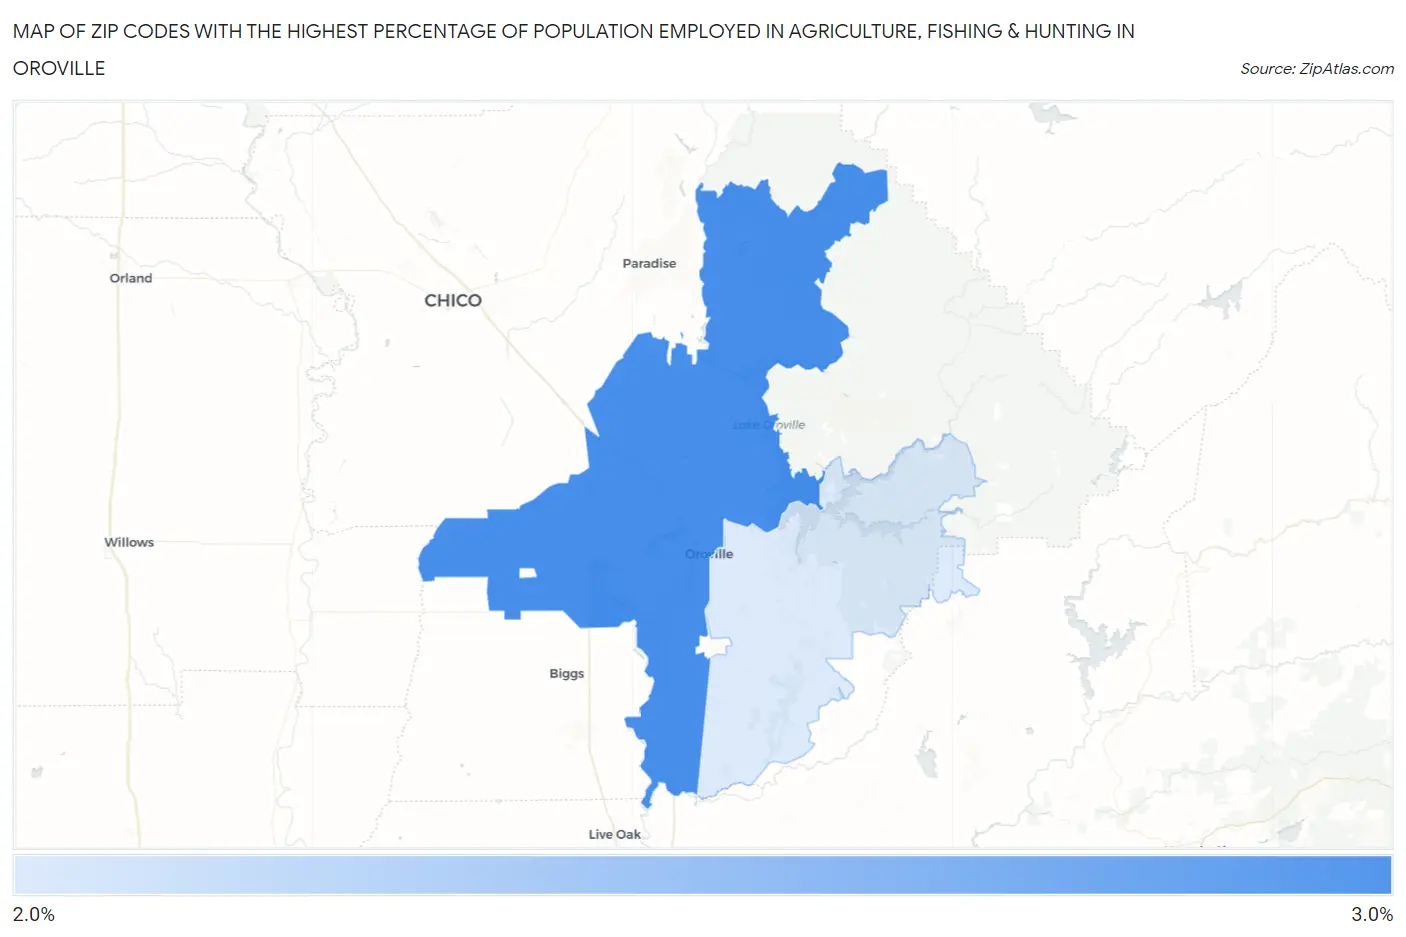
Map of Zip Codes with the Highest Percentage of Population Employed in Agriculture, Fishing & Hunting in Oroville
0.0%
3.0%
Zip Codes with the Highest Percentage of Population Employed in Agriculture, Fishing & Hunting in Oroville, CA
| Zip Code | % Employed | vs State | vs National | |
| 1. | 95965 | 2.9% | 2.0%(+0.951)#489 | 1.2%(+1.74)#10,694 |
| 2. | 95966 | 2.4% | 2.0%(+0.440)#526 | 1.2%(+1.23)#11,736 |
1
Common Questions
What are the Top Zip Codes with the Highest Percentage of Population Employed in Agriculture, Fishing & Hunting in Oroville, CA?
Top Zip Codes with the Highest Percentage of Population Employed in Agriculture, Fishing & Hunting in Oroville, CA are:
What zip code has the Highest Percentage of Population Employed in Agriculture, Fishing & Hunting in Oroville, CA?
95965 has the Highest Percentage of Population Employed in Agriculture, Fishing & Hunting in Oroville, CA with 2.9%.
What is the Percentage of Population Employed in Agriculture, Fishing & Hunting in Oroville, CA?
Percentage of Population Employed in Agriculture, Fishing & Hunting in Oroville is 2.6%.
What is the Percentage of Population Employed in Agriculture, Fishing & Hunting in California?
Percentage of Population Employed in Agriculture, Fishing & Hunting in California is 2.0%.
What is the Percentage of Population Employed in Agriculture, Fishing & Hunting in the United States?
Percentage of Population Employed in Agriculture, Fishing & Hunting in the United States is 1.2%.