Zip Codes with the Highest Percentage of Population Employed in Arts, Entertainment & Recreation in Novato, CA
RELATED REPORTS & OPTIONS
Arts, Entertainment & Recreation
Novato
Compare Zip Codes
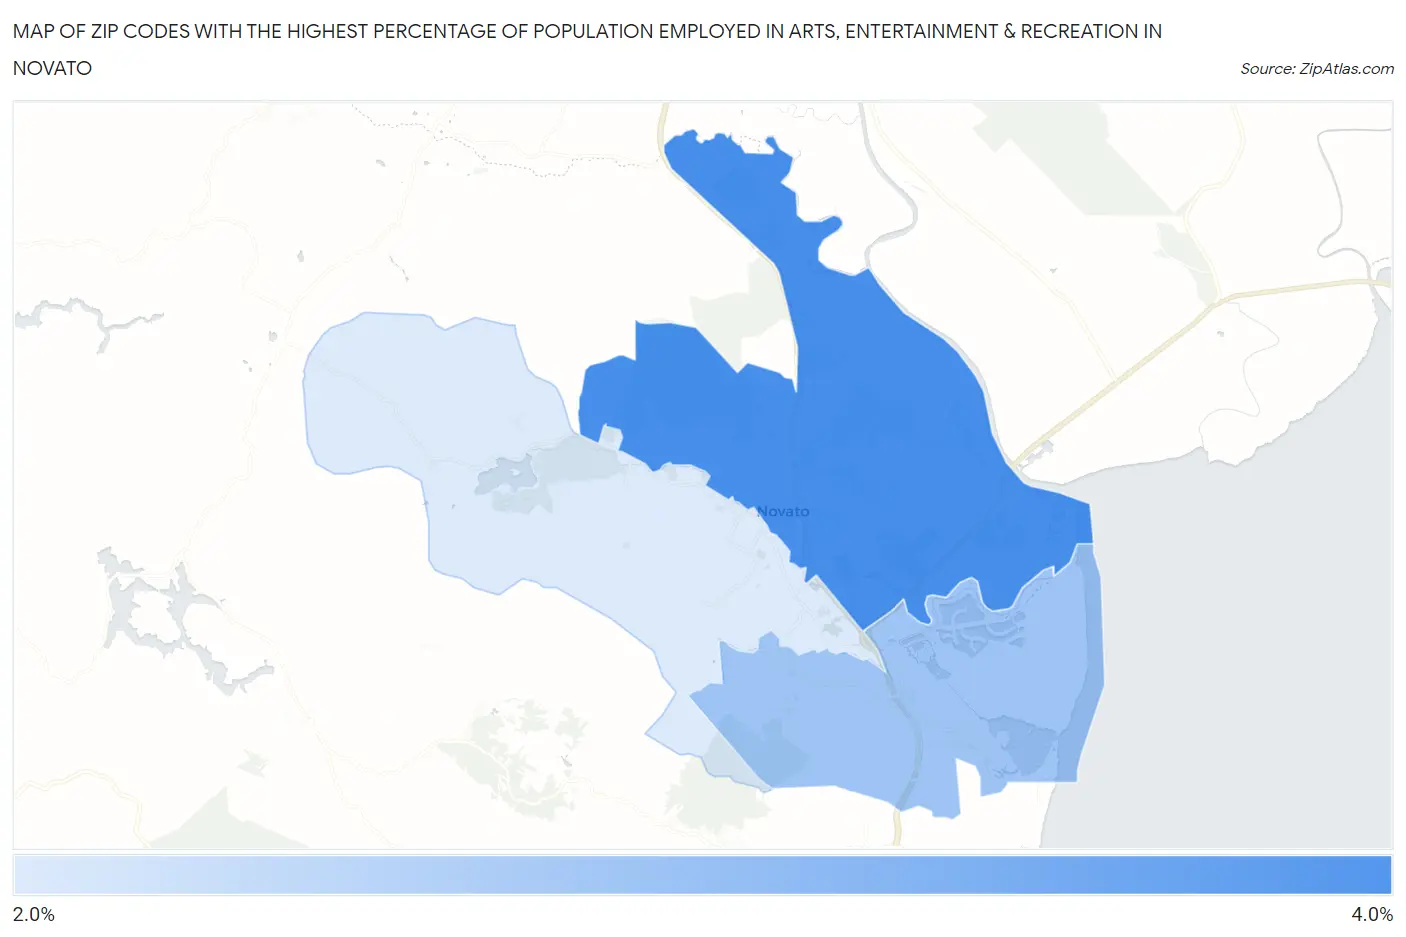
Map of Zip Codes with the Highest Percentage of Population Employed in Arts, Entertainment & Recreation in Novato
0.0%
4.0%
Zip Codes with the Highest Percentage of Population Employed in Arts, Entertainment & Recreation in Novato, CA
| Zip Code | % Employed | vs State | vs National | |
| 1. | 94945 | 3.4% | 2.6%(+0.852)#431 | 2.1%(+1.32)#4,344 |
| 2. | 94949 | 3.0% | 2.6%(+0.422)#530 | 2.1%(+0.893)#5,433 |
| 3. | 94947 | 2.7% | 2.6%(+0.124)#610 | 2.1%(+0.595)#6,451 |
1
Common Questions
What are the Top Zip Codes with the Highest Percentage of Population Employed in Arts, Entertainment & Recreation in Novato, CA?
Top Zip Codes with the Highest Percentage of Population Employed in Arts, Entertainment & Recreation in Novato, CA are:
What zip code has the Highest Percentage of Population Employed in Arts, Entertainment & Recreation in Novato, CA?
94945 has the Highest Percentage of Population Employed in Arts, Entertainment & Recreation in Novato, CA with 3.4%.
What is the Percentage of Population Employed in Arts, Entertainment & Recreation in Novato, CA?
Percentage of Population Employed in Arts, Entertainment & Recreation in Novato is 3.1%.
What is the Percentage of Population Employed in Arts, Entertainment & Recreation in California?
Percentage of Population Employed in Arts, Entertainment & Recreation in California is 2.6%.
What is the Percentage of Population Employed in Arts, Entertainment & Recreation in the United States?
Percentage of Population Employed in Arts, Entertainment & Recreation in the United States is 2.1%.