Zip Codes with the Highest Percentage of Population Employed in Agriculture, Fishing & Hunting in Monterey Park, CA
RELATED REPORTS & OPTIONS
Select to Compare
Select to Compare
Compare Zip Codes
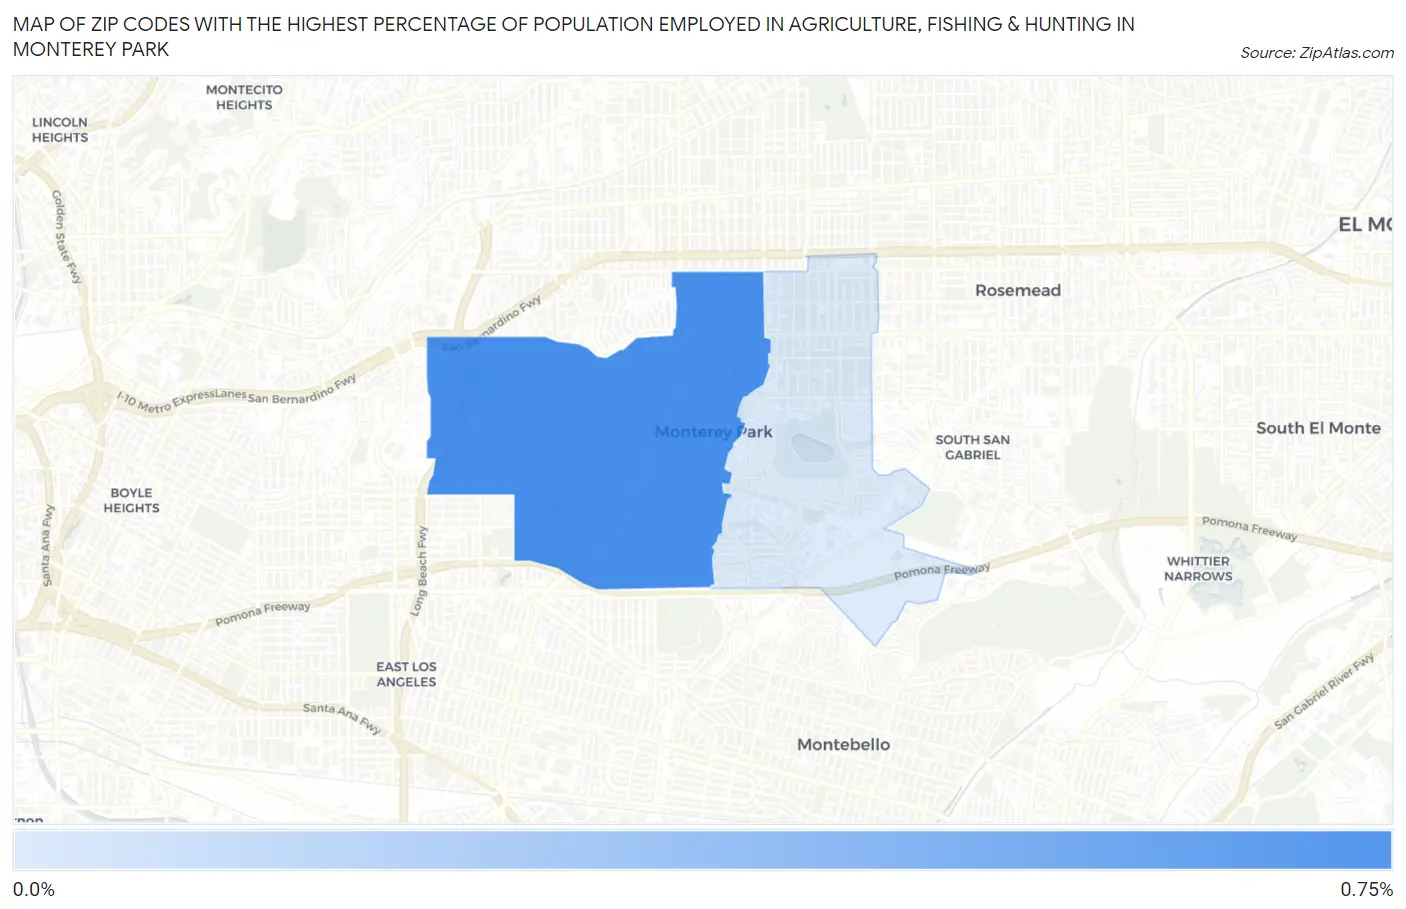
Map of Zip Codes with the Highest Percentage of Population Employed in Agriculture, Fishing & Hunting in Monterey Park
0.0%
0.60%
Zip Codes with the Highest Percentage of Population Employed in Agriculture, Fishing & Hunting in Monterey Park, CA
| Zip Code | % Employed | vs State | vs National | |
| 1. | 91754 | 0.60% | 2.0%(-1.39)#899 | 1.2%(-0.602)#18,507 |
1
Common Questions
What are the Top Zip Codes with the Highest Percentage of Population Employed in Agriculture, Fishing & Hunting in Monterey Park, CA?
Top Zip Codes with the Highest Percentage of Population Employed in Agriculture, Fishing & Hunting in Monterey Park, CA are:
What zip code has the Highest Percentage of Population Employed in Agriculture, Fishing & Hunting in Monterey Park, CA?
91754 has the Highest Percentage of Population Employed in Agriculture, Fishing & Hunting in Monterey Park, CA with 0.60%.
What is the Percentage of Population Employed in Agriculture, Fishing & Hunting in Monterey Park, CA?
Percentage of Population Employed in Agriculture, Fishing & Hunting in Monterey Park is 0.33%.
What is the Percentage of Population Employed in Agriculture, Fishing & Hunting in California?
Percentage of Population Employed in Agriculture, Fishing & Hunting in California is 2.0%.
What is the Percentage of Population Employed in Agriculture, Fishing & Hunting in the United States?
Percentage of Population Employed in Agriculture, Fishing & Hunting in the United States is 1.2%.