Zip Codes with the Highest Percentage of Population Employed in Arts, Entertainment & Recreation in Modesto, CA

RELATED REPORTS & OPTIONS

Arts, Entertainment & Recreation
Population
Families and Households
Female Fertility
Female Fertility (Unmarried)
Race (Community Size)
Race (Percentage)
Ancestry (Community Size)
AfghanAfricanAmericanApacheArabArgentineanArmenianAssyrian / Chaldean / SyriacAustrianBangladeshiBasqueBelgianBhutaneseBlackfeetBrazilianBritishBurmeseCanadianCelticCentral AmericanCentral American IndianCherokeeCheyenneChickasawChippewaChoctawColombianCreekCroatianCubanCzechCzechoslovakianDanishDominicanDutchDutch West IndianEastern EuropeanEcuadorianEgyptianEnglishEthiopianEuropeanFilipinoFinnishFrenchFrench CanadianGermanGreekGuamanian / ChamorroGuatemalanHonduranHungarianIndian (Asian)IranianIraqiIrishIsraeliItalianJamaicanJapaneseKoreanLaotianLatvianLebaneseMalaysianMalteseMexicanMexican American IndianNative HawaiianNavajoNew ZealanderNicaraguanNigerianNorthern EuropeanNorwegianPaiutePakistaniPalestinianPanamanianPennsylvania GermanPeruvianPimaPolishPortuguesePuebloPuerto RicanRomanianRussianSalvadoranSamoanScandinavianScotch-IrishScottishSeminoleSlovakSouth AmericanSpaniardSpanishSri LankanSubsaharan AfricanSwedishSwissSyrianThaiTonganTurkishUkrainianWelshYaquiYugoslavian
Ancestry (Percentage)
AfghanAfricanAmericanApacheArabArgentineanArmenianAssyrian / Chaldean / SyriacAustrianBangladeshiBasqueBelgianBhutaneseBlackfeetBrazilianBritishBurmeseCanadianCelticCentral AmericanCentral American IndianCherokeeCheyenneChickasawChippewaChoctawColombianCreekCroatianCubanCzechCzechoslovakianDanishDominicanDutchDutch West IndianEastern EuropeanEcuadorianEgyptianEnglishEthiopianEuropeanFilipinoFinnishFrenchFrench CanadianGermanGreekGuamanian / ChamorroGuatemalanHonduranHungarianIndian (Asian)IranianIraqiIrishIsraeliItalianJamaicanJapaneseKoreanLaotianLatvianLebaneseMalaysianMalteseMexicanMexican American IndianNative HawaiianNavajoNew ZealanderNicaraguanNigerianNorthern EuropeanNorwegianPaiutePakistaniPalestinianPanamanianPennsylvania GermanPeruvianPimaPolishPortuguesePuebloPuerto RicanRomanianRussianSalvadoranSamoanScandinavianScotch-IrishScottishSeminoleSlovakSouth AmericanSpaniardSpanishSri LankanSubsaharan AfricanSwedishSwissSyrianThaiTonganTurkishUkrainianWelshYaquiYugoslavian
Immigrant Origin (Total)
Immigrant Origin (Percentage)
Income
Income (Families)
Income (Households)
Poverty
Poverty (Families)
Unemployment
Employment Occupations
Employment Industries
Employer Class
Commute Time
Commute Means
School Enrollment
Education by Degree Field
Occupancy
Finances
Physical Characteristics
Modesto
States
California Cities
AlamedaAlhambraAnaheimAntiochApple ValleyArcadiaAuburnBakersfieldBerkeleyBeverly HillsBreaBuena ParkBurbankCamarilloCanoga ParkCanyon CountryCarlsbadCarsonCastro ValleyChicoChinoChula VistaCitrus HeightsClovisComptonConcordCoronaCosta MesaCovinaCulver CityDaly CityDanvilleDavisDesert Hot SpringsDowneyDuarteEl CajonEl MonteElk GroveEncinoEscondidoEurekaFairfieldFontanaFremontFresnoFullertonGarden GroveGardenaGlendaleGlendoraGrass ValleyHaywardHemetHesperiaHuntington BeachIndioInglewoodIrvineLa JollaLa MesaLa MiradaLa PuenteLake ElsinoreLakewoodLancasterLivermoreLodiLoma LindaLong BeachLos AltosLos AngelesLos GatosMaderaMalibuMantecaMenifeeMercedMission ViejoModestoMontereyMonterey ParkMoragaMoreno ValleyMountain ViewMurrietaNapaNewport BeachNorth HollywoodNorthridgeNovatoOaklandOceansideOntarioOrangeOrovilleOxnardPalm DesertPalm SpringsPalmdalePalo AltoPasadenaPerrisPetalumaPleasantonPomonaRancho CordovaRancho CucamongaReddingRedlandsRedondo BeachRedwood CityRialtoRichmondRiversideRocklinRosevilleSacramentoSalinasSan BernardinoSan ClementeSan DiegoSan FranciscoSan GabrielSan JacintoSan JoseSan LeandroSan Luis ObispoSan MarcosSan MateoSan PedroSan RafaelSan RamonSanta AnaSanta BarbaraSanta ClaraSanta ClaritaSanta CruzSanta MariaSanta MonicaSanta RosaSherman OaksSimi ValleySpring ValleyStocktonSunnyvaleTemeculaThousand OaksTorranceTrabuco CanyonTracyTurlockTustinUplandVacavilleValenciaVallejoVan NuysVenturaVictorvilleVisaliaVistaWalnut CreekWest CovinaWest SacramentoWhittierWoodlandWoodland HillsYorba LindaYuba City
Compare Zip Codes
Comparison Subject

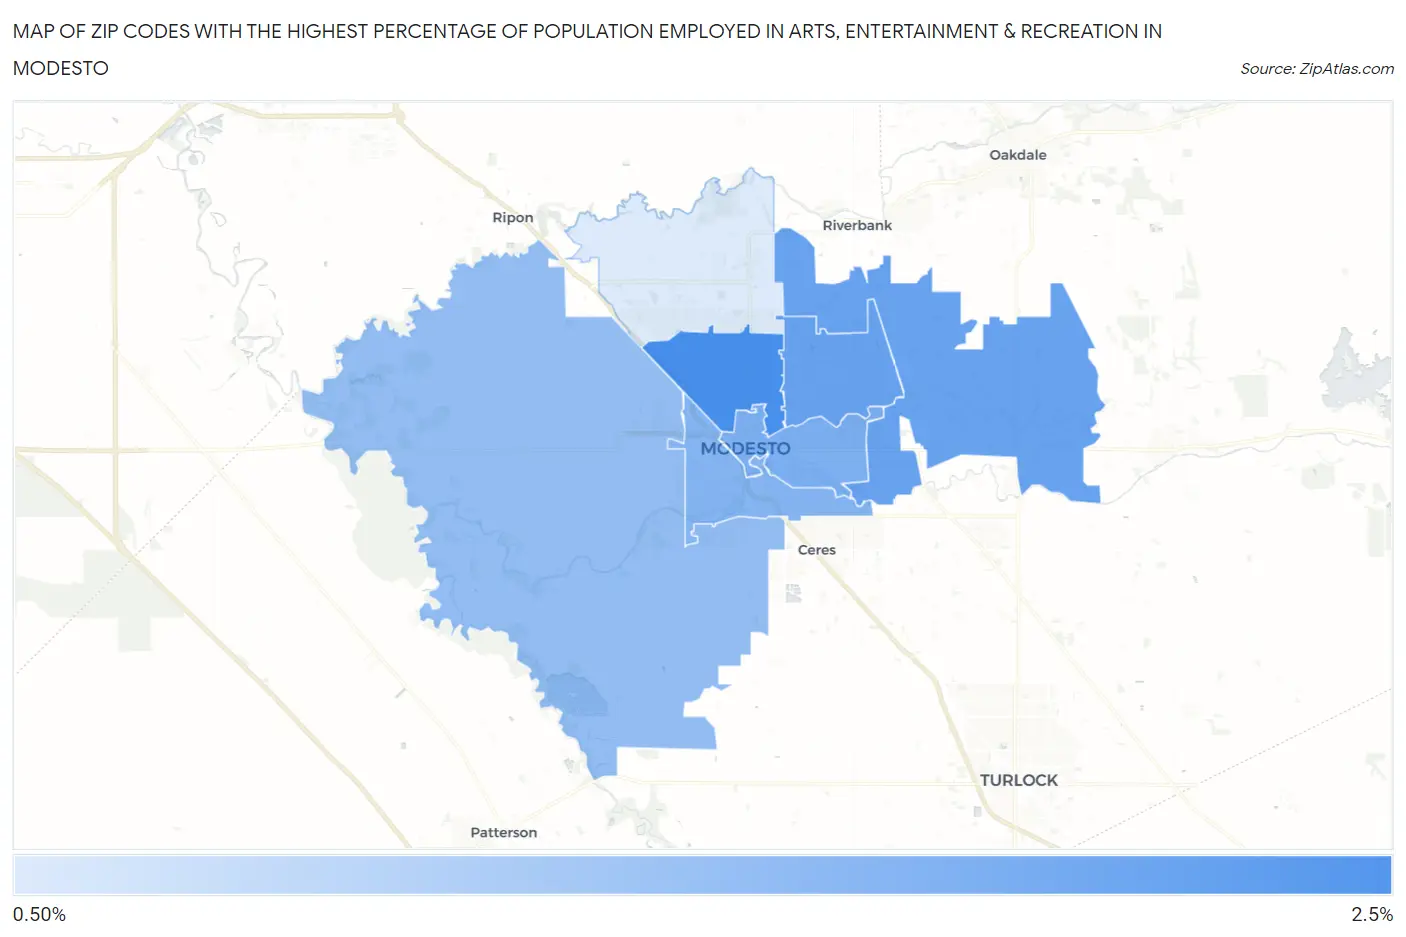
Map of Zip Codes with the Highest Percentage of Population Employed in Arts, Entertainment & Recreation in Modesto

0.0%
2.5%
Zip Codes with the Highest Percentage of Population Employed in Arts, Entertainment & Recreation in Modesto Map

Zip Codes with the Highest Percentage of Population Employed in Arts, Entertainment & Recreation in Modesto, CA

Zip Code % Employed vs State vs National
1.953502.3%2.6%(-0.295)#7942.1%(+0.176)#8,334
2.953571.9%2.6%(-0.665)#9642.1%(-0.194)#10,442
3.953551.9%2.6%(-0.666)#9662.1%(-0.195)#10,450
4.953541.6%2.6%(-0.914)#1,0672.1%(-0.442)#12,162
5.953511.5%2.6%(-1.02)#1,1112.1%(-0.553)#13,039
6.953581.4%2.6%(-1.20)#1,1792.1%(-0.732)#14,354
7.953560.50%2.6%(-2.05)#1,3982.1%(-1.58)#20,475

Common Questions

What are the Top 5 Zip Codes with the Highest Percentage of Population Employed in Arts, Entertainment & Recreation in Modesto, CA?
Top 5 Zip Codes with the Highest Percentage of Population Employed in Arts, Entertainment & Recreation in Modesto, CA are:
#1
2.3%
#2
1.9%
#3
1.9%
#4
1.6%
#5
1.5%
What zip code has the Highest Percentage of Population Employed in Arts, Entertainment & Recreation in Modesto, CA?
95350 has the Highest Percentage of Population Employed in Arts, Entertainment & Recreation in Modesto, CA with 2.3%.
What is the Percentage of Population Employed in Arts, Entertainment & Recreation in Modesto, CA?
Percentage of Population Employed in Arts, Entertainment & Recreation in Modesto is 1.7%.
What is the Percentage of Population Employed in Arts, Entertainment & Recreation in California?
Percentage of Population Employed in Arts, Entertainment & Recreation in California is 2.6%.
What is the Percentage of Population Employed in Arts, Entertainment & Recreation in the United States?
Percentage of Population Employed in Arts, Entertainment & Recreation in the United States is 2.1%.