Zip Codes with the Highest Percentage of Population Employed in Transportation & Warehousing in Los Altos, CA
RELATED REPORTS & OPTIONS
Transportation & Warehousing
Los Altos
Compare Zip Codes
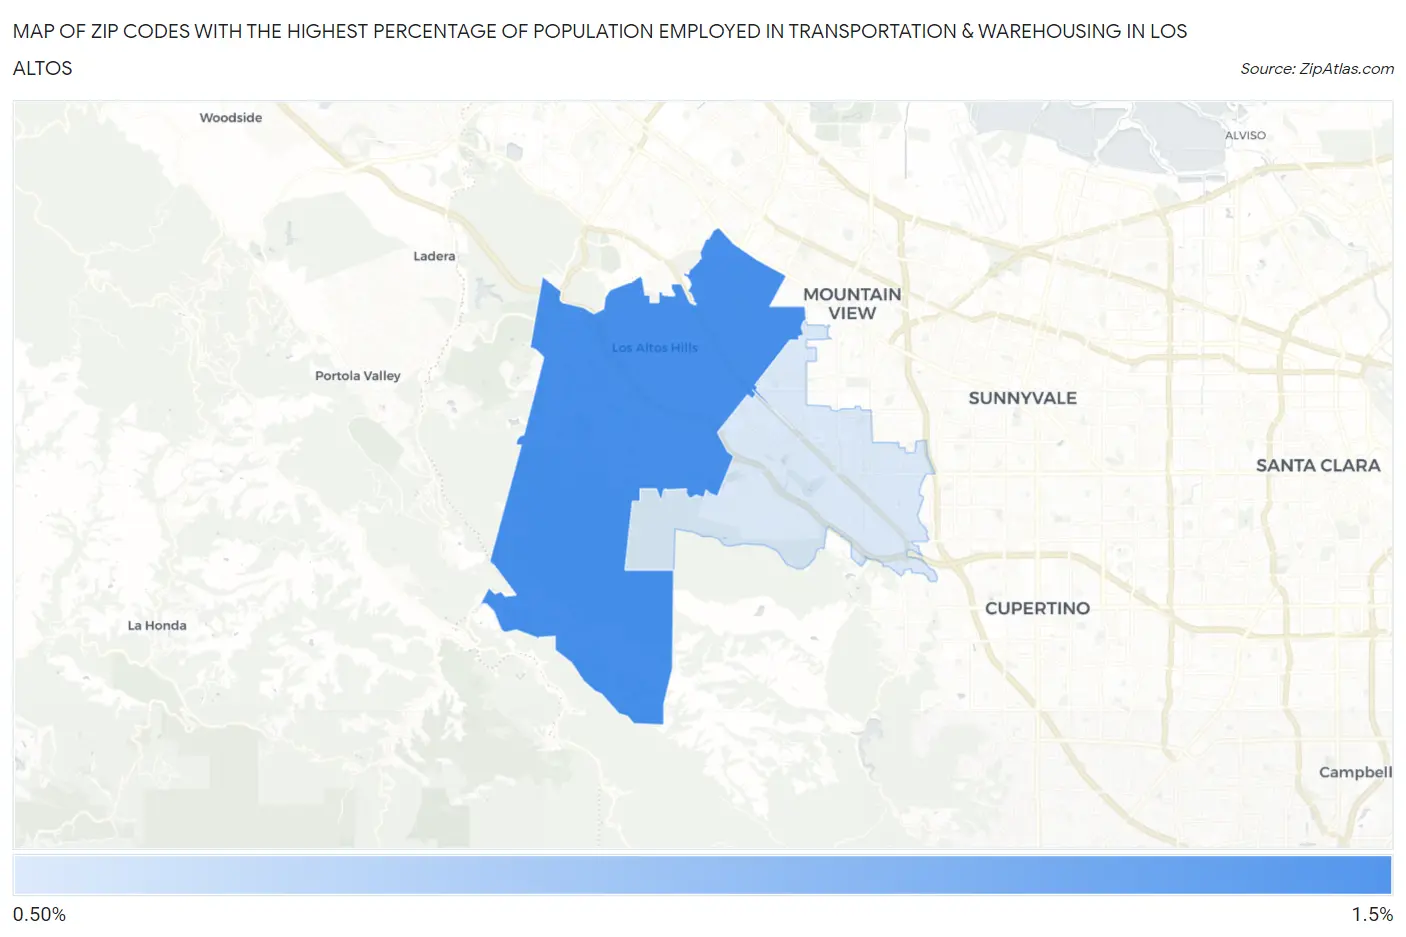
Map of Zip Codes with the Highest Percentage of Population Employed in Transportation & Warehousing in Los Altos
0.0%
1.5%
Zip Codes with the Highest Percentage of Population Employed in Transportation & Warehousing in Los Altos, CA
| Zip Code | % Employed | vs State | vs National | |
| 1. | 94022 | 1.2% | 5.1%(-3.94)#1,379 | 4.9%(-3.75)#26,605 |
| 2. | 94024 | 0.71% | 5.1%(-4.42)#1,431 | 4.9%(-4.23)#27,519 |
1
Common Questions
What are the Top Zip Codes with the Highest Percentage of Population Employed in Transportation & Warehousing in Los Altos, CA?
Top Zip Codes with the Highest Percentage of Population Employed in Transportation & Warehousing in Los Altos, CA are:
What zip code has the Highest Percentage of Population Employed in Transportation & Warehousing in Los Altos, CA?
94022 has the Highest Percentage of Population Employed in Transportation & Warehousing in Los Altos, CA with 1.2%.
What is the Percentage of Population Employed in Transportation & Warehousing in Los Altos, CA?
Percentage of Population Employed in Transportation & Warehousing in Los Altos is 0.87%.
What is the Percentage of Population Employed in Transportation & Warehousing in California?
Percentage of Population Employed in Transportation & Warehousing in California is 5.1%.
What is the Percentage of Population Employed in Transportation & Warehousing in the United States?
Percentage of Population Employed in Transportation & Warehousing in the United States is 4.9%.