Zip Codes with the Highest Percentage of Population Employed in Transportation & Warehousing in La Puente, CA
RELATED REPORTS & OPTIONS
Transportation & Warehousing
La Puente
Compare Zip Codes
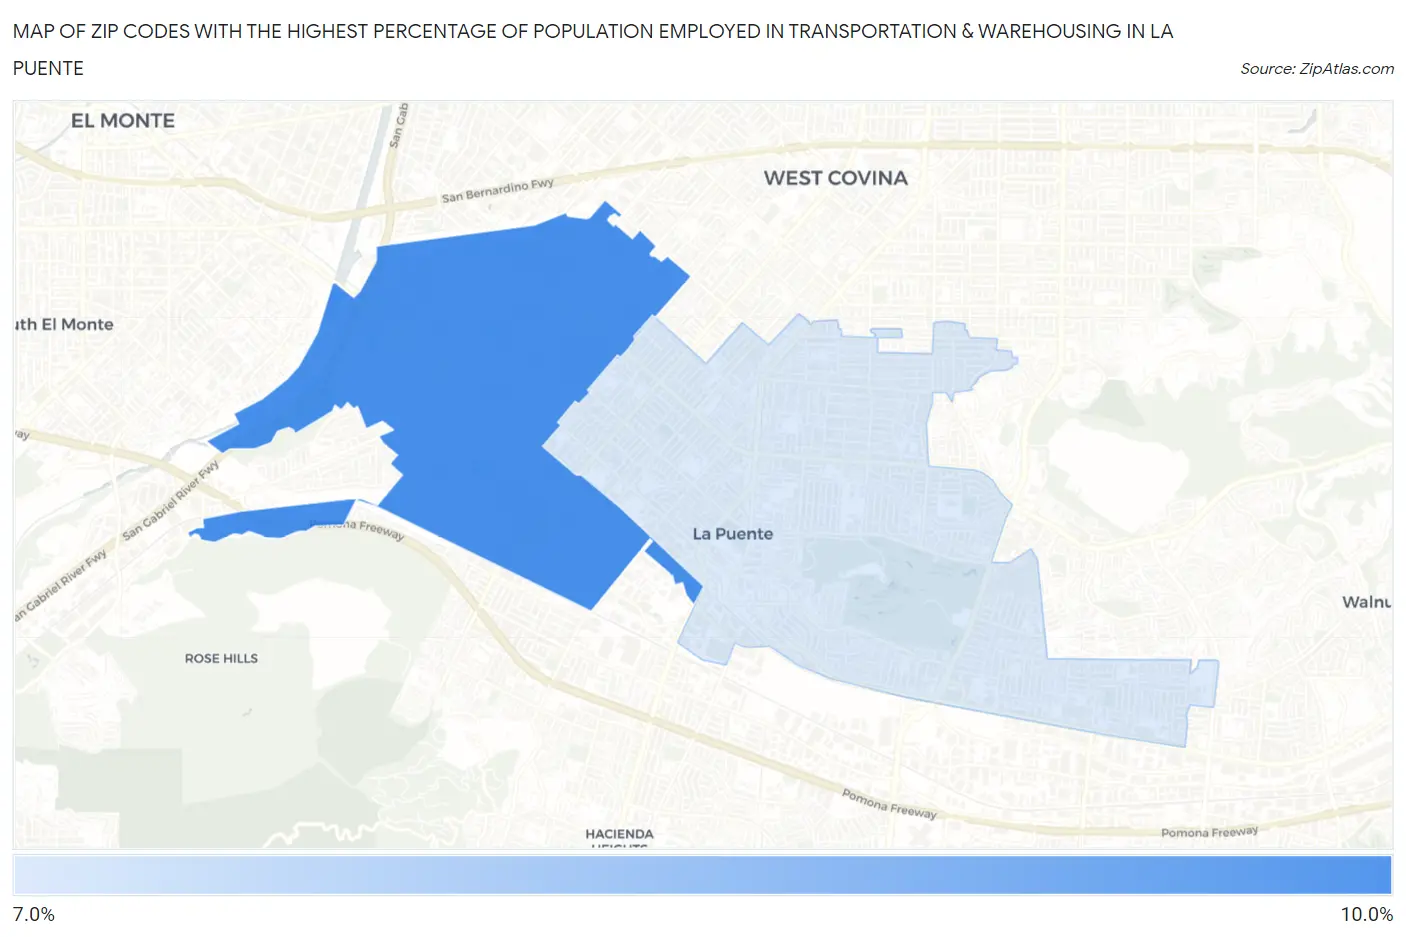
Map of Zip Codes with the Highest Percentage of Population Employed in Transportation & Warehousing in La Puente
0.0%
10.0%
Zip Codes with the Highest Percentage of Population Employed in Transportation & Warehousing in La Puente, CA
| Zip Code | % Employed | vs State | vs National | |
| 1. | 91746 | 8.9% | 5.1%(+3.76)#162 | 4.9%(+3.94)#3,820 |
| 2. | 91744 | 7.6% | 5.1%(+2.45)#247 | 4.9%(+2.63)#5,526 |
1
Common Questions
What are the Top Zip Codes with the Highest Percentage of Population Employed in Transportation & Warehousing in La Puente, CA?
Top Zip Codes with the Highest Percentage of Population Employed in Transportation & Warehousing in La Puente, CA are:
What zip code has the Highest Percentage of Population Employed in Transportation & Warehousing in La Puente, CA?
91746 has the Highest Percentage of Population Employed in Transportation & Warehousing in La Puente, CA with 8.9%.
What is the Percentage of Population Employed in Transportation & Warehousing in La Puente, CA?
Percentage of Population Employed in Transportation & Warehousing in La Puente is 8.3%.
What is the Percentage of Population Employed in Transportation & Warehousing in California?
Percentage of Population Employed in Transportation & Warehousing in California is 5.1%.
What is the Percentage of Population Employed in Transportation & Warehousing in the United States?
Percentage of Population Employed in Transportation & Warehousing in the United States is 4.9%.