Zip Codes with the Highest Percentage of Population Employed in Agriculture, Fishing & Hunting in Gardena, CA
RELATED REPORTS & OPTIONS
Agriculture, Fishing & Hunting
Gardena
Compare Zip Codes
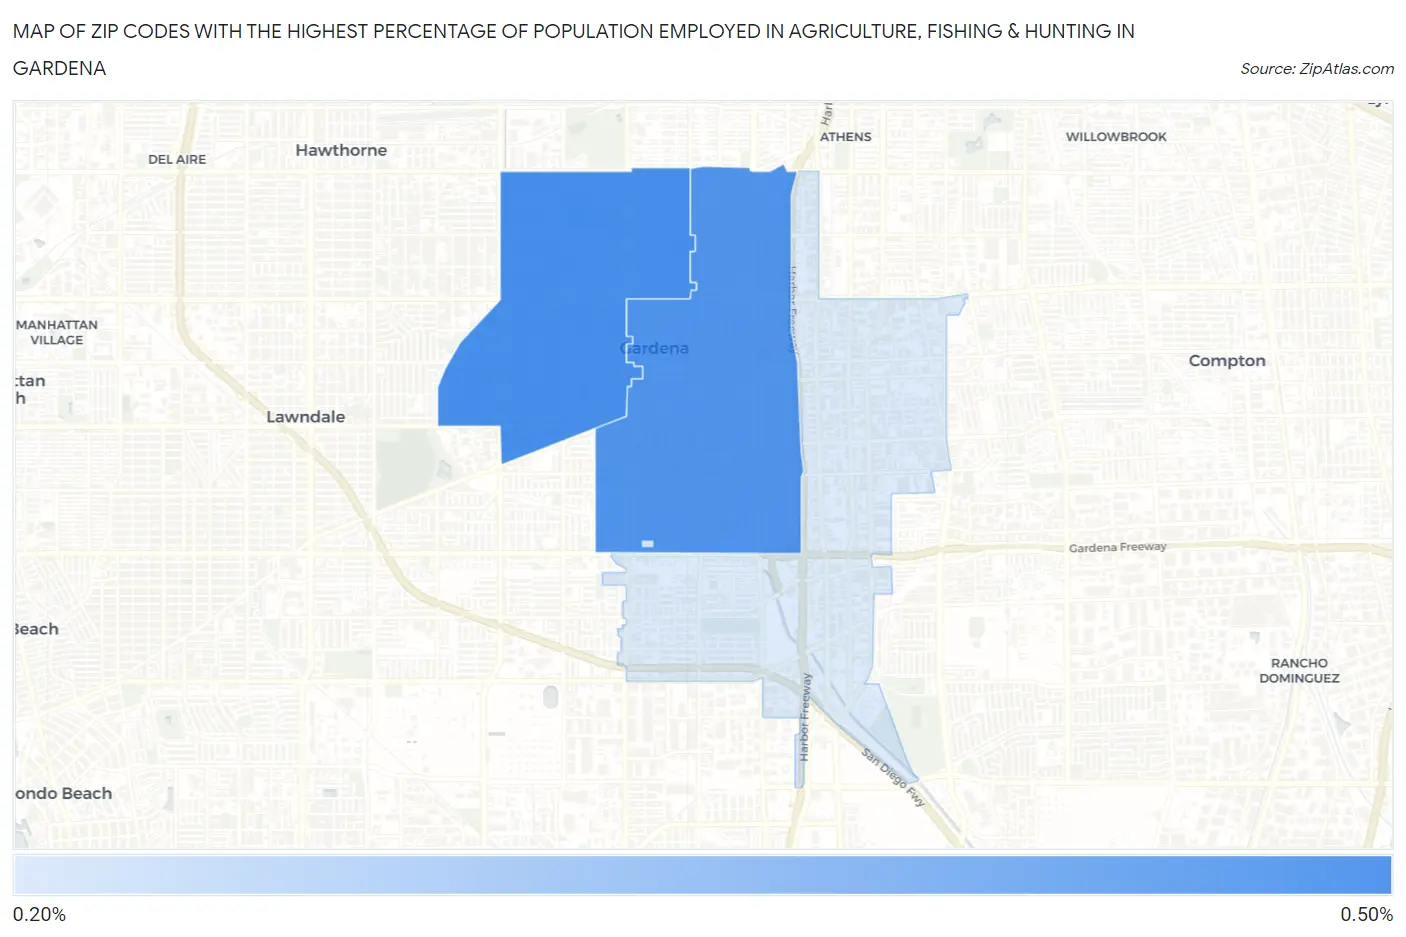
Map of Zip Codes with the Highest Percentage of Population Employed in Agriculture, Fishing & Hunting in Gardena
0.23%
0.46%
Zip Codes with the Highest Percentage of Population Employed in Agriculture, Fishing & Hunting in Gardena, CA
| Zip Code | % Employed | vs State | vs National | |
| 1. | 90249 | 0.46% | 2.0%(-1.53)#997 | 1.2%(-0.742)#19,637 |
| 2. | 90247 | 0.44% | 2.0%(-1.54)#1,009 | 1.2%(-0.755)#19,752 |
| 3. | 90248 | 0.23% | 2.0%(-1.76)#1,198 | 1.2%(-0.973)#22,029 |
1
Common Questions
What are the Top Zip Codes with the Highest Percentage of Population Employed in Agriculture, Fishing & Hunting in Gardena, CA?
Top Zip Codes with the Highest Percentage of Population Employed in Agriculture, Fishing & Hunting in Gardena, CA are:
What zip code has the Highest Percentage of Population Employed in Agriculture, Fishing & Hunting in Gardena, CA?
90249 has the Highest Percentage of Population Employed in Agriculture, Fishing & Hunting in Gardena, CA with 0.46%.
What is the Percentage of Population Employed in Agriculture, Fishing & Hunting in Gardena, CA?
Percentage of Population Employed in Agriculture, Fishing & Hunting in Gardena is 0.26%.
What is the Percentage of Population Employed in Agriculture, Fishing & Hunting in California?
Percentage of Population Employed in Agriculture, Fishing & Hunting in California is 2.0%.
What is the Percentage of Population Employed in Agriculture, Fishing & Hunting in the United States?
Percentage of Population Employed in Agriculture, Fishing & Hunting in the United States is 1.2%.