Zip Codes with the Highest Percentage of Population Employed in Agriculture, Fishing & Hunting in Danville, CA
RELATED REPORTS & OPTIONS
Agriculture, Fishing & Hunting
Danville
Compare Zip Codes
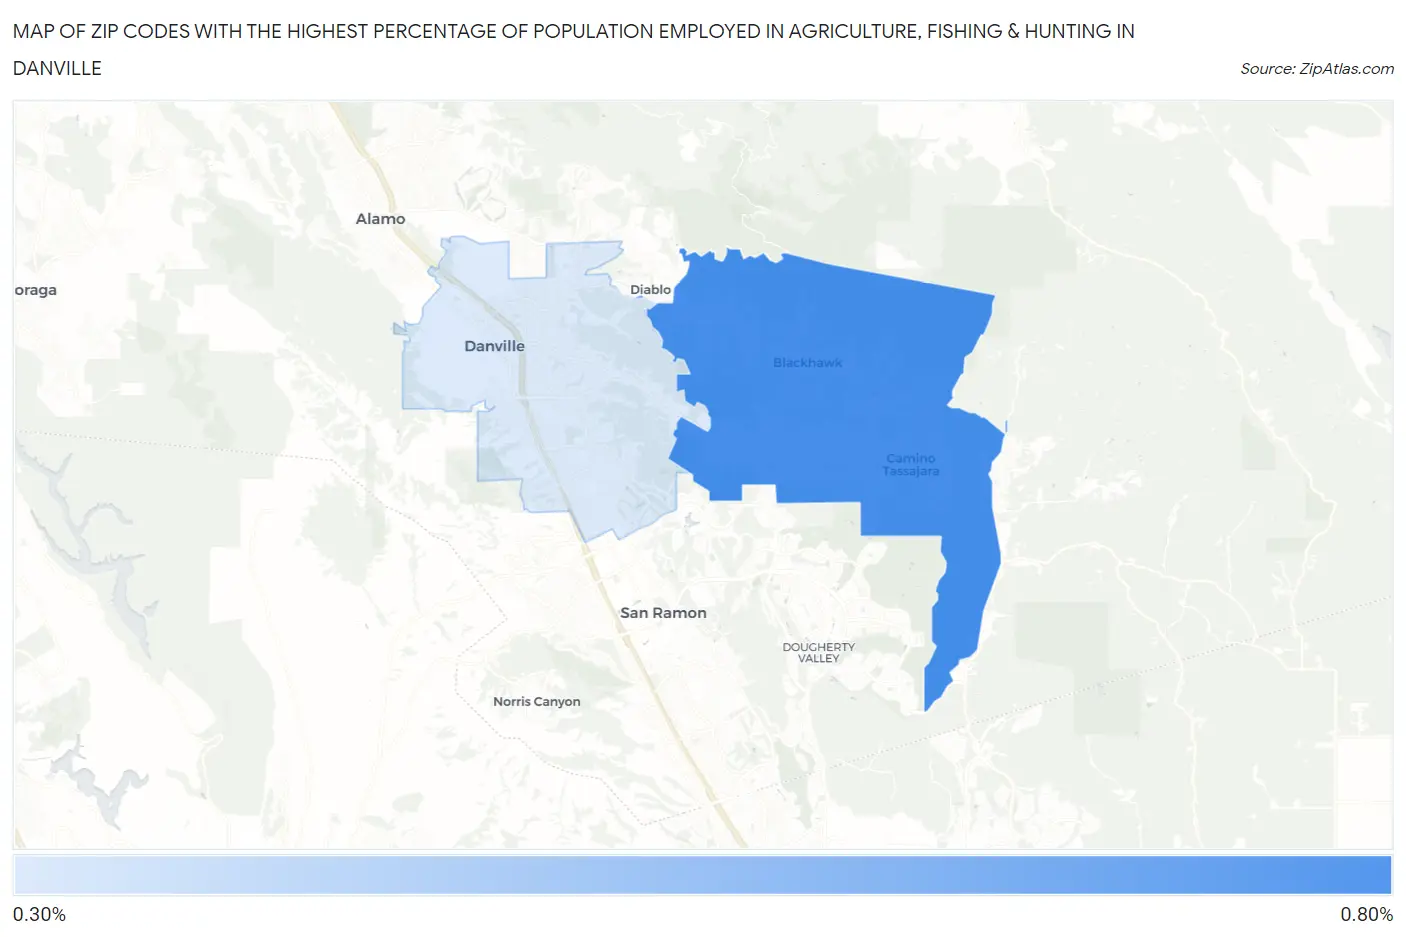
Map of Zip Codes with the Highest Percentage of Population Employed in Agriculture, Fishing & Hunting in Danville
0.0%
0.80%
Zip Codes with the Highest Percentage of Population Employed in Agriculture, Fishing & Hunting in Danville, CA
| Zip Code | % Employed | vs State | vs National | |
| 1. | 94506 | 0.63% | 2.0%(-1.36)#881 | 1.2%(-0.571)#18,283 |
| 2. | 94526 | 0.38% | 2.0%(-1.60)#1,052 | 1.2%(-0.816)#20,307 |
1
Common Questions
What are the Top Zip Codes with the Highest Percentage of Population Employed in Agriculture, Fishing & Hunting in Danville, CA?
Top Zip Codes with the Highest Percentage of Population Employed in Agriculture, Fishing & Hunting in Danville, CA are:
What zip code has the Highest Percentage of Population Employed in Agriculture, Fishing & Hunting in Danville, CA?
94506 has the Highest Percentage of Population Employed in Agriculture, Fishing & Hunting in Danville, CA with 0.63%.
What is the Percentage of Population Employed in Agriculture, Fishing & Hunting in Danville, CA?
Percentage of Population Employed in Agriculture, Fishing & Hunting in Danville is 0.67%.
What is the Percentage of Population Employed in Agriculture, Fishing & Hunting in California?
Percentage of Population Employed in Agriculture, Fishing & Hunting in California is 2.0%.
What is the Percentage of Population Employed in Agriculture, Fishing & Hunting in the United States?
Percentage of Population Employed in Agriculture, Fishing & Hunting in the United States is 1.2%.