Zip Codes with the Highest Percentage of Population Employed in Agriculture, Fishing & Hunting in Carson, CA
RELATED REPORTS & OPTIONS
Select to Compare
Select to Compare
Compare Zip Codes
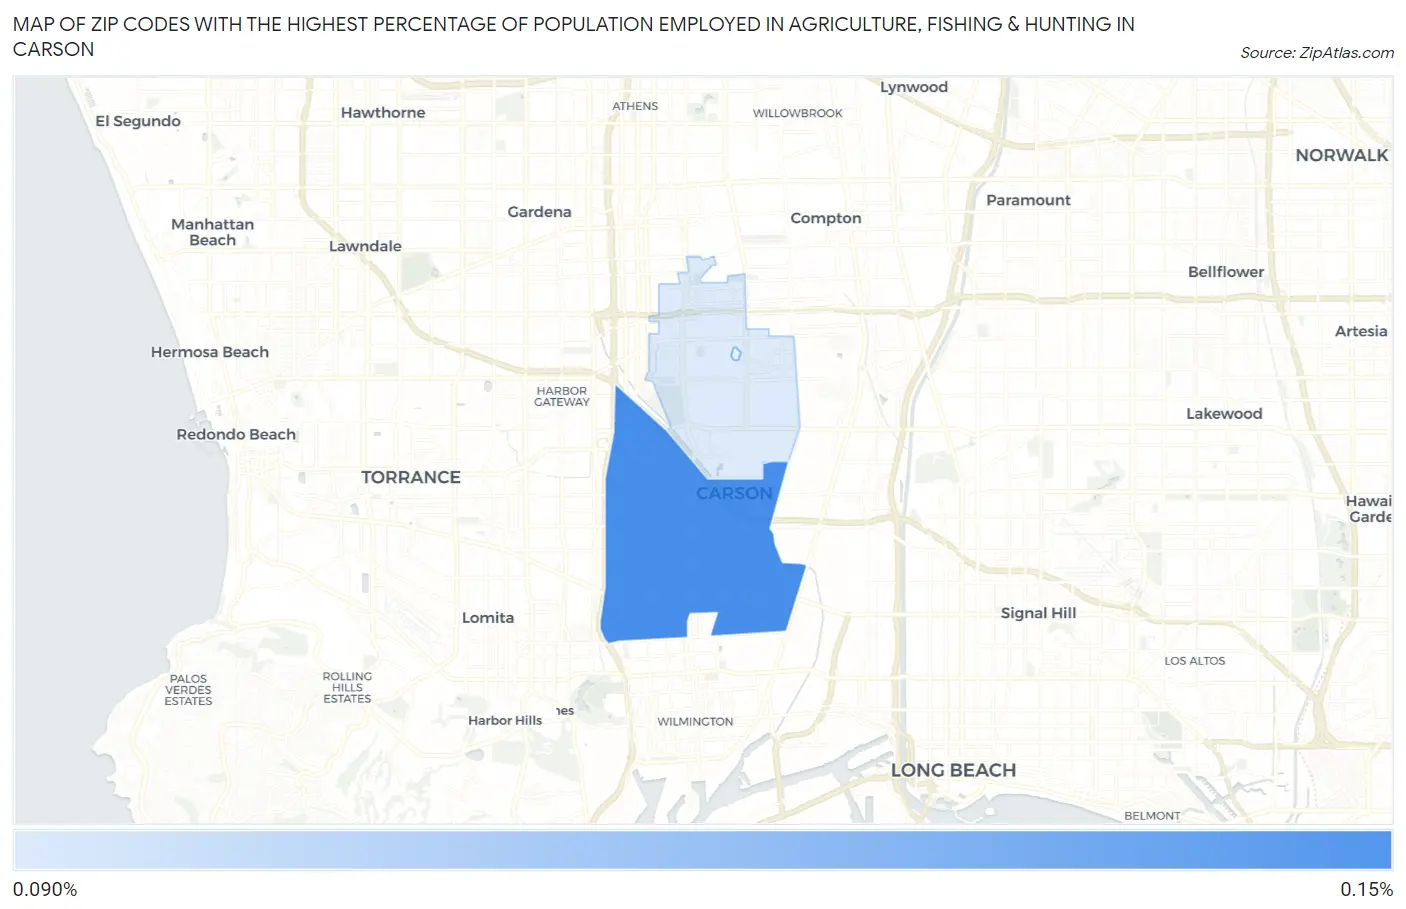
Map of Zip Codes with the Highest Percentage of Population Employed in Agriculture, Fishing & Hunting in Carson
0.0%
0.25%
Zip Codes with the Highest Percentage of Population Employed in Agriculture, Fishing & Hunting in Carson, CA
| Zip Code | % Employed | vs State | vs National | |
| 1. | 90745 | 0.23% | 2.0%(-1.76)#1,195 | 1.2%(-0.969)#21,988 |
1
Common Questions
What are the Top Zip Codes with the Highest Percentage of Population Employed in Agriculture, Fishing & Hunting in Carson, CA?
Top Zip Codes with the Highest Percentage of Population Employed in Agriculture, Fishing & Hunting in Carson, CA are:
What zip code has the Highest Percentage of Population Employed in Agriculture, Fishing & Hunting in Carson, CA?
90745 has the Highest Percentage of Population Employed in Agriculture, Fishing & Hunting in Carson, CA with 0.23%.
What is the Percentage of Population Employed in Agriculture, Fishing & Hunting in Carson, CA?
Percentage of Population Employed in Agriculture, Fishing & Hunting in Carson is 0.19%.
What is the Percentage of Population Employed in Agriculture, Fishing & Hunting in California?
Percentage of Population Employed in Agriculture, Fishing & Hunting in California is 2.0%.
What is the Percentage of Population Employed in Agriculture, Fishing & Hunting in the United States?
Percentage of Population Employed in Agriculture, Fishing & Hunting in the United States is 1.2%.