Zip Codes with the Highest Percentage of Population Employed in Agriculture, Fishing & Hunting in Buena Park, CA
RELATED REPORTS & OPTIONS
Agriculture, Fishing & Hunting
Buena Park
Compare Zip Codes
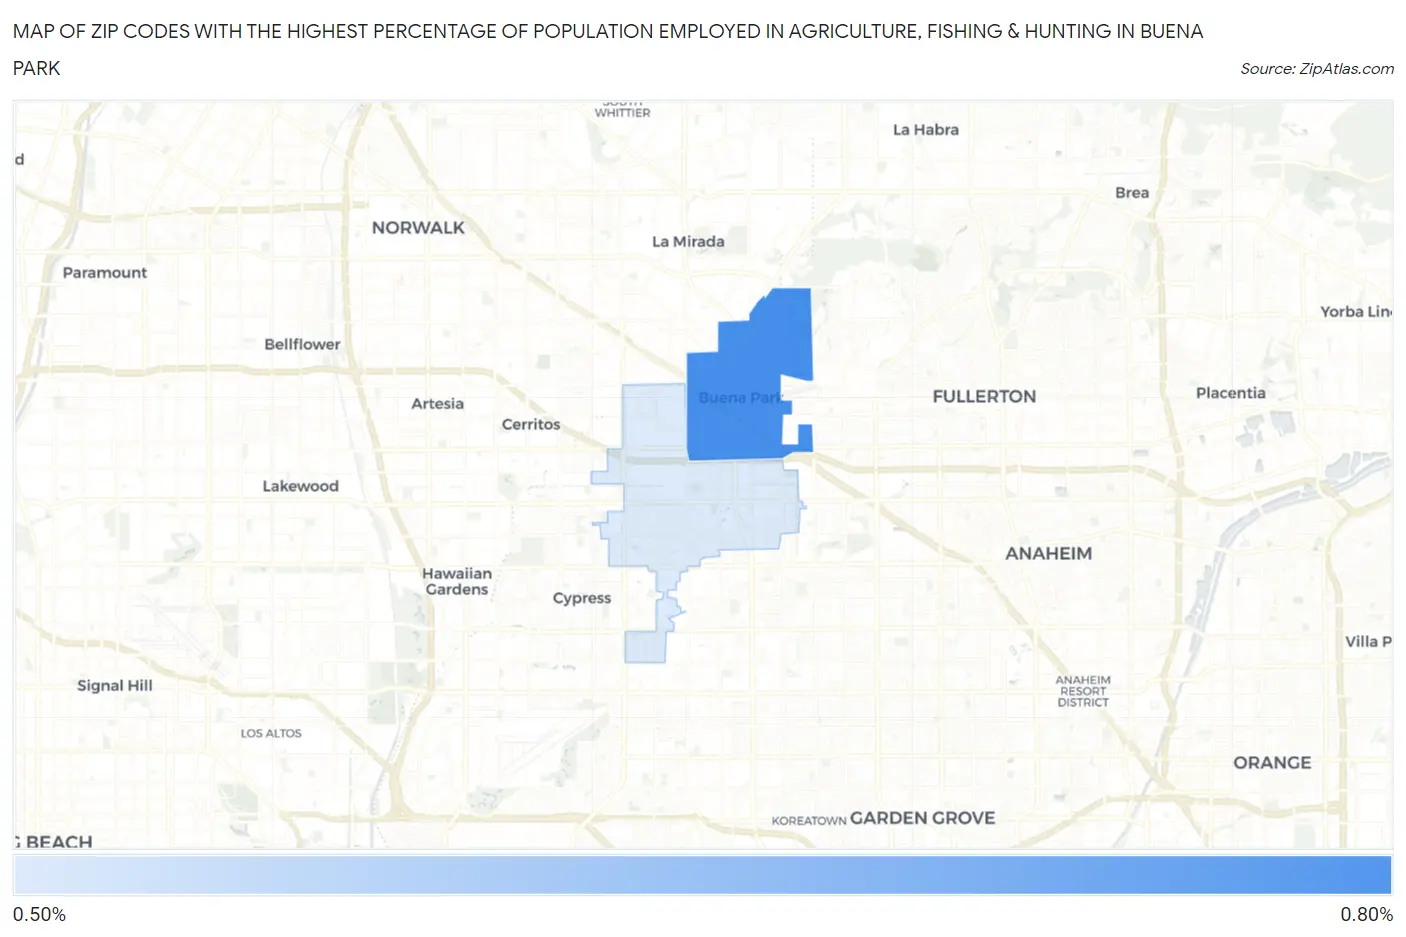
Map of Zip Codes with the Highest Percentage of Population Employed in Agriculture, Fishing & Hunting in Buena Park
0.0%
0.80%
Zip Codes with the Highest Percentage of Population Employed in Agriculture, Fishing & Hunting in Buena Park, CA
| Zip Code | % Employed | vs State | vs National | |
| 1. | 90621 | 0.67% | 2.0%(-1.31)#856 | 1.2%(-0.528)#18,020 |
| 2. | 90620 | 0.59% | 2.0%(-1.40)#902 | 1.2%(-0.609)#18,552 |
1
Common Questions
What are the Top Zip Codes with the Highest Percentage of Population Employed in Agriculture, Fishing & Hunting in Buena Park, CA?
Top Zip Codes with the Highest Percentage of Population Employed in Agriculture, Fishing & Hunting in Buena Park, CA are:
What zip code has the Highest Percentage of Population Employed in Agriculture, Fishing & Hunting in Buena Park, CA?
90621 has the Highest Percentage of Population Employed in Agriculture, Fishing & Hunting in Buena Park, CA with 0.67%.
What is the Percentage of Population Employed in Agriculture, Fishing & Hunting in Buena Park, CA?
Percentage of Population Employed in Agriculture, Fishing & Hunting in Buena Park is 0.62%.
What is the Percentage of Population Employed in Agriculture, Fishing & Hunting in California?
Percentage of Population Employed in Agriculture, Fishing & Hunting in California is 2.0%.
What is the Percentage of Population Employed in Agriculture, Fishing & Hunting in the United States?
Percentage of Population Employed in Agriculture, Fishing & Hunting in the United States is 1.2%.