Zip Codes with the Highest Percentage of Population Employed in Arts, Entertainment & Recreation in Apple Valley, CA
RELATED REPORTS & OPTIONS
Arts, Entertainment & Recreation
Apple Valley
Compare Zip Codes
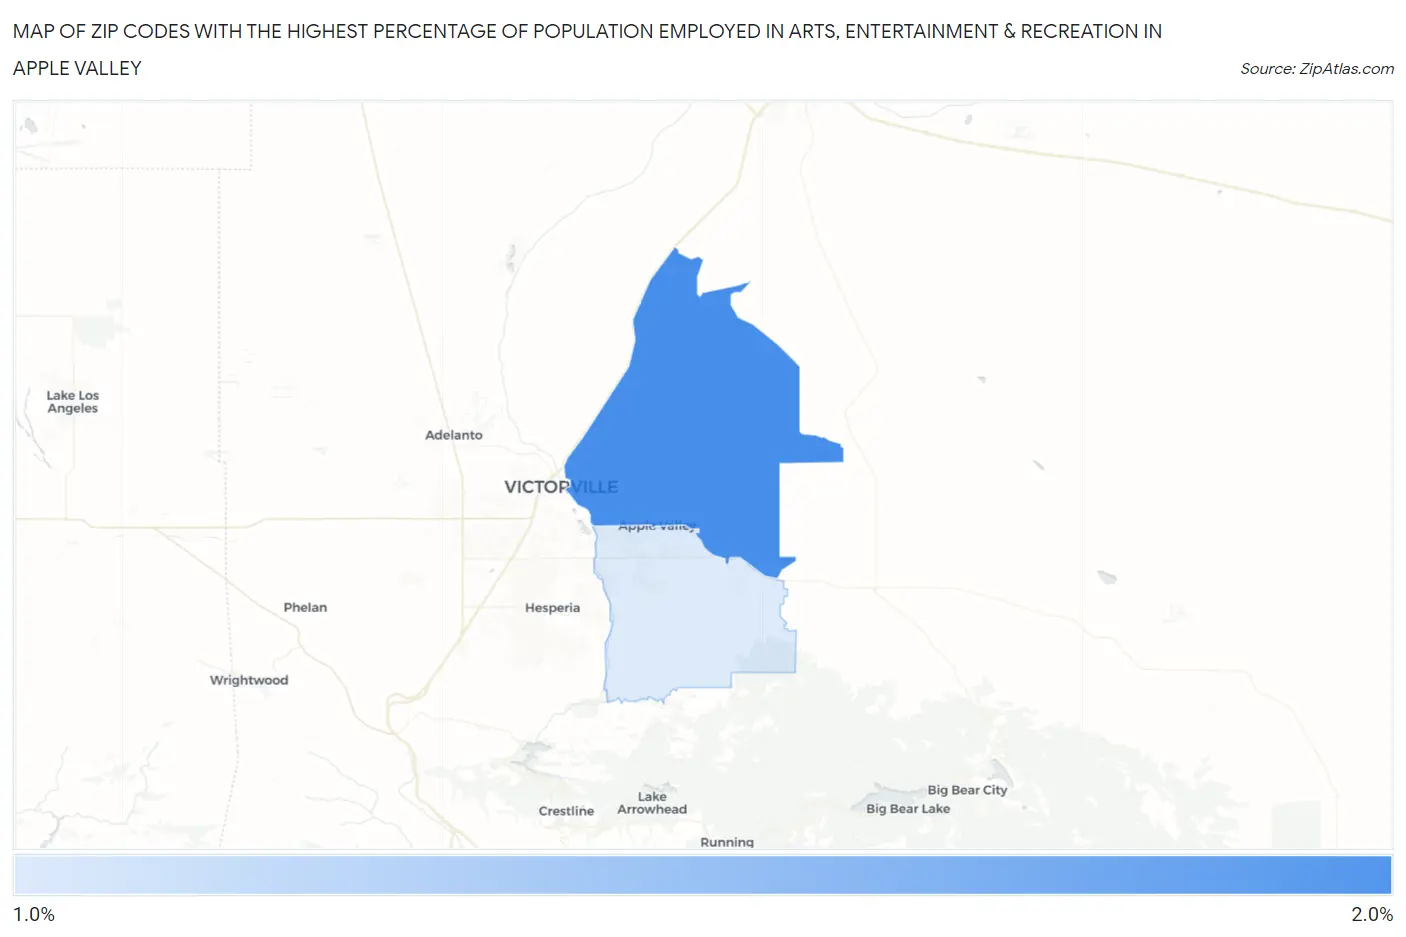
Map of Zip Codes with the Highest Percentage of Population Employed in Arts, Entertainment & Recreation in Apple Valley
0.0%
2.0%
Zip Codes with the Highest Percentage of Population Employed in Arts, Entertainment & Recreation in Apple Valley, CA
| Zip Code | % Employed | vs State | vs National | |
| 1. | 92307 | 1.6% | 2.6%(-0.930)#1,073 | 2.1%(-0.459)#12,262 |
| 2. | 92308 | 1.5% | 2.6%(-1.07)#1,143 | 2.1%(-0.602)#13,374 |
1
Common Questions
What are the Top Zip Codes with the Highest Percentage of Population Employed in Arts, Entertainment & Recreation in Apple Valley, CA?
Top Zip Codes with the Highest Percentage of Population Employed in Arts, Entertainment & Recreation in Apple Valley, CA are:
What zip code has the Highest Percentage of Population Employed in Arts, Entertainment & Recreation in Apple Valley, CA?
92307 has the Highest Percentage of Population Employed in Arts, Entertainment & Recreation in Apple Valley, CA with 1.6%.
What is the Percentage of Population Employed in Arts, Entertainment & Recreation in Apple Valley, CA?
Percentage of Population Employed in Arts, Entertainment & Recreation in Apple Valley is 1.5%.
What is the Percentage of Population Employed in Arts, Entertainment & Recreation in California?
Percentage of Population Employed in Arts, Entertainment & Recreation in California is 2.6%.
What is the Percentage of Population Employed in Arts, Entertainment & Recreation in the United States?
Percentage of Population Employed in Arts, Entertainment & Recreation in the United States is 2.1%.