Zip Codes with the Highest Percentage of Population Employed in Arts, Entertainment & Recreation in Arkansas
RELATED REPORTS & OPTIONS
Arts, Entertainment & Recreation
Arkansas
Compare Zip Codes
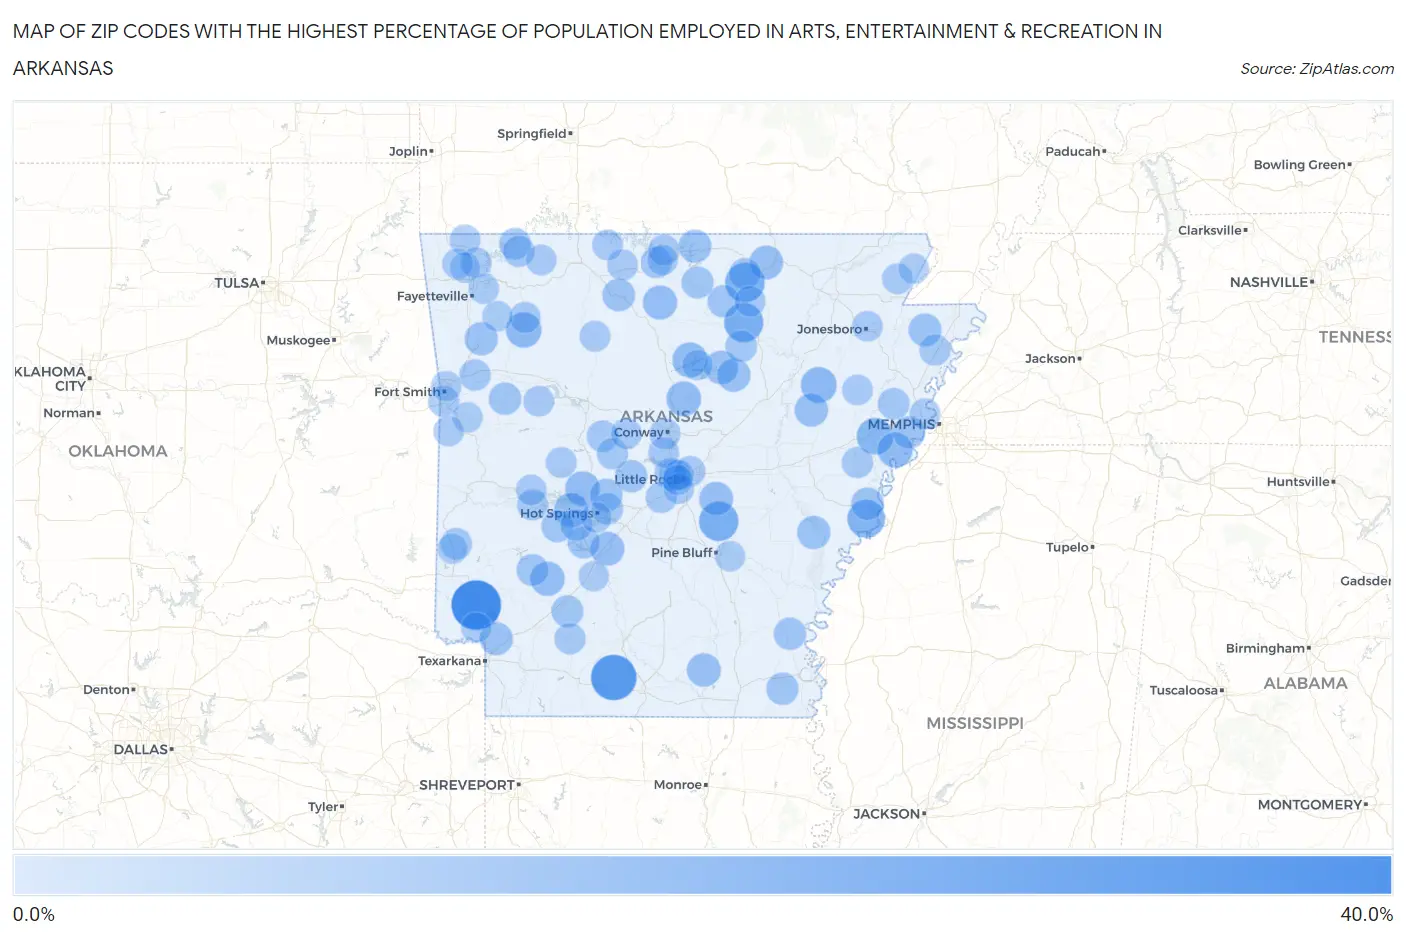
Map of Zip Codes with the Highest Percentage of Population Employed in Arts, Entertainment & Recreation in Arkansas
0.0%
40.0%
Zip Codes with the Highest Percentage of Population Employed in Arts, Entertainment & Recreation in Arkansas
| Zip Code | % Employed | vs State | vs National | |
| 1. | 71823 | 32.1% | 1.3%(+30.8)#1 | 2.1%(+30.1)#69 |
| 2. | 71758 | 25.7% | 1.3%(+24.4)#2 | 2.1%(+23.6)#111 |
| 3. | 72536 | 16.0% | 1.3%(+14.7)#3 | 2.1%(+14.0)#288 |
| 4. | 72168 | 16.0% | 1.3%(+14.7)#4 | 2.1%(+13.9)#294 |
| 5. | 72526 | 15.8% | 1.3%(+14.5)#5 | 2.1%(+13.7)#303 |
| 6. | 72342 | 13.4% | 1.3%(+12.1)#6 | 2.1%(+11.3)#424 |
| 7. | 72394 | 11.6% | 1.3%(+10.3)#7 | 2.1%(+9.53)#546 |
| 8. | 72014 | 10.3% | 1.3%(+8.96)#8 | 2.1%(+8.17)#671 |
| 9. | 72760 | 10.0% | 1.3%(+8.70)#9 | 2.1%(+7.92)#701 |
| 10. | 72088 | 9.3% | 1.3%(+8.01)#10 | 2.1%(+7.23)#804 |
| 11. | 72348 | 9.1% | 1.3%(+7.78)#11 | 2.1%(+6.99)#844 |
| 12. | 72061 | 8.6% | 1.3%(+7.27)#12 | 2.1%(+6.49)#927 |
| 13. | 71949 | 8.6% | 1.3%(+7.26)#13 | 2.1%(+6.48)#931 |
| 14. | 71968 | 8.2% | 1.3%(+6.92)#14 | 2.1%(+6.13)#999 |
| 15. | 71940 | 8.1% | 1.3%(+6.84)#15 | 2.1%(+6.06)#1,020 |
| 16. | 72639 | 7.9% | 1.3%(+6.61)#16 | 2.1%(+5.82)#1,086 |
| 17. | 71941 | 7.4% | 1.3%(+6.11)#17 | 2.1%(+5.32)#1,204 |
| 18. | 72529 | 7.2% | 1.3%(+5.94)#18 | 2.1%(+5.15)#1,254 |
| 19. | 72083 | 7.1% | 1.3%(+5.85)#19 | 2.1%(+5.06)#1,289 |
| 20. | 72581 | 7.1% | 1.3%(+5.77)#20 | 2.1%(+4.98)#1,311 |
| 21. | 71647 | 7.0% | 1.3%(+5.71)#21 | 2.1%(+4.92)#1,328 |
| 22. | 72179 | 6.9% | 1.3%(+5.60)#22 | 2.1%(+4.81)#1,363 |
| 23. | 72101 | 6.6% | 1.3%(+5.34)#23 | 2.1%(+4.56)#1,445 |
| 24. | 72140 | 6.5% | 1.3%(+5.15)#24 | 2.1%(+4.37)#1,520 |
| 25. | 72959 | 6.4% | 1.3%(+5.12)#25 | 2.1%(+4.34)#1,533 |
| 26. | 71853 | 6.1% | 1.3%(+4.80)#26 | 2.1%(+4.02)#1,656 |
| 27. | 72442 | 6.1% | 1.3%(+4.78)#27 | 2.1%(+3.99)#1,663 |
| 28. | 72544 | 5.9% | 1.3%(+4.64)#28 | 2.1%(+3.85)#1,734 |
| 29. | 72669 | 5.7% | 1.3%(+4.36)#29 | 2.1%(+3.58)#1,881 |
| 30. | 72390 | 5.6% | 1.3%(+4.29)#30 | 2.1%(+3.50)#1,916 |
| 31. | 71909 | 5.4% | 1.3%(+4.08)#31 | 2.1%(+3.29)#2,038 |
| 32. | 72376 | 5.3% | 1.3%(+3.97)#32 | 2.1%(+3.18)#2,101 |
| 33. | 72951 | 5.2% | 1.3%(+3.88)#33 | 2.1%(+3.09)#2,173 |
| 34. | 71654 | 5.1% | 1.3%(+3.83)#34 | 2.1%(+3.04)#2,195 |
| 35. | 71663 | 5.0% | 1.3%(+3.68)#35 | 2.1%(+2.90)#2,301 |
| 36. | 72122 | 4.8% | 1.3%(+3.49)#36 | 2.1%(+2.71)#2,449 |
| 37. | 72556 | 4.8% | 1.3%(+3.49)#37 | 2.1%(+2.70)#2,455 |
| 38. | 71929 | 4.8% | 1.3%(+3.48)#38 | 2.1%(+2.69)#2,460 |
| 39. | 71933 | 4.7% | 1.3%(+3.35)#39 | 2.1%(+2.57)#2,577 |
| 40. | 71857 | 4.6% | 1.3%(+3.27)#40 | 2.1%(+2.49)#2,664 |
| 41. | 72519 | 4.6% | 1.3%(+3.26)#41 | 2.1%(+2.48)#2,671 |
| 42. | 71958 | 4.3% | 1.3%(+3.05)#42 | 2.1%(+2.26)#2,913 |
| 43. | 71964 | 4.2% | 1.3%(+2.86)#43 | 2.1%(+2.08)#3,129 |
| 44. | 71973 | 4.0% | 1.3%(+2.72)#44 | 2.1%(+1.93)#3,316 |
| 45. | 72550 | 3.9% | 1.3%(+2.59)#45 | 2.1%(+1.81)#3,497 |
| 46. | 72025 | 3.9% | 1.3%(+2.57)#46 | 2.1%(+1.79)#3,528 |
| 47. | 71901 | 3.8% | 1.3%(+2.53)#47 | 2.1%(+1.74)#3,592 |
| 48. | 72331 | 3.8% | 1.3%(+2.52)#48 | 2.1%(+1.73)#3,606 |
| 49. | 72512 | 3.8% | 1.3%(+2.52)#49 | 2.1%(+1.73)#3,611 |
| 50. | 72631 | 3.8% | 1.3%(+2.50)#50 | 2.1%(+1.71)#3,640 |
| 51. | 72935 | 3.7% | 1.3%(+2.36)#51 | 2.1%(+1.57)#3,844 |
| 52. | 72632 | 3.6% | 1.3%(+2.30)#52 | 2.1%(+1.52)#3,958 |
| 53. | 72626 | 3.5% | 1.3%(+2.23)#53 | 2.1%(+1.44)#4,071 |
| 54. | 72227 | 3.4% | 1.3%(+2.11)#54 | 2.1%(+1.33)#4,331 |
| 55. | 72212 | 3.4% | 1.3%(+2.08)#55 | 2.1%(+1.29)#4,407 |
| 56. | 72341 | 3.4% | 1.3%(+2.07)#56 | 2.1%(+1.29)#4,426 |
| 57. | 72351 | 3.3% | 1.3%(+2.05)#57 | 2.1%(+1.26)#4,474 |
| 58. | 72126 | 3.3% | 1.3%(+2.02)#58 | 2.1%(+1.24)#4,525 |
| 59. | 72908 | 3.3% | 1.3%(+2.02)#59 | 2.1%(+1.24)#4,529 |
| 60. | 72776 | 3.2% | 1.3%(+1.95)#60 | 2.1%(+1.16)#4,688 |
| 61. | 71858 | 3.2% | 1.3%(+1.95)#61 | 2.1%(+1.16)#4,698 |
| 62. | 72022 | 3.2% | 1.3%(+1.91)#62 | 2.1%(+1.12)#4,785 |
| 63. | 71957 | 3.0% | 1.3%(+1.70)#63 | 2.1%(+0.911)#5,374 |
| 64. | 72651 | 2.9% | 1.3%(+1.63)#64 | 2.1%(+0.849)#5,563 |
| 65. | 72035 | 2.8% | 1.3%(+1.52)#65 | 2.1%(+0.730)#5,944 |
| 66. | 72672 | 2.8% | 1.3%(+1.51)#66 | 2.1%(+0.721)#5,983 |
| 67. | 72856 | 2.8% | 1.3%(+1.50)#67 | 2.1%(+0.711)#6,025 |
| 68. | 72577 | 2.8% | 1.3%(+1.48)#68 | 2.1%(+0.690)#6,093 |
| 69. | 72443 | 2.7% | 1.3%(+1.44)#69 | 2.1%(+0.652)#6,242 |
| 70. | 72857 | 2.7% | 1.3%(+1.36)#70 | 2.1%(+0.572)#6,543 |
| 71. | 72714 | 2.6% | 1.3%(+1.35)#71 | 2.1%(+0.563)#6,575 |
| 72. | 72125 | 2.6% | 1.3%(+1.27)#72 | 2.1%(+0.482)#6,897 |
| 73. | 72116 | 2.6% | 1.3%(+1.26)#73 | 2.1%(+0.470)#6,945 |
| 74. | 72865 | 2.5% | 1.3%(+1.22)#74 | 2.1%(+0.436)#7,098 |
| 75. | 72209 | 2.5% | 1.3%(+1.20)#75 | 2.1%(+0.417)#7,172 |
| 76. | 72106 | 2.5% | 1.3%(+1.18)#76 | 2.1%(+0.394)#7,279 |
| 77. | 72364 | 2.5% | 1.3%(+1.16)#77 | 2.1%(+0.376)#7,366 |
| 78. | 72324 | 2.4% | 1.3%(+1.15)#78 | 2.1%(+0.362)#7,444 |
| 79. | 72635 | 2.4% | 1.3%(+1.13)#79 | 2.1%(+0.346)#7,517 |
| 80. | 72616 | 2.4% | 1.3%(+1.13)#80 | 2.1%(+0.341)#7,539 |
| 81. | 71913 | 2.4% | 1.3%(+1.10)#81 | 2.1%(+0.312)#7,666 |
| 82. | 72207 | 2.4% | 1.3%(+1.06)#82 | 2.1%(+0.275)#7,854 |
| 83. | 71822 | 2.3% | 1.3%(+1.04)#83 | 2.1%(+0.256)#7,936 |
| 84. | 71969 | 2.3% | 1.3%(+1.03)#84 | 2.1%(+0.243)#8,005 |
| 85. | 72758 | 2.3% | 1.3%(+1.01)#85 | 2.1%(+0.226)#8,089 |
| 86. | 72644 | 2.3% | 1.3%(+1.01)#86 | 2.1%(+0.221)#8,105 |
| 87. | 72713 | 2.3% | 1.3%(+0.992)#87 | 2.1%(+0.206)#8,181 |
| 88. | 72467 | 2.3% | 1.3%(+0.968)#88 | 2.1%(+0.183)#8,301 |
| 89. | 72727 | 2.3% | 1.3%(+0.963)#89 | 2.1%(+0.177)#8,329 |
| 90. | 72703 | 2.3% | 1.3%(+0.961)#90 | 2.1%(+0.175)#8,340 |
| 91. | 72718 | 2.2% | 1.3%(+0.907)#91 | 2.1%(+0.121)#8,619 |
| 92. | 72067 | 2.2% | 1.3%(+0.894)#92 | 2.1%(+0.108)#8,699 |
| 93. | 72936 | 2.1% | 1.3%(+0.826)#93 | 2.1%(+0.040)#9,084 |
| 94. | 71601 | 2.1% | 1.3%(+0.804)#94 | 2.1%(+0.019)#9,203 |
| 95. | 72461 | 2.1% | 1.3%(+0.779)#95 | 2.1%(-0.006)#9,339 |
| 96. | 71944 | 2.0% | 1.3%(+0.708)#96 | 2.1%(-0.078)#9,748 |
| 97. | 72205 | 2.0% | 1.3%(+0.706)#97 | 2.1%(-0.079)#9,759 |
| 98. | 72945 | 2.0% | 1.3%(+0.703)#98 | 2.1%(-0.083)#9,781 |
| 99. | 72904 | 2.0% | 1.3%(+0.667)#99 | 2.1%(-0.119)#9,991 |
| 100. | 71923 | 1.9% | 1.3%(+0.645)#100 | 2.1%(-0.141)#10,122 |
Common Questions
What are the Top 10 Zip Codes with the Highest Percentage of Population Employed in Arts, Entertainment & Recreation in Arkansas?
Top 10 Zip Codes with the Highest Percentage of Population Employed in Arts, Entertainment & Recreation in Arkansas are:
What zip code has the Highest Percentage of Population Employed in Arts, Entertainment & Recreation in Arkansas?
71823 has the Highest Percentage of Population Employed in Arts, Entertainment & Recreation in Arkansas with 32.1%.
What is the Percentage of Population Employed in Arts, Entertainment & Recreation in the State of Arkansas?
Percentage of Population Employed in Arts, Entertainment & Recreation in Arkansas is 1.3%.
What is the Percentage of Population Employed in Arts, Entertainment & Recreation in the United States?
Percentage of Population Employed in Arts, Entertainment & Recreation in the United States is 2.1%.