Zip Codes with the Highest Percentage of Population Employed in Farming, Fishing & Forestry in Alaska
RELATED REPORTS & OPTIONS
Farming, Fishing & Forestry
Alaska
Compare Zip Codes
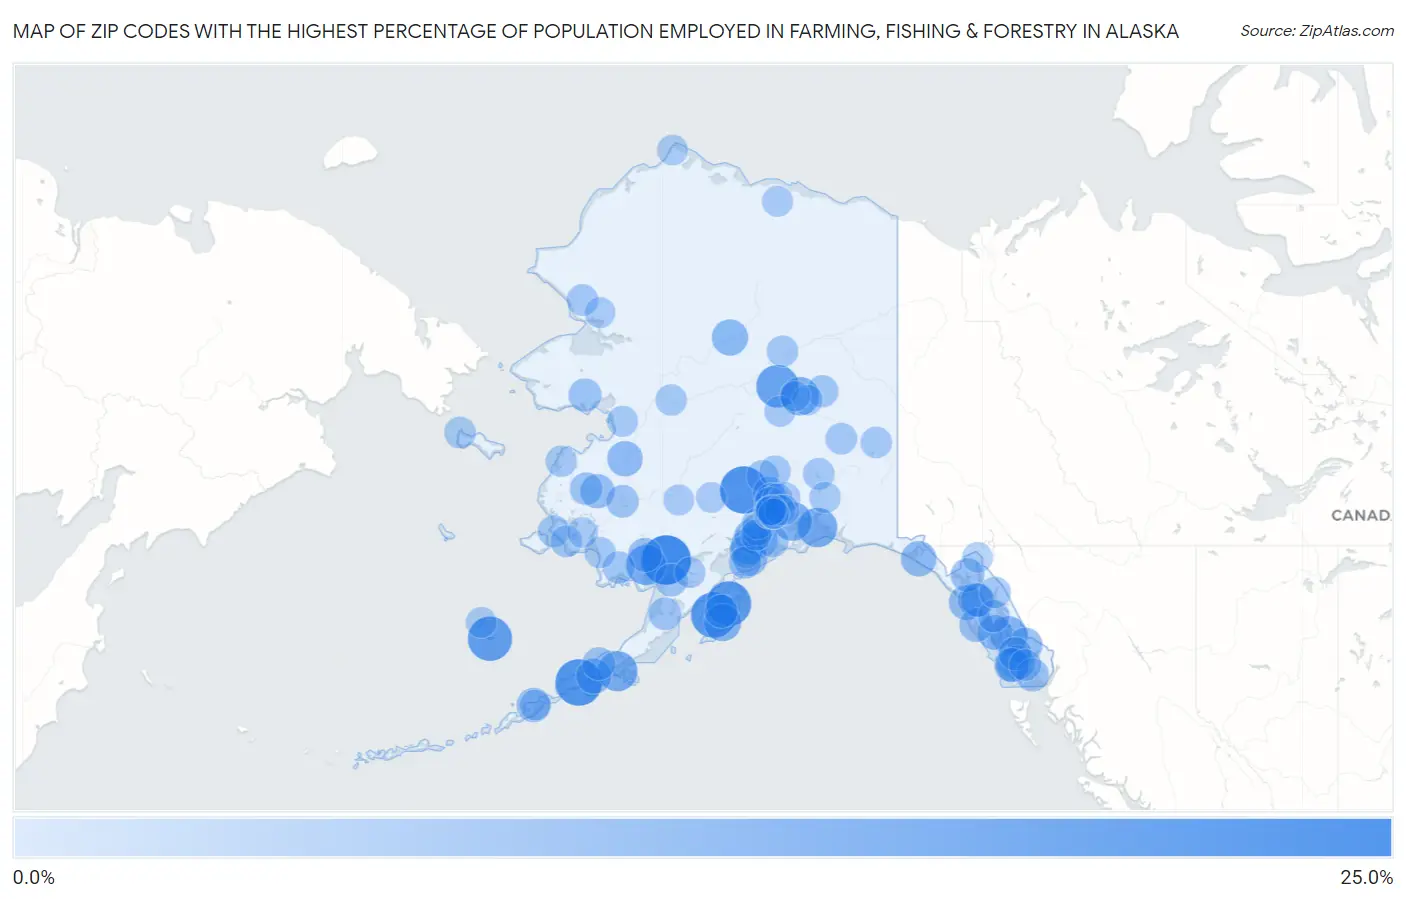
Map of Zip Codes with the Highest Percentage of Population Employed in Farming, Fishing & Forestry in Alaska
0.0%
25.0%
Zip Codes with the Highest Percentage of Population Employed in Farming, Fishing & Forestry in Alaska
| Zip Code | % Employed | vs State | vs National | |
| 1. | 99636 | 24.6% | 1.0%(+23.6)#1 | 0.61%(+24.0)#293 |
| 2. | 99667 | 21.8% | 1.0%(+20.8)#2 | 0.61%(+21.2)#352 |
| 3. | 99583 | 20.8% | 1.0%(+19.7)#3 | 0.61%(+20.1)#376 |
| 4. | 99624 | 19.4% | 1.0%(+18.3)#4 | 0.61%(+18.7)#430 |
| 5. | 99550 | 18.6% | 1.0%(+17.6)#5 | 0.61%(+18.0)#455 |
| 6. | 99591 | 17.9% | 1.0%(+16.8)#6 | 0.61%(+17.3)#484 |
| 7. | 99758 | 15.4% | 1.0%(+14.4)#7 | 0.61%(+14.8)#623 |
| 8. | 99555 | 12.5% | 1.0%(+11.5)#8 | 0.61%(+11.9)#873 |
| 9. | 99661 | 12.2% | 1.0%(+11.1)#9 | 0.61%(+11.6)#914 |
| 10. | 99574 | 11.7% | 1.0%(+10.6)#10 | 0.61%(+11.1)#970 |
| 11. | 99693 | 11.0% | 1.0%(+10.0)#11 | 0.61%(+10.4)#1,044 |
| 12. | 99775 | 10.1% | 1.0%(+9.11)#12 | 0.61%(+9.53)#1,192 |
| 13. | 99833 | 9.0% | 1.0%(+8.02)#13 | 0.61%(+8.44)#1,395 |
| 14. | 99643 | 8.9% | 1.0%(+7.91)#14 | 0.61%(+8.32)#1,420 |
| 15. | 99639 | 7.7% | 1.0%(+6.65)#15 | 0.61%(+7.06)#1,767 |
| 16. | 99720 | 7.5% | 1.0%(+6.50)#16 | 0.61%(+6.92)#1,813 |
| 17. | 99689 | 6.5% | 1.0%(+5.50)#17 | 0.61%(+5.92)#2,151 |
| 18. | 99590 | 6.3% | 1.0%(+5.33)#18 | 0.61%(+5.74)#2,221 |
| 19. | 99568 | 6.3% | 1.0%(+5.25)#19 | 0.61%(+5.67)#2,254 |
| 20. | 99612 | 6.0% | 1.0%(+5.02)#20 | 0.61%(+5.44)#2,373 |
| 21. | 99832 | 5.8% | 1.0%(+4.75)#21 | 0.61%(+5.16)#2,512 |
| 22. | 99929 | 5.8% | 1.0%(+4.74)#22 | 0.61%(+5.16)#2,513 |
| 23. | 99830 | 5.4% | 1.0%(+4.41)#23 | 0.61%(+4.83)#2,688 |
| 24. | 99603 | 5.1% | 1.0%(+4.10)#24 | 0.61%(+4.52)#2,852 |
| 25. | 99692 | 5.1% | 1.0%(+4.09)#25 | 0.61%(+4.51)#2,855 |
| 26. | 99585 | 5.0% | 1.0%(+3.98)#26 | 0.61%(+4.39)#2,926 |
| 27. | 99919 | 4.9% | 1.0%(+3.90)#27 | 0.61%(+4.32)#2,977 |
| 28. | 99925 | 4.9% | 1.0%(+3.86)#28 | 0.61%(+4.27)#3,011 |
| 29. | 99610 | 4.8% | 1.0%(+3.77)#29 | 0.61%(+4.18)#3,083 |
| 30. | 99921 | 4.7% | 1.0%(+3.70)#30 | 0.61%(+4.11)#3,137 |
| 31. | 99841 | 4.7% | 1.0%(+3.67)#31 | 0.61%(+4.08)#3,160 |
| 32. | 99576 | 4.7% | 1.0%(+3.64)#32 | 0.61%(+4.05)#3,181 |
| 33. | 99835 | 4.4% | 1.0%(+3.33)#33 | 0.61%(+3.75)#3,407 |
| 34. | 99827 | 4.2% | 1.0%(+3.18)#34 | 0.61%(+3.60)#3,544 |
| 35. | 99829 | 3.9% | 1.0%(+2.90)#35 | 0.61%(+3.31)#3,796 |
| 36. | 99556 | 3.9% | 1.0%(+2.83)#36 | 0.61%(+3.25)#3,853 |
| 37. | 99615 | 3.8% | 1.0%(+2.77)#37 | 0.61%(+3.19)#3,906 |
| 38. | 99918 | 3.7% | 1.0%(+2.73)#38 | 0.61%(+3.14)#3,944 |
| 39. | 99926 | 3.4% | 1.0%(+2.39)#39 | 0.61%(+2.80)#4,321 |
| 40. | 99571 | 3.4% | 1.0%(+2.36)#40 | 0.61%(+2.77)#4,355 |
| 41. | 99739 | 3.3% | 1.0%(+2.31)#41 | 0.61%(+2.73)#4,414 |
| 42. | 99633 | 3.0% | 1.0%(+1.99)#42 | 0.61%(+2.41)#4,788 |
| 43. | 99650 | 2.9% | 1.0%(+1.84)#43 | 0.61%(+2.25)#5,013 |
| 44. | 99607 | 2.9% | 1.0%(+1.84)#44 | 0.61%(+2.25)#5,017 |
| 45. | 99649 | 2.9% | 1.0%(+1.84)#45 | 0.61%(+2.25)#5,024 |
| 46. | 99678 | 2.4% | 1.0%(+1.39)#46 | 0.61%(+1.80)#5,710 |
| 47. | 99663 | 2.3% | 1.0%(+1.29)#47 | 0.61%(+1.71)#5,897 |
| 48. | 99683 | 2.3% | 1.0%(+1.26)#48 | 0.61%(+1.68)#5,944 |
| 49. | 99820 | 2.2% | 1.0%(+1.22)#49 | 0.61%(+1.63)#6,046 |
| 50. | 99664 | 2.1% | 1.0%(+1.13)#50 | 0.61%(+1.54)#6,234 |
| 51. | 99712 | 2.1% | 1.0%(+1.05)#51 | 0.61%(+1.46)#6,382 |
| 52. | 99637 | 1.9% | 1.0%(+0.844)#52 | 0.61%(+1.26)#6,849 |
| 53. | 99688 | 1.8% | 1.0%(+0.772)#53 | 0.61%(+1.19)#7,051 |
| 54. | 99561 | 1.7% | 1.0%(+0.687)#54 | 0.61%(+1.10)#7,266 |
| 55. | 99901 | 1.7% | 1.0%(+0.657)#55 | 0.61%(+1.07)#7,351 |
| 56. | 99742 | 1.6% | 1.0%(+0.591)#56 | 0.61%(+1.01)#7,546 |
| 57. | 99801 | 1.6% | 1.0%(+0.562)#57 | 0.61%(+0.978)#7,640 |
| 58. | 99761 | 1.6% | 1.0%(+0.553)#58 | 0.61%(+0.969)#7,663 |
| 59. | 99737 | 1.6% | 1.0%(+0.549)#59 | 0.61%(+0.965)#7,680 |
| 60. | 99588 | 1.6% | 1.0%(+0.532)#60 | 0.61%(+0.949)#7,729 |
| 61. | 99676 | 1.4% | 1.0%(+0.393)#61 | 0.61%(+0.809)#8,162 |
| 62. | 99694 | 1.4% | 1.0%(+0.336)#62 | 0.61%(+0.753)#8,349 |
| 63. | 99672 | 1.3% | 1.0%(+0.282)#63 | 0.61%(+0.699)#8,559 |
| 64. | 99701 | 1.3% | 1.0%(+0.261)#64 | 0.61%(+0.678)#8,628 |
| 65. | 99581 | 1.3% | 1.0%(+0.255)#65 | 0.61%(+0.671)#8,657 |
| 66. | 99780 | 1.3% | 1.0%(+0.242)#66 | 0.61%(+0.658)#8,707 |
| 67. | 99741 | 1.2% | 1.0%(+0.169)#67 | 0.61%(+0.585)#8,965 |
| 68. | 99655 | 1.2% | 1.0%(+0.145)#68 | 0.61%(+0.562)#9,053 |
| 69. | 99573 | 1.1% | 1.0%(+0.114)#69 | 0.61%(+0.531)#9,171 |
| 70. | 99611 | 1.1% | 1.0%(+0.086)#70 | 0.61%(+0.502)#9,288 |
| 71. | 99504 | 0.95% | 1.0%(-0.070)#71 | 0.61%(+0.347)#9,965 |
| 72. | 99623 | 0.89% | 1.0%(-0.134)#72 | 0.61%(+0.283)#10,294 |
| 73. | 99669 | 0.88% | 1.0%(-0.137)#73 | 0.61%(+0.279)#10,309 |
| 74. | 99613 | 0.83% | 1.0%(-0.195)#74 | 0.61%(+0.221)#10,627 |
| 75. | 99760 | 0.80% | 1.0%(-0.219)#75 | 0.61%(+0.198)#10,761 |
| 76. | 99684 | 0.76% | 1.0%(-0.266)#76 | 0.61%(+0.150)#11,050 |
| 77. | 99660 | 0.75% | 1.0%(-0.270)#77 | 0.61%(+0.146)#11,069 |
| 78. | 99519 | 0.74% | 1.0%(-0.282)#78 | 0.61%(+0.134)#11,136 |
| 79. | 99518 | 0.71% | 1.0%(-0.312)#79 | 0.61%(+0.105)#11,312 |
| 80. | 99557 | 0.55% | 1.0%(-0.472)#80 | 0.61%(-0.056)#12,446 |
| 81. | 99645 | 0.53% | 1.0%(-0.490)#81 | 0.61%(-0.074)#12,587 |
| 82. | 99723 | 0.53% | 1.0%(-0.496)#82 | 0.61%(-0.080)#12,635 |
| 83. | 99515 | 0.50% | 1.0%(-0.526)#83 | 0.61%(-0.109)#12,874 |
| 84. | 99654 | 0.49% | 1.0%(-0.530)#84 | 0.61%(-0.113)#12,911 |
| 85. | 99559 | 0.46% | 1.0%(-0.562)#85 | 0.61%(-0.146)#13,210 |
| 86. | 99685 | 0.45% | 1.0%(-0.572)#86 | 0.61%(-0.155)#13,284 |
| 87. | 99752 | 0.44% | 1.0%(-0.584)#87 | 0.61%(-0.168)#13,410 |
| 88. | 99705 | 0.39% | 1.0%(-0.629)#88 | 0.61%(-0.212)#13,822 |
| 89. | 99567 | 0.33% | 1.0%(-0.697)#89 | 0.61%(-0.280)#14,525 |
| 90. | 99502 | 0.31% | 1.0%(-0.707)#90 | 0.61%(-0.291)#14,656 |
| 91. | 99503 | 0.28% | 1.0%(-0.738)#91 | 0.61%(-0.322)#15,024 |
| 92. | 99840 | 0.26% | 1.0%(-0.765)#92 | 0.61%(-0.348)#15,313 |
| 93. | 99508 | 0.26% | 1.0%(-0.767)#93 | 0.61%(-0.350)#15,344 |
| 94. | 99516 | 0.17% | 1.0%(-0.854)#94 | 0.61%(-0.437)#16,606 |
| 95. | 99517 | 0.13% | 1.0%(-0.890)#95 | 0.61%(-0.474)#17,250 |
| 96. | 99577 | 0.096% | 1.0%(-0.926)#96 | 0.61%(-0.510)#17,836 |
| 97. | 99709 | 0.050% | 1.0%(-0.972)#97 | 0.61%(-0.556)#18,666 |
| 98. | 99507 | 0.031% | 1.0%(-0.991)#98 | 0.61%(-0.574)#18,950 |
| 99. | 99501 | 0.012% | 1.0%(-1.01)#99 | 0.61%(-0.593)#19,141 |
Common Questions
What are the Top 10 Zip Codes with the Highest Percentage of Population Employed in Farming, Fishing & Forestry in Alaska?
Top 10 Zip Codes with the Highest Percentage of Population Employed in Farming, Fishing & Forestry in Alaska are:
What zip code has the Highest Percentage of Population Employed in Farming, Fishing & Forestry in Alaska?
99636 has the Highest Percentage of Population Employed in Farming, Fishing & Forestry in Alaska with 24.6%.
What is the Percentage of Population Employed in Farming, Fishing & Forestry in the State of Alaska?
Percentage of Population Employed in Farming, Fishing & Forestry in Alaska is 1.0%.
What is the Percentage of Population Employed in Farming, Fishing & Forestry in the United States?
Percentage of Population Employed in Farming, Fishing & Forestry in the United States is 0.61%.