Zip Codes with the Highest Percentage of Population Employed in Food Preparation & Serving in Jber, AK
RELATED REPORTS & OPTIONS
Food Preparation & Serving
Jber
Compare Zip Codes
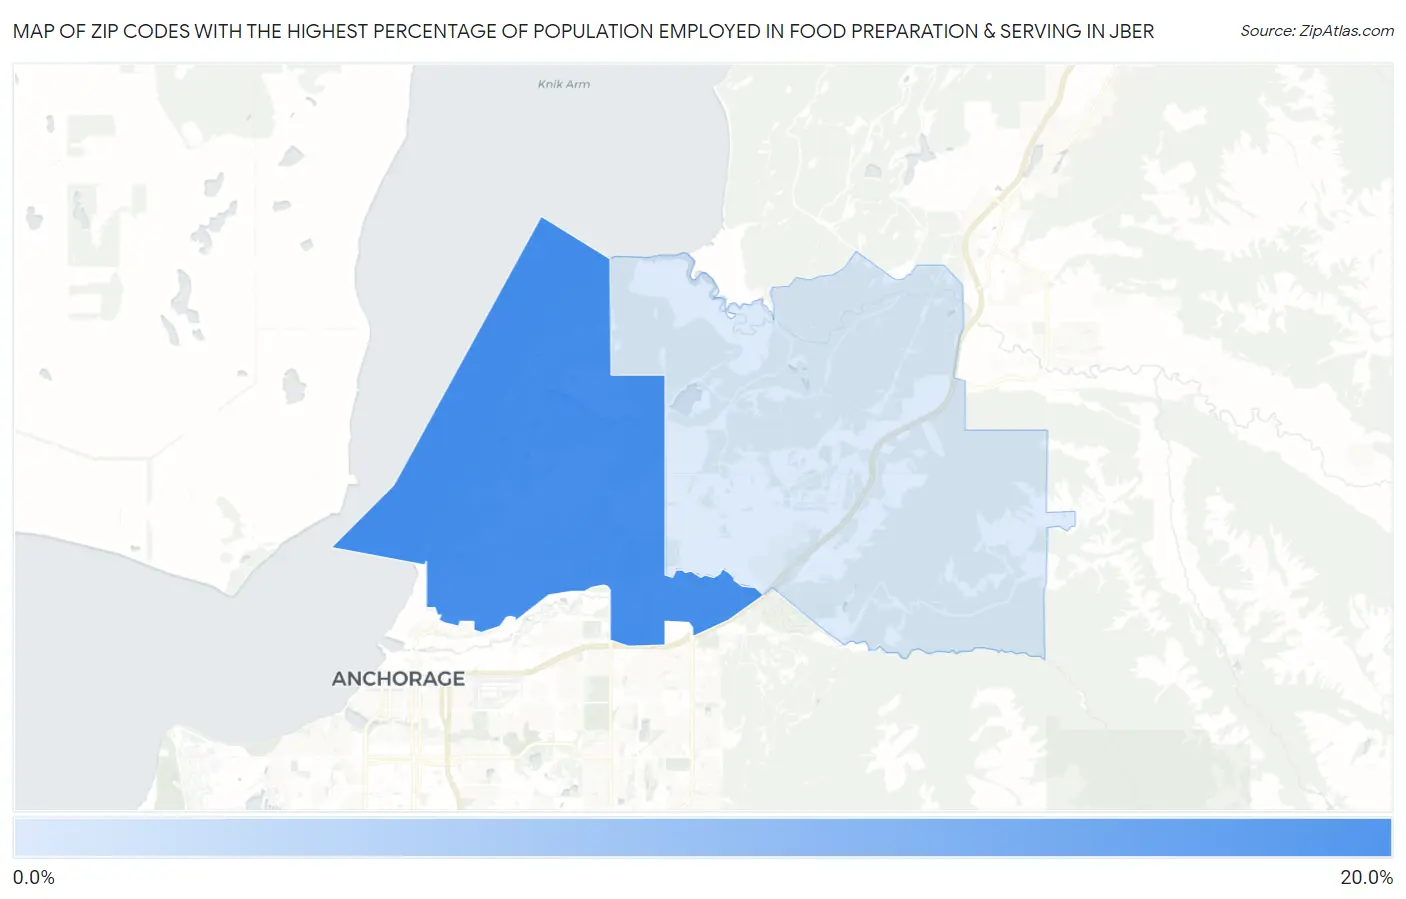
Map of Zip Codes with the Highest Percentage of Population Employed in Food Preparation & Serving in Jber
3.2%
19.0%
Zip Codes with the Highest Percentage of Population Employed in Food Preparation & Serving in Jber, AK
| Zip Code | % Employed | vs State | vs National | |
| 1. | 99506 | 19.0% | 5.1%(+13.9)#4 | 5.3%(+13.7)#564 |
| 2. | 99505 | 3.2% | 5.1%(-1.93)#97 | 5.3%(-2.07)#20,410 |
1
Common Questions
What are the Top Zip Codes with the Highest Percentage of Population Employed in Food Preparation & Serving in Jber, AK?
Top Zip Codes with the Highest Percentage of Population Employed in Food Preparation & Serving in Jber, AK are:
What zip code has the Highest Percentage of Population Employed in Food Preparation & Serving in Jber, AK?
99506 has the Highest Percentage of Population Employed in Food Preparation & Serving in Jber, AK with 19.0%.
What is the Percentage of Population Employed in Food Preparation & Serving in Alaska?
Percentage of Population Employed in Food Preparation & Serving in Alaska is 5.1%.
What is the Percentage of Population Employed in Food Preparation & Serving in the United States?
Percentage of Population Employed in Food Preparation & Serving in the United States is 5.3%.