Zip Codes with the Highest Percentage of Population Taking Public Transit to Work in Charleston, WV
RELATED REPORTS & OPTIONS
Public Transit
Charleston
Compare Zip Codes
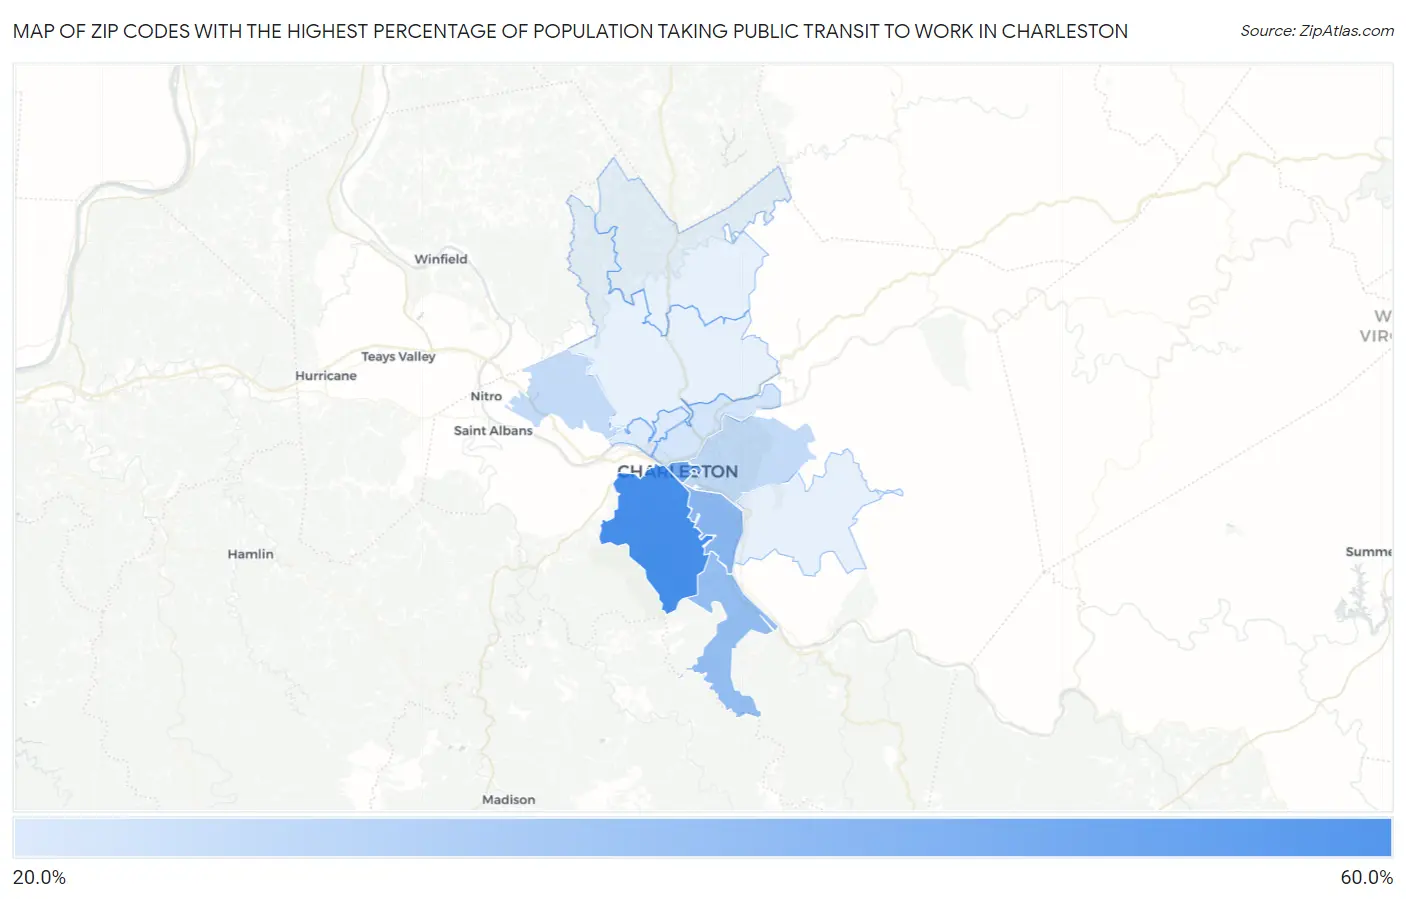
Map of Zip Codes with the Highest Percentage of Population Taking Public Transit to Work in Charleston
0.0%
60.0%
Zip Codes with the Highest Percentage of Population Taking Public Transit to Work in Charleston, WV
| Zip Code | % Public Transit | vs State | vs National | |
| 1. | 25314 | 53.1% | 36.2%(+16.9)#6 | 38.5%(+14.6)#1,058 |
| 2. | 25301 | 43.4% | 36.2%(+7.20)#13 | 38.5%(+4.90)#3,170 |
| 3. | 25304 | 38.6% | 36.2%(+2.40)#17 | 38.5%(+0.100)#4,657 |
| 4. | 25315 | 36.0% | 36.2%(-0.200)#20 | 38.5%(-2.50)#5,402 |
| 5. | 25311 | 27.7% | 36.2%(-8.50)#24 | 38.5%(-10.8)#7,253 |
| 6. | 25313 | 27.6% | 36.2%(-8.60)#26 | 38.5%(-10.9)#7,264 |
| 7. | 25302 | 24.6% | 36.2%(-11.6)#28 | 38.5%(-13.9)#7,640 |
| 8. | 25387 | 23.0% | 36.2%(-13.2)#30 | 38.5%(-15.5)#7,801 |
1
Common Questions
What are the Top 10 Zip Codes with the Highest Percentage of Population Taking Public Transit to Work in Charleston, WV?
Top 10 Zip Codes with the Highest Percentage of Population Taking Public Transit to Work in Charleston, WV are:
What zip code has the Highest Percentage of Population Taking Public Transit to Work in Charleston, WV?
25314 has the Highest Percentage of Population Taking Public Transit to Work in Charleston, WV with 53.1%.
What is the Percentage of Population Taking Public Transit to Work in Charleston, WV?
Percentage of Population Taking Public Transit to Work in Charleston is 27.9%.
What is the Percentage of Population Taking Public Transit to Work in West Virginia?
Percentage of Population Taking Public Transit to Work in West Virginia is 36.2%.
What is the Percentage of Population Taking Public Transit to Work in the United States?
Percentage of Population Taking Public Transit to Work in the United States is 38.5%.