Zip Codes with the Highest Percentage of Population Employed in Agriculture, Fishing & Hunting in Everett, WA
RELATED REPORTS & OPTIONS
Agriculture, Fishing & Hunting
Everett
Compare Zip Codes
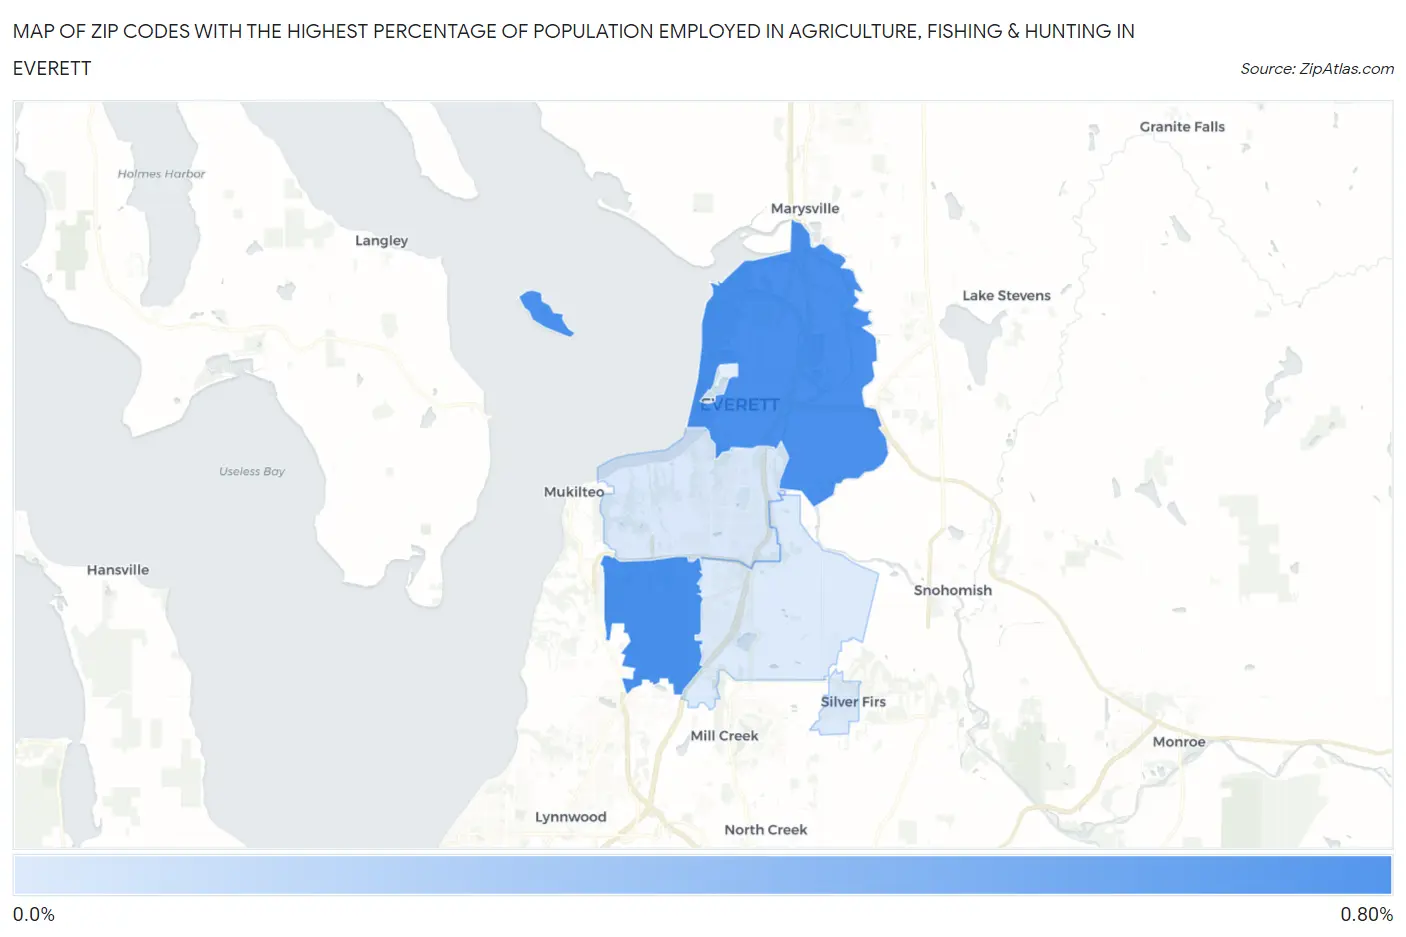
Map of Zip Codes with the Highest Percentage of Population Employed in Agriculture, Fishing & Hunting in Everett
0.0%
0.80%
Zip Codes with the Highest Percentage of Population Employed in Agriculture, Fishing & Hunting in Everett, WA
| Zip Code | % Employed | vs State | vs National | |
| 1. | 98204 | 0.73% | 2.4%(-1.66)#375 | 1.2%(-0.472)#17,688 |
| 2. | 98201 | 0.72% | 2.4%(-1.68)#376 | 1.2%(-0.484)#17,763 |
| 3. | 98203 | 0.13% | 2.4%(-2.26)#493 | 1.2%(-1.07)#23,305 |
| 4. | 98208 | 0.12% | 2.4%(-2.27)#495 | 1.2%(-1.08)#23,398 |
1
Common Questions
What are the Top 3 Zip Codes with the Highest Percentage of Population Employed in Agriculture, Fishing & Hunting in Everett, WA?
Top 3 Zip Codes with the Highest Percentage of Population Employed in Agriculture, Fishing & Hunting in Everett, WA are:
What zip code has the Highest Percentage of Population Employed in Agriculture, Fishing & Hunting in Everett, WA?
98204 has the Highest Percentage of Population Employed in Agriculture, Fishing & Hunting in Everett, WA with 0.73%.
What is the Percentage of Population Employed in Agriculture, Fishing & Hunting in Everett, WA?
Percentage of Population Employed in Agriculture, Fishing & Hunting in Everett is 0.34%.
What is the Percentage of Population Employed in Agriculture, Fishing & Hunting in Washington?
Percentage of Population Employed in Agriculture, Fishing & Hunting in Washington is 2.4%.
What is the Percentage of Population Employed in Agriculture, Fishing & Hunting in the United States?
Percentage of Population Employed in Agriculture, Fishing & Hunting in the United States is 1.2%.