Zip Codes with the Highest Percentage of Population Employed in Professional & Scientific Services in Bellingham, WA
RELATED REPORTS & OPTIONS
Professional & Scientific Services
Bellingham
Compare Zip Codes
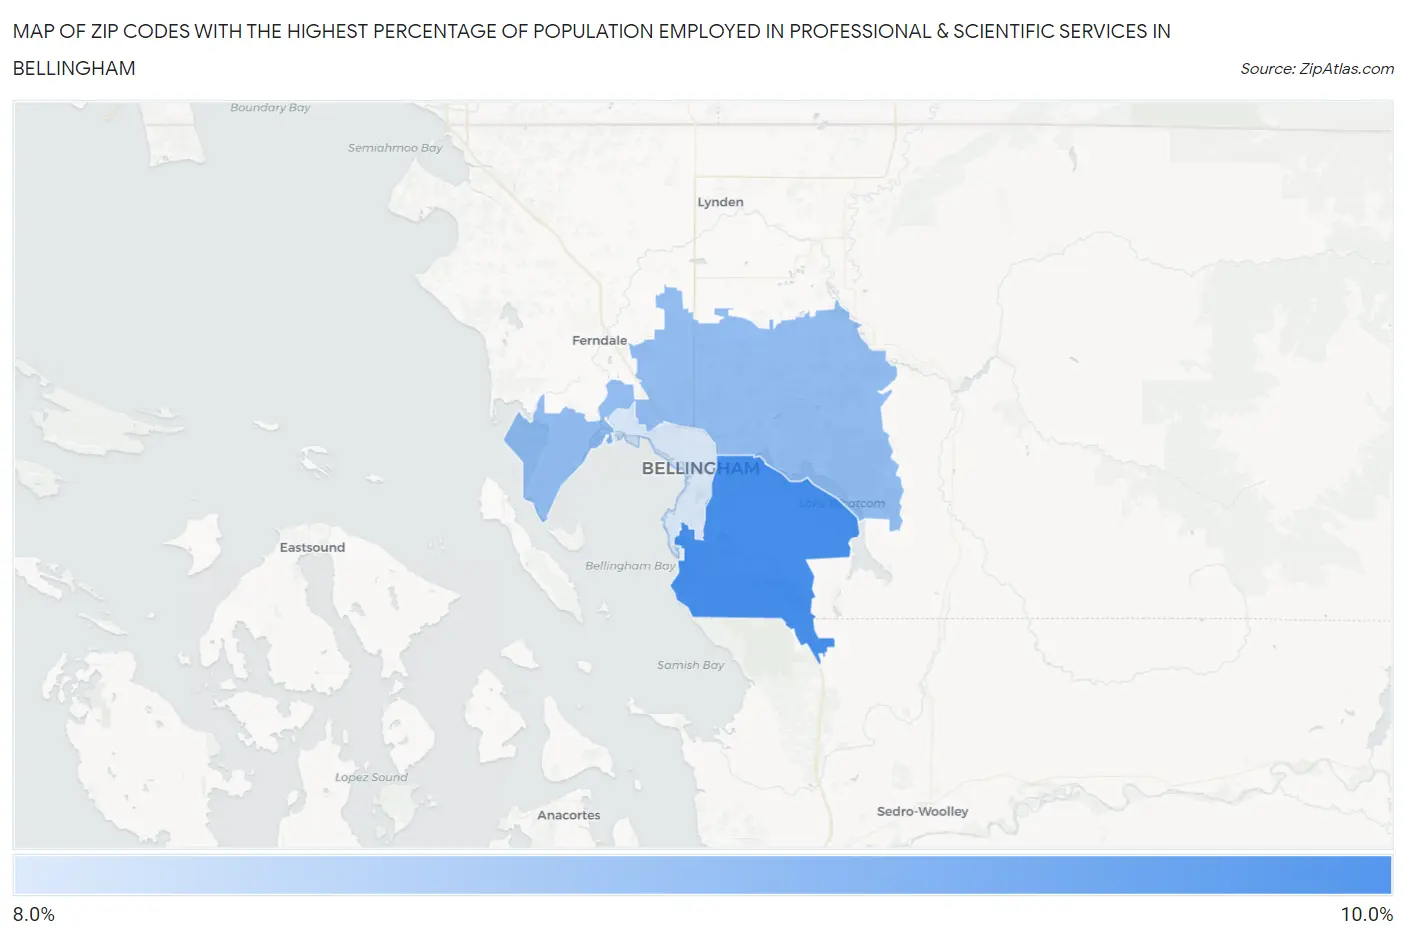
Map of Zip Codes with the Highest Percentage of Population Employed in Professional & Scientific Services in Bellingham
0.0%
10.0%
Zip Codes with the Highest Percentage of Population Employed in Professional & Scientific Services in Bellingham, WA
| Zip Code | % Employed | vs State | vs National | |
| 1. | 98229 | 9.7% | 10.3%(-0.588)#116 | 7.8%(+1.90)#4,799 |
| 2. | 98226 | 9.0% | 10.3%(-1.36)#134 | 7.8%(+1.12)#5,564 |
| 3. | 98225 | 8.3% | 10.3%(-2.06)#156 | 7.8%(+0.423)#6,317 |
1
Common Questions
What are the Top Zip Codes with the Highest Percentage of Population Employed in Professional & Scientific Services in Bellingham, WA?
Top Zip Codes with the Highest Percentage of Population Employed in Professional & Scientific Services in Bellingham, WA are:
What zip code has the Highest Percentage of Population Employed in Professional & Scientific Services in Bellingham, WA?
98229 has the Highest Percentage of Population Employed in Professional & Scientific Services in Bellingham, WA with 9.7%.
What is the Percentage of Population Employed in Professional & Scientific Services in Bellingham, WA?
Percentage of Population Employed in Professional & Scientific Services in Bellingham is 8.9%.
What is the Percentage of Population Employed in Professional & Scientific Services in Washington?
Percentage of Population Employed in Professional & Scientific Services in Washington is 10.3%.
What is the Percentage of Population Employed in Professional & Scientific Services in the United States?
Percentage of Population Employed in Professional & Scientific Services in the United States is 7.8%.