Zip Codes with the Highest Percentage of Population Employed in Professional & Scientific Services in Fredericksburg, VA

RELATED REPORTS & OPTIONS

Professional & Scientific Services
Population
Families and Households
Female Fertility
Female Fertility (Unmarried)
Race (Community Size)
Race (Percentage)
Ancestry (Community Size)
AfghanAfricanAmericanArabArgentineanArmenianAustrianBarbadianBelgianBhutaneseBlackfeetBolivianBrazilianBritishBritish West IndianBurmeseCambodianCanadianCape VerdeanCelticCentral AmericanCentral American IndianCherokeeChileanChippewaChoctawColombianComancheCosta RicanCroatianCubanCzechCzechoslovakianDanishDominicanDutchEastern EuropeanEcuadorianEgyptianEnglishEthiopianEuropeanFilipinoFinnishFrenchFrench CanadianGermanGhanaianGreekGuatemalanHaitianHonduranHungarianIndian (Asian)IranianIrishIroquoisItalianJamaicanKoreanLaotianLatvianLebaneseLiberianLithuanianMalaysianMexicanMexican American IndianNative HawaiianNicaraguanNigerianNorthern EuropeanNorwegianPakistaniPalestinianPanamanianPennsylvania GermanPeruvianPolishPortuguesePotawatomiPuerto RicanRomanianRussianSalvadoranSamoanScandinavianScotch-IrishScottishSerbianSiouxSlavicSlovakSloveneSouth AmericanSpaniardSpanishSri LankanSubsaharan AfricanSudaneseSwedishSwissSyrianThaiTrinidadian and TobagonianTurkishUkrainianVenezuelanWelshWest IndianYugoslavian
Ancestry (Percentage)
AfghanAfricanAmericanArabArgentineanArmenianAustrianBarbadianBelgianBhutaneseBlackfeetBolivianBrazilianBritishBritish West IndianBurmeseCambodianCanadianCape VerdeanCelticCentral AmericanCentral American IndianCherokeeChileanChippewaChoctawColombianComancheCosta RicanCroatianCubanCzechCzechoslovakianDanishDominicanDutchEastern EuropeanEcuadorianEgyptianEnglishEthiopianEuropeanFilipinoFinnishFrenchFrench CanadianGermanGhanaianGreekGuatemalanHaitianHonduranHungarianIndian (Asian)IranianIrishIroquoisItalianJamaicanKoreanLaotianLatvianLebaneseLiberianLithuanianMalaysianMexicanMexican American IndianNative HawaiianNicaraguanNigerianNorthern EuropeanNorwegianPakistaniPalestinianPanamanianPennsylvania GermanPeruvianPolishPortuguesePotawatomiPuerto RicanRomanianRussianSalvadoranSamoanScandinavianScotch-IrishScottishSerbianSiouxSlavicSlovakSloveneSouth AmericanSpaniardSpanishSri LankanSubsaharan AfricanSudaneseSwedishSwissSyrianThaiTrinidadian and TobagonianTurkishUkrainianVenezuelanWelshWest IndianYugoslavian
Immigrant Origin (Total)
Immigrant Origin (Percentage)
Income
Income (Families)
Income (Households)
Poverty
Poverty (Families)
Unemployment
Employment Occupations
Employment Industries
Employer Class
Commute Time
Commute Means
School Enrollment
Education by Degree Field
Occupancy
Finances
Physical Characteristics
Fredericksburg
Compare Zip Codes
Comparison Subject

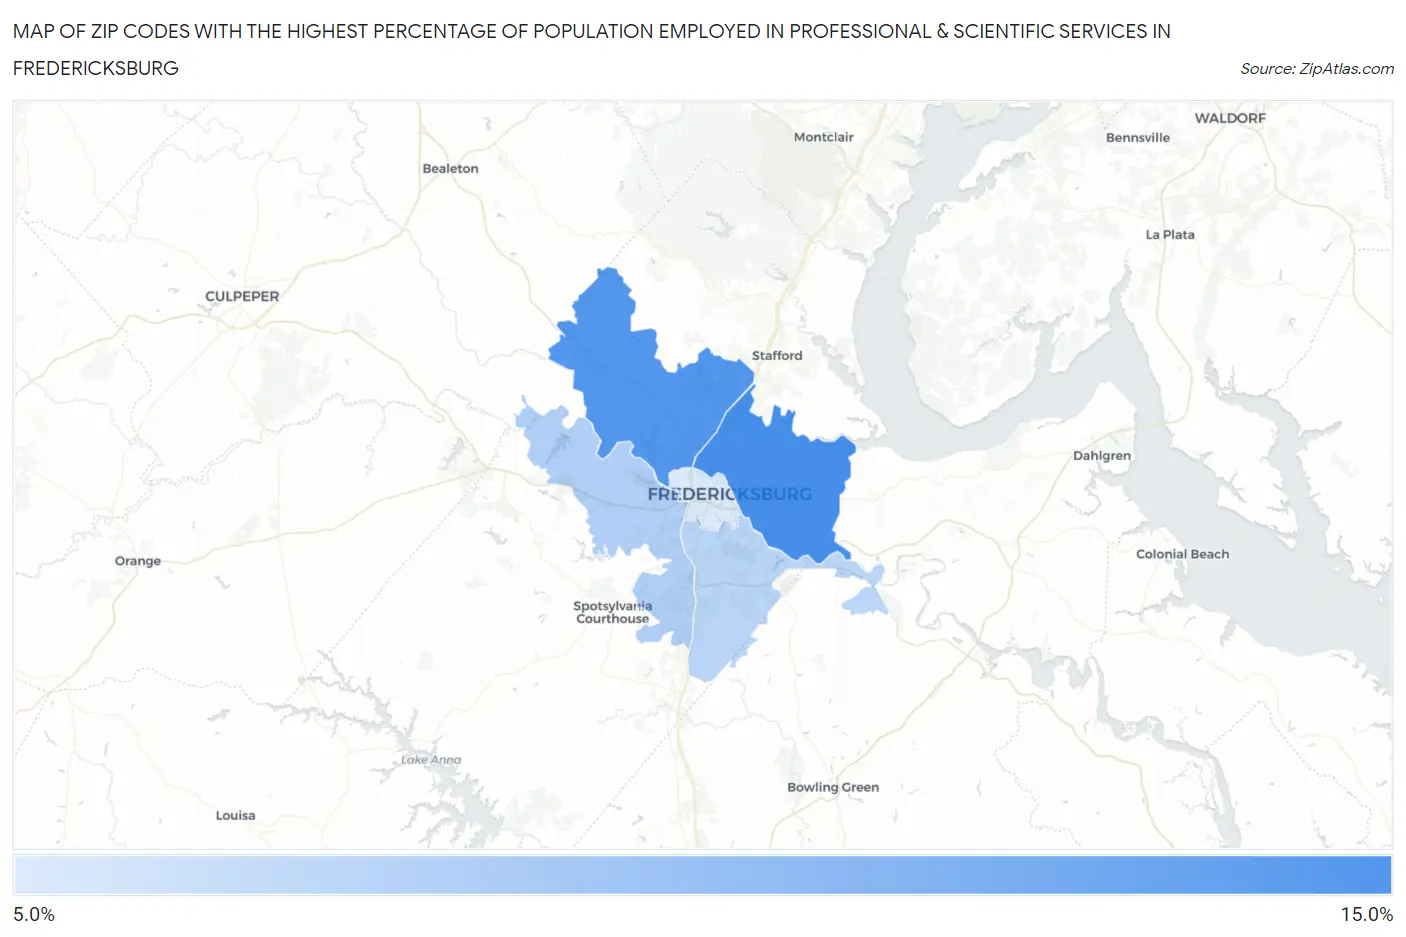
Map of Zip Codes with the Highest Percentage of Population Employed in Professional & Scientific Services in Fredericksburg

0.0%
15.0%
Zip Codes with the Highest Percentage of Population Employed in Professional & Scientific Services in Fredericksburg Map

Zip Codes with the Highest Percentage of Population Employed in Professional & Scientific Services in Fredericksburg, VA

Zip Code % Employed vs State vs National
1.2240513.4%12.2%(+1.17)#1387.8%(+5.52)#2,555
2.2240613.1%12.2%(+0.870)#1417.8%(+5.22)#2,685
3.2240710.9%12.2%(-1.31)#2017.8%(+3.04)#3,929
4.2240810.7%12.2%(-1.54)#2067.8%(+2.81)#4,063
5.224019.8%12.2%(-2.35)#2227.8%(+2.00)#4,704

Common Questions

What are the Top 3 Zip Codes with the Highest Percentage of Population Employed in Professional & Scientific Services in Fredericksburg, VA?
Top 3 Zip Codes with the Highest Percentage of Population Employed in Professional & Scientific Services in Fredericksburg, VA are:
#1
13.4%
#2
13.1%
#3
10.9%
What zip code has the Highest Percentage of Population Employed in Professional & Scientific Services in Fredericksburg, VA?
22405 has the Highest Percentage of Population Employed in Professional & Scientific Services in Fredericksburg, VA with 13.4%.
What is the Percentage of Population Employed in Professional & Scientific Services in Fredericksburg, VA?
Percentage of Population Employed in Professional & Scientific Services in Fredericksburg is 9.9%.
What is the Percentage of Population Employed in Professional & Scientific Services in Virginia?
Percentage of Population Employed in Professional & Scientific Services in Virginia is 12.2%.
What is the Percentage of Population Employed in Professional & Scientific Services in the United States?
Percentage of Population Employed in Professional & Scientific Services in the United States is 7.8%.