Zip Codes with the Highest Percentage of Population Employed in Sales & Related in Magnolia, TX
RELATED REPORTS & OPTIONS
Sales & Related
Magnolia
Compare Zip Codes
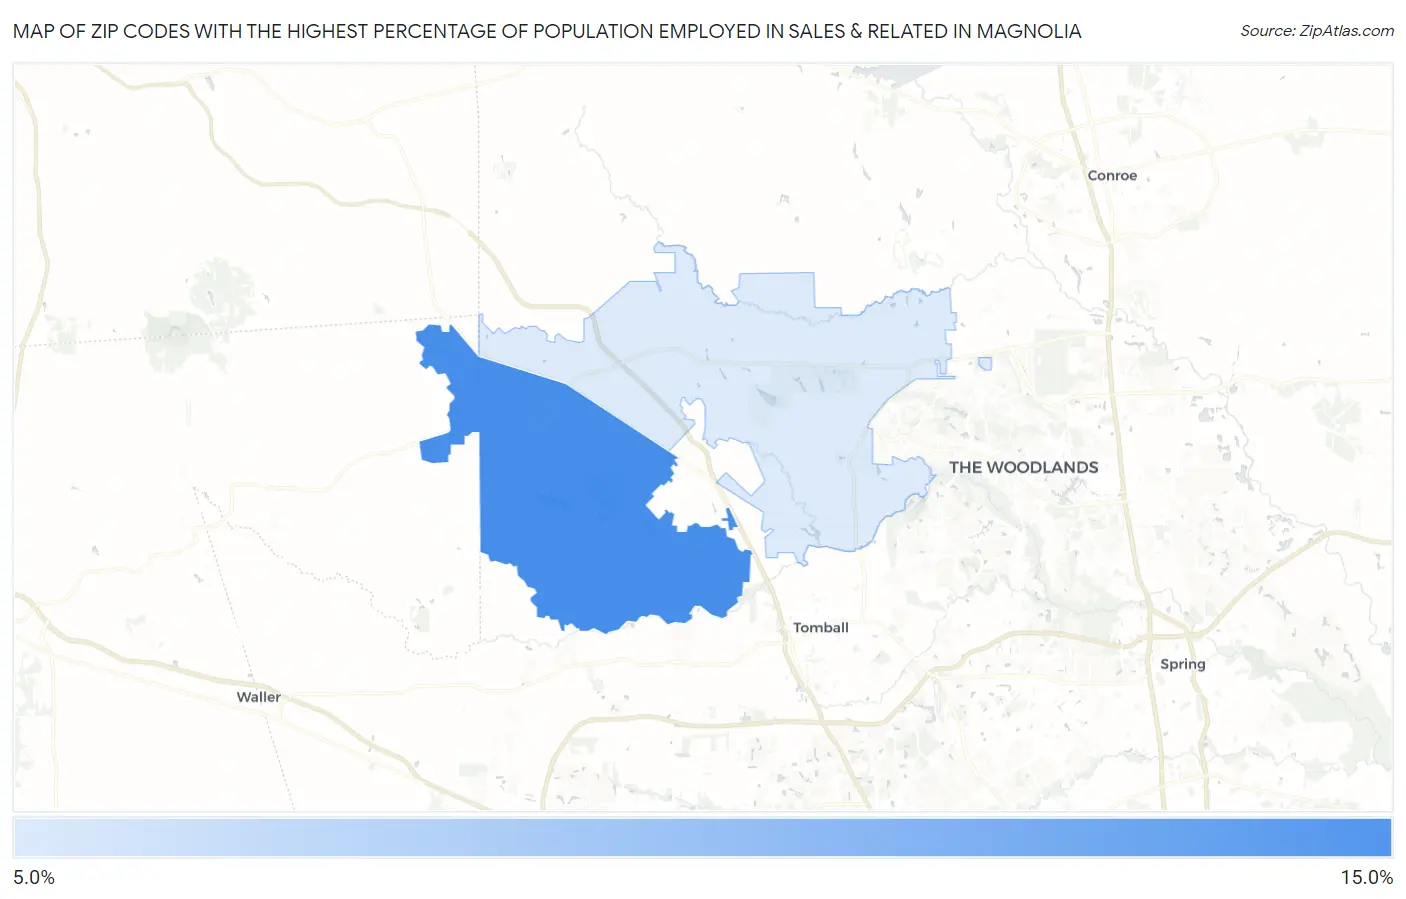
Map of Zip Codes with the Highest Percentage of Population Employed in Sales & Related in Magnolia
0.0%
15.0%
Zip Codes with the Highest Percentage of Population Employed in Sales & Related in Magnolia, TX
| Zip Code | % Employed | vs State | vs National | |
| 1. | 77355 | 11.1% | 10.2%(+0.867)#579 | 9.6%(+1.50)#7,977 |
| 2. | 77354 | 9.6% | 10.2%(-0.607)#894 | 9.6%(+0.022)#12,327 |
1
Common Questions
What are the Top Zip Codes with the Highest Percentage of Population Employed in Sales & Related in Magnolia, TX?
Top Zip Codes with the Highest Percentage of Population Employed in Sales & Related in Magnolia, TX are:
What zip code has the Highest Percentage of Population Employed in Sales & Related in Magnolia, TX?
77355 has the Highest Percentage of Population Employed in Sales & Related in Magnolia, TX with 11.1%.
What is the Percentage of Population Employed in Sales & Related in Magnolia, TX?
Percentage of Population Employed in Sales & Related in Magnolia is 16.7%.
What is the Percentage of Population Employed in Sales & Related in Texas?
Percentage of Population Employed in Sales & Related in Texas is 10.2%.
What is the Percentage of Population Employed in Sales & Related in the United States?
Percentage of Population Employed in Sales & Related in the United States is 9.6%.