Zip Codes with the Highest Percentage of Households Heated by Electricity in Bartlesville, OK
RELATED REPORTS & OPTIONS
Electrical Heating
Bartlesville
Compare Zip Codes
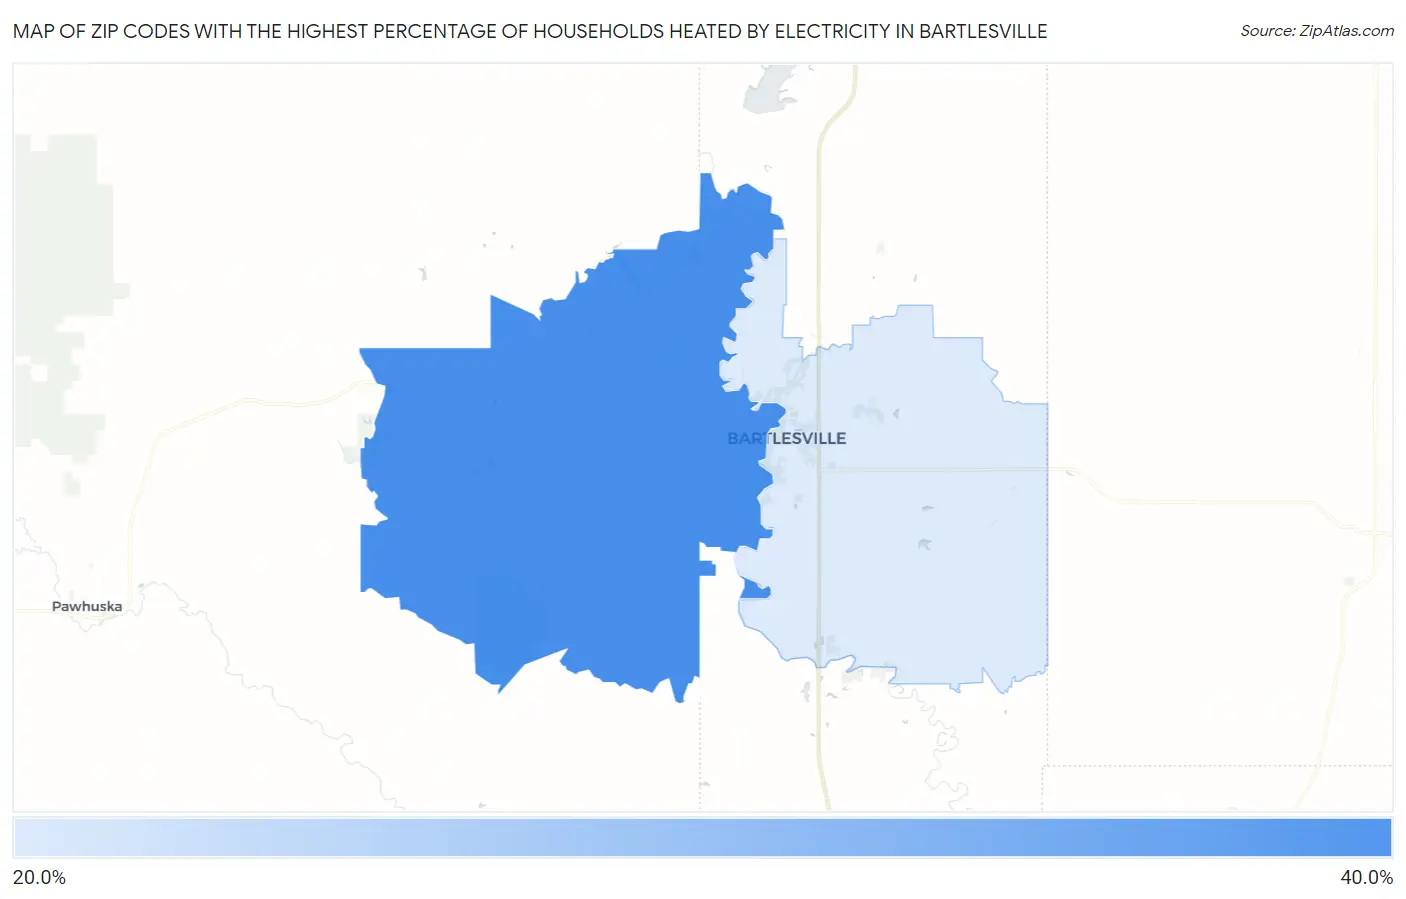
Map of Zip Codes with the Highest Percentage of Households Heated by Electricity in Bartlesville
0.0%
40.0%
Zip Codes with the Highest Percentage of Households Heated by Electricity in Bartlesville, OK
| Zip Code | Electrical Heating | vs State | vs National | |
| 1. | 74003 | 31.6% | 40.5%(-8.90)#494 | 40.2%(-8.60)#15,373 |
| 2. | 74006 | 22.9% | 40.5%(-17.6)#585 | 40.2%(-17.3)#19,020 |
1
Common Questions
What are the Top Zip Codes with the Highest Percentage of Households Heated by Electricity in Bartlesville, OK?
Top Zip Codes with the Highest Percentage of Households Heated by Electricity in Bartlesville, OK are:
What zip code has the Highest Percentage of Households Heated by Electricity in Bartlesville, OK?
74003 has the Highest Percentage of Households Heated by Electricity in Bartlesville, OK with 31.6%.
What is the Percentage of Households Heated by Electricity in Bartlesville, OK?
Percentage of Households Heated by Electricity in Bartlesville is 24.3%.
What is the Percentage of Households Heated by Electricity in Oklahoma?
Percentage of Households Heated by Electricity in Oklahoma is 40.5%.
What is the Percentage of Households Heated by Electricity in the United States?
Percentage of Households Heated by Electricity in the United States is 40.2%.