Zip Codes with the Highest Percentage of Households Heated by Bottled Gas / Liquid Propane in Bartlesville, OK
RELATED REPORTS & OPTIONS
Bottled Gas / LP Heating
Bartlesville
Compare Zip Codes
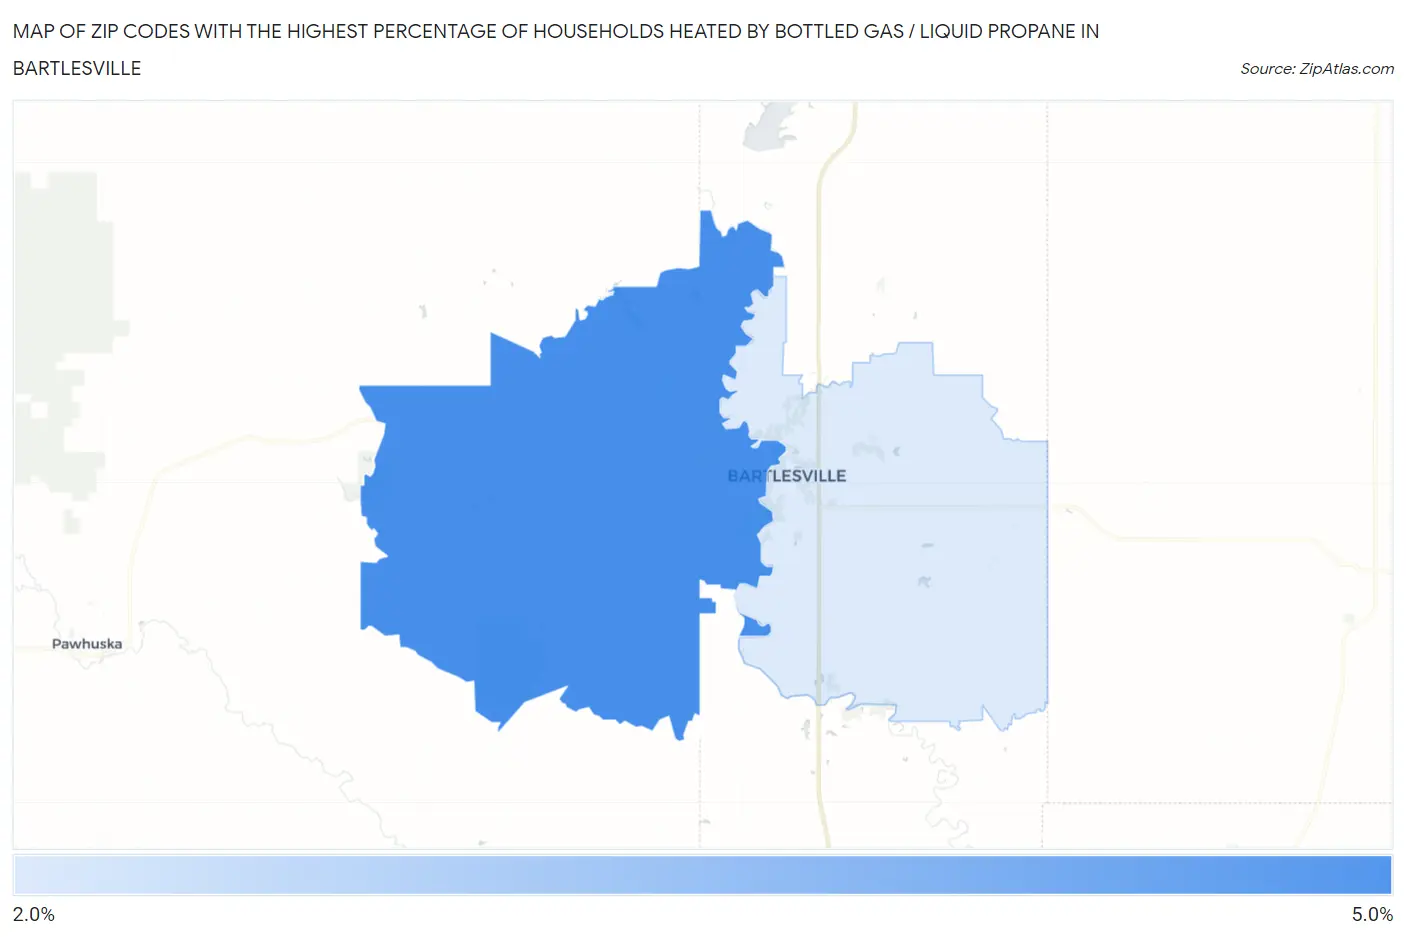
Map of Zip Codes with the Highest Percentage of Households Heated by Bottled Gas / Liquid Propane in Bartlesville
0.0%
5.0%
Zip Codes with the Highest Percentage of Households Heated by Bottled Gas / Liquid Propane in Bartlesville, OK
| Zip Code | Bottled Gas / LP Heating | vs State | vs National | |
| 1. | 74003 | 4.7% | 6.3%(-1.60)#481 | 4.9%(-0.200)#18,862 |
| 2. | 74006 | 2.4% | 6.3%(-3.90)#538 | 4.9%(-2.50)#22,168 |
1
Common Questions
What are the Top Zip Codes with the Highest Percentage of Households Heated by Bottled Gas / Liquid Propane in Bartlesville, OK?
Top Zip Codes with the Highest Percentage of Households Heated by Bottled Gas / Liquid Propane in Bartlesville, OK are:
What zip code has the Highest Percentage of Households Heated by Bottled Gas / Liquid Propane in Bartlesville, OK?
74003 has the Highest Percentage of Households Heated by Bottled Gas / Liquid Propane in Bartlesville, OK with 4.7%.
What is the Percentage of Households Heated by Bottled Gas / Liquid Propane in Bartlesville, OK?
Percentage of Households Heated by Bottled Gas / Liquid Propane in Bartlesville is 1.9%.
What is the Percentage of Households Heated by Bottled Gas / Liquid Propane in Oklahoma?
Percentage of Households Heated by Bottled Gas / Liquid Propane in Oklahoma is 6.3%.
What is the Percentage of Households Heated by Bottled Gas / Liquid Propane in the United States?
Percentage of Households Heated by Bottled Gas / Liquid Propane in the United States is 4.9%.